Sample Category Title
Diplomacy or Return to Conflict? Hormuz Closes Again, Oil Signals Path Into Ceasefire Cliff
The market narrative has flipped again—and the stakes are rising. The abrupt shift in the Strait of Hormuz—from briefly “open” to once again under strict military control within 24 hours—has underscored just how fragile the current ceasefire is. What initially looked like the beginning of de-escalation has quickly reverted to uncertainty, forcing investors to reassess whether the “peace trade” was premature, just as a critical deadline approaches.
After Iranian officials initially declared the Strait fully open for commercial shipping, the situation reversed sharply. Military control has been reimposed, and reports of direct confrontation—including incidents involving commercial vessels—have effectively ended any near-term assumption of safe passage.
At the core of the standoff is a breakdown in trust between Washington and Tehran. The U.S. has maintained its naval blockade on Iranian ports, insisting it will remain in place until a broader agreement is reached. Iran, in turn, has framed the blockade as a violation of ceasefire conditions and responded by tightening control over the Strait, linking any reopening to the restoration of “complete freedom of navigation.”
This dynamic has created a precondition deadlock that complicates the prospects for upcoming talks. While reports suggest another round of negotiations could take place on Monday, there is still no formal confirmation. Even if talks proceed, they are likely to unfold under significant tension, with both sides entering from hardened positions.
The broader risk is that time is running out. If no progress is made before the ceasefire expires on April 22, the probability of renewed hostilities rises sharply. That could include a return to direct military confrontation or escalation at strategic chokepoints like Hormuz.
For markets, this makes the coming days critical—not just for geopolitics, but for the direction of oil, inflation expectations, and global risk sentiment.
In this environment, oil remains the ultimate signal. Its ability—or failure—to break decisively lower will determine whether markets continue to lean toward diplomacy or begin to price in a return to conflict. With the ceasefire cliff approaching, that signal will become increasingly important. At the same time, key technical levels across major assets will help guide traders in assessing whether underlying market sentiment is truly shifting, or simply reacting to headline volatility.
Oil: Still the Ultimate Signal for Global Sentiment
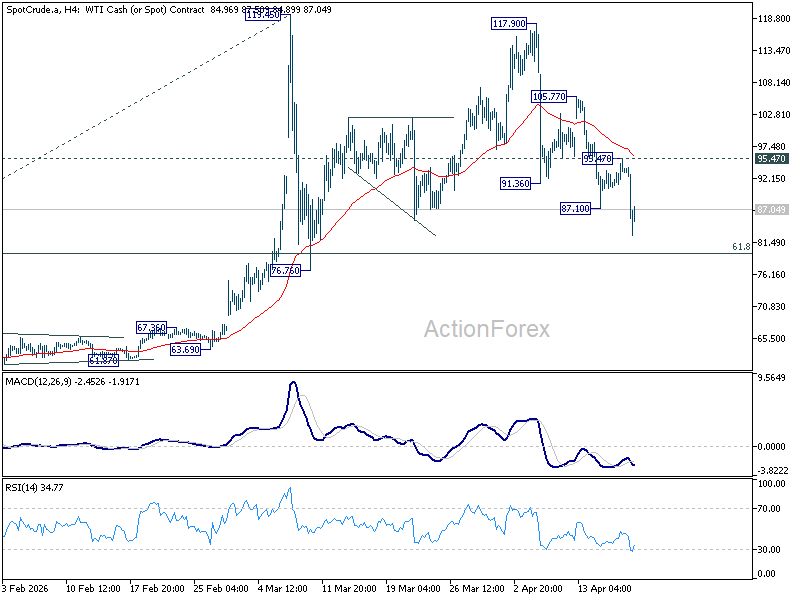
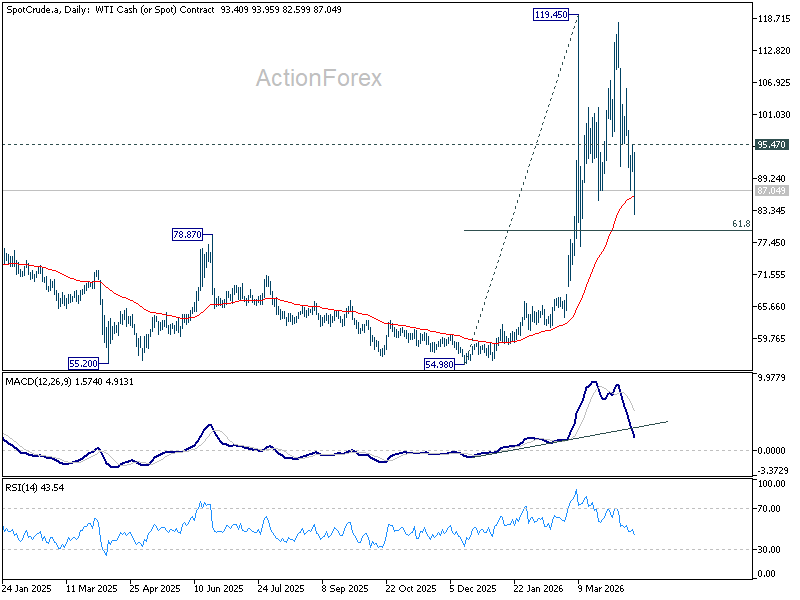
Oil remains the most important driver of global market sentiment. WTI’s decline from 117.90 resumed last week, extending sharply lower to as low as 82.59. While further downside is favored in the near term, a decisive break of the 61.8% retracement of 54.98 to 119.45 at 79.60 would likely require a more durable de-escalation in the Middle East—potentially including a confirmed and sustained normalization of the Strait of Hormuz. Absent that, the psychological 80 level should act as a near-term floor.
Meanwhile, as long as 95.47 resistance holds, the bias remains to the downside. In other words, while volatility may persist, there is no clear signal of a renewed US-Iran escalation as long as this cap remains intact.
Equities: New Records as Uptrend Reumes
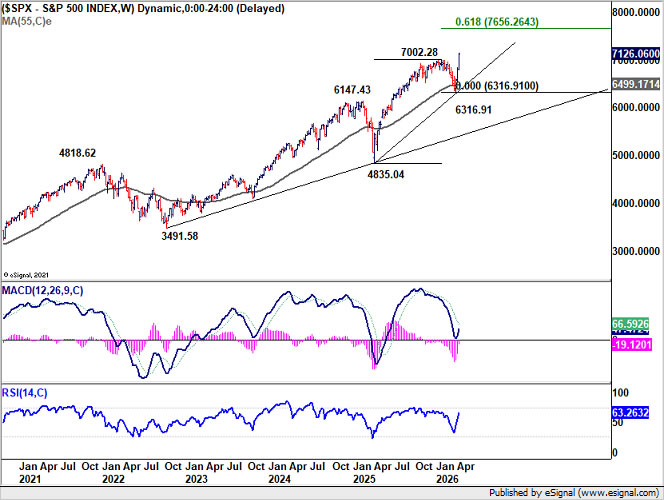
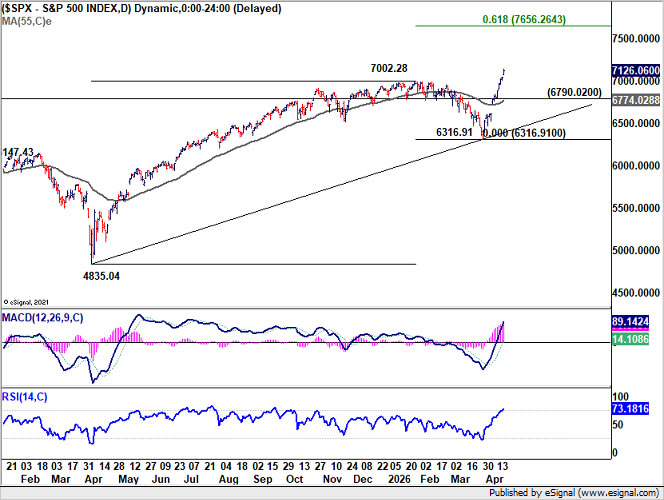
S&P 500 resumed its uptrend last week, breaking above 7,002.28 resistance and closing at a fresh record high of 7,126.06. While near-term volatility or a pullback cannot be ruled out given geopolitical uncertainty, the outlook remains bullish as long as 6,790.02 support holds. The current advance continues to target 61.8% projection of 4,835.04 to 7,002.28 from 6,316.91 at 7,656.26.
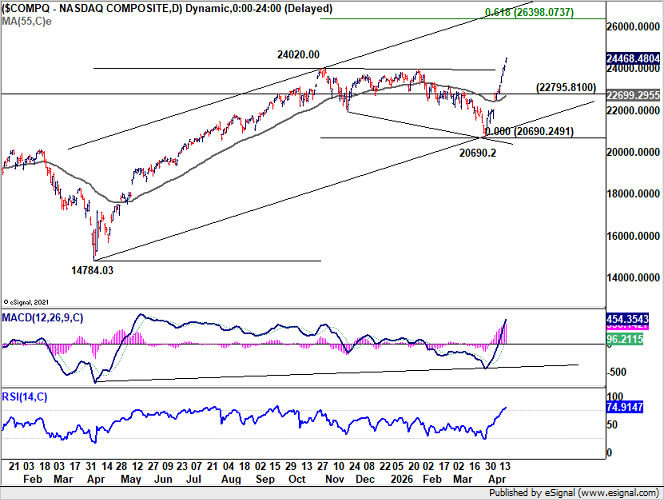
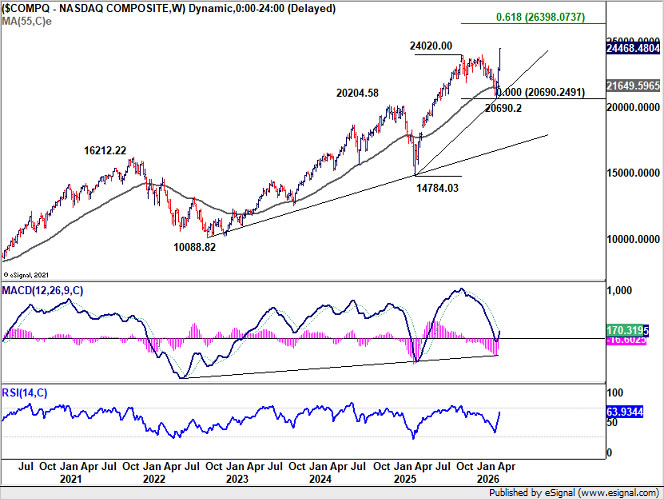
NASDAQ shows a similar structure, ending the week at a new record of 24,468.48. Near-term outlook remains bullish as long as 22,795.81 support holds, even in the event of a retreat. The broader uptrend targets 61.8% projection of 14,784.03 to 24,020.00 from 20,690.2 at 26,398.07 next.
Yields: At Key Support, Rebound or Breakdown Ahead
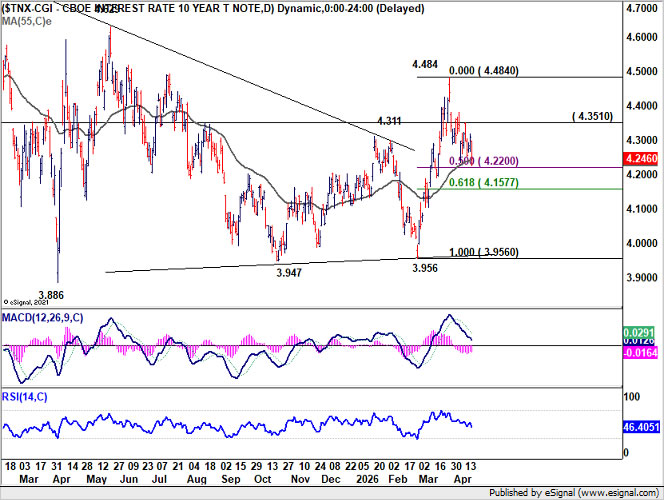
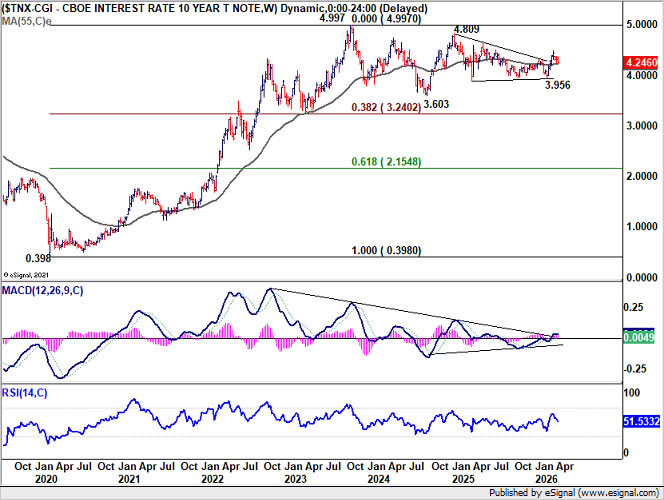
US 10-year yield’s pullback from the 4.484 short-term top remains corrective so far, suggesting that the rise from 3.956 is not yet complete. Yields are now testing a key support cluster, including 55 D EMA (now at 4.240), 50% retracement of 3.956 to 4.484 at 4.220, and 55 W EMA (now at 4.219).
A strong rebound from this zone, followed by a break above 4.351 resistance, would signal that the rise from 3.956 is ready to resume through 4.484 high. On the downside, firm break below 4.220 would open the way for a deeper pullback toward 61.8% retracement at 4.157 and below.
Dollar Index: Bearish Bias Intact Below Key EMA
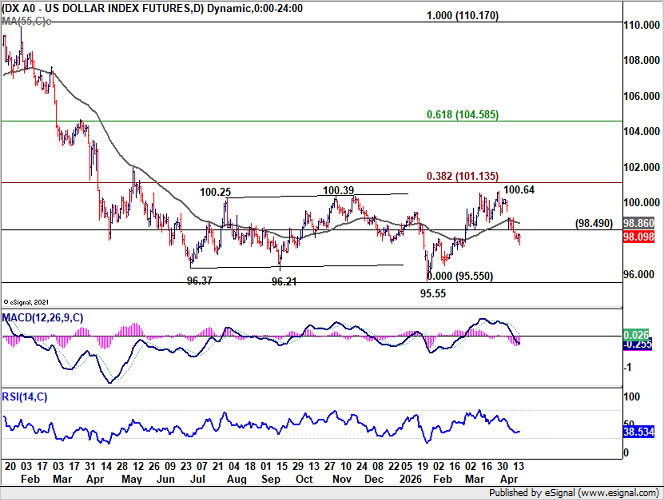
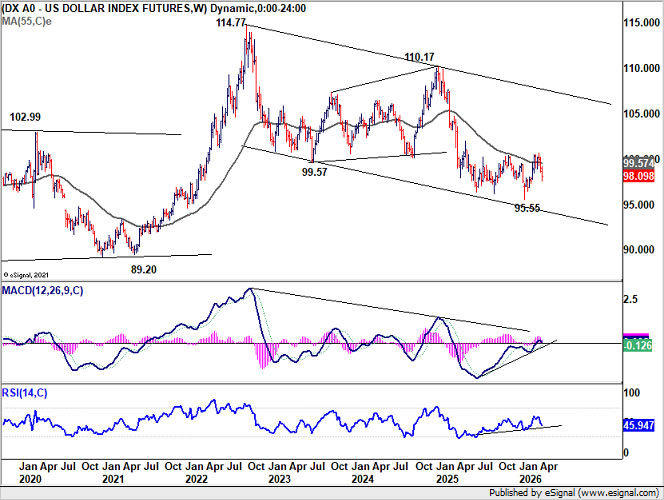
Dollar Index’s break below 98.49 support last week suggests that the rebound from 95.55 has already completed. More importantly, rejection below 38.2% retracement of 110.17 to 95.55 at 101.13, combined with failure at the 55 W EMA (now at 99.57), keeps the medium-term outlook bearish.
Further downside is favored as long as 55 D EMA (now at 98.86) caps any recovery, with focus on a retest of the 95.55 low. While a break below that level is not yet the base case, it will depend on the momentum of the next leg lower.
Conversely, sustained move above 55 D EMA would suggest that the rebound from 95.55 is not yet complete, opening the way for another test of 100.64 and potentially the 101.13 Fibonacci level.
AUD/USD: Breakout Structure to Build Above 0.72
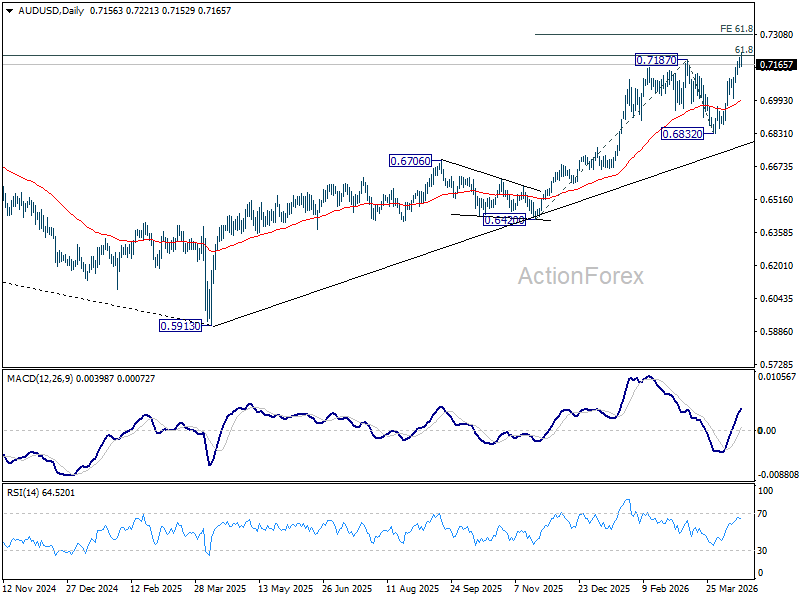
AUD/USD was the top performer last week, gaining 1.46%. While some near-term consolidation is possible after rejection at 0.72 handle on the first attempt, the broader outlook remains bullish as long as 55 D EMA (now at 0.6985) holds.
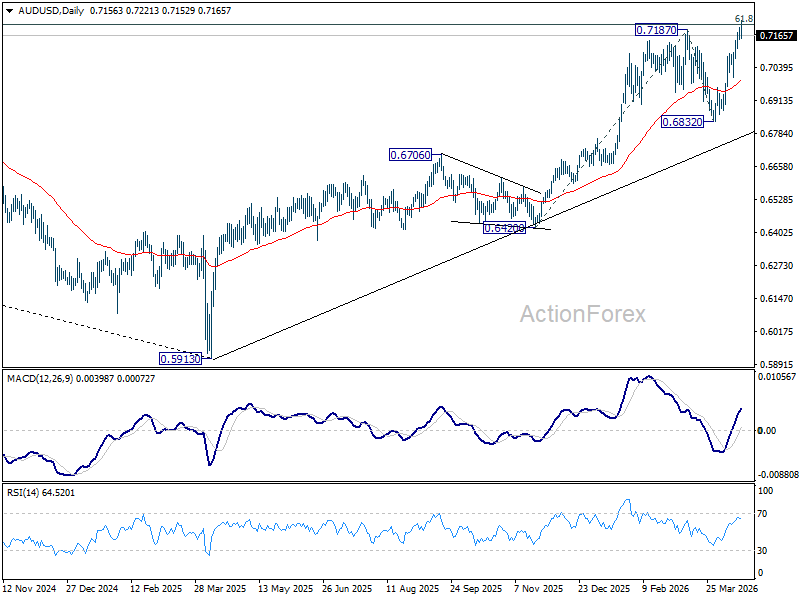
More importantly, decisive break of 61.8% retracement of 0.8006 to 0.5913 at 0.7206 will solidify the case that it's reversing the down trend from 0.8006 (2021 high), rather than correcting it. That should pave the way to retest 0.8006 at least.
EUR/USD Weekly Outlook
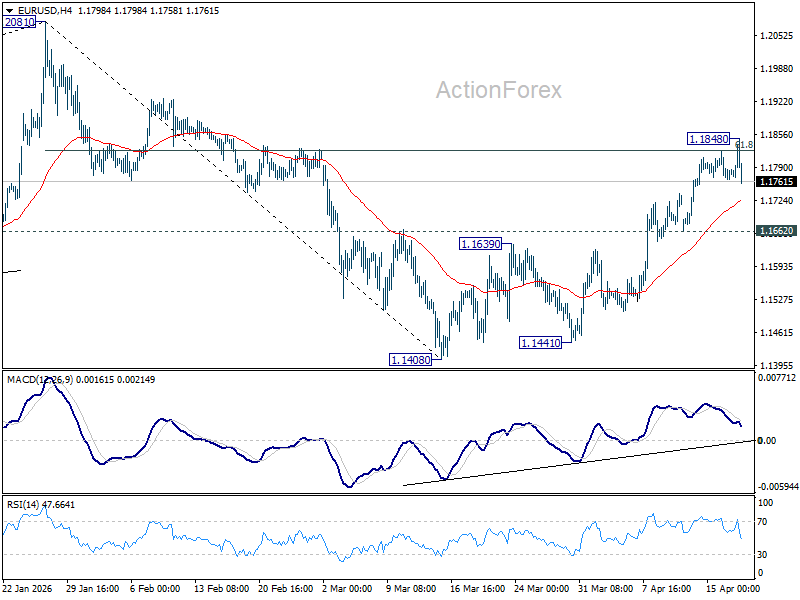
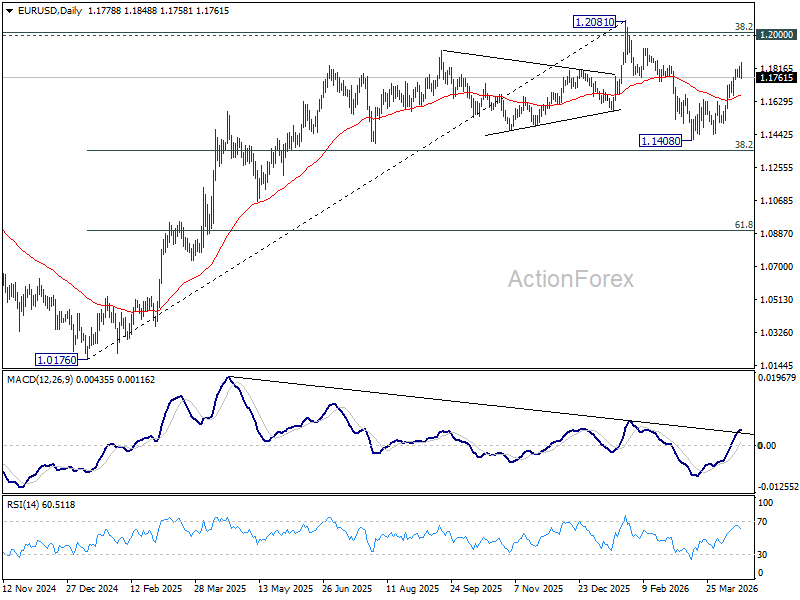
EUR/USD's rise from 1.1408 extended higher to 1.1848 last week, but failed to take out 61.8% retracement of 1.2081 to 1.1408 at 1.1824 decisively. Initial bias is turned neutral this week first. On the upside, sustained trading above 1.1824 will pave the way to retest 1.2081 high. However, firm break of 1.1662 support will bring deeper decline back towards 1.1408 low instead.
In the bigger picture, the strong support from 38.2% retracement of 1.0176 to 1.2081 at 1.1353 suggests that the pullback from 1.2081 is more likely a corrective move. Strong support was also found in 55 W EMA (now at 1.1507). Focus is back on 1.2 key cluster resistance level. Decisive break there will carry long term bullish implications. Nevertheless, break of 1.1408 support will revive the case of medium term bearish trend reversal.
In the long term picture, 38.2% retracement of 1.6039 to 0.9534 at 1.2019, which is close to 1.2000 psychological level is the key for the outlook. Rejection by this level will keep the multi decade down trend from 1.6039 (2008 high) intact, and keep outlook neutral at best. However, decisive break of 1.2000/19, will suggest long term bullish trend reversal, and target 61.8% retracement at 1.3554.
EUR/USD Weekly Outlook
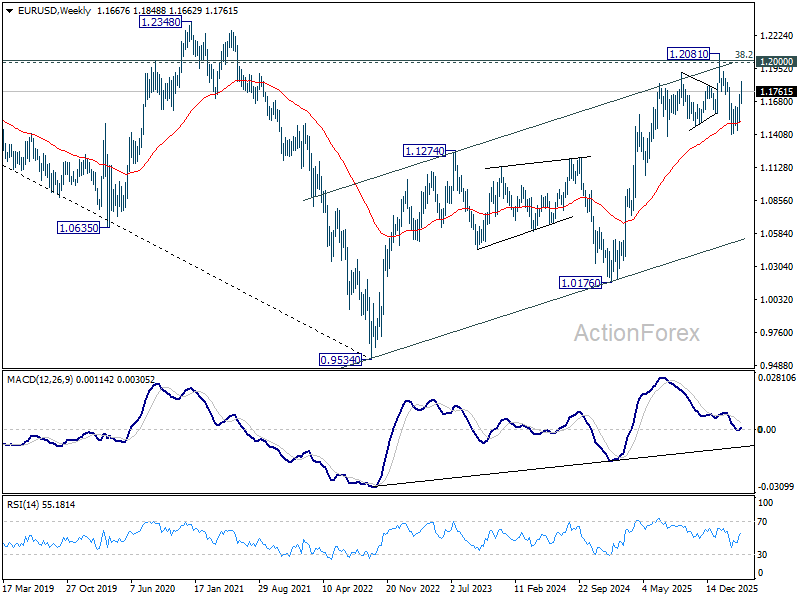
EUR/USD's rise from 1.1408 extended higher to 1.1848 last week, but failed to take out 61.8% retracement of 1.2081 to 1.1408 at 1.1824 decisively. Initial bias is turned neutral this week first. On the upside, sustained trading above 1.1824 will pave the way to retest 1.2081 high. However, firm break of 1.1662 support will bring deeper decline back towards 1.1408 low instead.
In the bigger picture, the strong support from 38.2% retracement of 1.0176 to 1.2081 at 1.1353 suggests that the pullback from 1.2081 is more likely a corrective move. Strong support was also found in 55 W EMA (now at 1.1507). Focus is back on 1.2 key cluster resistance level. Decisive break there will carry long term bullish implications. Nevertheless, break of 1.1408 support will revive the case of medium term bearish trend reversal.
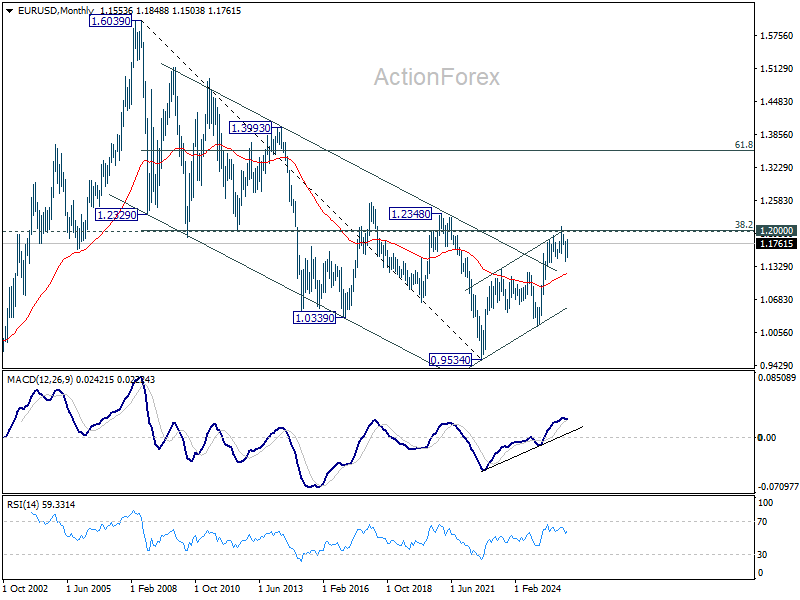
In the long term picture, 38.2% retracement of 1.6039 to 0.9534 at 1.2019, which is close to 1.2000 psychological level is the key for the outlook. Rejection by this level will keep the multi decade down trend from 1.6039 (2008 high) intact, and keep outlook neutral at best. However, decisive break of 1.2000/19, will suggest long term bullish trend reversal, and target 61.8% retracement at 1.3554.
USD/JPY Weekly Outlook
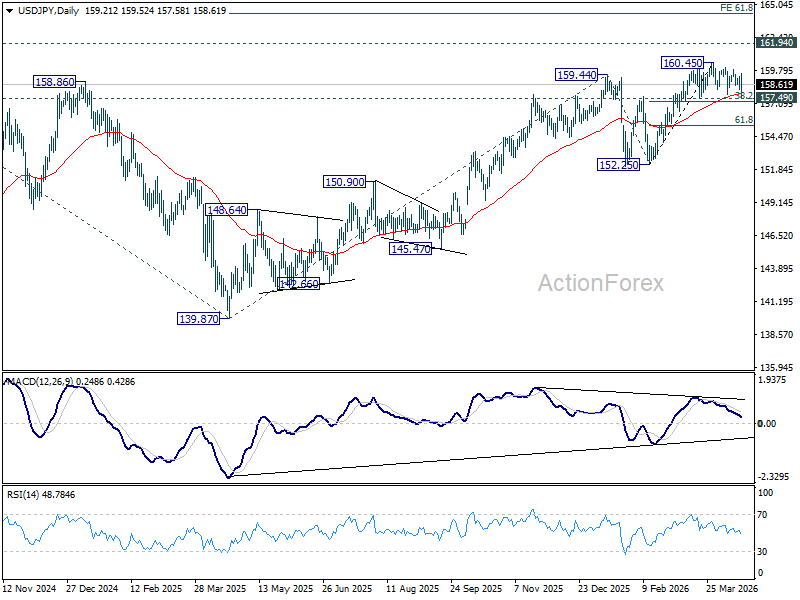
USD/JPY experienced some high volatility last week but after all, it's still bounded in range trading below 160.45. Initial bias stays neutral this week first. Further rise is expected with 157.49 cluster support (38.2% retracement of 152.25 to 160.45 at 157.31) intact. On the upside break of 160.45 will target a retest on 161.94 high. However, firm break of 157.31/49 will bring deeper fall back to 61.8% retracement at 155.38 next.
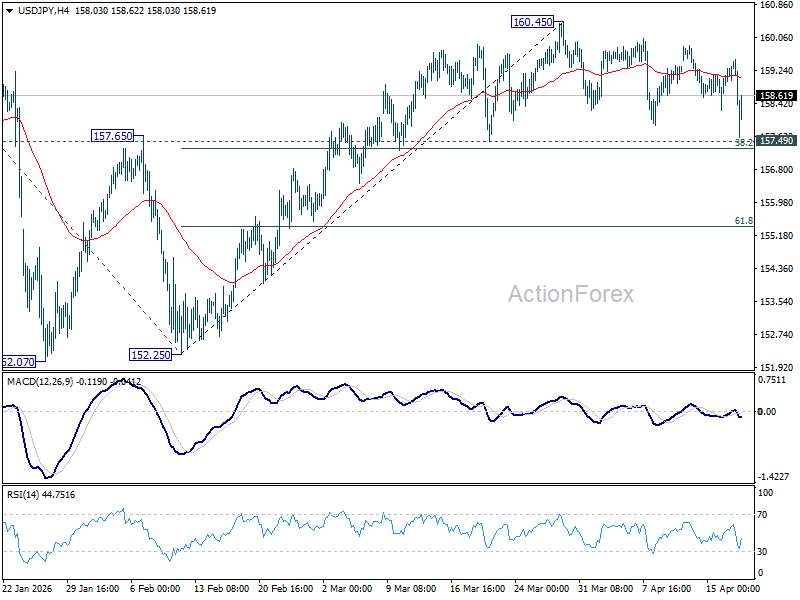
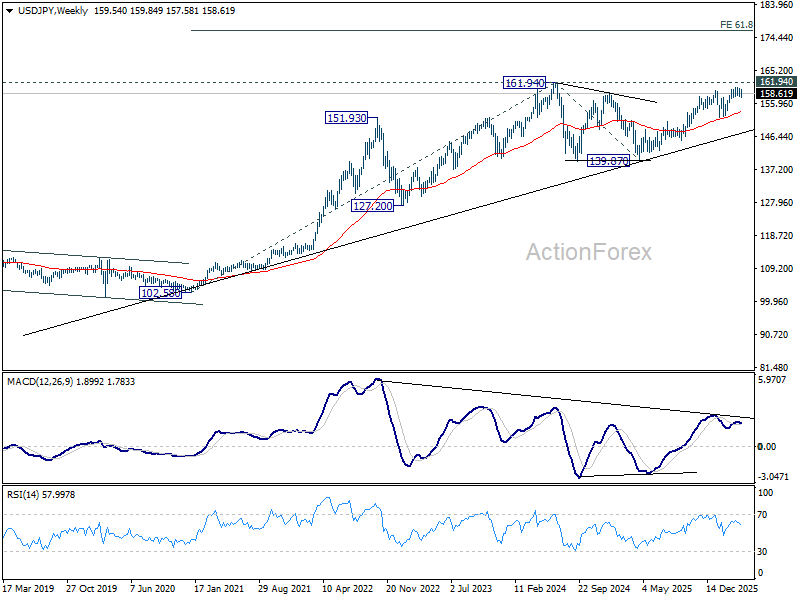
In the bigger picture, outlook is unchanged that corrective pattern from 161.94 (2024 high) should have completed with three waves at 139.87. Larger up trend from 102.58 (2021 low) could be ready to resume through 161.94. This will remain the favored case as long as 55 W EMA (now at 153.61) holds. Firm break of 161.94 will pave the way to 61.8% projection of 102.58 to 161.94 from 139.87 at 176.75.
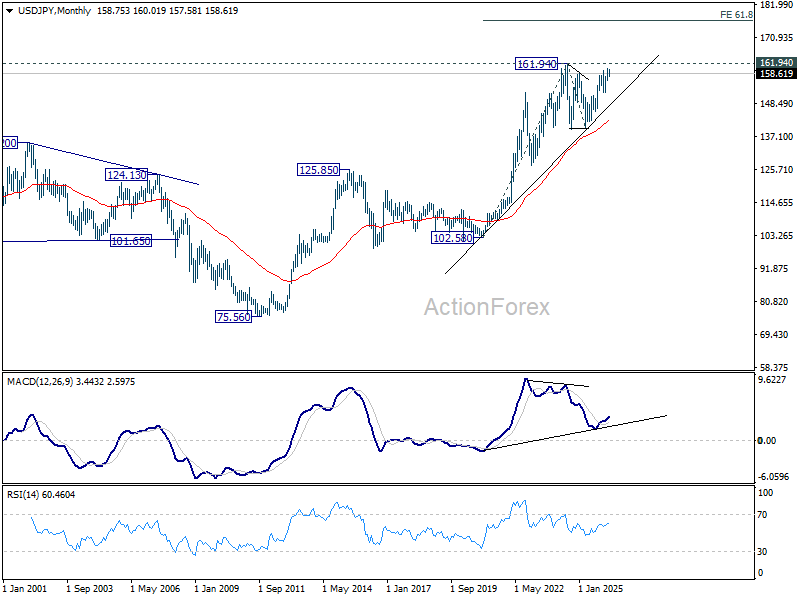
In the long term picture, up trend from 75.56 (2011 low) is still in progress and might be ready to resume. Firm break of 161.94 will target 61.8% projection of 102.58 (2020 low) to 161.94 (2024 high) from 139.87 at 176.55 in the medium term. Long term outlook will stay bullish as long as 139.87 support holds, even in case of deep pullback.
GBP/USD Weekly Outlook
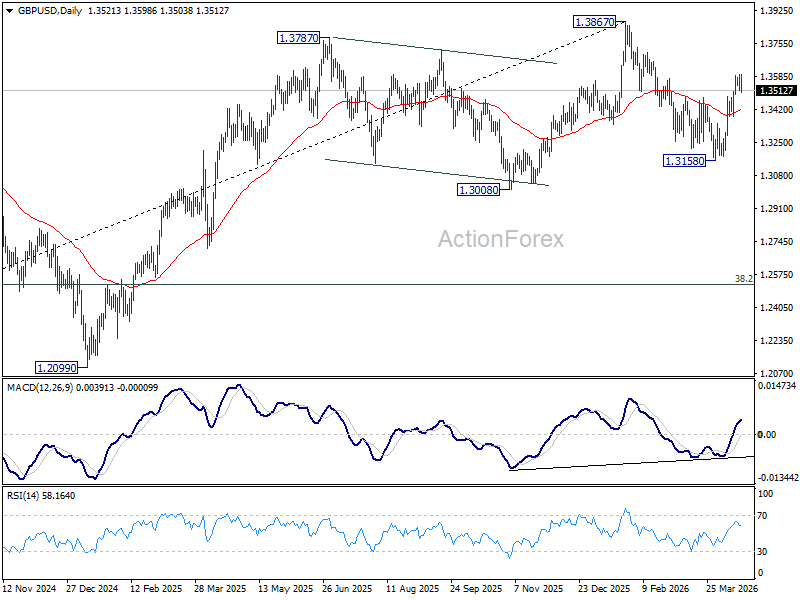
GBP/USD's rebound from 1.3158 extended higher last week but failed to break through 61.8% retracement of 1.3867 to 1.3158 at 1.3596 decisively. Initial bias remains neutral this week first. On the upside, sustained break of 1.359 will pave the way to retest 1.3867 high. However, firm break of 1.3379 will bring deeper fall back to 1.3158 low instead.
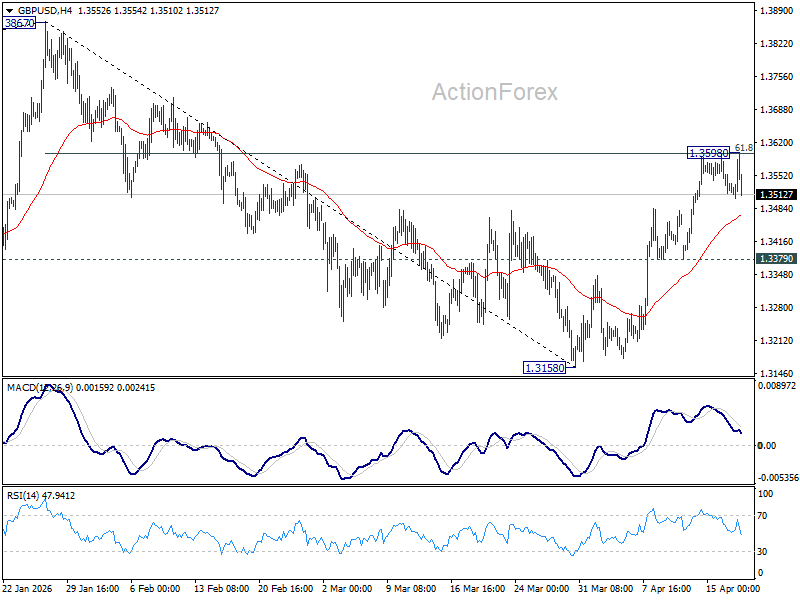
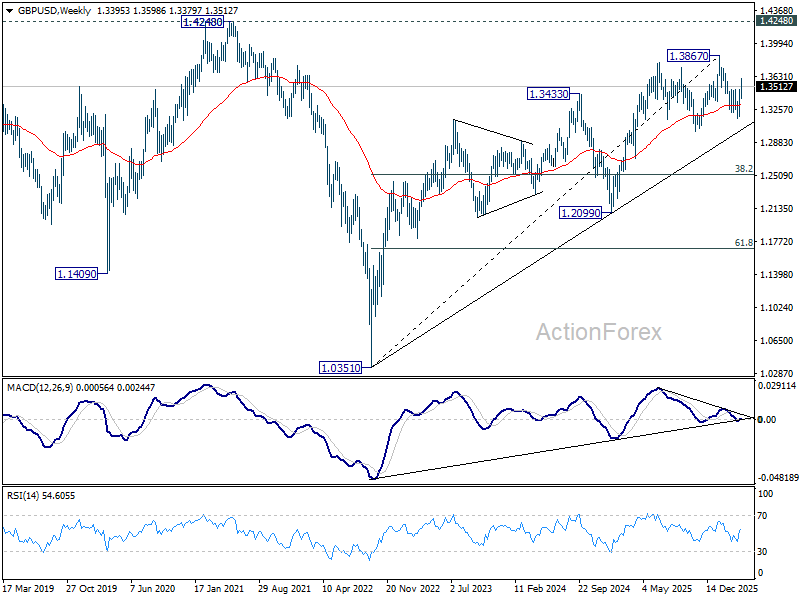
In the bigger picture, current development suggests that price actions from 1.3867 are merely a corrective pattern within the broader up trend from 1.0351 (2022 low). With 1.3008 support intact, medium term bullishness is maintained and break of 1.3867 is back in favor for a later stage, towards 1.4248 key resistance (2021 high).
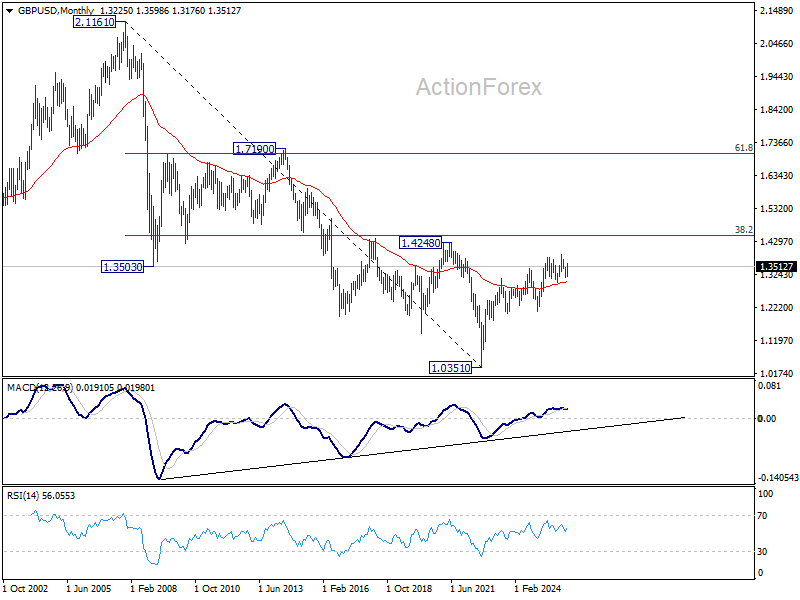
In the long term picture, as long as 1.4248/4480 resistance zone holds (38.2% retracement of 2.1161 to 1.0351 at 1.4480), the long term outlook will remain bearish. That is, price actions from 1.0351 are seen as a corrective pattern to down trend from 2.1161 (2007 high) only. Nevertheless, decisive break of 1.4248/4480 will be a strong sign of long term bullish reversal.
USD/CHF Weekly Outlook
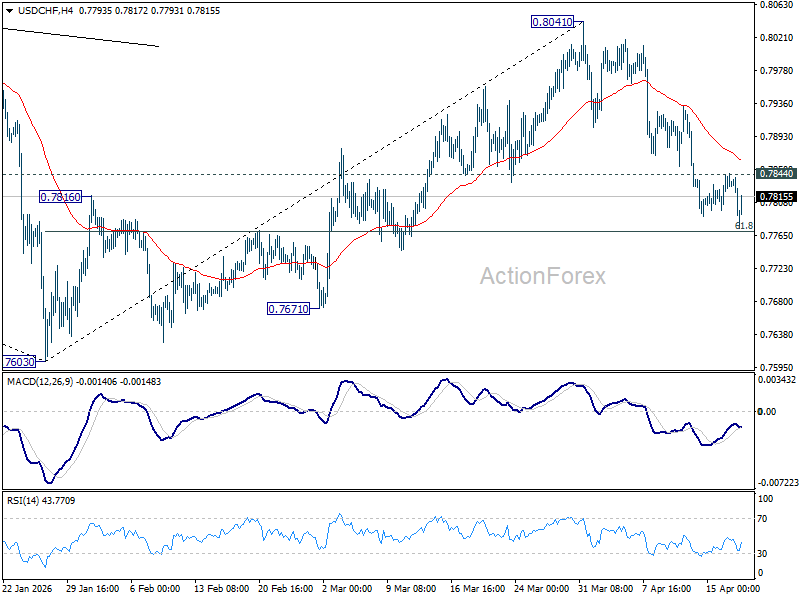
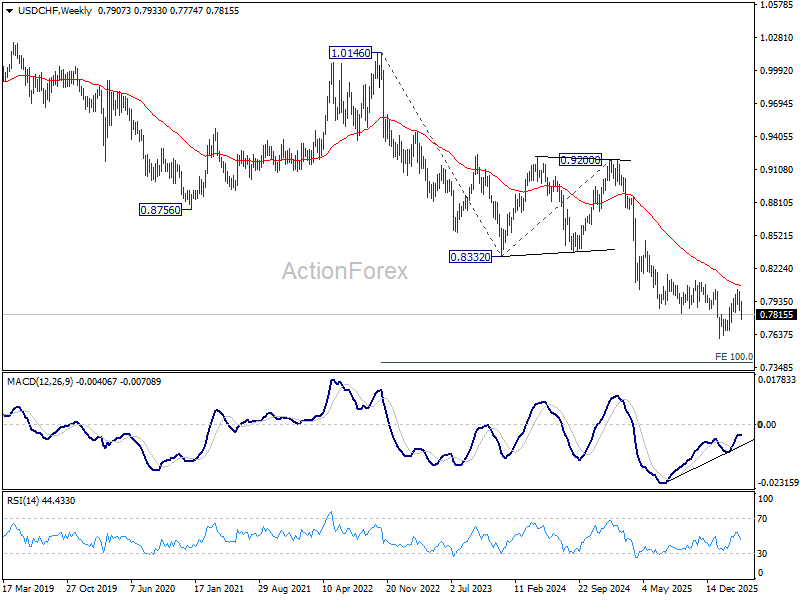
USD/CHF's extended fall last week argues that rebound from 0.7603 has completed as a corrective move to 0.8041. Initial bias stays on the downside this week. Sustained break of 61.8% retracement of 0.7603 to 0.8041 at 0.7770 will pave the way to retest 0.7603 low. On the upside, above 0.7844 minor resistance will turn intraday bias neutral first.
In the bigger picture, rebound from 0.7603 medium term bottom is seen as correcting the fall from 0.9200 only. Rejection by 55 W EMA (now at 0.8068) will affirm this bearish case, and setup down trend resumption to 100% projection of 1.0146 (2022 high) to 0.8332 from 0.9200 at 0.7382 at a later stage. Though, sustained break of 55 W EMA will suggest that it's probably correcting the larger scale down trend from 1.0146 (2022 high).
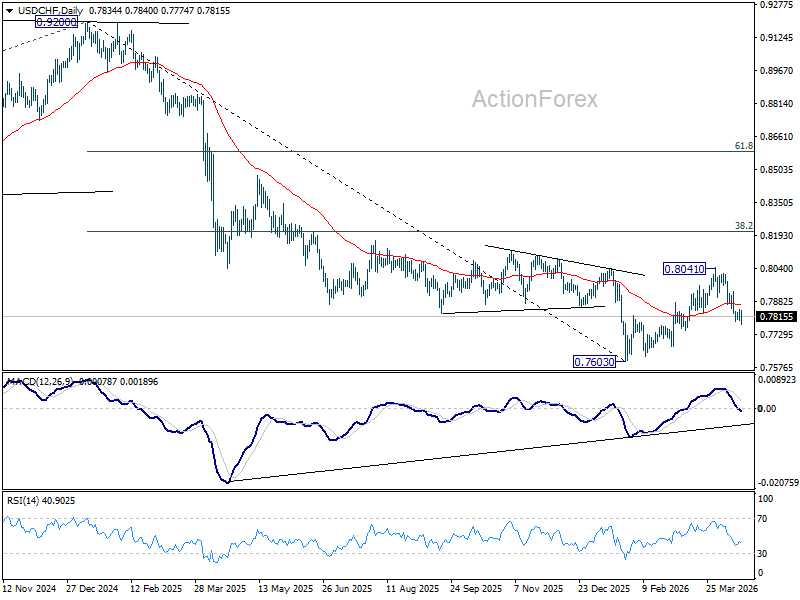
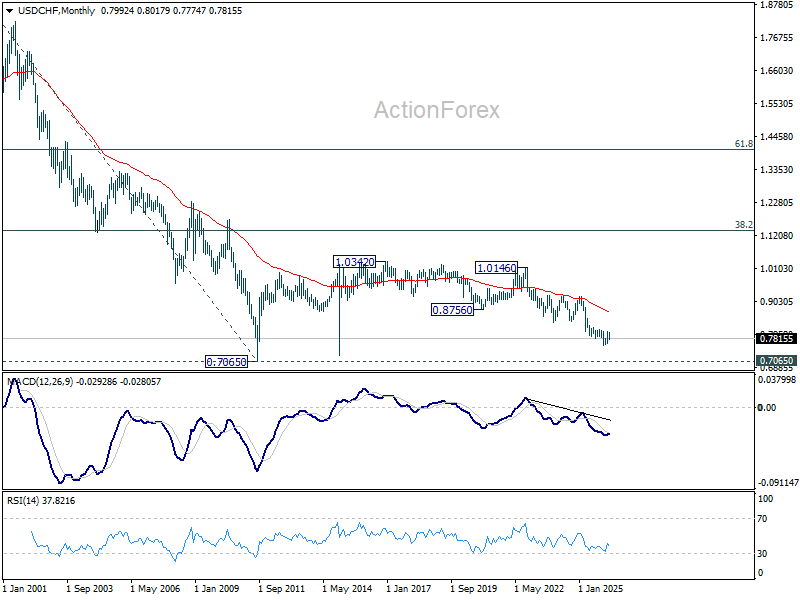
In the long term picture, price action from 0.7065 (2011 low) are seen as a corrective pattern to the multi-decade down trend from 1.8305 (2000 high). It's uncertain if the fall from 1.0342 is the second leg of the pattern, or resumption of the downtrend. But in either case, outlook will stay bearish as long as 0.8756 support turned resistance holds (2021 low). Retest of 0.7065 should be seen next.
AUD/USD Weekly Report
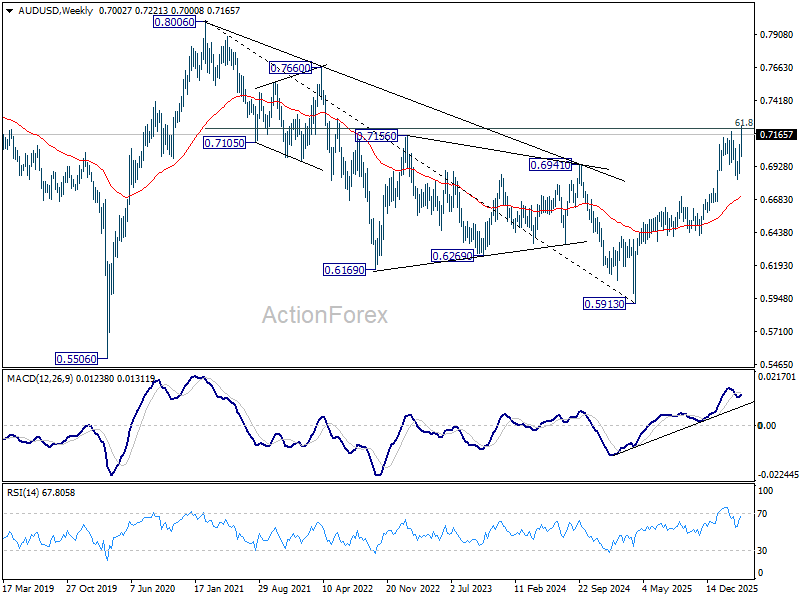
AUD/USD's up trend resumed by breaking through 0.7187 last week. Initial bias stays on the upside this week for 61.8% projection of 0.6420 to 0.7187 from 0.6832 at 0.7306. On the downside, below 0.7151 minor support will turn intraday bias neutral and bring consolidations first, before staging another rise.
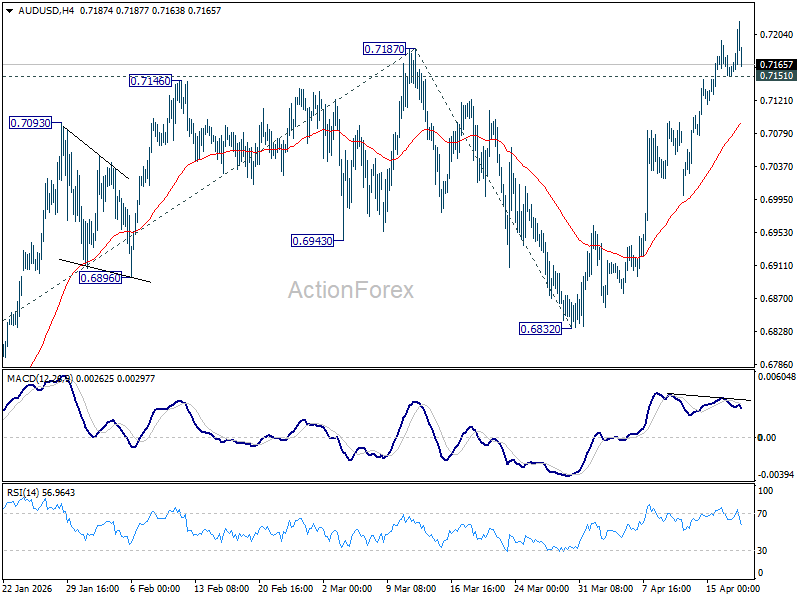
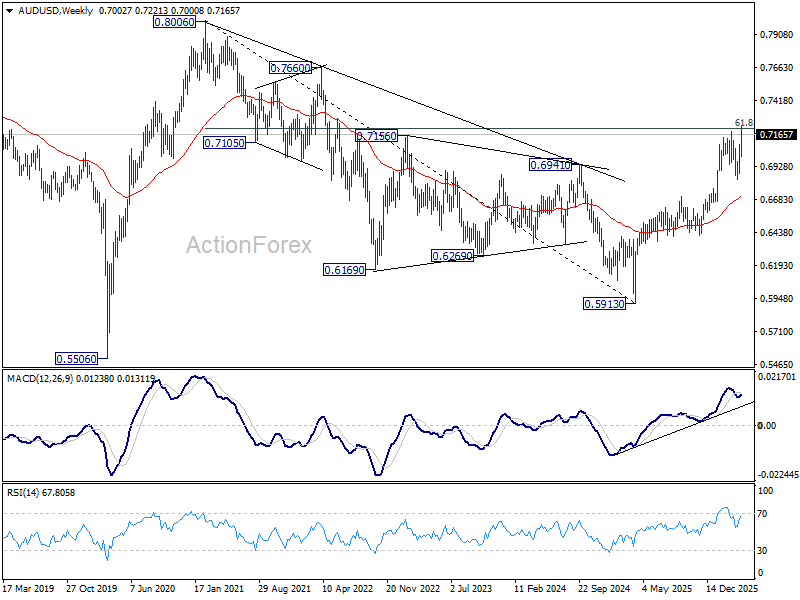
In the bigger picture, rise from 0.5913 (2024 low) is still in progress. Decisive break of 61.8% retracement of 0.8006 to 0.5913 at 0.7206 will solidify the case that it's already reversing the down trend from 0.8006 (2021 high). Further rally should then be seen to retest 0.8006. For now, outlook will remain bullish as long as 0.6832 support holds, in case of pullback.
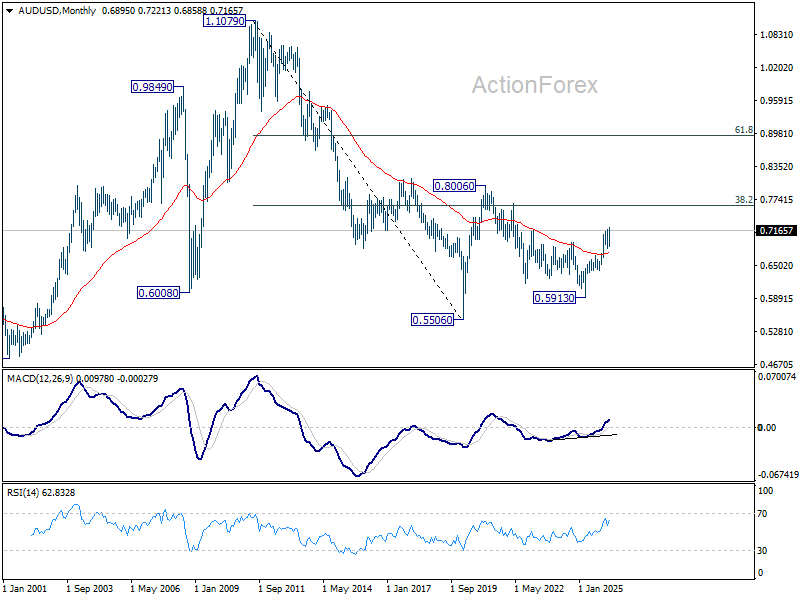
In the long term picture, rise from 0.5913 is seen as the third leg of the whole pattern from 0.5506 (2020 low). It's still early to judge if this is an impulsive or corrective pattern. But in either case, further rise should be seen back to 0.8006 and possibly above. This will remain the favored case as long as 55 W EMA (now at 0.6714) holds.
USD/CAD Weekly Outlook
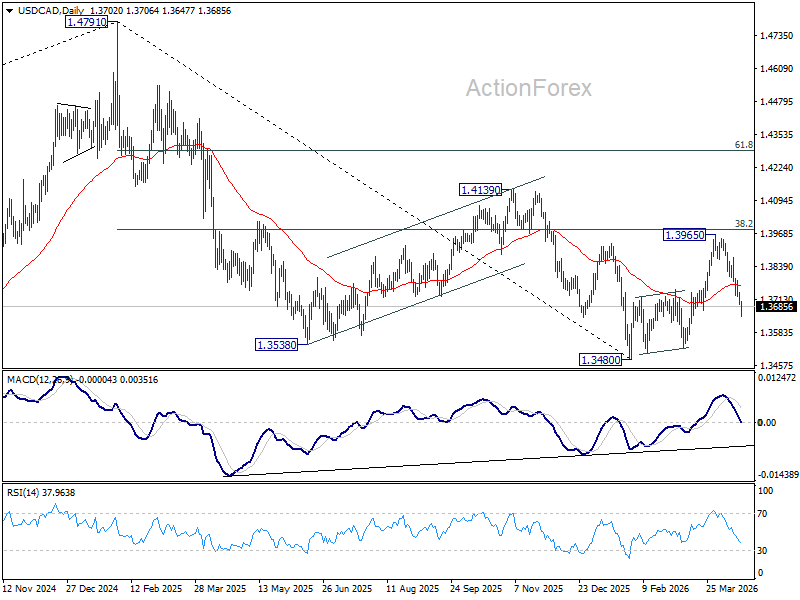
USD/CAD's extended decline last suggests that rise from 1.3480 has completed with three waves up to 1.3965. Initial bias stays on the downside this week. Sustained break of 61.8% retracement of 1.3480 to 1.3965 at 1.3665 will pave the way to retest 1.3480 low. On the upside, above 1.3736 minor resistance will turn intraday bias neutral first.
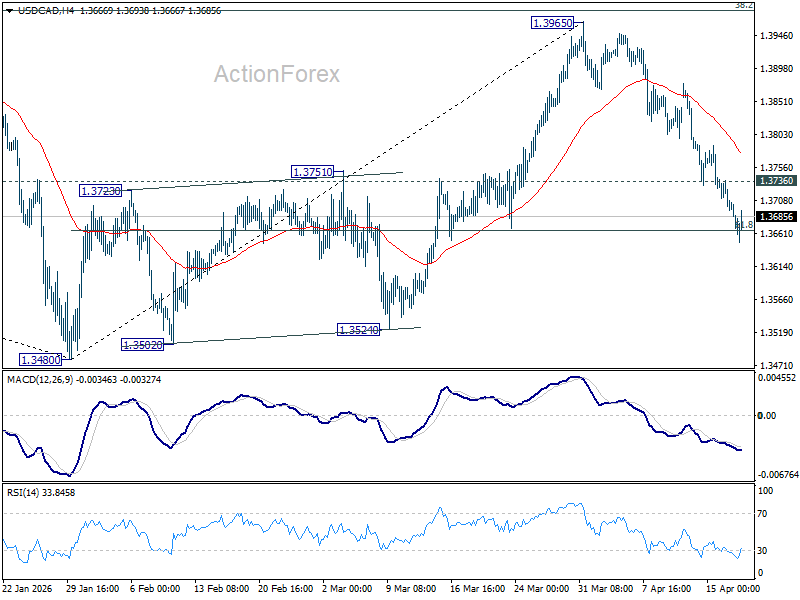
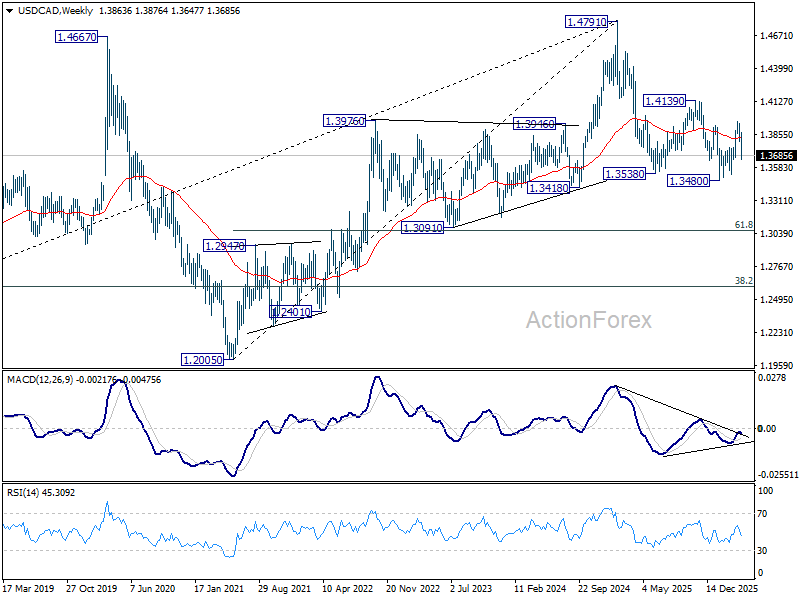
In the bigger picture, price actions from 1.4791 are seen as a corrective pattern to the whole up trend from 1.2005 (2021 low). Deeper fall could be seen, as the pattern extends, to 61.8% retracement of 1.2005 to 1.4791 at 1.3069. However, decisive break of 38.2% retracement of 1.4791 to 1.3480 at 1.3981 will argue that the correction has completed with three waves down to 1.3480 already. Further break of 1.4139 will confirm and bring retest of 1.4791 high.
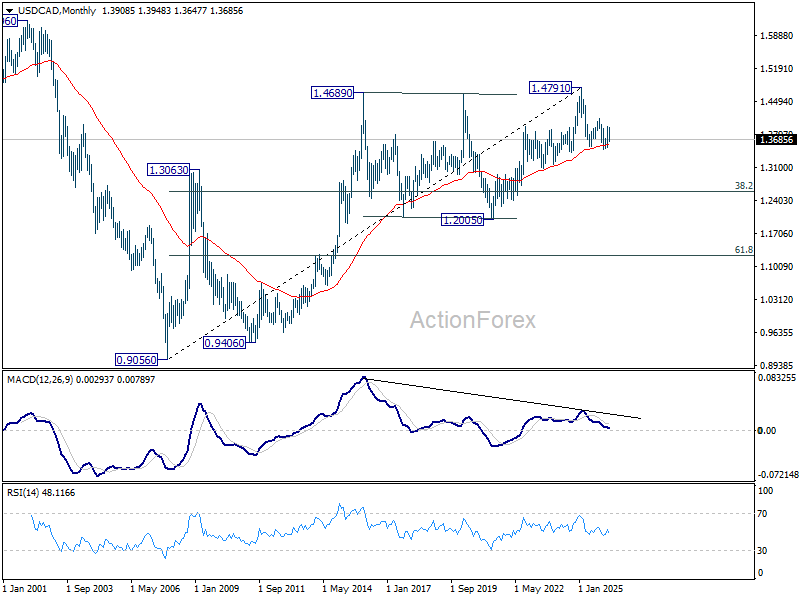
In the long term picture, rising 55 M EMA (now at 1.3590) remains intact. Thus, up trend from 0.9056 (2007 low) could still be in progress. However, considering bearish divergence condition M MACD, sustained trading below 55 M EMA will argue that the up trend has completed with five waves up to 1.4791, and turn medium term outlook bearish for correction to 38.2% retracement of 0.9056 to 1.4791 at 1.2600.
GBP/JPY Weekly Outlook
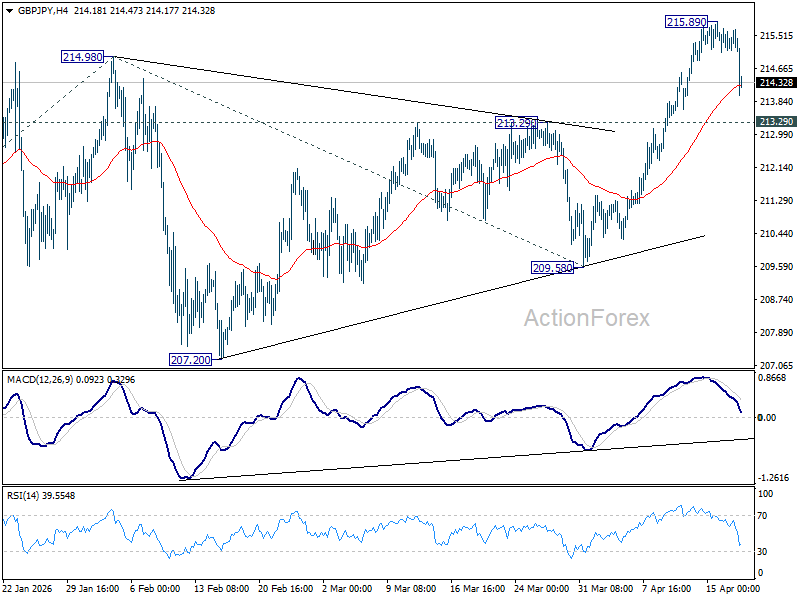
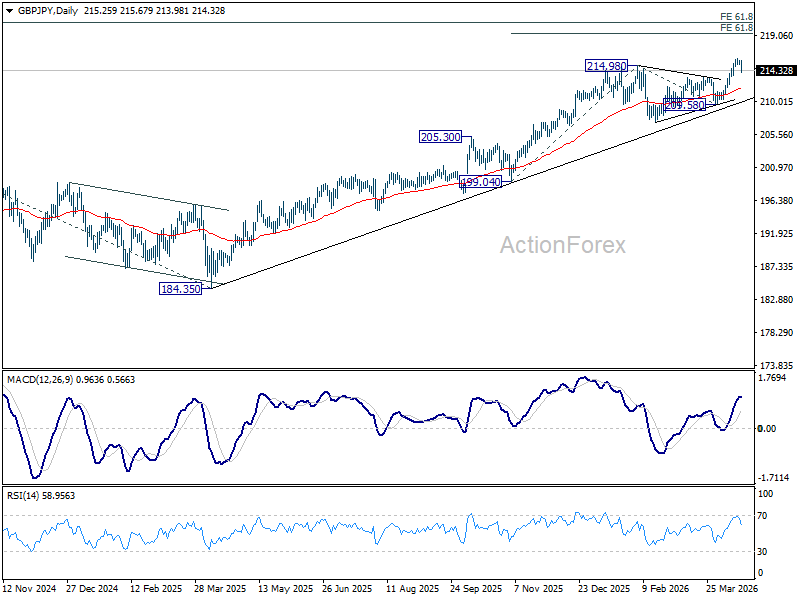
GBP/JPY's pullback from 215.89 accelerated lower last week, but downside is contained above 213.29 resistance turned support. Initial bias stays neutral this week first. Firm break of 215.89 will resume larger up trend to 61.8% projection of 199.04 to 214.98 from 209.58 at 219.43.
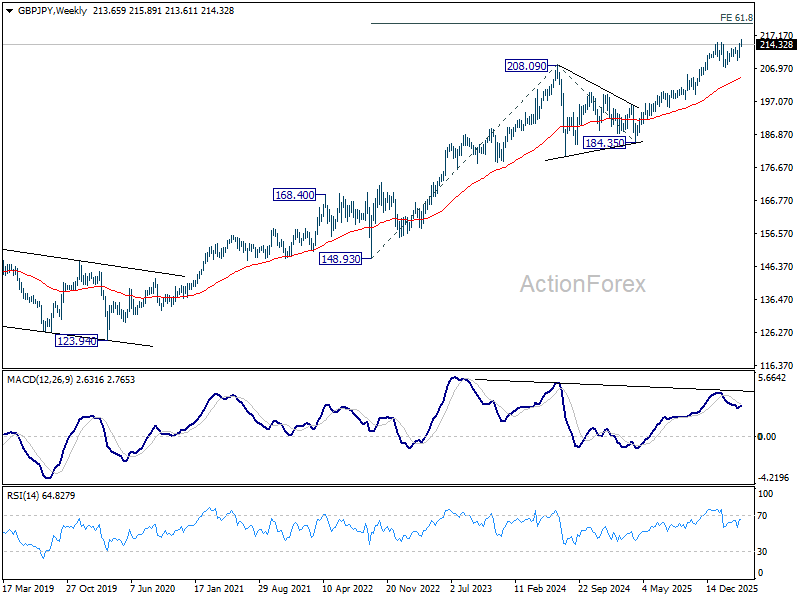
In the bigger picture, up trend from 123.94 (2020 low) is still in progress. Firm break of 214.98 will target 61.8% projection of 148.93 (2022 low) to 208.09 (2024 high) from 184.35 at 220.90. This will remain the favored case as long as 55 W EMA (now at 204.10) holds, even in case of another deep pullback.
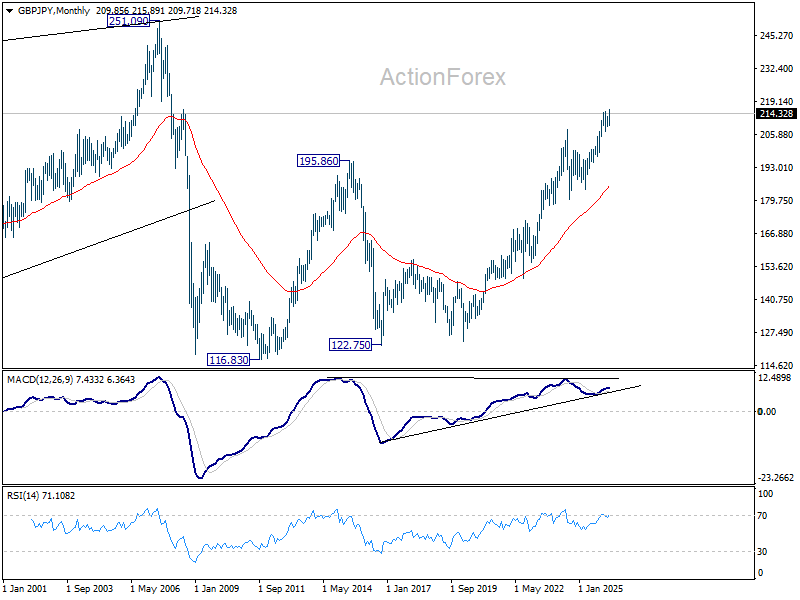
In the long term picture, up trend from 116.83 (2011 low) is in progress. Next target is 251.09 (2007 high). This will remain the favored case as long as 55 M EMA (now at 184.82) holds.
EUR/JPY Weekly Outlook
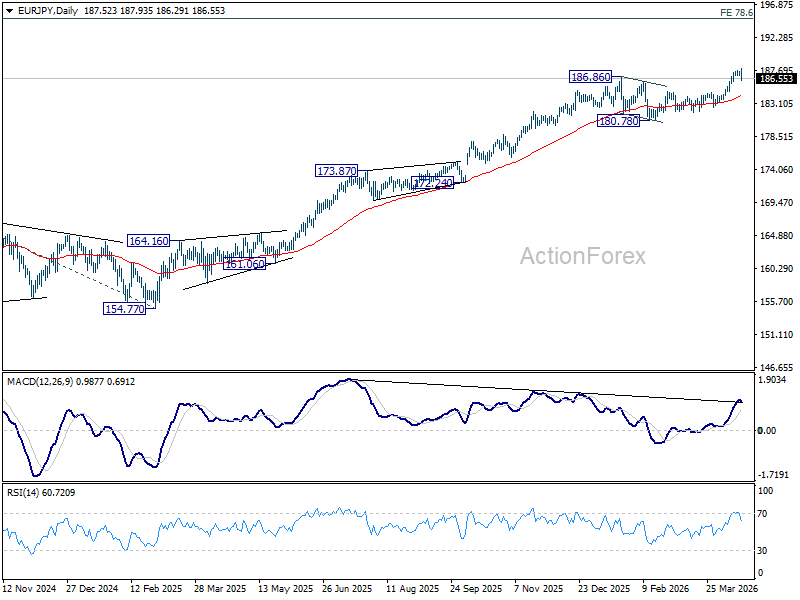
EUR/JPY's sharp reversal last week suggests that a short term top was already formed at 187.93. Initial bias is mildly on the downside this week for 38.2% retracement of 182.56 to 187.93 at 185.87. For now, risk will stay mildly on the downside as long as 187.93 resistance holds, in case of recovery.
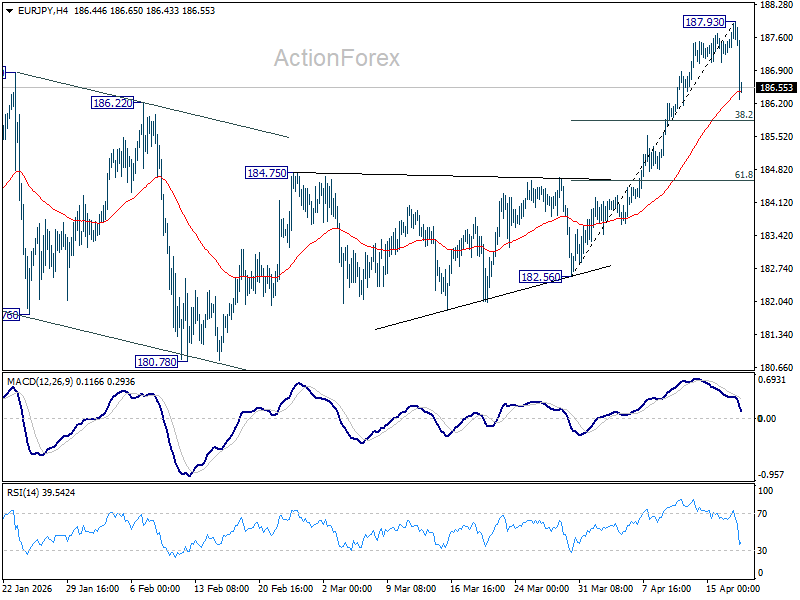
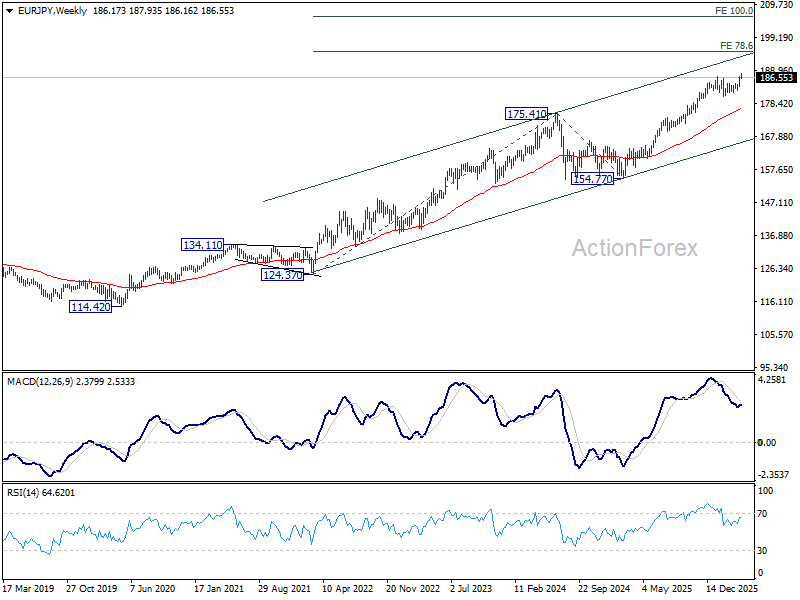
In the bigger picture, up trend from 114.42 (2020 low) is in progress Next target is 78.6% projection of 124.37 (2022 low) to 175.41 (2025 high) from 154.77 at 194.88 next. For now, medium term outlook will stay bullish as long as 180.78 support holds, even in case of deeper pullback.
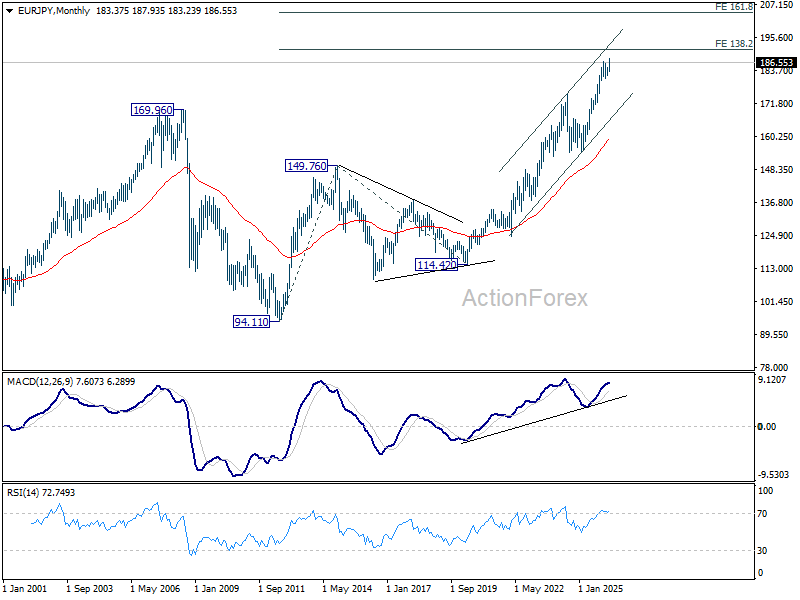
In the long term picture, up trend from 94.11 (2021 low) is in progress. Next target is 138.2% projection of 94.11 to 149.76 (2014 high) from 114.42 (2020 low) at 191.32. This will remain the favored case as long 55 W EMA (now at 176.94) holds.
EUR/GBP Weekly Outlook
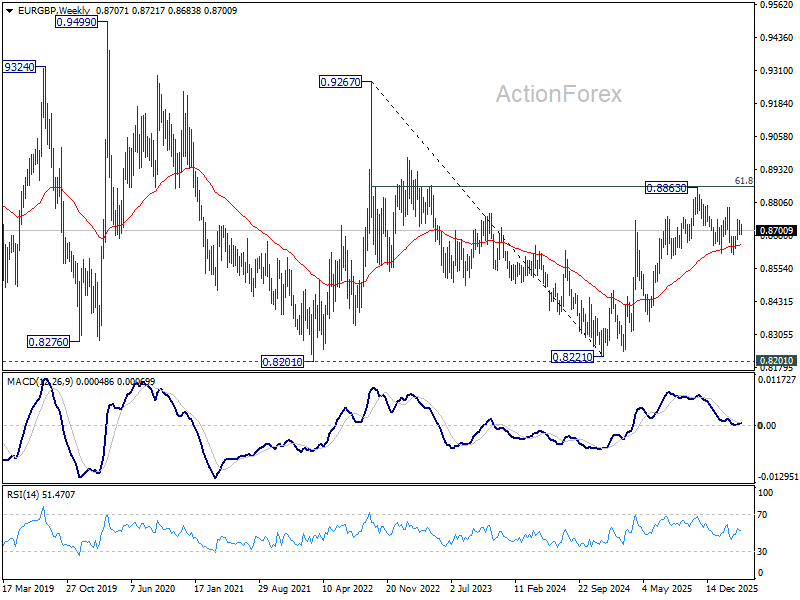
EUR/GBP gyrated in range below 0.8740 last week and outlook is unchanged. Initial bias remains neutral this week first. As long as 0.8675 support holds, further rise remains mildly in favor. On the upside, break of 0.8740 will resume the rally from 0.8610 to 0.8788 resistance. However, firm break of 0.8675 will turn bias back to the downside for retesting 0.8610 low instead.
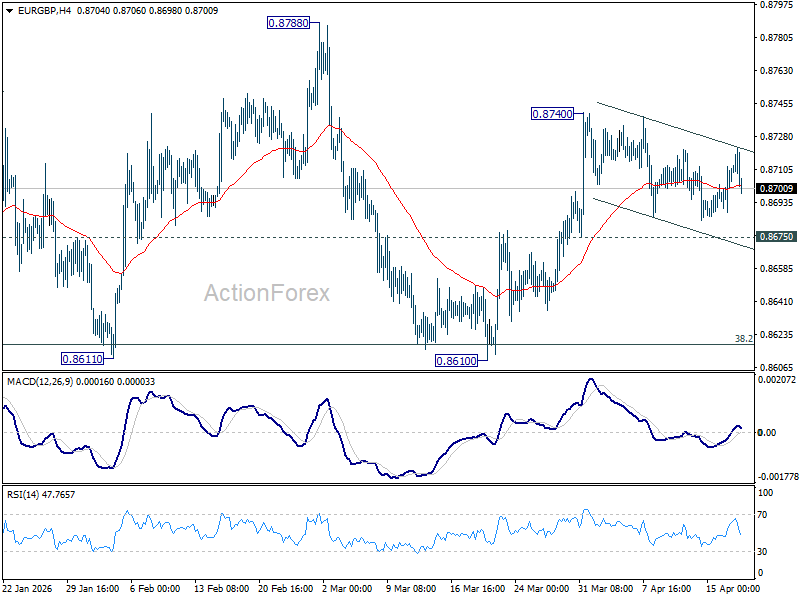
In the bigger picture, strong support was seen again from 38.2% retracement of 0.8821 to 0.8863 at 0.8618. Break of 0.8788 resistance will argue that larger rise from 0.8221 might be ready to resume through 0.8863 (2025 high). Nevertheless, sustained trading below 0.8618 should confirm bearish reversal, and bring deeper fall to 61.8% retracement at 0.8466 at least.
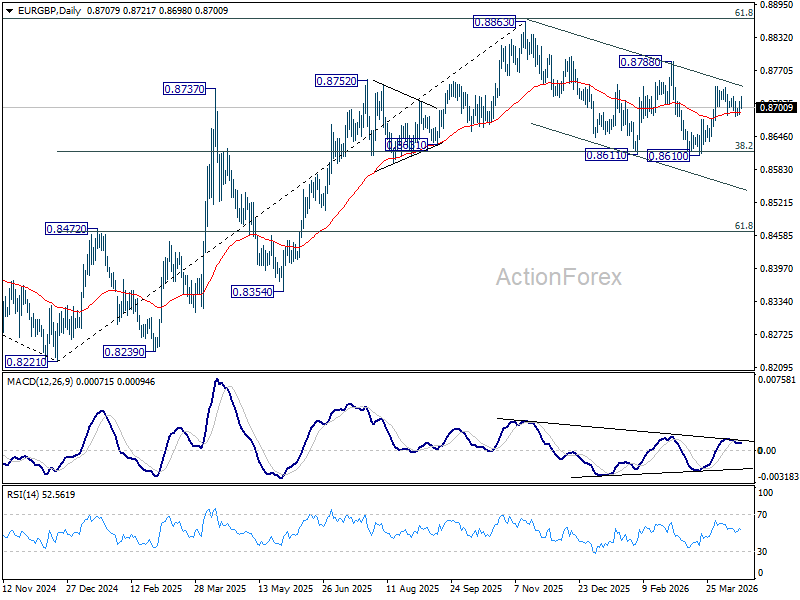
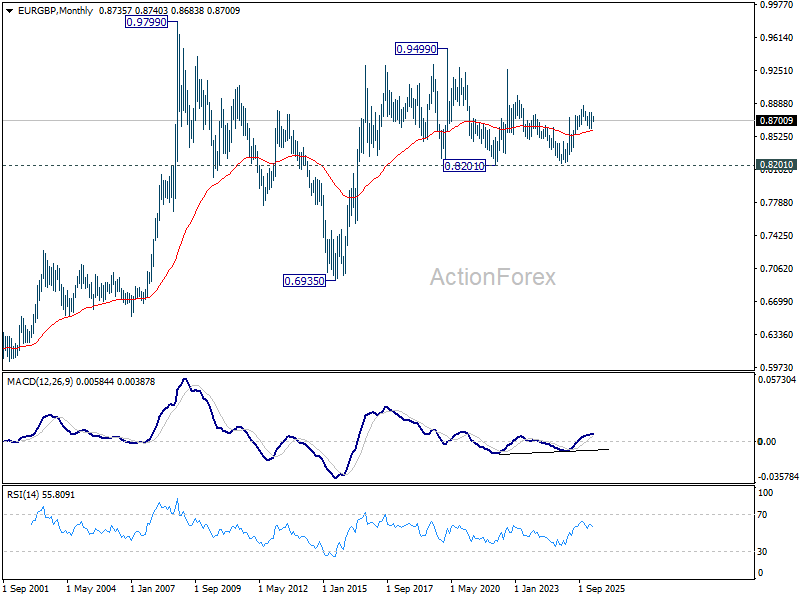
In the long term picture, price action from 0.9499 (2020 high) is seen as part of the long term range pattern from 0.9799 (2008 high). Range trading should continue between 0.8201 and 0.9499, until there is clear signal of imminent breakout.