

Sample Category Title
AUD/USD Daily Report
Daily Pivots: (S1) 0.7141; (P) 0.7181; (R1) 0.7209; More...
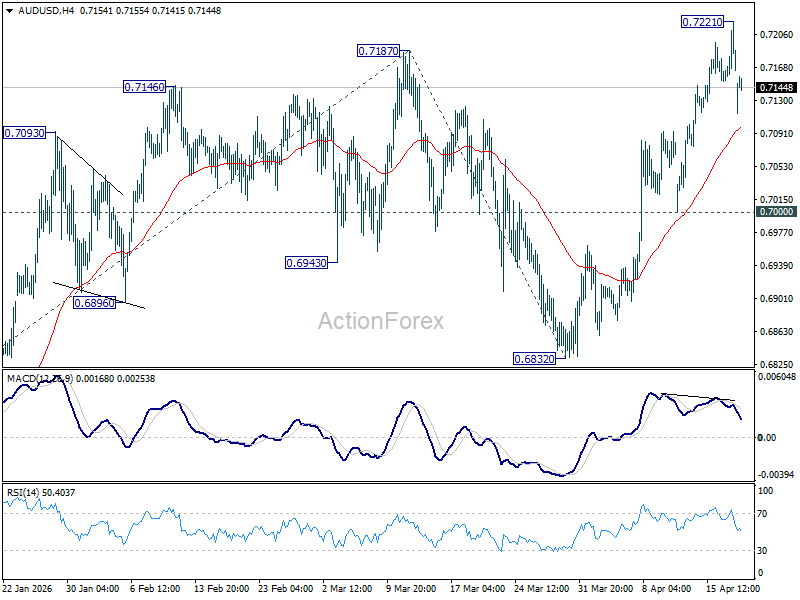
Intraday bias in AUD/USD is turned neutral again with current retreat. Some consolidations would be seen first, but downside should be contained above 0.7000 support. On the upside, above 0.7221 will extend the larger up trend to 61.8% projection of 0.6420 to 0.7187 from 0.6832 at 0.7306. However, break of 0.7000 will bring deeper fall back to 0.6832 support instead.
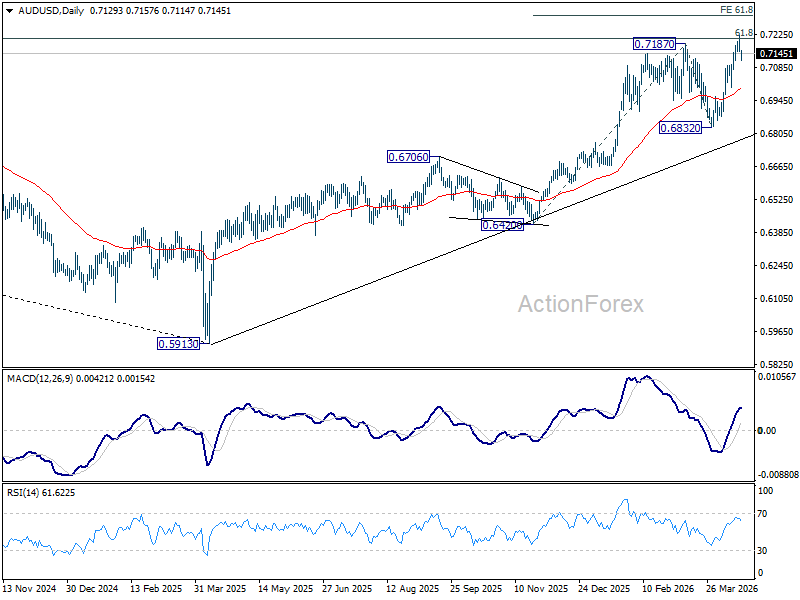
In the bigger picture, rise from 0.5913 (2024 low) is still in progress. Decisive break of 61.8% retracement of 0.8006 to 0.5913 at 0.7206 will solidify the case that it's already reversing the down trend from 0.8006 (2021 high). Further rally should then be seen to retest 0.8006. For now, outlook will remain bullish as long as 0.6832 support holds, in case of pullback.
US-Iran Ceasefire Frays as Tensions Rise; Dollar Firms While Markets Hold Steady
Markets began the week with a measured response to intensifying US–Iran tensions, even as the ceasefire showed visible signs of strain. The Dollar edged higher and oil prices rebounded, but broader markets remained composed, indicating that investors are not yet pricing a full shift toward conflict. The retreat of the “peace trade” is evident but incomplete. Oil’s move higher reflects a partial reintroduction of geopolitical risk, yet the absence of a sharper breakout above $100 suggests that supply disruption is not the base case. This balance is keeping risk sentiment broadly intact.
Equity markets in Asia reinforced this interpretation, trading modestly higher despite the negative headlines. The resilience underscores a prevailing view that while risks are rising, they have not yet crossed a threshold that would force a decisive repositioning. In FX markets, Dollar’s recovery has been notable but lacks conviction. For now, the move appears more corrective than directional, consistent with a broader market environment characterized by uncertainty rather than clear trend formation.
Beneath the surface, however, the ceasefire is being tested across multiple fronts. A series of escalating developments has weakened the foundation of the agreement, even if none has yet triggered a full breakdown in market expectations.
The naval blockade remains the most persistent point of contention. Iran views the continued US presence and restrictions as a violation of the ceasefire terms, while the US maintains that enforcement will continue until a final settlement is secured. This disagreement reflects a deeper impasse over sequencing and trust.
Meanwhile, the situation in the Strait of Hormuz has become increasingly volatile. The reversal from a brief reopening to renewed closure has reintroduced uncertainty around maritime access, with Iran now imposing stricter controls and issuing warnings to commercial vessels.
The “Desh Garima” incident has further heightened tensions. The reported interception and damage of an Iranian-linked vessel by US forces has been framed by Tehran as an act of aggression, raising concerns that isolated incidents could escalate into broader confrontation.
Meanwhile, the situation regarding the second round of US-Iran peace talks in Islamabad is currently in a state of high-stakes diplomatic whiplash. There is a direct contradiction between Washington and Tehran regarding whether these talks will even happen. The "second round" may end up being a one-sided arrival.
From Washington’s side, President Donald Trump said over the weekend that a high-level US delegation would travel to Pakistan, led by Vice President JD Vance, to advance discussions. Trump struck a cautiously optimistic tone, stating that the “concept of the deal is done,” suggesting that remaining negotiations are focused on final implementation details rather than core disagreements.
Iran, however, has pushed back forcefully against that narrative. According to the state-run Islamic Republic News Agency and national broadcaster, Tehran has not agreed to participate in a second round under current conditions. Iranian officials described the US announcement as a “media game” designed to create diplomatic pressure, rejecting the idea that talks are progressing toward a finalized agreement.
For markets, this leaves a narrow but critical window of uncertainty ahead of the April 22 ceasefire deadline. The coexistence of escalating tensions and unresolved diplomacy is keeping positioning cautious. Until one narrative clearly dominates, markets are likely to remain steady—absorbing shocks, but not yet reacting decisively.
In the currency markets, for the day so far, Dollar is currently the strongest, followed by Loonie, and then Euro. Aussie is the worst, followed by Yen, and then Kiwi. Sterling and Swiss Franc are positioning in the middle.
Gold Drops as Ceasefire Cracks, But Oil Says Markets Aren’t Pricing War Yet
Gold drops as US–Iran ceasefire cracks, but oil below $100 signals markets aren’t pricing war. Fading momentum leaves gold vulnerable to a deeper move toward the 4,000 level if tension turns into conflicts. Read More.
China Holds LPR Steady for 11th Month, Signals Stability Amid Global Risks
China kept its benchmark lending rates unchanged for an 11th straight month, reinforcing a cautious stance as policymakers balance growth support against rising global risks. With the PBoC signaling a “moderately loose” policy bias but prioritizing currency stability, markets are watching how Beijing navigates geopolitical and trade tensions. Read More.
New Zealand Posts NZD 698M Trade Surplus as China, Australia Drive Export Growth
New Zealand’s trade surplus held at NZD 698M in March as exports climbed on strong demand from China and Australia, but a faster surge in imports signals rising domestic demand and cost pressures. Read More.
AUD/USD Daily Report
Daily Pivots: (S1) 0.7141; (P) 0.7181; (R1) 0.7209; More...
Intraday bias in AUD/USD is turned neutral again with current retreat. Some consolidations would be seen first, but downside should be contained above 0.7000 support. On the upside, above 0.7221 will extend the larger up trend to 61.8% projection of 0.6420 to 0.7187 from 0.6832 at 0.7306. However, break of 0.7000 will bring deeper fall back to 0.6832 support instead.
In the bigger picture, rise from 0.5913 (2024 low) is still in progress. Decisive break of 61.8% retracement of 0.8006 to 0.5913 at 0.7206 will solidify the case that it's already reversing the down trend from 0.8006 (2021 high). Further rally should then be seen to retest 0.8006. For now, outlook will remain bullish as long as 0.6832 support holds, in case of pullback.
Gold Drops as Ceasefire Cracks, But Oil Says Markets Aren’t Pricing War Yet
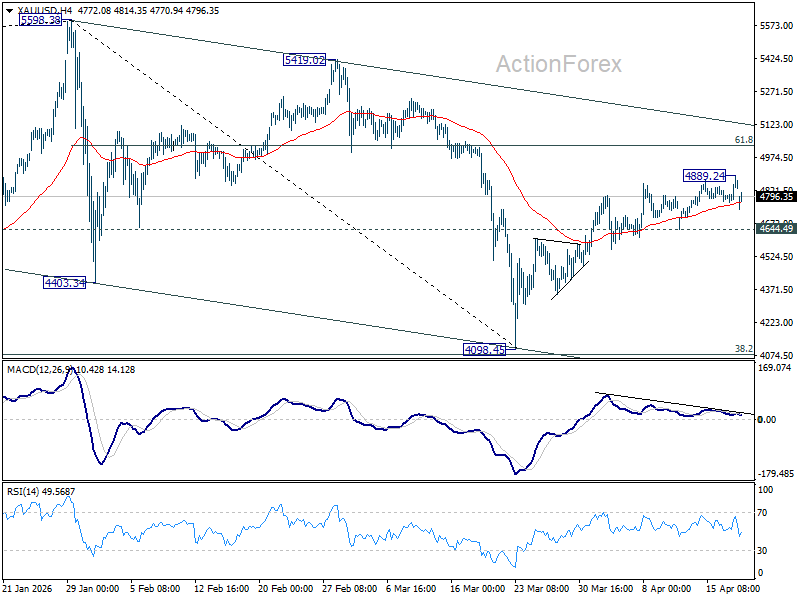
Gold gapped lower at the week's open as cracks in the US–Iran ceasefire deepened just days before the April 22 expiry. Yet markets have stopped short of panic for now, with oil prices rising but still restrained—falling short of signaling a full repricing toward war. At the same time, Gold’s upward momentum is already fading, leaving it vulnerable. Any further geopolitical deterioration could quickly trigger a reversal lower back towards 4,000 handle.
The breakdown in diplomacy is becoming clearer. The “double blockade” dynamic has emerged as the core constraint, with both sides unwilling to concede control over the Strait of Hormuz. Iran has pulled out of follow-up talks ahead of the deadline, citing ongoing US blockades and escalating demands. Still, markets are not treating this as a definitive escalation event. The White House has yet to formally cancel talks, keeping alive the possibility of a last-minute framework.
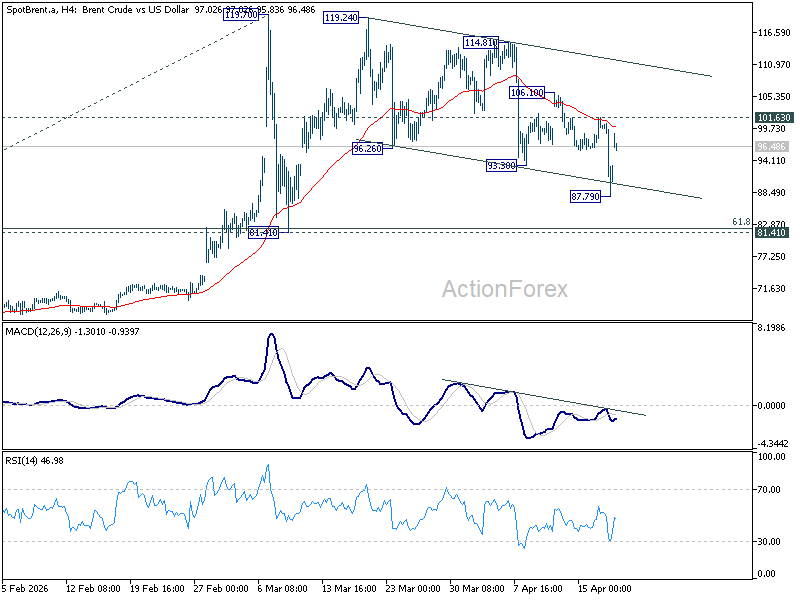
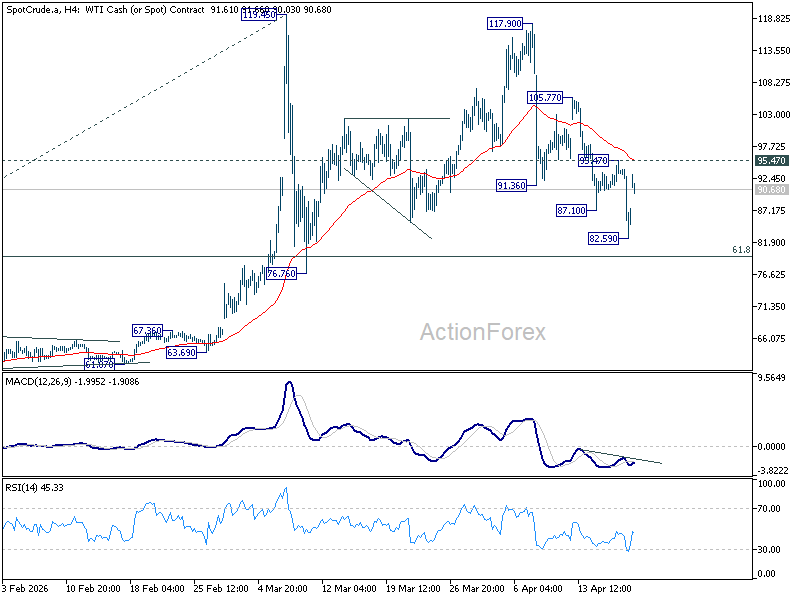
Oil is anchoring that restraint. Prices have pushed higher but remain below the critical $100 war threshold, while the Brent–WTI spread is holding near normal levels around $5. This matters. Without a break higher in oil, the current setup reflects instability without escalation, limiting broader risk-off flows.
Technically, Gold’s rebound from 4,098.45 is already fading. Bearish divergence on 4H MACD signals weakening upward momentum, with 4,644.49 now the key near-term support. A break below would confirm that the corrective bounce has run its course, shifting bias back to the downside for a retest of 4,098.45.
The next catalyst remains oil. A decisive break above $100—especially if accompanied by a tightening or even inversion of the Brent–WTI spread—would signal that markets are finally pricing escalation. Until then, Gold is likely to stay rangebound rather than collapse, caught in a market that is still hopeful for diplomacy, but not yet pricing war.
EUR/USD Dips Draw Interest, Bulls Prepare to Step In
Key Highlights
- EUR/USD gained bullish pace for a move above the 1.1800 zone.
- A major bullish trend line is forming with support at 1.1680 on the 4-hour chart.
- GBP/USD climbed toward 1.3620 before correcting some gains.
- WTI Crude Oil prices are under pressure below $93.20 and $92.50.
EUR/USD Technical Analysis
The Euro remained elevated above 1.1650 against the US Dollar. EUR/USD started a decent increase above the 1.1700 and 1.1750 resistance levels.
Looking at the 4-hour chart, the pair settled above the 1.1720 level, the 100 simple moving average (red, 4-hour), and the 200 simple moving average (green, 4-hour). A high was formed at 1.1849 before there was a downside correction.
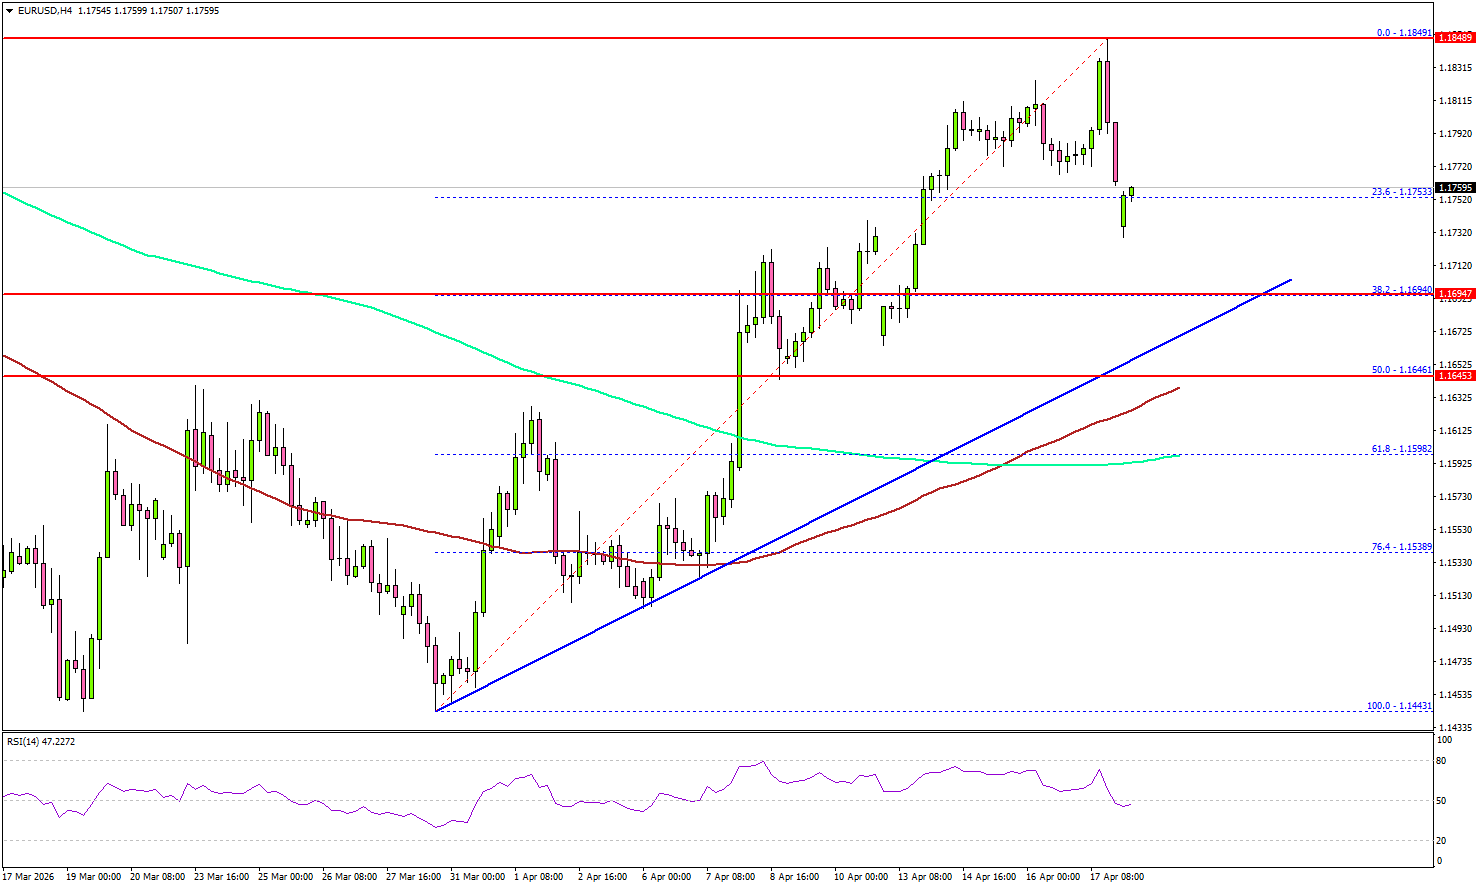
The pair dipped below 1.1780. Immediate support is seen near 1.1700 or the 38.2% Fib retracement level of the upward move from the 1.1443 swing low to the 1.1849 high.
The next support could be 1.1650 and the 50% Fib retracement or the 100 simple moving average (red, 4-hour). A close below 1.1650 might push the pair toward 1.1600 and the 200 simple moving average (green, 4-hour).
Any more losses could initiate a fresh move to 1.1500 in the coming days. On the upside, the pair faces resistance at 1.1820. The first major resistance sits at 1.1850.
The main resistance could be 1.1880. A close above 1.1880 could open doors for gains above 1.1920. In the stated case, the bulls could aim for a move to 1.2000.
Looking at Oil, the price started a consolidation phase, and upside might face resistance near $92.50 and $93.20.
Upcoming Key Economic Events:
- German Producer Price Index for March 2026 (MoM) – Forecast +1.4%, versus –0.5% previous.
China Holds LPR Steady for 11th Month, Signals Stability Amid Global Risks
The People’s Bank of China left its benchmark lending rates unchanged for an 11th straight month in April, in line with expectations, as policymakers prioritize stability amid rising global uncertainty. The one-year loan prime rate was held at 3.0%, while the five-year LPR, a key reference for mortgage lending, stayed at 3.5%.
The decision reflects a cautious policy stance as Beijing balances the need to support domestic growth against external risks. The PBoC reiterated that it will maintain a “supportive” and “moderately loose” monetary policy this year, signaling readiness to underpin economic activity without resorting to aggressive easing. .
Speaking at the International Monetary Fund meetings in Washington last week, Governor Pan Gongsheng highlighted growing risks from geopolitical tensions, protectionism and trade barriers, warning that these forces are weighing on global growth and increasing financial volatility.
| Benchmark Rate | Current Rate | Status |
| 1-Year LPR | 3.00% | Unchanged |
| 5-Year LPR | 3.50% | Unchanged |
New Zealand Posts NZD 698M Trade Surplus as China, Australia Drive Export Growth
New Zealand’s external sector showed resilience in March, with goods exports rising by 7.3% yoy to NZD 7.9B, outpacing imports which increased by 9.6% yoy to NZD 7.2B. The result was a monthly trade surplus of NZD 698M, larger than expectation of NZD 175M.
Export growth was led by strong demand from key partners, particularly Australia and China. Shipments to Australia surged by 38%, while exports to China rose by 11%, reinforcing Asia-Pacific demand as a key pillar for New Zealand’s trade performance. Gains were also seen in exports to the EU (+14%) and Japan (+4.1%), though a decline in shipments to the US (-5.9%) partially offset the overall momentum.
On the import side, increases were broad-based and more pronounced, with China, Australia, and South Korea leading the gains. Imports from China jumped 20%, while purchases from South Korea surged 54%.
| Data | Latest |
|---|---|
| Goods Exports | +542M (+7.3%) |
| Goods Imports | +634M (+9.6%) |
| Trade Balance | +698M surplus |
| Exports to China | +213M (+11%) |
| Exports to Australia | +289M (+38%) |
| Exports to USA | -56M (-5.9%) |
| Exports to EU | +89M (+14%) |
| Exports to Japan | +13M (+4.1%) |
| Imports from China | +255M (+20%) |
| Imports from EU | +152M (+17%) |
| Imports from Australia | +184M (+27%) |
| Imports from USA | -95M (-13%) |
| Imports from South Korea | +180M (+54%) |
For the US, an Adverse Turn is in the Making
The US economy is facing a very uncertain future with inflation up and consumer sentiment at record lows.
Headlines tied to the US economy continue to focus on President Trump’s Middle East actions and the consequences for global energy prices. Abstracting from this news storm, however, the message from available economic data is the US economy slowed below trend ahead of the conflict, leaving the economy at risk of stalling, at least briefly.
In understanding the US’ current state and outlook, it is best to assess recent data chronologically. First estimated at 1.4% annualised, Q4 GDP growth has since been revised to just 0.5%. Underlying the headline revisions, personal consumption growth throttled back from a near-trend 2.4% to a sub-par 1.9%, and business investment from an already-weak 3.7% annualised to 2.4%, as residential investment contracted 1.7% annualised.
Come January and February 2026, personal consumption expenditure was essentially flat and core goods order growth slowed to less than a third of Q4’s pace. We do not have reliable data to back the assertion, but it is hard to believe the recent rise in the US 10-year yield and pass-through to the 30-year mortgage rate won’t put additional pressure on residential construction. The current Atlanta Fed GDPNow estimate of 1.3% annualised therefore seems likely to slip through April before the formal Q1 GDP result is released by the BEA.
Another step down in momentum, perhaps into outright contraction, come Q2 is clearly a risk. The only data to hand for April is the University of Michigan’s consumer sentiment survey. Worryingly, the headline index fell to its weakest read on record at 47.6 – an impressive feat considering the survey dates back to 1978 and has averaged 83.8 since, 43% above April’s read. Notably, both current conditions and expectations are at all-time lows, and this is despite nonfarm payrolls having bounced back in March and equity markets, in aggregate, showing resilience.
While nonfarm payrolls have averaged a gain of 68k the past three months, this follows the average loss of 8k jobs per month through the second half of 2025 and material downward revisions to historical estimates prior to that. Household employment outcomes have also been materially weaker over the period. The unemployment rate is essentially unchanged since Q2 2025, but the participation rate has fallen almost 0.7ppts over the period, implying an unemployment rate of 5.0% on a constant participation basis. While not an alarming level historically, relative to the average of the past five years, it implies a marked turn in job creation and building downside risks for activity. This is corroborated by the 1.5ppt decline in the household savings rate since April 2025.
Providing a potential offset is record household wealth. Still, with sentiment as it is, and wealth needing to be liquidated or leveraged to be spent, any wealth effect for consumption is likely to take considerable time to materialise. Furthermore, whereas in the past, the use of wealth by higher-income households could have been complemented by tax breaks and/or cash support for those on lower-incomes, US fiscal authorities no longer have capacity outside of recession.
Taken together, current income and wealth dynamics in the US not only suggest growth is at risk of stalling out mid-year, but also that it could remain weak for an extended period. Thankfully, the FOMC remains equipped with the capacity to support the economy should risks to activity become dominant.
As such, it will be important to assess how the FOMC incorporates upcoming inflation detail into their risk calculations. We expect they will be heartened that the Middle East conflict only impacted headline inflation in March, a 10.9% increase in energy prices tripling the total monthly CPI gain to 0.9%, while core inflation printed at a benign 0.2% (core goods prices up 0.1%, and services 0.2%). Although we still believe capacity constraints across the US economy are likely to hold annual core inflation around the 2.6%yr registered in March throughout 2026, this deviation from target is not material enough to preclude further easing if downside risks for the labour market crystallise come Q2 or Q3.
In contrast to the UK and Europe (and Australia and New Zealand), the chance of a policy rate increase is also slim to non-existent in the US. The outlook for short-end rates should therefore limit gains in term yields to a modest upward drift, a function of gradual portfolio reallocation away from US dollar assets and the edging higher of the US fiscal deficit and government debt.
This analysis was initially released in the April edition of Westpac Market Outlook.
China Set to Benefit from Global Energy Unrest
Chinese exports will receive a material boost from high oil prices. The consumer remains a risk to GDP growth, however.
China’s economy has begun 2026 in good health despite the conflict in the Middle East, registering annual GDP growth of 5.0% in Q1. In time, recent developments are likely to prove a net positive for China, spurring greater demand for green technology across developed and developing markets.
Not only were the March readings for the official NBS manufacturing and services PMI’s favourable, registering increases to 50.4 and 50.1, but the partial data through February and March showed the beginning of a long-awaited stabilisation in consumer demand and turn for housing investment, retail sales growth beating estimates in February at 2.8%ytd (although growth slowed again in March to 2.4%ytd) and the decline in property investment almost halving from –17.2%ytd in December to –11.2%ytd in March. The latter result is particularly welcome given construction activity has declined almost 40% since end-2021.
In the short term, an end to the sharp decline in property investment will add meaningfully to economic growth given the sector still makes up circa 15% of the aggregate economy. In the medium to long-term though, not only will investment activity need to expand sustainably, but wealth must follow. As yet, there is no evidence of price growth, with new and existing home prices falling a further 0.2% in March.
We remain circumspect on the rate at which retail sales growth will accelerate from here near term, anticipating it is unlikely to return to trend, let alone outperform, until pro-active fiscal policy comes into effect. Authorities signalled an intention to act at the March NPC, but detail has been scarce since.
It is potentially the case that the Government wants clean air for reforms, which the Middle East conflict and the upcoming May meeting between President Xi and President Trump precludes for now. Though authorities may also feel the domestic economy has been given additional time to find its own path without intervention. The response of consumers and businesses across developed and developing markets to the current surge in energy prices will almost surely be an acceleration in demand for renewable energy products and electric vehicles, which China is globally dominant in and has ample spare capacity to produce and ship.
Even without a further material improvement in domestic demand, the short-term downside risks for Chinese GDP growth are receding thanks to this catalyst. Note too, the positive impulse is likely to prove lasting as geopolitical uncertainty over energy supply produces a national imperative to reduce reliance on the Middle East, particularly amongst south-east Asia, Latin America and Africa, where Chinese firms are experiencing particularly rapid demand growth.
Indeed, the learnings from this crisis, and what is expected to be a favourable result from the May meeting between President Xi and President Trump, could also skew long-term risks for Chinese growth and sentiment to the upside. This is not to say that 5.0% growth is probable for 2026–2028, but rather that growth is increasingly likely to stabilise around 4.5% instead of 4.0%.
Attaining annual growth of 5.0% over successive years would require material gains for trade, industrial investment, property construction and household consumption. The latter would necessitate a dramatic turn in actual and expected wealth and sentiment, however. While not impossible, given the poor starting point on both fronts, this is best considered a low probability and long-coming upside risk.
Sooner than later though, the favourable shift in global opportunities and risks for China is likely to support stronger demand in Chinese financial instruments. Yields and credit spreads will remain compressed, enticing additional real economy investment, and equities should see sustained inflows of new capital.
Paired with continued strength in the trade balance and the returns from offshore investments currently being made by Chinese firms, demand for the renminbi will grow in depth and breadth. Given the diversity of Chinese interests across the globe, currency gains are expected on a trade-weighted basis but will be most acute bilaterally versus the US dollar – the only currency Chinese entities look to be reducing their exposure to. Importantly, trade-weighted currency gains are likely to be proportional to China’s competitiveness opportunities, and so should not materially narrow the current account.
This analysis was initially released in the April edition of Westpac Market Outlook.
Falling WTI Boosts Risk Appetite as Equities Rise and USD Falls
WTI price moves continued to lead most markets last week. Better sentiment around the Iran ceasefire pushed WTI lower from the start of the week, while the U.S. dollar weakened and global stock markets moved higher. Market focus stayed mainly on Iran developments, so economic data had less influence on overall price action.
The main economic highlights were lower-than-expected U.S. PPI and weaker U.S. industrial production data. Long-term U.S. interest rates also moved lower as Middle East tensions eased. At the same time, strong U.S. bank earnings supported the view that the U.S. economy is still holding up reasonably well.
Sentiment improved again toward the end of the week. On Friday, comments from the Iranian Foreign Minister that the Strait of Hormuz would remain “completely open” helped reduce market fears further. This pushed the U.S. dollar lower and helped equity markets finish the week with a strong rise.
Markets This Week
U.S. Stocks
U.S. equities posted another strong week, with Friday’s rally helping the market recover all of the losses seen at the start of the Iran conflict. However, weekend news about the closure of the Strait of Hormuz could lead to some pullback at the start of this week. As the two-week ceasefire moves closer to its end, markets may also become more cautious. Sentiment can still change quickly on any headline from U.S. or Iranian leaders, but for now, a sideways to slightly lower move looks more likely this week. Resistance levels are at 49,600, 50,000, 50,500 and 51,000. Support is seen at 48,500, 48,000, 47,000, 46,000, and 45,000.
Japanese Stocks
The Nikkei 225 moved back near the record highs seen earlier this year as tensions in Iran eased and the yen stayed weak. Comments from the Bank of Japan suggesting it may not raise interest rates at the April meeting also helped support stocks. The Nikkei has stayed strong in 2026, but after this latest rise, waiting for a pullback may still be the better strategy. Resistance is seen at 60,000, 60,500, 61,000, 61,500 and 62,000, while support is at 57,000, 56,000, 55,000, 54,000, and 52,000.
USD/JPY
USD/JPY moved lower last week as falling WTI prices and lower long-term U.S. interest rates put pressure on the pair, while resistance at 160 stayed strong. At the same time, the Bank of Japan remained cautious about raising interest rates, which helped buyers return when the pair dropped quickly on Friday. Overall, USD/JPY still looks stuck in a range with a slight downward bias, so range trading remains the better short-term approach. Resistance is at 160.00, 160.50, 162, and 165, while support is seen at 158.00, 157.50, 156.50 and 155.00.
Gold
After testing lower at the start of the week, gold rose steadily as lower long-term U.S. interest rates helped support the market. Trading conditions stayed fairly quiet as many traders focused more on other markets. Gold did meet resistance near the highs from early April, but the uptrend is still in place, so buying on dips remains the preferred strategy as the market moves toward a possible return to $5,000. Resistance is at $4,900, $5,000, and $5,100, while support is at $4,700, $4,600, $4,500, and $4,400.
Crude Oil
WTI moved lower through most of last week as the market reacted to ongoing negotiations to end the war in Iran. Friday’s news that the Strait of Hormuz had reopened added more pressure and encouraged stronger selling. However, weekend reports of another closure are likely to bring buyers back at the start of the week, as the Middle East situation remains very unstable. Headlines will continue to move WTI sharply, but with hopes that the war may eventually move toward an end, selling into strong rallies may be the better strategy this week. Resistance is at $90, $95, $100, $110, and $120, while support is at $80, $75, $70, and $67.5.
Bitcoin
Improved risk sentiment as tensions in Iran eased helped give buyers more confidence, pushing Bitcoin above resistance at $75,000. The market has now broken out of the $65,000 to $75,000 range, and the 10-day moving average is turning higher. For now, buying on dips looks like the better strategy. Resistance is at $80,000, $85,000, and $90,000 while support is at $75,000, $65,000, $60,000, and $55,000.
This Week’s Focus
- Monday: None
- Tuesday: Japan Adjusted Trade Balance, U.K Unemployment Rate, E.U ZEW Economic Sentiment, U.S. Retail Sales and Pending Home Sales
- Wednesday: Japan Trade Balance, U.K. CPI and PPI
- Thursday: Japan S&P Global Services PMI, Australia Unemployment Rate, E.U. HCOB Eurozone Manufacturing PMI, U.K. S&P Global Manufacturing PMI, U.S. S&P Global Manufacturing PMI
- Friday: Japan National Core CPI, U.K. Retail Sales, U.S. Michigan Consumer Sentiment
Weekend news about the renewed closure of the Strait of Hormuz is likely to create a busy start to the week and reduce hopes that the conflict in Iran will end quickly. Markets are expected to stay focused on WTI price moves and react quickly to new headlines. U.S. retail sales and consumer confidence may also affect sentiment, as traders watch whether higher oil prices are starting to hurt the consumer outlook and broader economic expectations.
Eco Data 4/20/26
| GMT | Ccy | Events | Act | Cons | Prev | Rev |
|---|---|---|---|---|---|---|
| 22:45 | NZD | Trade Balance (NZD) Mar | 698M | 175M | -257M | -365M |
| 01:00 | CNY | 1-y Loan Prime Rate | 3.00% | 3.00% | 3.00% | |
| 01:00 | CNY | 5-y Loan Prime Rate | 3.50% | 3.50% | 3.50% | |
| 04:30 | JPY | Tertiary Industry Index M/M Feb | -0.40% | -0.40% | 1.70% | 2.00% |
| 06:00 | EUR | Germany PPI M/M Mar | 2.50% | 1.40% | -0.50% | |
| 06:00 | EUR | Germany PPI Y/Y Mar | -0.20% | -3.30% | ||
| 12:30 | CAD | CPI M/M Mar | 0.90% | 1.10% | 0.50% | |
| 12:30 | CAD | CPI Y/Y Mar | 2.40% | 2.50% | 1.80% | |
| 12:30 | CAD | CPI Median Y/Y Mar | 2.30% | 2.40% | 2.30% | |
| 12:30 | CAD | CPI Trimmed Y/Y Mar | 2.20% | 2.30% | 2.30% | |
| 12:30 | CAD | CPI Common Y/Y Mar | 2.60% | 2.60% | 2.40% | |
| 14:30 | CAD | BoC Business Outlook Survey |
| 22:45 | NZD |
| Trade Balance (NZD) Mar | |
| Actual | 698M |
| Consensus | 175M |
| Previous | -257M |
| Revised | -365M |
| 01:00 | CNY |
| 1-y Loan Prime Rate | |
| Actual | 3.00% |
| Consensus | 3.00% |
| Previous | 3.00% |
| 01:00 | CNY |
| 5-y Loan Prime Rate | |
| Actual | 3.50% |
| Consensus | 3.50% |
| Previous | 3.50% |
| 04:30 | JPY |
| Tertiary Industry Index M/M Feb | |
| Actual | -0.40% |
| Consensus | -0.40% |
| Previous | 1.70% |
| Revised | 2.00% |
| 06:00 | EUR |
| Germany PPI M/M Mar | |
| Actual | 2.50% |
| Consensus | 1.40% |
| Previous | -0.50% |
| 06:00 | EUR |
| Germany PPI Y/Y Mar | |
| Actual | -0.20% |
| Consensus | |
| Previous | -3.30% |
| 12:30 | CAD |
| CPI M/M Mar | |
| Actual | 0.90% |
| Consensus | 1.10% |
| Previous | 0.50% |
| 12:30 | CAD |
| CPI Y/Y Mar | |
| Actual | 2.40% |
| Consensus | 2.50% |
| Previous | 1.80% |
| 12:30 | CAD |
| CPI Median Y/Y Mar | |
| Actual | 2.30% |
| Consensus | 2.40% |
| Previous | 2.30% |
| 12:30 | CAD |
| CPI Trimmed Y/Y Mar | |
| Actual | 2.20% |
| Consensus | 2.30% |
| Previous | 2.30% |
| 12:30 | CAD |
| CPI Common Y/Y Mar | |
| Actual | 2.60% |
| Consensus | 2.60% |
| Previous | 2.40% |
| 14:30 | CAD |
| BoC Business Outlook Survey | |
| Actual | |
| Consensus | |
| Previous | |