
Sample Category Title
Markets Are Celebrating… Right Before a Shock?
US Dollar
Over the past two weeks, the US dollar has fallen to its lowest level since early March, giving back almost all the gains made since the start of the armed conflict in the Middle East. Talks with Iran are set to resume in the coming days. Donald Trump continues to insist that the war will end soon and that an extension of the ceasefire will not be necessary. Coupled with record highs in US stock indices, this is contributing to the continued rally in EURUSD, as geopolitics has ceased to support the greenback, bringing macroeconomics back into focus.
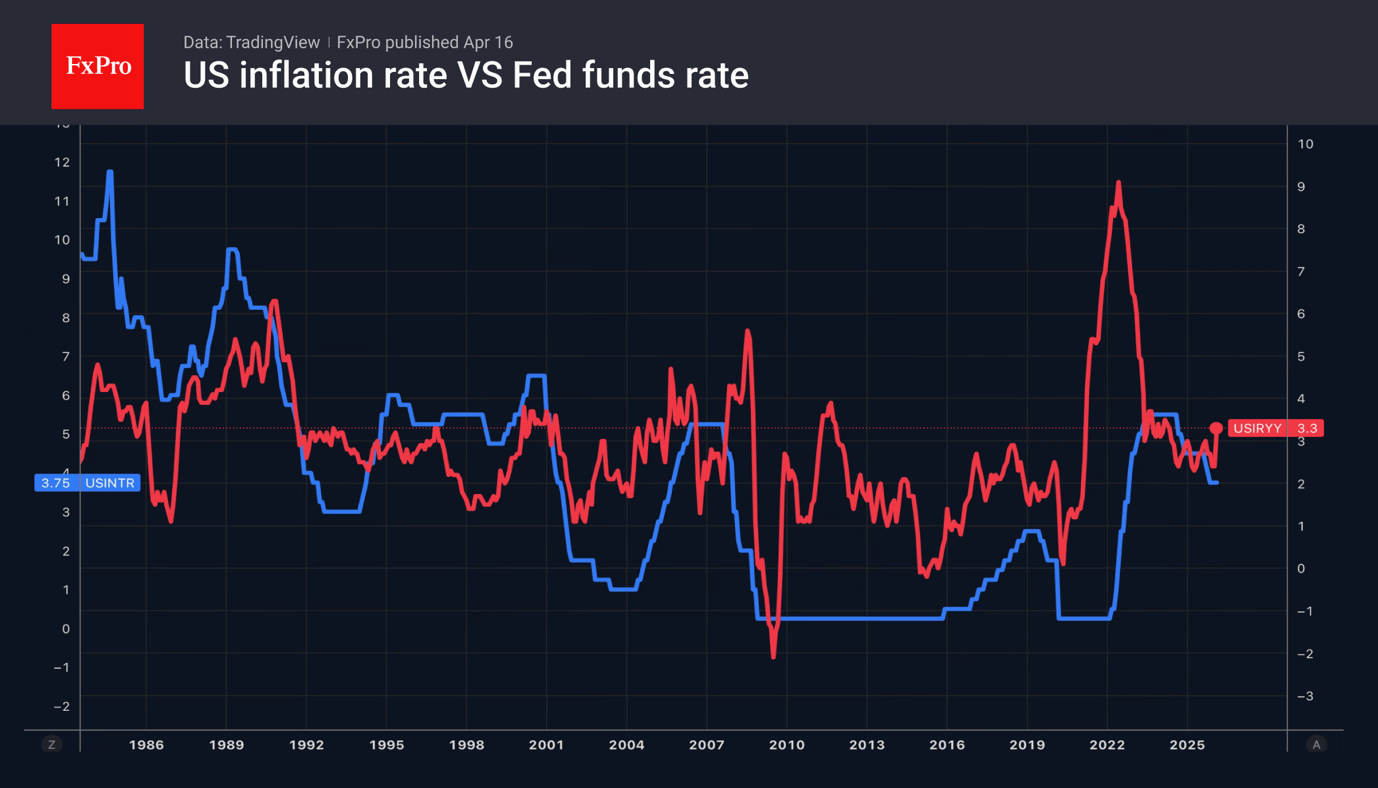
Investors’ attention has also shifted to corporate earnings reports and Congress’s deliberations on Kevin Warsh’s nomination for the post of Fed Chair. Contrary to Trump’s promises, the replacement of the Fed Chair may coincide with accelerating inflation driven by rising oil prices, requiring a tightening of monetary policy. What will Warsh choose? To justify the president’s trust or to demonstrate the central bank’s independence and stick to its principles?
Investors are drawing parallels with the 1970s, when an inflationary shock amid the oil crisis saw the Fed chair, who was loyal to the White House, ease monetary policy. The rate cuts resulted in an even sharper rise in consumer prices and reinforced high inflation expectations. At that time, the US dollar collapsed. It was only after a change in central bank leadership and aggressive monetary tightening, despite the recession, that the dollar began a steady rise from the summer of 1980.
Stock indices
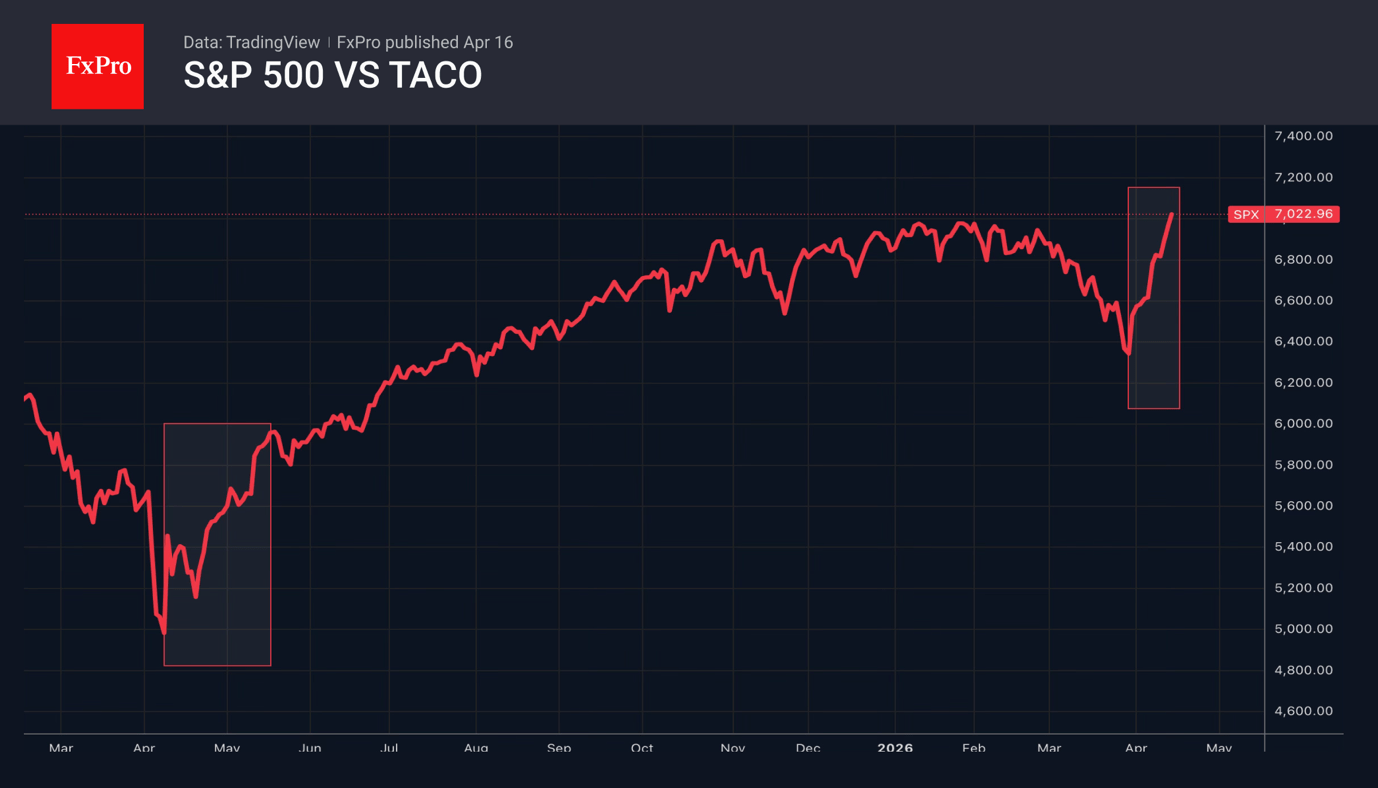
Confidence in an approaching end to the war in the Middle East, the resilience of the US economy to geopolitical shocks, and expectations of a strong first-quarter earnings season enabled the S&P 500 to surpass the January record highs.
About a year ago, after the White House introduced tariffs, the broad stock index first fell and then surged as Trump Chickens Out. Nowadays, since late March, the fear of missing out on TACO has been driving strong volumes, as investors who missed last year’s rally rush to catch up.
Usually, such sharp surges occur from the very bottom of a bear market. This time, the S&P 500 has lost less than 10% from its January highs. So, it has not even been officially called a correction. Something similar occurred only in March 2000, on the eve of the dot-com bubble bursting. For history to repeat itself, an escalation of the conflict in the Middle East would be required, which seems unlikely.
Gold
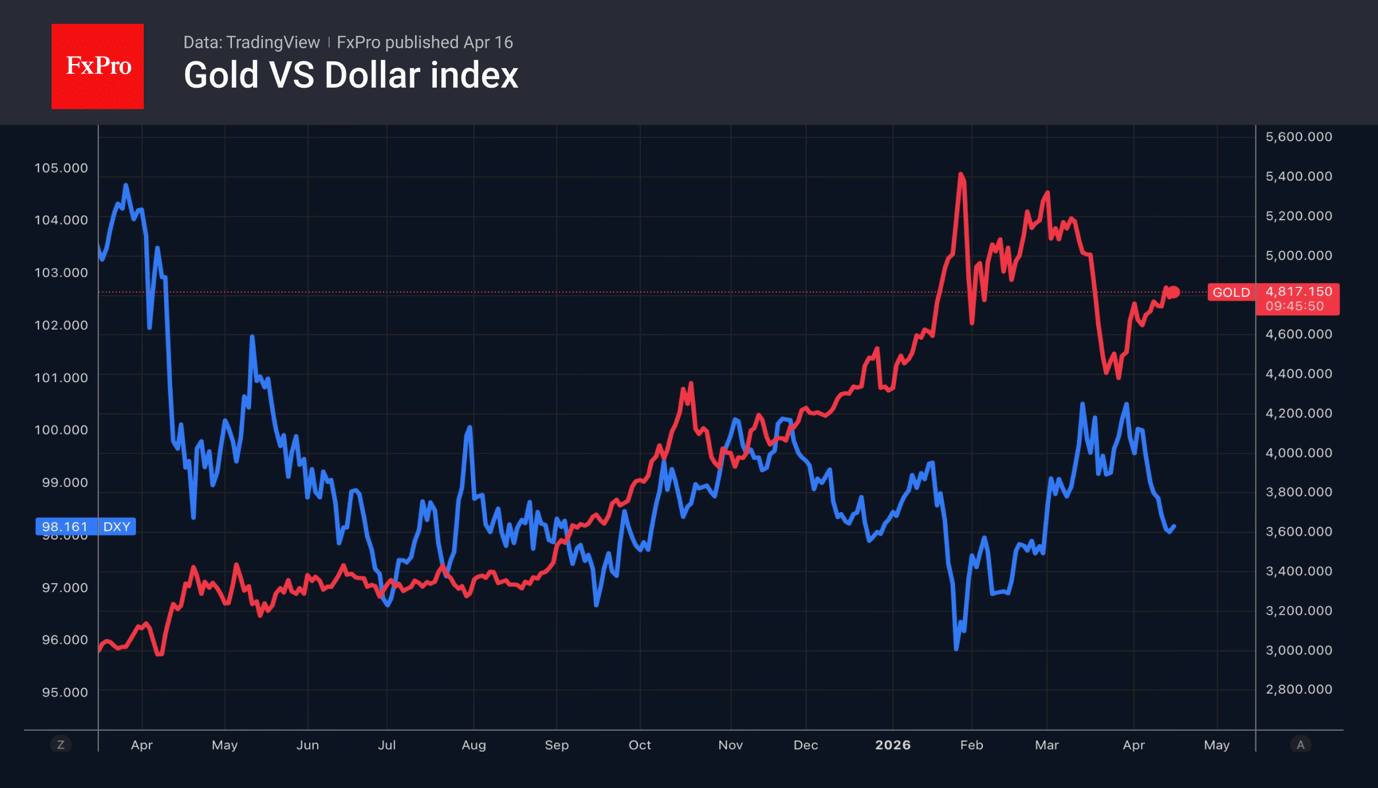
Gold is slowly but surely recouping its losses on expectations that a peace deal between the US and Iran will bring down oil prices. This will curb inflation and dampen central banks’ appetite for tightening monetary policy. Fears on this front led to a decline in gold prices during the Middle East conflict. Now that Bloomberg has reported that the parties are ready to extend the ceasefire agreement, the situation has done a complete U-turn.
The precious metal will be supported by uncertainty over White House policy and the associated decline in confidence in the US dollar. Donald Trump has resumed his attacks on Jerome Powell. The US president intends to sack the Fed chair if he remains on the FOMC after his term ends. The Republican claims that interest rates will start to fall as soon as Kevin Warsh takes the helm of the central bank. He will have to face a confirmation hearing in Congress.
The revival of the idea of easing the Fed’s monetary policy, driven by the weakness of the US economy or the new Fed Chair, will act as a tailwind for gold.
Crypto
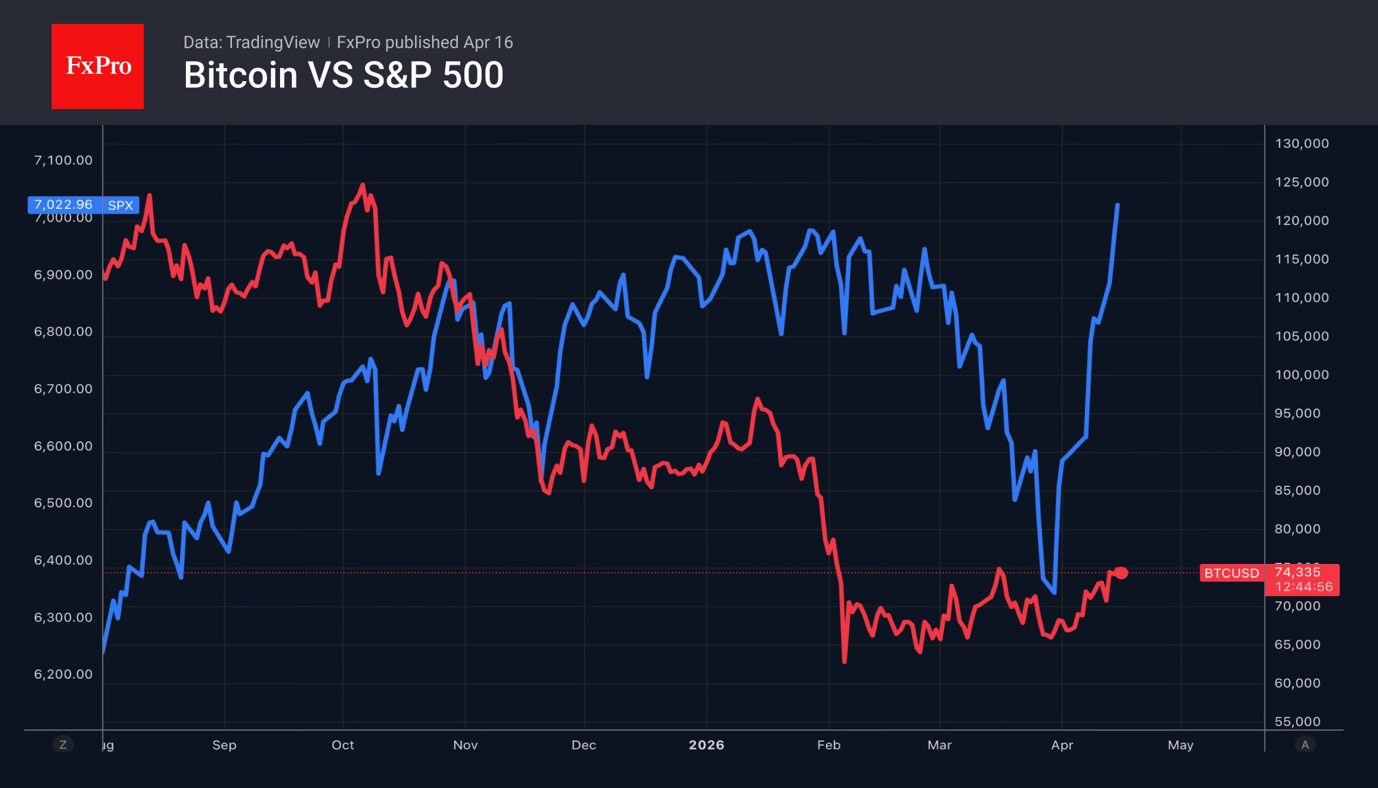
The de-escalation of the conflict has triggered a rally in Bitcoin. However, Bitcoin is not rising as quickly as the US stock indices. There is a view that the factor holding back the upward movement is Congress’s consideration of the Clarity Act, which would regulate the circulation of cryptocurrencies. As soon as lawmakers approve it, enthusiasts expect a rally in digital assets.
However, the market situation has actually changed significantly. Over the last couple of years, its structure has shifted. Whereas crypto-whales previously dominated, their share is now declining. The proportion of institutional investors is growing, leading to lower volatility and limiting the potential for a Bitcoin rally.
Miners’ approach to the business is also changing. The cost of electricity for Bitcoin mining is higher than for artificial intelligence data centres. CoinShares forecasts that data centres’ profitability will rise from 30% to 70% by the end of the year. This increases the likelihood that crypto miners will sell their tokens, thereby holding back BTC.
What next?
The ceasefire in the Middle East expires on the 21st of April. Investors will be watching closely for its extension, with a view to peace negotiations between the US and Iran. De-escalation of the conflict is the base-case scenario. In the event of an escalation, demand for the US dollar will surge.
Congress’s consideration of Kevin Warsh’s nomination for the post of Fed Chair could turn into a real thriller. Not all Republicans are prepared to support Donald Trump’s choice.
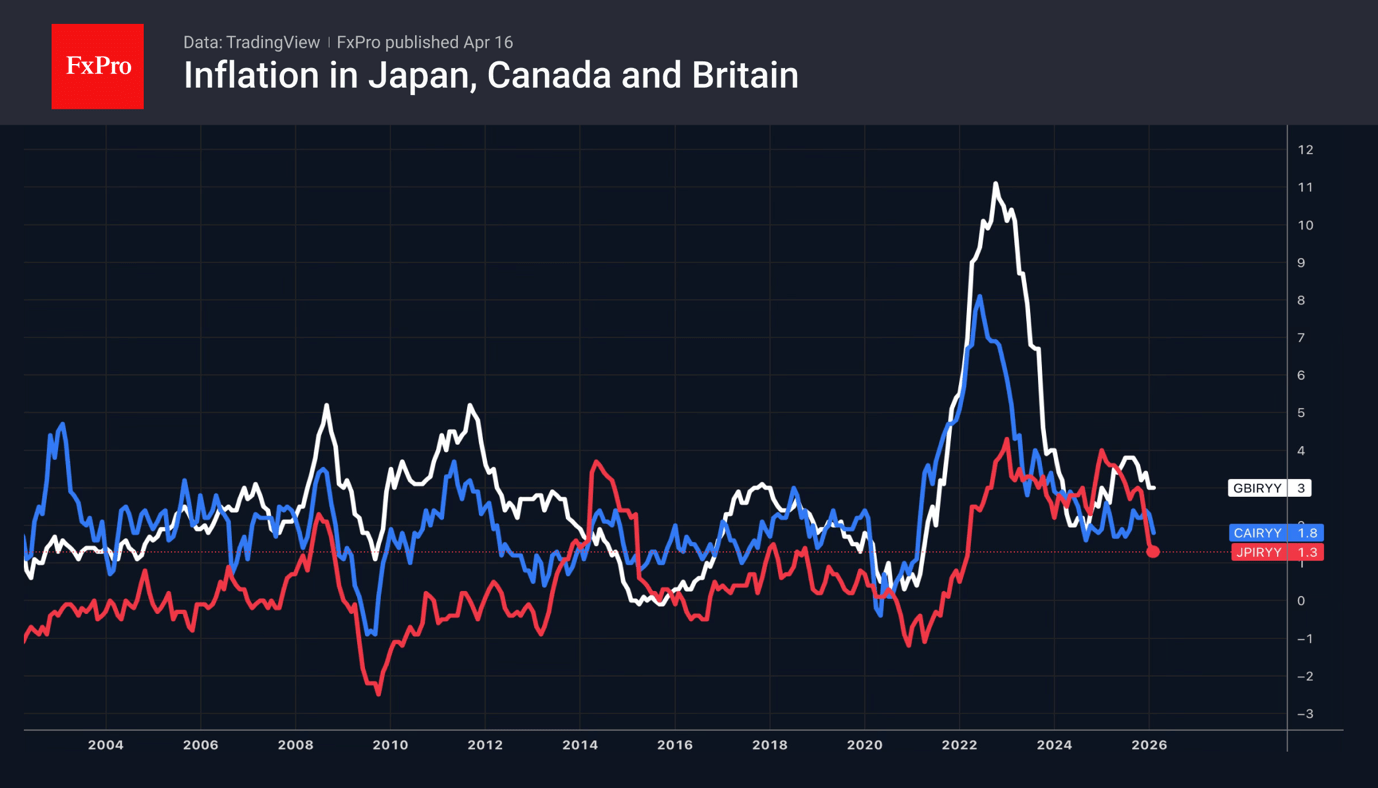
Investors will be keeping a close eye on the corporate earnings season and the economic calendar. Inflation data from Canada, the UK and Japan will help gauge the impact of high oil prices on the CPI and offer clues about central banks’ next steps on monetary policy. It will be quite interesting to observe the Forex market’s reaction to reports on business activity in European countries and the US, as well as to the release of US retail sales data for March.
Nasdaq 100 Gap-Down Stalled Above 26,288/142 Key Support, Bulls Still in Control
Key takeaways
- Bullish trend intact despite volatility: The Nasdaq 100 has led the post-ceasefire rally, breaking to new highs, and remains in a bullish structure even after a gap-down driven by renewed US–Iran tensions.
- Strong market breadth supports upside: A sharp improvement in breadth, more stocks trading above key moving averages, confirms broad participation and reinforces the sustainability of the uptrend.
- Key support holding keeps bulls in control: The index is stabilising above the critical 26,288/26,142 support zone; holding this level maintains upside potential toward 26,700–27,380, while a break below risks a deeper corrective pullback.
Risk assets, particularly global equities, staged a sharp bullish reversal on 8 February 2026 following the US–Iran temporary ceasefire, which paused the six-week conflict and raised hopes of a broader peace deal. The high-beta, tech-heavy Nasdaq 100 led the rally, reversing an earlier 8% loss to post a 6.9% gain (from the 27 February 2026 pre-war baseline to 17 April 2026) and breaking above its previous all-time high set on 29 October 2025 (see Fig. 1).
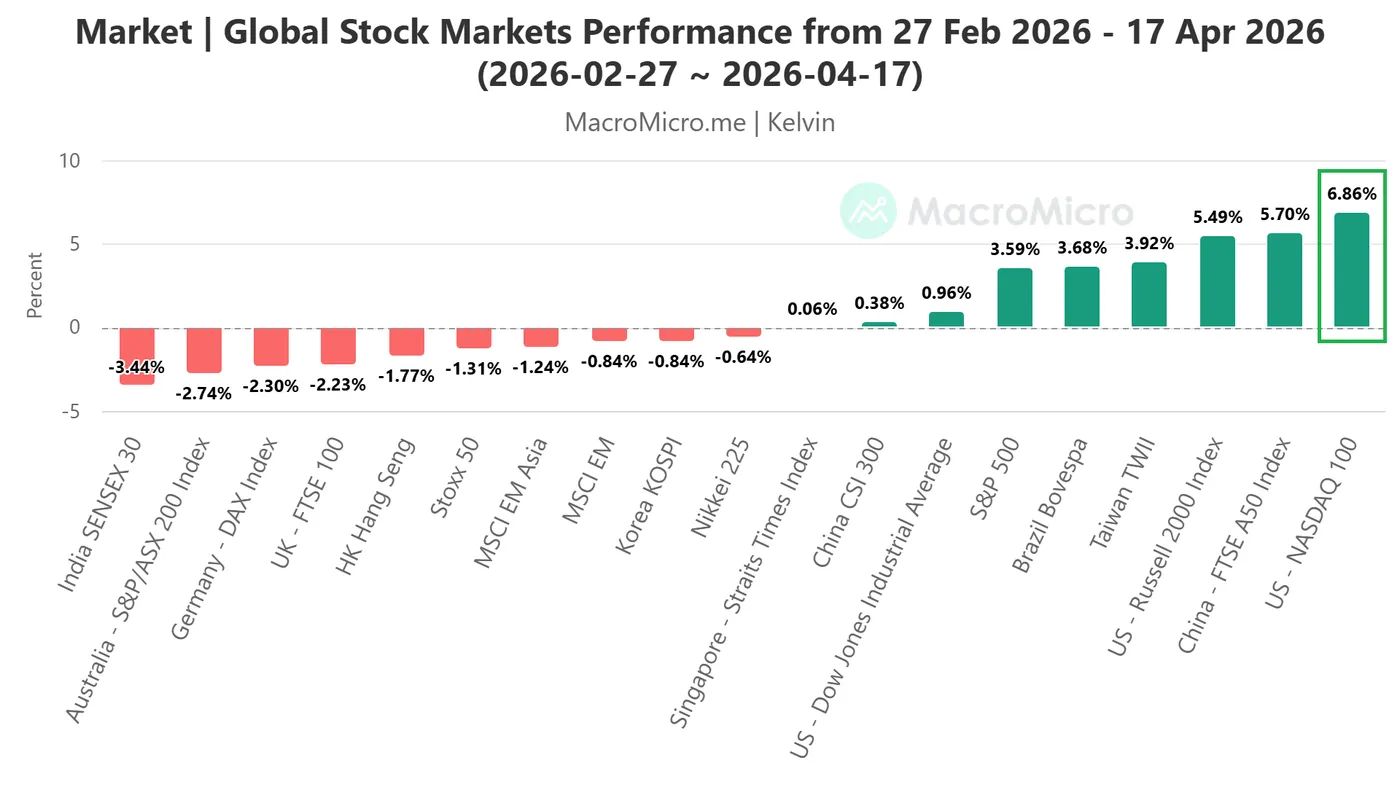
Fig. 1: Global benchmark stock indices performances from 27 Feb 2026 to 17 Apr 2026 (Source: MacroMicro).
Nasdaq 100’s market breadth has improved significantly
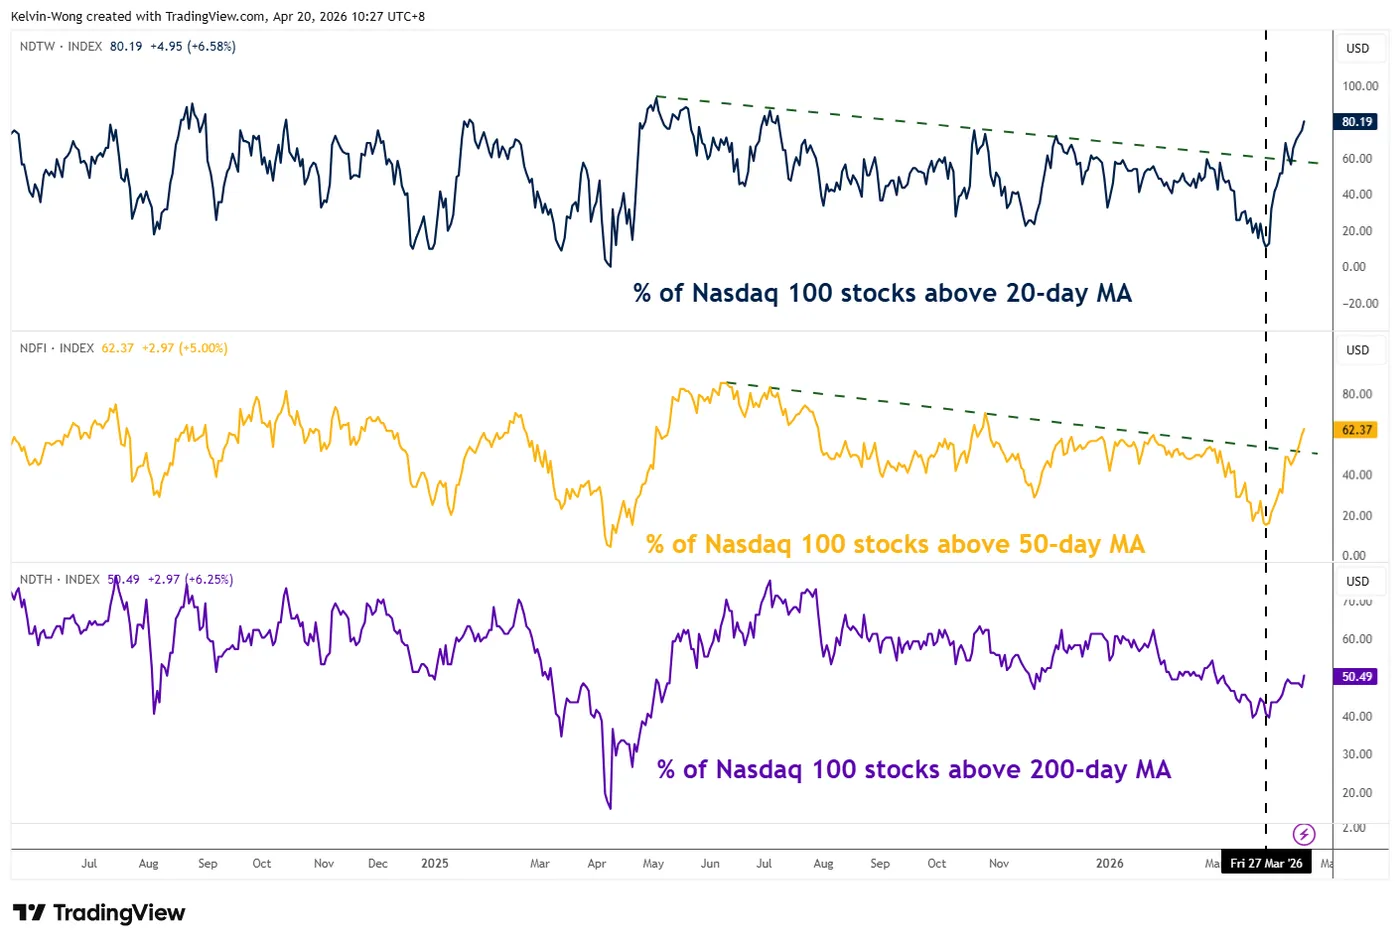
Fig. 2: Percentage of Nasdaq 100 stocks trading above 20-day, 50-day & 200-day moving averages as of 17 Apr 2026 (Source: TradingView).
Over the past five trading sessions, market breadth within the Nasdaq 100 has strengthened markedly, reinforcing the ongoing bullish trend.
The share of component stocks trading above their 20-day and 50-day moving averages has surged from 11% and 15% on 27 March 2026 to 80% and 62%, respectively, as of 17 April 2026 (see Fig. 2).
Similarly, the proportion of stocks above the key 200-day moving average has risen to 50% from 40% over the same period.
Let's now focus on the short-term trajectory (1 to 3 days) of the US Nasdaq 100 CFD index and its supporting elements from a technical analysis perspective.
Nasdaq 100 – Gapped down but found support at 26,288/142
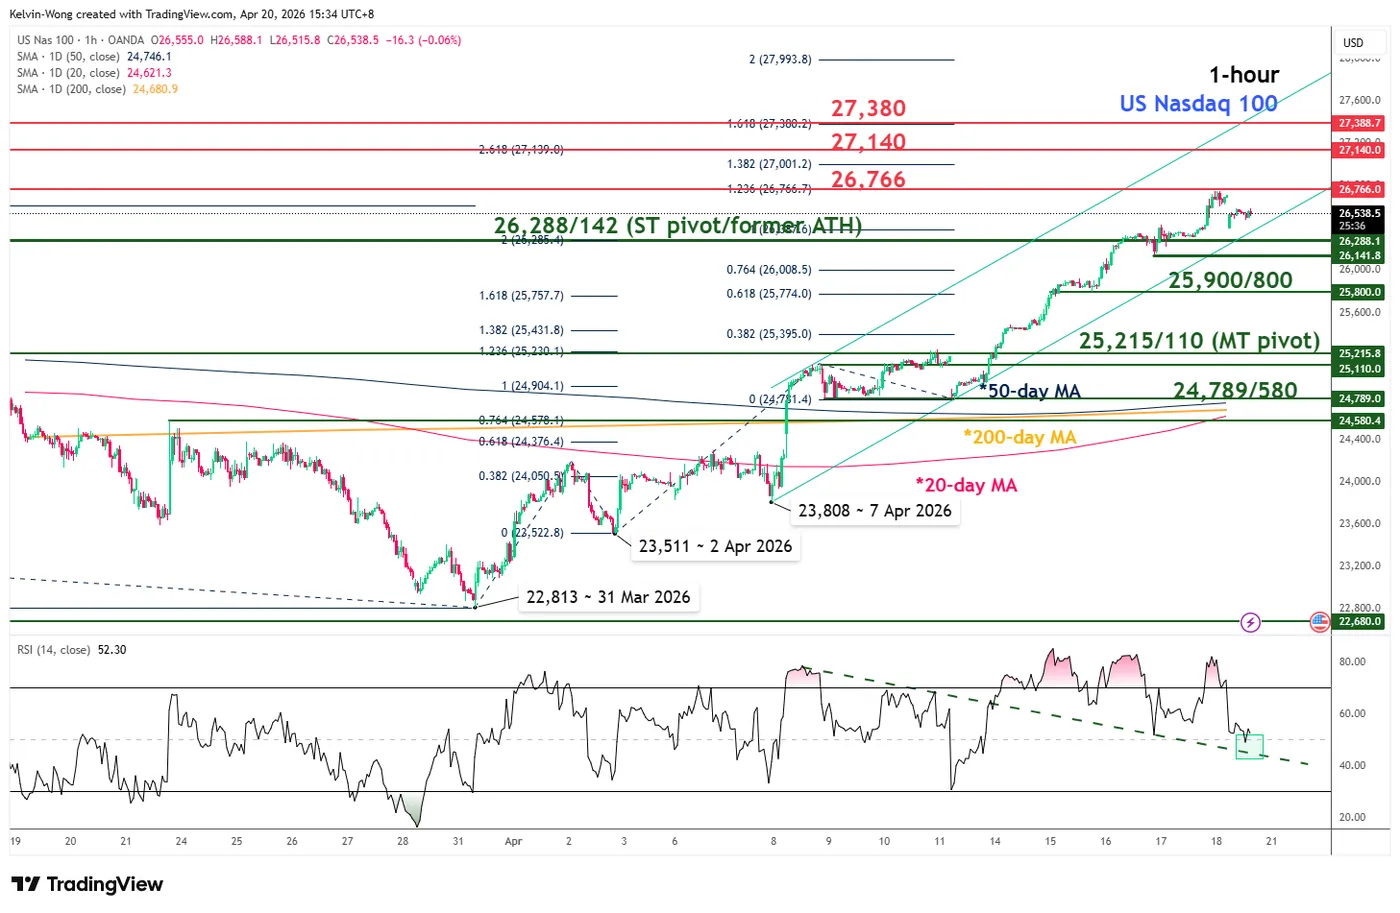
Fig. 3: US Nasdaq 100 CFD index minor trend as of 20 Apr 2026 (Source: TradingView).
The index gapped down by 1.1% at the open of the Asian session on Monday, 20 April 2026, as renewed hostilities in the Strait of Hormuz saw Tehran target vessels and reimpose controls, underscoring a highly fluid US–Iran conflict.
In response, the US Navy engaged and seized an Iranian-flagged cargo ship in the Gulf of Oman, casting fresh doubt over the ceasefire set to expire on Tuesday night (US time).
While US Vice President JD Vance is expected to lead another round of peace talks, Iranian state media reports no plans for participation. Notably, the US Nasdaq 100 CFD index managed to stabilise around its former all-time high of 26,288 at this time of writing.
The price actions of the US Nasdaq 100 CFD index (a proxy of the Nasdaq 100 E-mini futures) have continued to oscillate within a minor ascending channel in place from the 7 April 2026 low of 23,808.
Watch the 26,288/26,142 key short-term pivotal support to maintain its minor bullish acceleration phase for the next intermediate resistances to come in at 26,776, 27,140, and 27,380 (see Fig. 3).
On the flip side, a break and an hourly close below 26,142 invalidates the bullish tone for a minor corrective decline to retest the next intermediate support at 25,900/800. Below 25,800 opens scope for a deeper slide towards the 25,215/25,110 medium-term pivotal support area.
Key elements to support the near-term bullish bias on the Nasdaq 100
- Its price actions have traded above 20-day, 50-day, and 200-day moving averages since 8 April 2026. In addition, the 20-day moving average is now shaping a potential bullish crossover condition above the 50-day and 200-day moving averages.
- The hourly RSI momentum indicator has continued to exhibit a bullish momentum condition above its pull-back support at the 44 level.
- Elliot Wave Theory suggests the recent rally from the 2 April 2026 low of 23,511 is likely considered as a minor bullish impulsive wave three structure with its potential terminal zone at 27,140/27,380 (Fibonacci extension cluster from and the upper boundary of the minor ascending channel).
Iran and US Reaching a Mutually Acceptable Deal isn’t as Evident as was Suggested
Markets
Market rallied last Friday after Iran’s foreign minister declared the Strait of Hormuz ‘completely open’. At the same time other US (including President Trump) and non-US sources suggested that a deal on the nuclear program could be within reach.. Brent oil temporary dropped below the $90/b mark (close $90.4). The three major US equity indices (Dow, S&P 500 & Nasdaq) all closed at new historic top levels. The Eurostoxx 50 isn’t at that point yet, but also added 2%+ to close at 6057,71. Even as a return to normalcy in energy supply would still take quite a long time, even in case of an agreement, interest rate markets further priced out central bank rate hike probabilities as an oil price (well?) below $100/b provides time to assess potential long-lasting inflationary effects. US yields eased between 7.2 bps (5-y) and 4.9 bps (30-y). EMU interest rate markets outperformed with Bund yields tumbling between 10.9 bps (2-y) and 5 bps (30-y). Money markets almost fully priced out any probability of an ECB rate hike next week and see less than two 25 bps rate hikes by the end of the year (+/- 38 bps discounted). The dollar initially declined sharply on the overall optimism with DXY temporary tumbling below 98 and EUR/USD reaching the 1.185 area. However, the US currency soon regained ground to close little changed (EUR/USD 1.1765; DXY 98.10).
The weekend showed that the optimism on Iran and the US reaching a mutually acceptable deal isn’t as evident as was suggested on Friday. Iran isn’t prepared to meet the US conditions on its nuclear program and the Strait of Hormuz de facto proved not to be (‘completely’) open. The situation further escalated as the US seized an Iranian ship in the Gulf of Oman clouding the prospects for new talks between the US and Iran that were hoped to take place ahead of the ceasefire deadline Tuesday evening. US president Trump even repeated his threat that the US might attack Iran infrastructure if no deal is reached. From a market point of view, trading is again heading for a period of limited visibility going into the ceasefire deadline of Tuesday evening. Even so, the reaction on Asian (equity) markets this morning remains orderly. Most indices even trade with, admittedly way smaller, gains compared to the US and Europe on Friday (e.g. Nikkei + 0.57%). US yields are rebounding 1.5-2.5 bps across the curve. ST EMU yields add up to 5 bps. Brent oil returns to $95/b. Interest rate markets still hold the view that oil prices sub $100/b give central banks time to assess the impact of current developments. The dollar regains some further ground (DXY 98.35; EUR/USD 1.175). Trading will probably again be driven by headlines on the Middle East conflict. Markets still take the working assumption that the parties will try to avoid an outright new military escalation. Aside from the conflict in the Middle East, the eco calendar is thin today. We keep an eye at the appearance of UK PM Starmer to the House of Commons on the appointment of Peter Mandelson as US Ambassador, which might raise pressure on his position as PM. EUR/GBP sticks just above 0.87.
News & Views
Rating agency Moody’s stripped Belgium of its Aa3 rating, downgrading it to A1 with a stable outlook. It shadows the decision by Fitch last year which was the first (ever) of the big three rating agencies to lower the rating below “AA” category. Moody’s decision reflects three interrelated developments that relate to the fiscal outlook, growth perspectives and Belgium’s institutional set-up (the year-end 2025 budget process showed the limits of politically possible fiscal consolidation). Modest medium-term growth, higher interest expenses and structural increases in expenditure due to the social risks associated with ageing as well as defence have compounded an already-challenging government budget picture. Under Moody’s baseline, fiscal deficits remain high at around 5% of GDP. Debt-to-GDP is increasing despite significant consolidation measures that have been undertaken by the government. The rating agency projects debt to rise to 116% of GDP by 2030 from 104% in 2024. Trend growth will remain well below the average growth rate of around 1.5% over 2010–2019, pointing to a structurally weaker growth environment than the one that supported Belgium's fiscal profile in the past.
The Wall Street Journal reports that the United Arab Emirates opened talks with US Treasury Secretary Bessent on the idea of an FX swap line. Such financial backstop isn’t needed at the time, but there’s concern that the war could inflict major damage on its economy (damaged energy infrastructure and inability to transit Hormuz) and its position as a global financial hub, depleting foreign reserves and triggering a money drain. According to officials cited by the WSJ, Emirati officials also told US officials that if the UAE runs short of dollars, it may be forced to use Chinese yuan or other countries’ currencies for oil sales and other transactions..
EUR/USD Daily Outlook
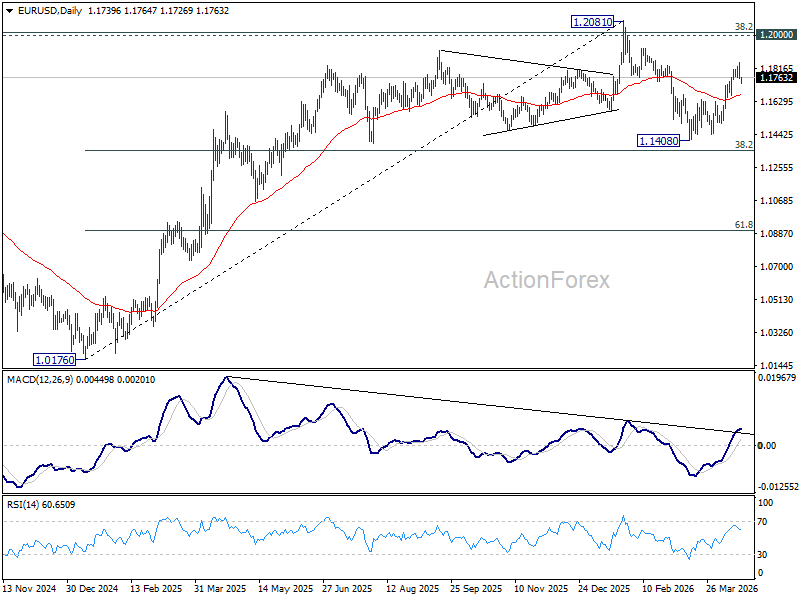
Daily Pivots: (S1) 1.1733; (P) 1.1792; (R1) 1.1823; More….
Intraday bias in EUR/USD remains neutral for the moment, and some consolidations would be seen below 1.1848. Further rally is in favor as long as 1.1662 support holds. On the upside, sustained trading above 61.8% retracement of 1.2081 to 1.1408 at 1.1824 will pave the way to retest 1.2081 high. However, firm break of 1.1662 support will bring deeper decline back towards 1.1408 low instead.
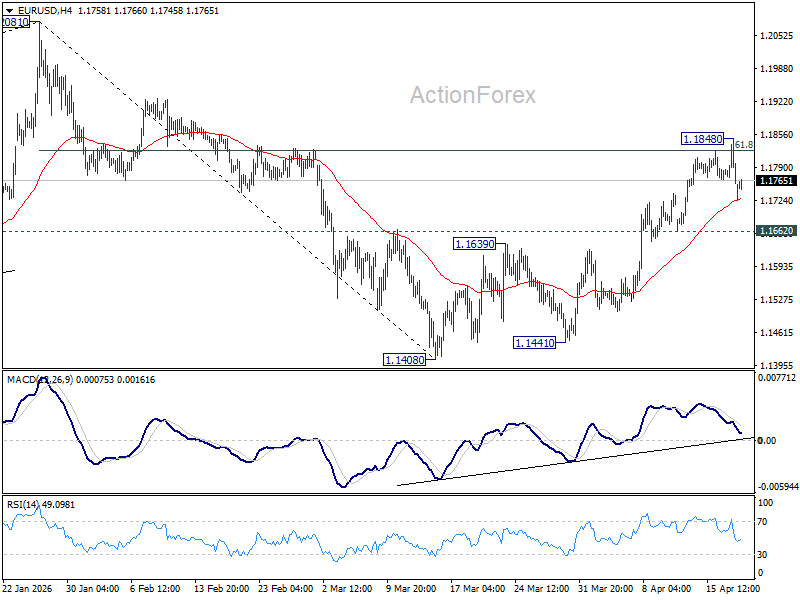
In the bigger picture, the strong support from 38.2% retracement of 1.0176 to 1.2081 at 1.1353 suggests that the pullback from 1.2081 is more likely a corrective move. Strong support was also found in 55 W EMA (now at 1.1507). Focus is back on 1.2 key cluster resistance level. Decisive break there will carry long term bullish implications. Nevertheless, break of 1.1408 support will revive the case of medium term bearish trend reversal.
USD/JPY Daily Outlook
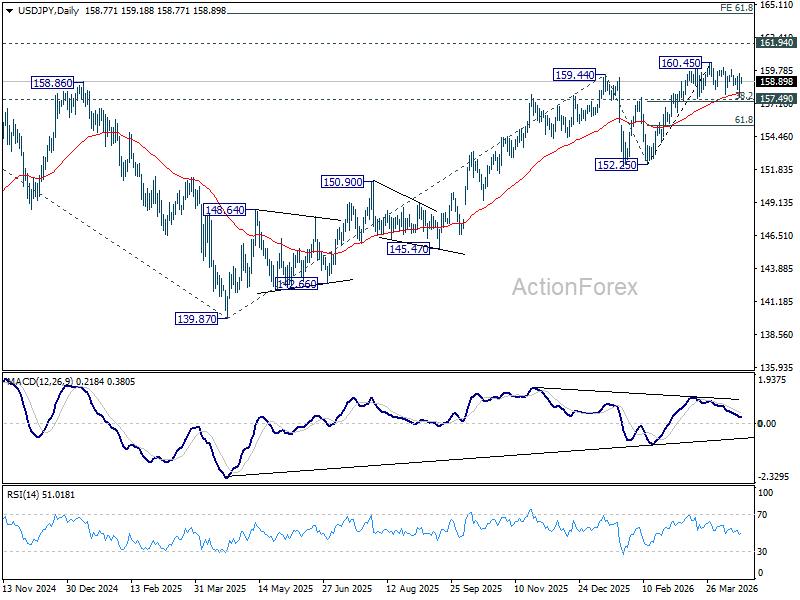
Daily Pivots: (S1) 157.63; (P) 158.58; (R1) 159.56; More...
Range trading continues in USD/JPY and intraday bias stays neutral. Further rise is expected with 157.49 cluster support (38.2% retracement of 152.25 to 160.45 at 157.31) intact. On the upside break of 160.45 will target a retest on 161.94 high. However, firm break of 157.31/49 will bring deeper fall back to 61.8% retracement at 155.38 next.
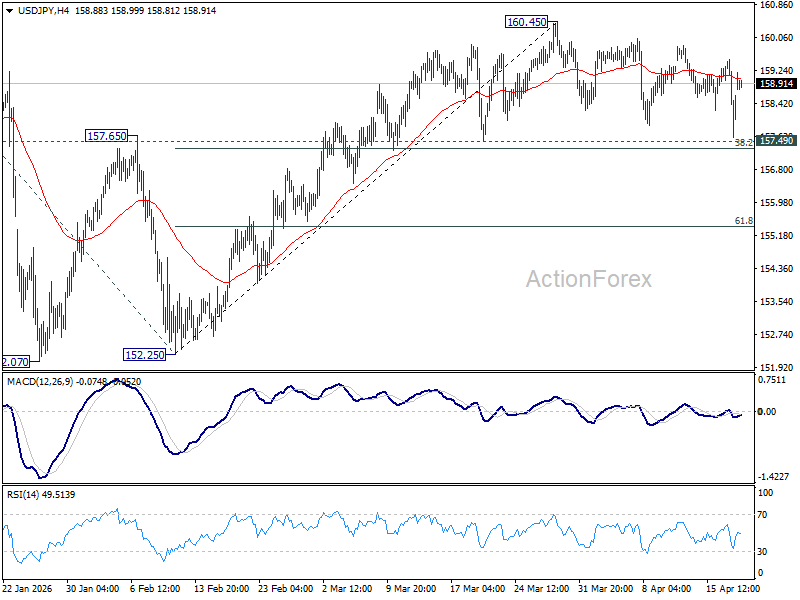
In the bigger picture, outlook is unchanged that corrective pattern from 161.94 (2024 high) should have completed with three waves at 139.87. Larger up trend from 102.58 (2021 low) could be ready to resume through 161.94. This will remain the favored case as long as 55 W EMA (now at 153.80) holds. Firm break of 161.94 will pave the way to 61.8% projection of 102.58 to 161.94 from 139.87 at 176.75.
GBP/USD Daily Outlook
Daily Pivots: (S1) 1.3480; (P) 1.3540; (R1) 1.3575; More...
Intraday bias in GBP/USD remains neutral for the moment. Further rise is in favor as long as 1.3379 support holds. Sustained break of 61.8% retracement of 1.3867 to 1.3158 at 1.3596 will pave the way to retest 1.3867 high. However, firm break of 1.3379 will bring deeper fall back to 1.3158 low instead.
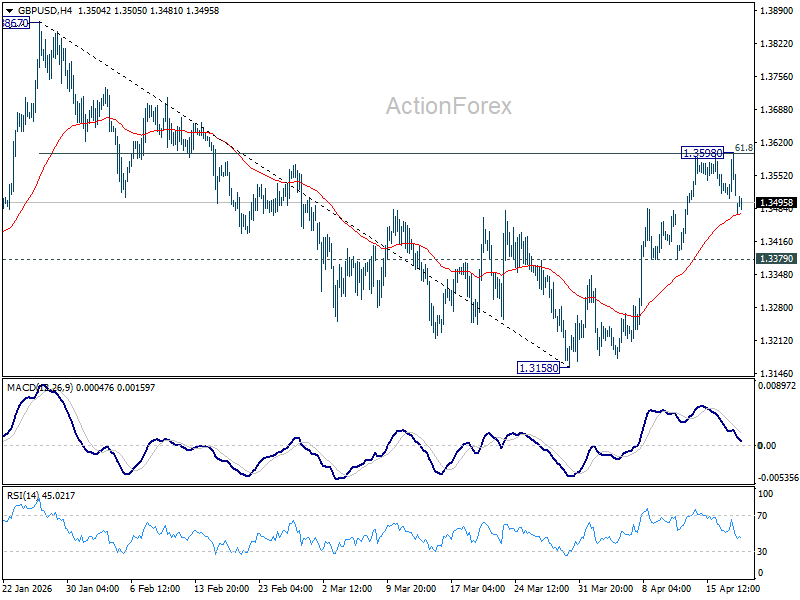
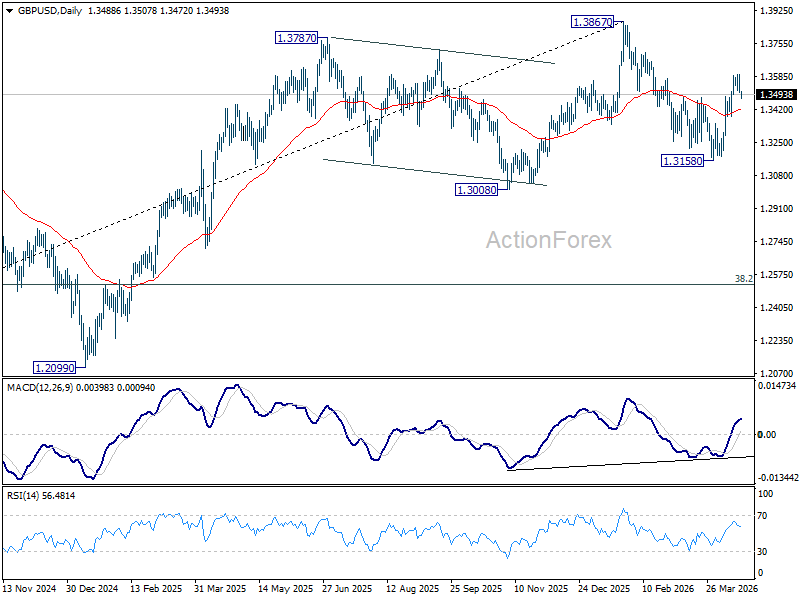
In the bigger picture, current development suggests that price actions from 1.3867 are merely a corrective pattern within the broader up trend from 1.0351 (2022 low). With 1.3008 support intact, medium term bullishness is maintained and break of 1.3867 is back in favor for a later stage, towards 1.4248 key resistance (2021 high).
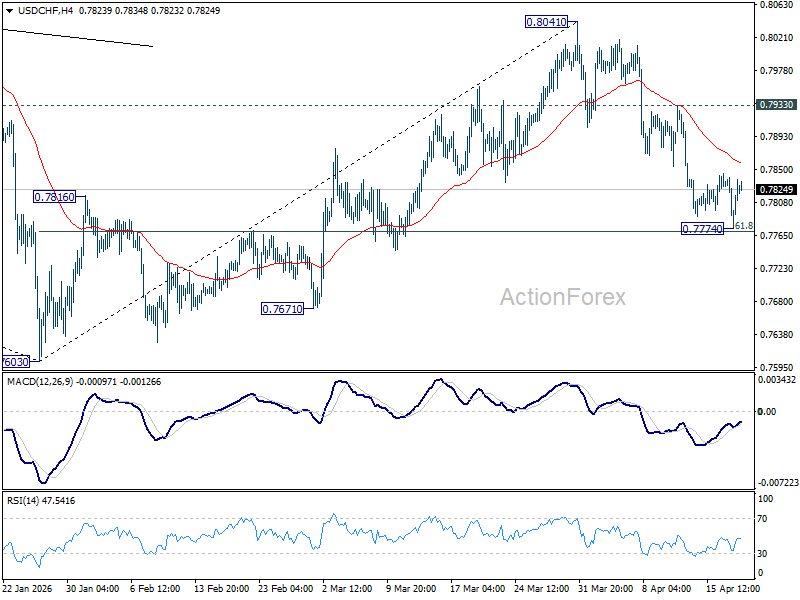
USD/CHF Daily Outlook
Daily Pivots: (S1) 0.7780; (P) 0.7811; (R1) 0.7847; More….
Intraday bias in USD/CHF is turned neutral with current recovery and some consolidations could be seen above 0.7774 temporary low. Upside should be limited below 0.7933 resistance to bring another fall. Sustained break of 61.8% retracement of 0.7603 to 0.8041 at 0.7770 will pave the way to retest 0.7603 low.
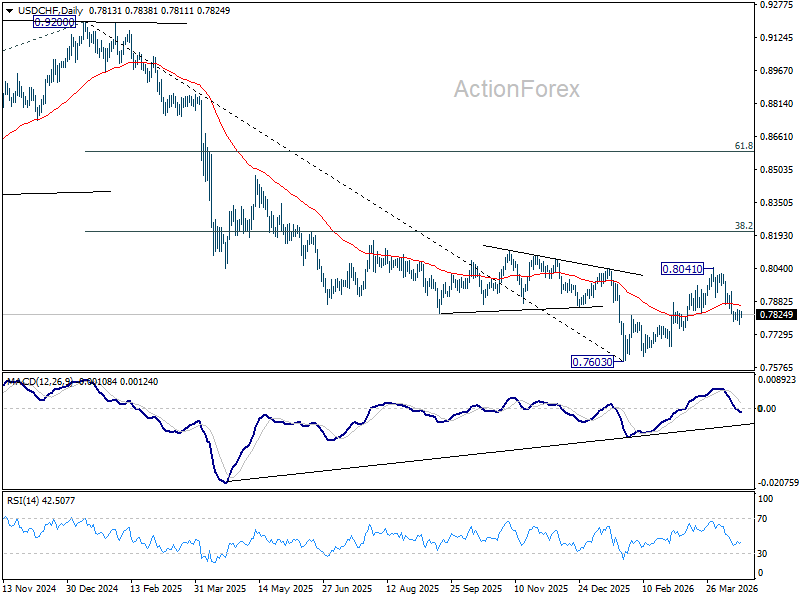
In the bigger picture, rebound from 0.7603 medium term bottom is seen as correcting the fall from 0.9200 only. Rejection by 55 W EMA (now at 0.8059) will affirm this bearish case, and setup down trend resumption to 100% projection of 1.0146 (2022 high) to 0.8332 from 0.9200 at 0.7382 at a later stage. Though, sustained break of 55 W EMA will suggest that it's probably correcting the larger scale down trend from 1.0146 (2022 high).
USD/CAD Daily Outlook
Daily Pivots: (S1) 1.3657; (P) 1.3684; (R1) 1.3720; More...
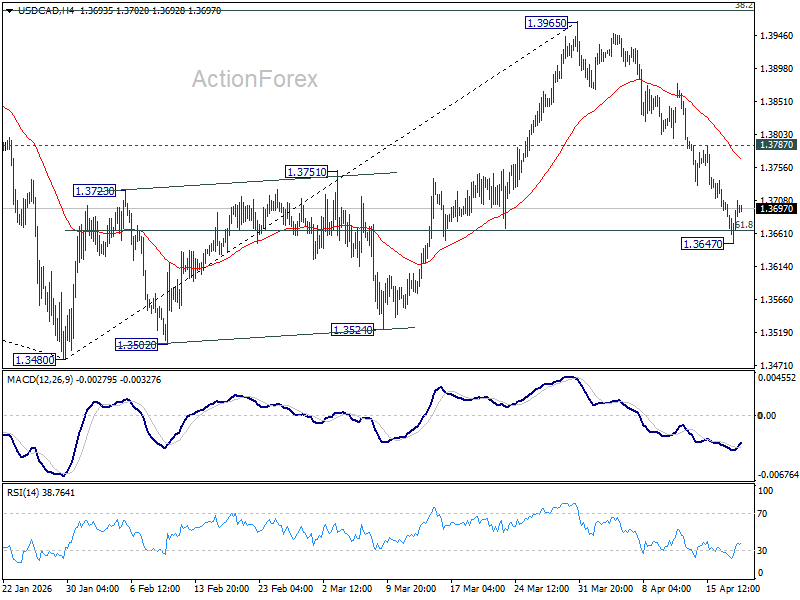
Intraday bias in USD/CAD is turned neutral with current recovery and some consolidations could be seen above 1.3647. Further decline is expected as long as 1.3787 resistance hold. Sustained break of 61.8% retracement of 1.3480 to 1.3965 at 1.3665 will pave the way to retest 1.3480 low.
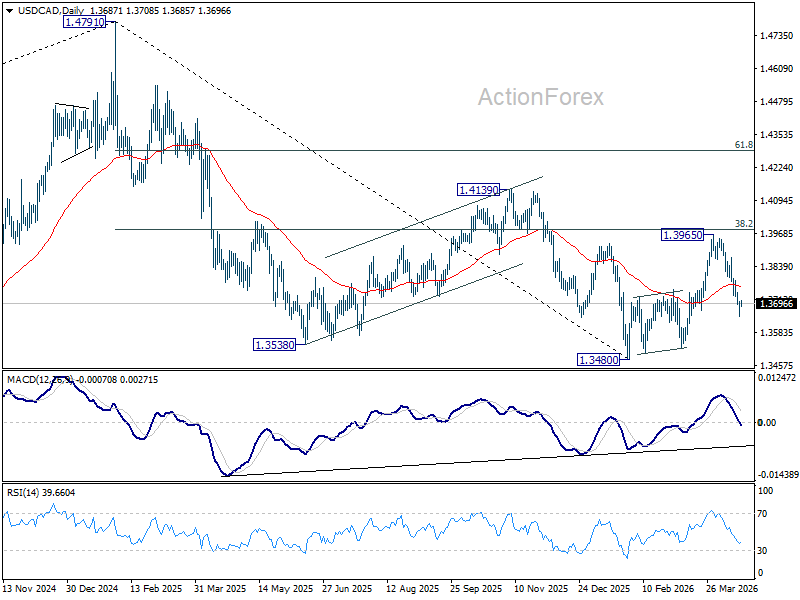
In the bigger picture, price actions from 1.4791 are seen as a corrective pattern to the whole up trend from 1.2005 (2021 low). Deeper fall could be seen, as the pattern extends, to 61.8% retracement of 1.2005 to 1.4791 at 1.3069. However, decisive break of 38.2% retracement of 1.4791 to 1.3480 at 1.3981 will argue that the correction has completed with three waves down to 1.3480 already. Further break of 1.4139 will confirm and bring retest of 1.4791 high.
Oil Jumps, Tech Ignores
Last week was marked by a questionable rally on hopes that peace was just around the corner, but weekend news dampened that optimism, and the week opens on a mixed note with many unanswered questions. The Strait of Hormuz is reportedly closed again, Iran is not happy with the US blockade and even less with a ship being seized a few hours ago, and is no longer willing to attend the upcoming negotiations until the blockade is lifted. Donald Trump continues to threaten to destroy the country’s power plants and bridges.
As a result, US crude jumped at the open but has since given back part of its earlier gains. It is about 5% higher at the time of writing, while Brent crude is up by around 3.4%.
US and European equity futures are down, but Asian indices are up. Tech-heavy indices, in particular, are doing just fine this morning—despite the jump in energy prices—as news on the AI front has been very encouraging. As long as oil prices remain below the $100pb level, investors seem willing to maintain—and even increase—exposure to technology names.
Korean Kospi index, which was one of the most heavily hit Asian indices on the war news, is back near the peak levels seen before the conflict started. Investors have returned to the memory chip shortage theme, keeping demand for Korean champions Samsung Electronics and SK Hynix strong. Both are flirting with new all-time highs, thanks to robust and resilient AI demand.
Earnings last week added to that optimism, as TSMC, which builds chips for tech giants like Nvidia and Apple, reported a 58% surge in profit in the three months to March and said it expects revenue to grow more than 30% this year—above its previous guidance. Meanwhile, ASML, which sells machines to chipmakers, raised its full-year sales forecast on AI demand, signaling that the war in Iran has not depressed AI investment and is unlikely to derail the AI rally. The Japanese Nikkei 225 pared early losses after hitting an all-time high last Friday, while the Hang Seng Index is up around 0.83%.
If I could say one thing about my travels across Asia over the past weeks, I would say that I have been impressed—and left speechless—by the few days I spent in China. The technology, the EVs, the robots—it felt like landing on a different planet, in a different era. Since then, I haven’t stopped reading EV news, and I can tell you: Chinese EVs are something else from a technology, design and cost perspective. The technology gap is now such that import tariffs on Chinese EVs in Western economies may delay their arrival, but are unlikely to protect traditional brands. Many are already striking deals with Chinese producers to stay afloat.
That said, Chinese EV makers are not necessarily cheap. BYD is trading at a P/E ratio of around 27 and has been under pressure due to an aggressive price war in the EV space. Still, it is hard not to see a bright future for these companies after experiencing the products firsthand.
Anyway, that was a brief personal note.
Oil Rebounds as US Seizes Iranian Ship in Blockade
In focus today
There is no tier-1 data scheduled for release today. Attention shifts to developments in the Middle East and broader market dynamics.
In Sweden, Riksbank governor Erik Thedéen will be holding a speech with the title: "The old world order is cancelled: Investments for competitiveness and security". Markets will be looking for comments on how the US-Iran war might impact the policy decision from the Riksbank going forward.
This week brings the first key data for April, with Thursday's flash PMIs for the euro area, US, UK, and Japan in focus. European manufacturing is expected to weaken sharply due to higher energy prices, and price components may hint at whether energy costs are filtering through to other prices. On Tuesday, markets eye Germany's ZEW survey and UK labour market data, followed by Swedish unemployment and UK inflation figures on Wednesday.
Economic and market news
What happened overnight
The Middle East conflict escalated early this morning as the US intercepted an Iranian cargo ship trying to breach its maritime blockade, prompting Iran to vow retaliation. The prospects for a second round of negotiations remain uncertain ahead of the ceasefire's expiration on Tuesday, with Iran refusing to participate unless the blockade is lifted. Meanwhile, the US Treasury has extended Russian oil sanctions exemptions by one month, casting doubt on Washington's confidence in a swift resolution.
Oil prices rebounded, with Brent crude trading at USD 95/bbl this morning, as the market digested the turmoil around the Strait of Hormuz. The market is likely to stay volatile this week as US and Iran will try and negotiate a deal. If oil does not start flowing through the strait soon, oil prices are likely to rise further and above USD 100/bbl again.
In China, the central bank kept the 1-year and 5-year Loan Prime Rates unchanged, as widely expected. While we expect monetary easing in the coming months, the LPRs normally change only following changes in the 7-day reverse repo rate, which has not been adjusted since May last year.
What happened over the weekend
The Middle East conflict seesawed over the weekend, starting on Friday with Iran declaring the Strait of Hormuz open for the remainder of the 10-day US-brokered truce between Israel and Lebanon - a key Iranian demand. Brent crude closed at 90USD/bbl on Friday, buoyed by optimism surrounding a lasting peace deal. However, Iran quickly reversed course, re-closing the strait after the US confirmed its shipping blockade would continue. Tensions escalated further as Iran was accused of firing on vessels near the strait.
In the US, Fed Governor Waller suggested the central bank may need to hold rates steady for an extended period, citing the challenge of balancing high inflation alongside a weak labour market. Waller noted that the labour market's "break-even" point - where hiring sustains the unemployment rate - may now be close to zero, implying fewer new jobs are required to stabilise unemployment. This marks a shift from his earlier concerns about low hiring levels and thus reflects a more hawkish tone. Despite being among the most dovish FOMC participants, Waller's March vote supported holding rates steady.
Equities: Friday's price action was dominated by the news that the SoH was open for traffic for as long as the ceasefire lasts. Global equities rose 1.2%, S&P hit new all-time highs amid closing 1.2% higher, Nasdaq was 1.5% higher, Russell 2000 2.1% higher. The rally was naturally broad-based given the geopolitical relief of nature, thus the rally was led by consumer discretionary, industrials and IT, while only Energy and Utilities were lower.
FI and FX: Friday afternoon the news that Iran will open the Strait of Hormuz triggered broad-based risk-on sentiment with oil dropping below 90 USD/bbl, EUR/USD briefly touching 1.1840 and a broad-based decline in yields across tenor and regions. However, over the weekend, the war in the Middle East escalated yet again as Iran quickly reversed course, re-closing the strait after the US confirmed its shipping blockade would continue. As a result, oil prices rebounded overnight as the market digested the turmoil around the Strait of Hormuz. The market is likely to stay volatile this week as US and Iran will try to negotiate a deal. If oil does not start flowing through the strait soon, oil prices are likely to rise further and above USD100/bbl again, putting upward pressure on yields and downward pressure on EUR/USD. In other news, EUR/DKK rose to 7.4735 on Friday, which is above the level, where Danmarks Nationalbank sold EUR/DKK in FX intervention in March 2020. EUR/DKK has traded close to previous intervention level since Wednesday last week. The rise towards the end of last week further raises the odds of FX intervention this month.