

Sample Category Title
A New Rra for the Fed? Looking Back on Kevin Warsh’s US Senate Hearing & Market Reactions
Today welcomed one of the final steps for Kevin Warsh to replace Jerome Powell as Chairman for the Federal Reserve – A process that initially was supposed to occur on May 15th.
However, the Trump Administration decided to spice things up with a Powell investigation that sent yet another wave of chaos in February.
But this is relatively small detail, but one that would annoy the President even more as the investigation would prevent Kevin Warsh's validation to pursue (check out the piece linked above to learn more).
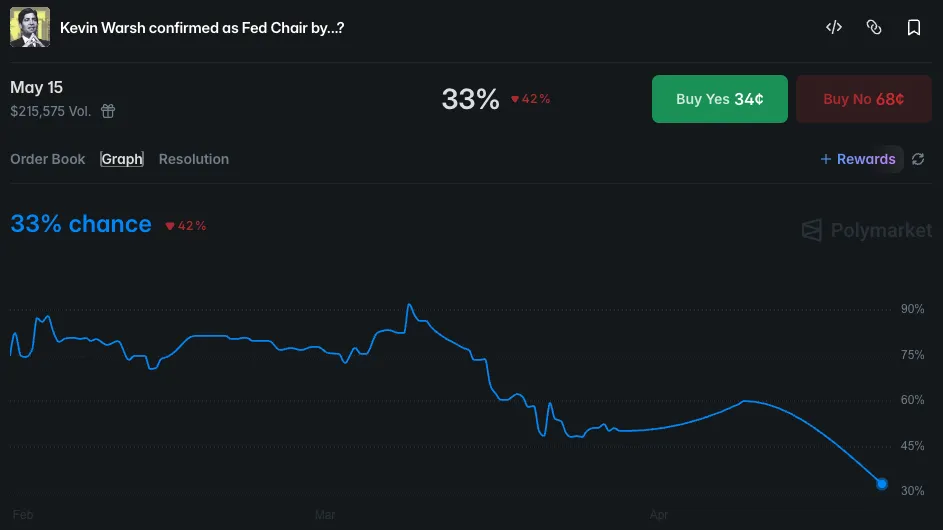
Odds for Kevin Warsh to start his mandate on time – From 85% to the current 33%. Source: Polymarket
Highlights from Kevin Warsh's morning Senate hearing
The highly anticipated Senate confirmation hearing for incoming Federal Reserve Chair Kevin Warsh took center stage this morning, and Wall Street is now frowning.
Stepping into the spotlight amid a backdrop of high geopolitical volatility, Warsh delivered a mixed address that instantly sent ripples across asset classes and triggered a decent market pullback.
At the core of his testimony was a bold declaration regarding monetary policy: Warsh explicitly stated his desire to reform the Federal Reserve, with notable calls for a review on Forward Guidance (that he wants to drop entirely) and a new inflation framework.
Rejecting the policy complacency of recent years (showing his disagreement for post-COVID policy), he signaled a structural shift in how the central bank will measure and react to price stability – Warsh's toughest point of view is on the Fed's Balance Sheet, that he wants to see reduced heavily over coming years.
This would definitely not be as positive for Stock Markets.
For markets that have grown accustomed to a highly accommodating Fed, this was a decent reality check – Wall Street really loves Jerome Powell and his exit will be surely regretted by some.
Some tough questions, particularly from Senator Warren, on his swinging hawkishness, blasted the Fed Chair nominee – and he definitely dodged the answers.
Nevertheless, Warsh aggressively reinstated the narrative of strong Federal Reserve independence – but this one will have to be proven as he never really answered on disagreeing with the President and other similar questions.
Add to the lingering uncertainty with the Middle East, and the market reaction got quite decisive.
Equities took a decent hit as the reality of a more rigid Fed policy set in.
The Dow Jones Industrial Average led the intraday pullback, reflecting deep institutional caution as investors rapidly reassess the broader US economic outlook and a potential return to Middle East tensions.
With the critical April 22 US-Iran ceasefire deadline looming just hours away, Warsh's unyielding stance on inflation and institutional independence has thrown yet another puzzle for Participants to play around with.
Vice-President J.D Vance has been reported to travel to Pakistan tomorrow morning (providing a de-facto extension of the Ceasefire, if he really is departing).
What is sure, is that the easy money era has officially been put on notice.
Let's dive into the major movers of this busy, and quite risk-averse session
Energy Markets
WTI (US) Oil prices have grinded higher in recent hours but remain below the key $93 pivot.
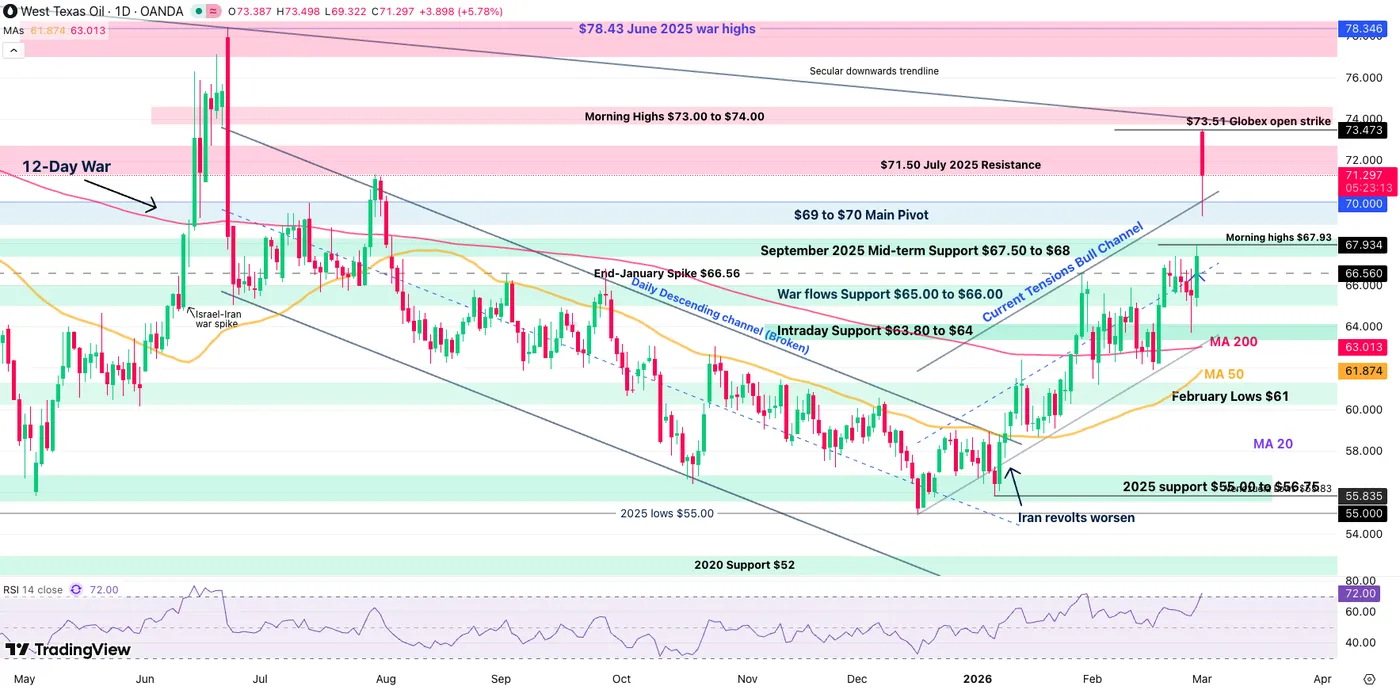
WTI (US) Oil CFD Daily Chart, April 21, 2026 – Source: TradingView
The action in WTI remains stuck between $87 and $95 and should stay like that until Participants learn more on the Iran issue.
Metals Markets

Metal Futures Daily Performance, April 21, 2026 – Courtesy of Finviz
Metals are somehow quite offered in today's session, with drops of close to 3% around the board.
Looking at reactions in the US Dollar and other Markets, it could just be profit-taking on the dip-buying at key technical levels, supplemented by some angst regarding the Balance Sheet reducing.
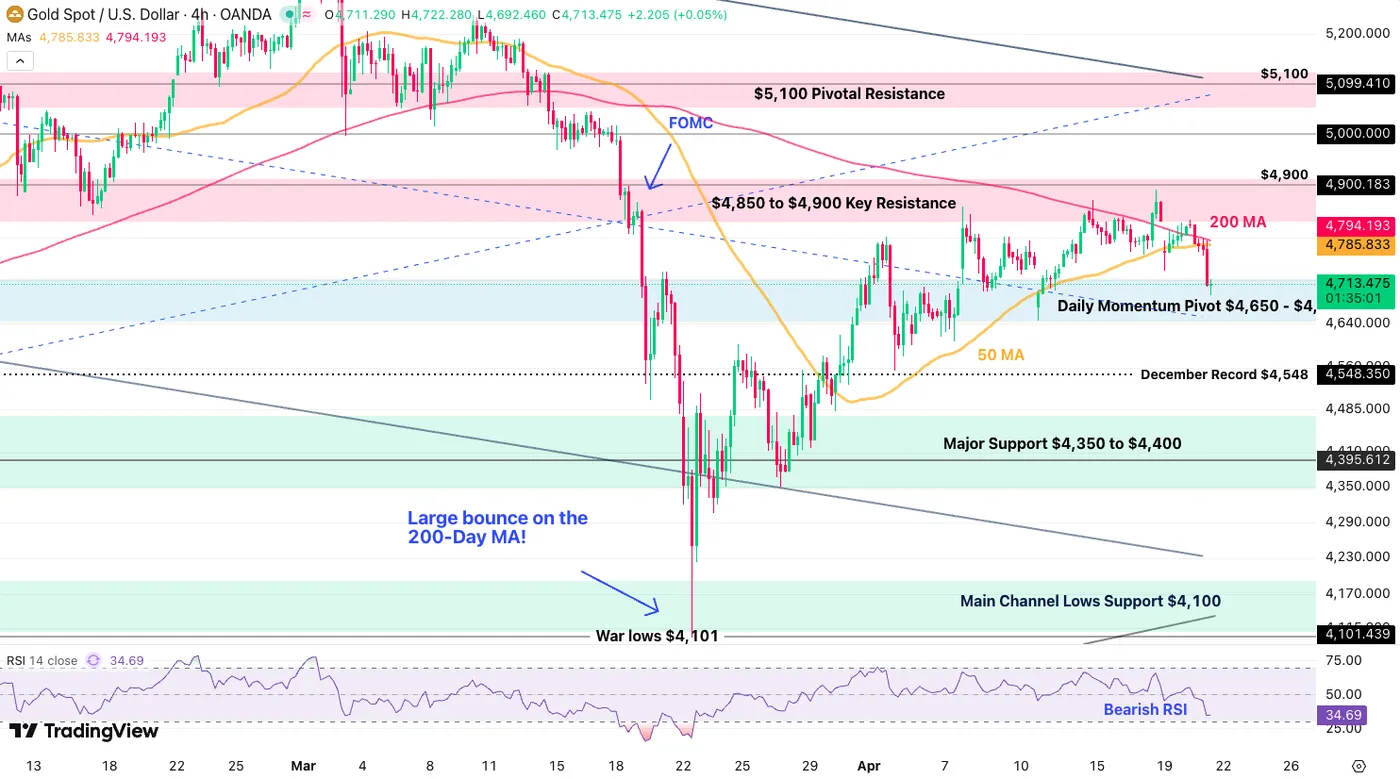
Gold CFD 4H Chart, April 21, 2026 – Source: TradingView
Gold found pressure at $4,900 which got exacerbated by the 4H 200-period MA.
Don't forget to check out our recent XAU/USD and XAG/USD to spot trading levels:
Metals in focus with Ceasefire uncertainty – Silver (XAG/USD) & Gold (XAU/USD) intraday outlook
US Dollar
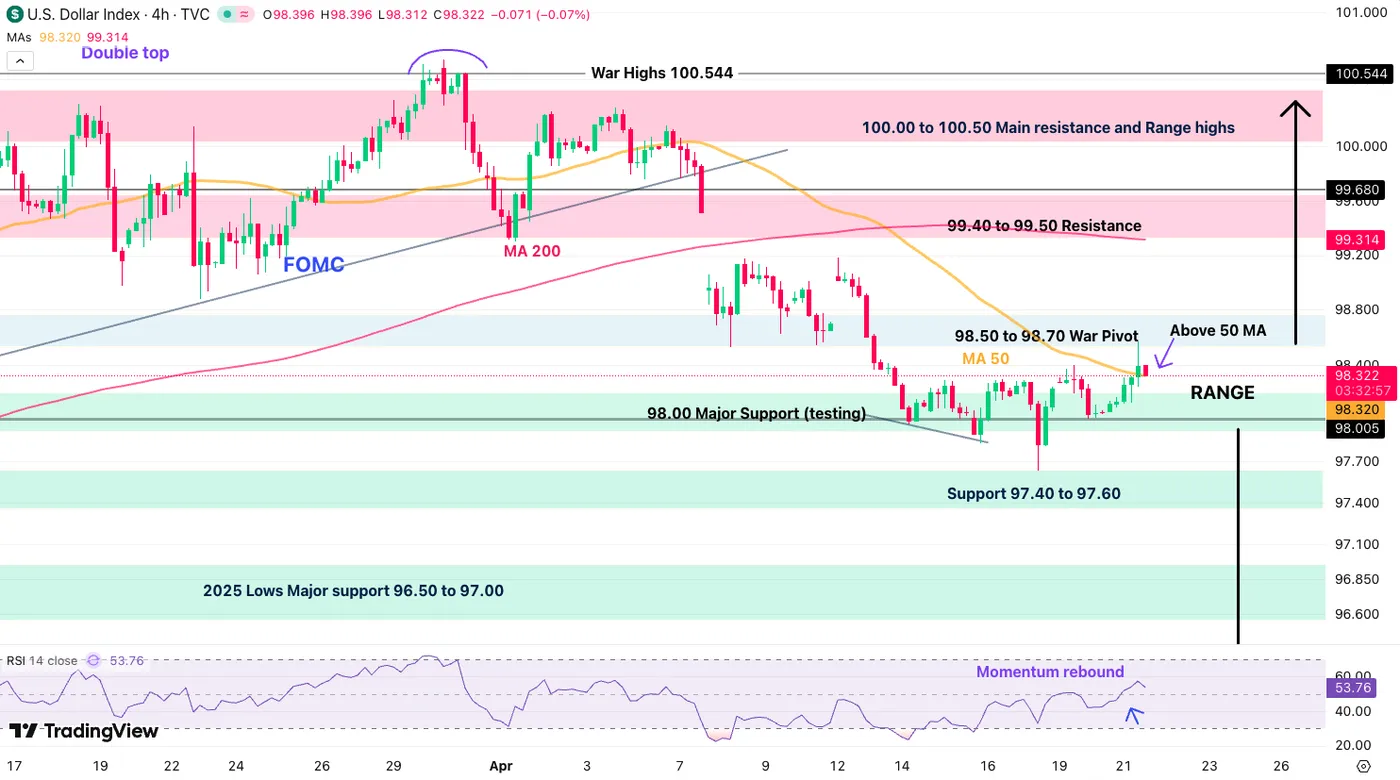
Dollar Index (DXY) 4H Chart, April 21, 2026 – Source: TradingView
The US Dollar caught a decent bounce during the Kevin Warsh hearing – hope that some of you explored our USD Analysis on time to catch the first leg.
Now retesting the 4H 50-period MA, the next move will be quite interesting (decent point for long entries on the USD, but watch out for volatile catalysts ahead).
Stock Markets

Stock Market Futures Daily Performance, April 21, 2026 – Courtesy of Finviz
Stock Markets are in the red today but the reactions are for now still broadly contained.
Be careful tomorrow as things should be rocky, particularly if the second round of US-Iran talks fail to materialize.
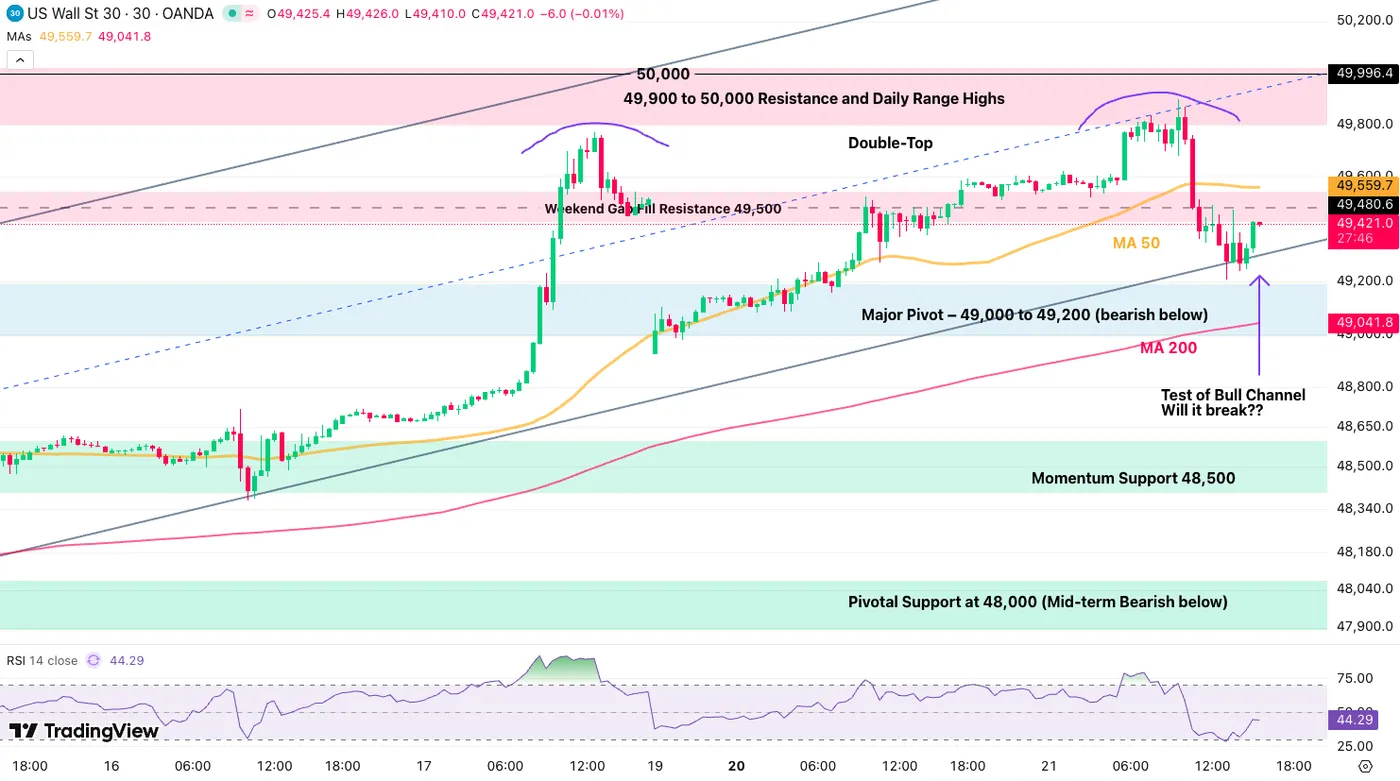
Dow Jones CFD 30M Chart, April 21, 2026 – Source: TradingView
Don't forget to check out our Stock Market intraday analysis to learn more on fundamentals and technicals for the coming period ahead.
Safe Trades and keep track of the evolution of the conflict ahead!
Eco Data 4/22/26
| GMT | Ccy | Events | Act | Cons | Prev | Rev |
|---|---|---|---|---|---|---|
| 23:50 | JPY | Trade Balance (JPY) Mar | 0.09T | 0.20T | -0.37T | |
| 01:00 | AUD | Westpac Leading Index M/M Mar | -0.10% | -0.10% | ||
| 06:00 | GBP | CPI M/M Mar | 0.70% | 0.60% | 0.40% | |
| 06:00 | GBP | CPI Y/Y Mar | 3.30% | 3.30% | 3.00% | |
| 06:00 | GBP | Core CPI Y/Y Mar | 3.10% | 3.20% | 3.20% | |
| 06:00 | GBP | RPI M/M Mar | 0.80% | 0.40% | ||
| 06:00 | GBP | RPI Y/Y Mar | 4.10% | 3.90% | 3.60% | |
| 06:00 | GBP | PPI Input M/M Mar | 4.40% | 2.90% | 0.80% | 0.90% |
| 06:00 | GBP | PPI Input Y/Y Mar | 5.40% | 0.70% | 0.50% | 0.70% |
| 06:00 | GBP | PPI Output M/M Mar | 0.90% | 1.00% | -0.50% | |
| 06:00 | GBP | PPI Output Y/Y Mar | 2.60% | 1.70% | ||
| 06:00 | GBP | PPI Core Output M/M Mar | 0.20% | -0.80% | -0.70% | |
| 06:00 | GBP | PPI Core Output Y/Y Mar | 2.00% | 2.00% | ||
| 12:30 | CAD | New Housing Price Index M/M Mar | -0.20% | 0.20% | 0.30% | |
| 14:00 | EUR | Eurozone Consumer Confidence Apr P | -21 | -17 | -16 | |
| 14:30 | USD | Crude Oil Inventories (Apr 17) | 1.9M | -1.9M | -0.9M |
| 23:50 | JPY |
| Trade Balance (JPY) Mar | |
| Actual | 0.09T |
| Consensus | 0.20T |
| Previous | -0.37T |
| 01:00 | AUD |
| Westpac Leading Index M/M Mar | |
| Actual | -0.10% |
| Consensus | |
| Previous | -0.10% |
| 06:00 | GBP |
| CPI M/M Mar | |
| Actual | 0.70% |
| Consensus | 0.60% |
| Previous | 0.40% |
| 06:00 | GBP |
| CPI Y/Y Mar | |
| Actual | 3.30% |
| Consensus | 3.30% |
| Previous | 3.00% |
| 06:00 | GBP |
| Core CPI Y/Y Mar | |
| Actual | 3.10% |
| Consensus | 3.20% |
| Previous | 3.20% |
| 06:00 | GBP |
| RPI M/M Mar | |
| Actual | 0.80% |
| Consensus | |
| Previous | 0.40% |
| 06:00 | GBP |
| RPI Y/Y Mar | |
| Actual | 4.10% |
| Consensus | 3.90% |
| Previous | 3.60% |
| 06:00 | GBP |
| PPI Input M/M Mar | |
| Actual | 4.40% |
| Consensus | 2.90% |
| Previous | 0.80% |
| Revised | 0.90% |
| 06:00 | GBP |
| PPI Input Y/Y Mar | |
| Actual | 5.40% |
| Consensus | 0.70% |
| Previous | 0.50% |
| Revised | 0.70% |
| 06:00 | GBP |
| PPI Output M/M Mar | |
| Actual | 0.90% |
| Consensus | 1.00% |
| Previous | -0.50% |
| 06:00 | GBP |
| PPI Output Y/Y Mar | |
| Actual | 2.60% |
| Consensus | |
| Previous | 1.70% |
| 06:00 | GBP |
| PPI Core Output M/M Mar | |
| Actual | 0.20% |
| Consensus | |
| Previous | -0.80% |
| Revised | -0.70% |
| 06:00 | GBP |
| PPI Core Output Y/Y Mar | |
| Actual | 2.00% |
| Consensus | |
| Previous | 2.00% |
| 12:30 | CAD |
| New Housing Price Index M/M Mar | |
| Actual | -0.20% |
| Consensus | 0.20% |
| Previous | 0.30% |
| 14:00 | EUR |
| Eurozone Consumer Confidence Apr P | |
| Actual | -21 |
| Consensus | -17 |
| Previous | -16 |
| 14:30 | USD |
| Crude Oil Inventories (Apr 17) | |
| Actual | 1.9M |
| Consensus | -1.9M |
| Previous | -0.9M |
Dollar Forecasting Tougher Times Ahead – EUR/USD, AUD/USD & Dollar Index (DXY) Overview
The US Dollar has corrected quite severely since the announcement of the two-week ceasefire, and not without good cause.
The infamous Petrodollar trade has gripped financial markets on all sides since the beginning of the US-Iran-Israel conflict, particularly amid the rise in Crude Oil to 4-year highs.
The USD has historically held a decent correlation with Black Gold, but the latest wave of panic during the conflict re-strengthened the bonds between the two financial assets, rowing the same boat.
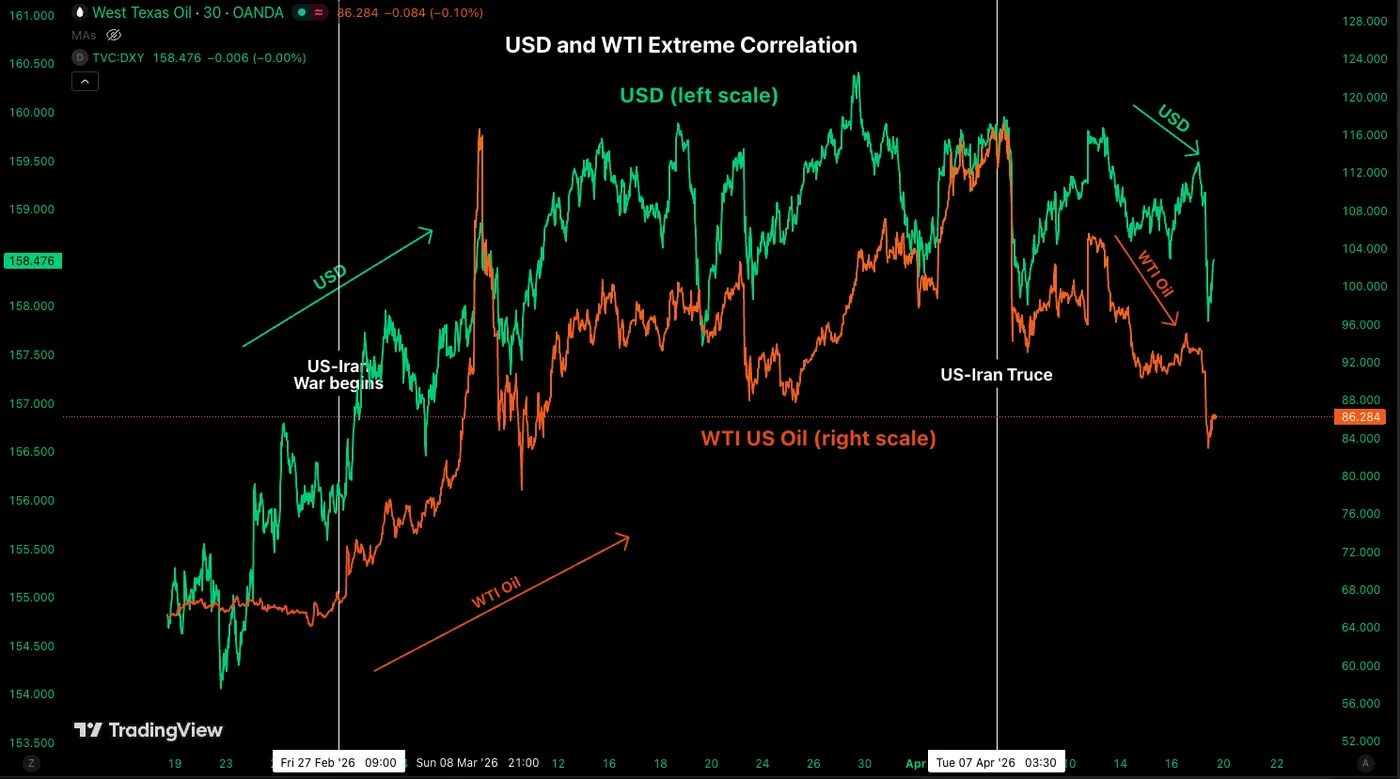
The Petrodollar trade – Oil and US Dollar Correlation. Source: TradingView. April 21, 2026
With Markets ever so ecstatic about a US-Iran deal and the fact that the war is not extending much longer than originally priced, this led to an explosion to all-time highs in Stock Markets, a swift drop in Oil prices, and, consequently, a tumble in the US Dollar.
This came shortly after a daily double top in the global reserve currency, which was nice enough to mark the bearish pattern indicating a turn in how Markets viewed the war.
But after a 2.50% correction, the US Dollar has seemingly done correcting. So if the Dollar forecasted the truce, could it now be forecasting tougher times ahead?
The issue with the narrative is that the Ceasefire is ending tomorrow, and a US delegation, including Vice President J.D. Vance, is struggling to coordinate its departure amid mixed messaging from the Iranian side.
As the US President said, he does not want to extend the ceasefire, and without a deal, we're going straight back to the bombs. So FX Markets could be feeling the turn.
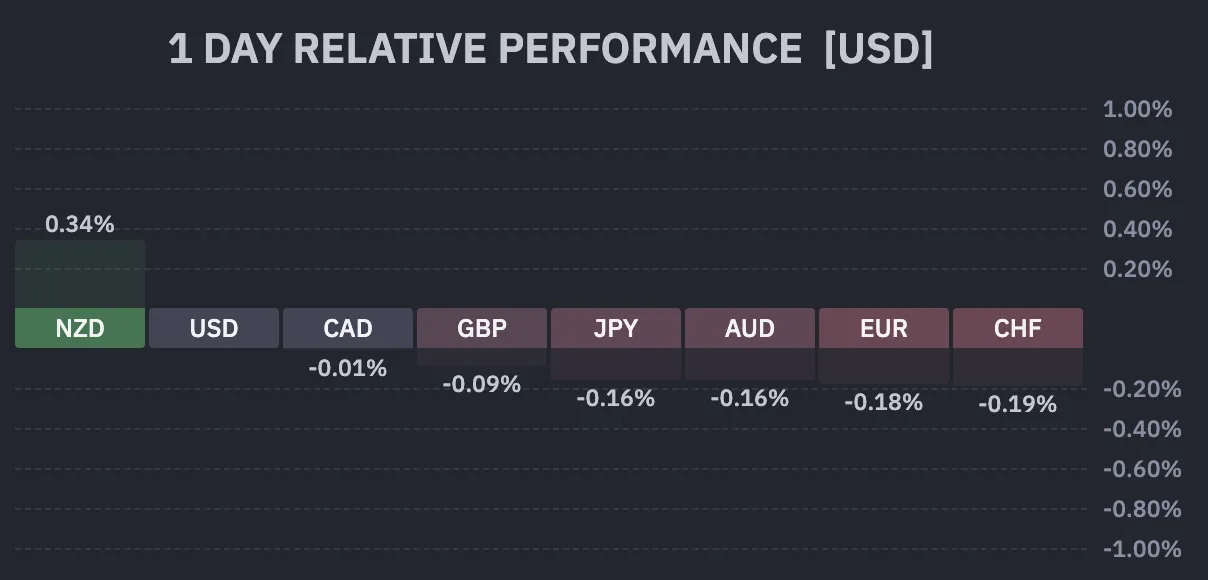
Current Session's FX Performance – Courtesy of Finviz. April 21, 2026
The US Dollar is leading all other FX currencies, but the Kiwi Dollar is supported by a NZ CPI beat and the repricing for a hike at the upcoming meeting.
While the changes are small, it is now the second consecutive day of a Greenback rebound, so traders will have to pay close attention.
We will look at the Dollar Index, EUR/USD, and AUD/USD to assess the current state of the Market and where to look next.
Dollar Index 4H Chart
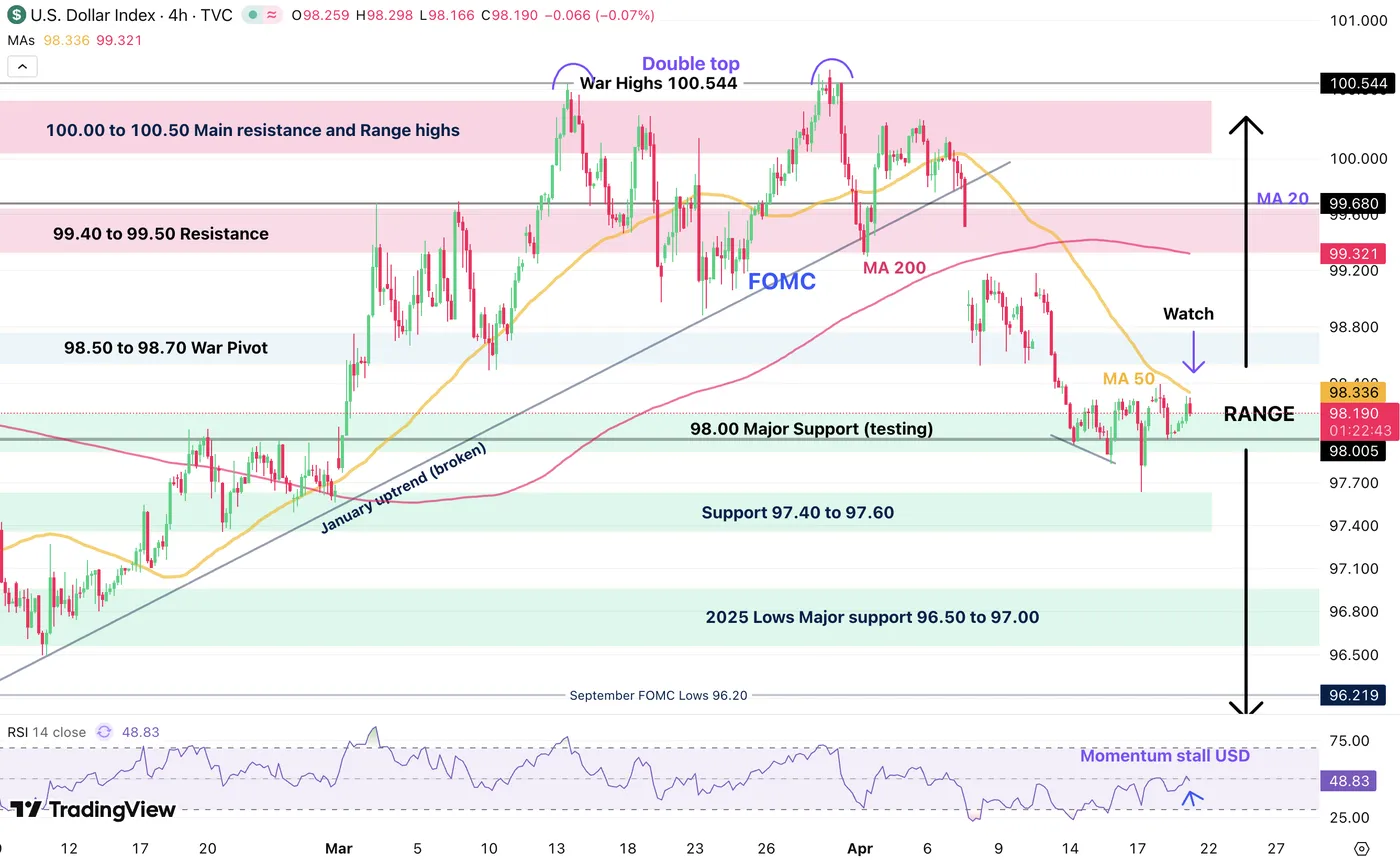
Dollar Index Daily Chart, April 21, 2026 – Source: TradingView
The US Dollar has now attempted, and failed to break the 98.00 Major support for the third time during the morning action.
This levels hold right in the middle of its larger timeframe range which implies a general lack of conviction from bears that the Dollar should already erase its War gains.
Now testing its 4H 50-period MA, a key technical indicator for the prior coming, FX markets will be facing a test:
- Breaking above it (98.40) would hint at a bullish rebound ahead, which confirms above 98.70 (if the War picks up again)
- On the other hand, rejecting 98.00 continues the bearish path for the US Dollar
Levels of interest for the Dollar Index:
Resistance Levels
- 98.335 4H 50-period MA (bullish above)
- 98.50 to 98.70 War Pivot
- 99.40 to 99.50 Resistance
- Initial War Spike 99.68
- Weekly range highs 100.00
- 100.00 to 100.50 Main Resistance Zone
- War Highs 100.544
Support Levels
- 98.00 2025 Support (testing – bearish below)
- Support 97.40 to 97.60
- 2025 Lows 96.40 to 96.80 Support
AUD/USD 4H Chart and Technical Levels
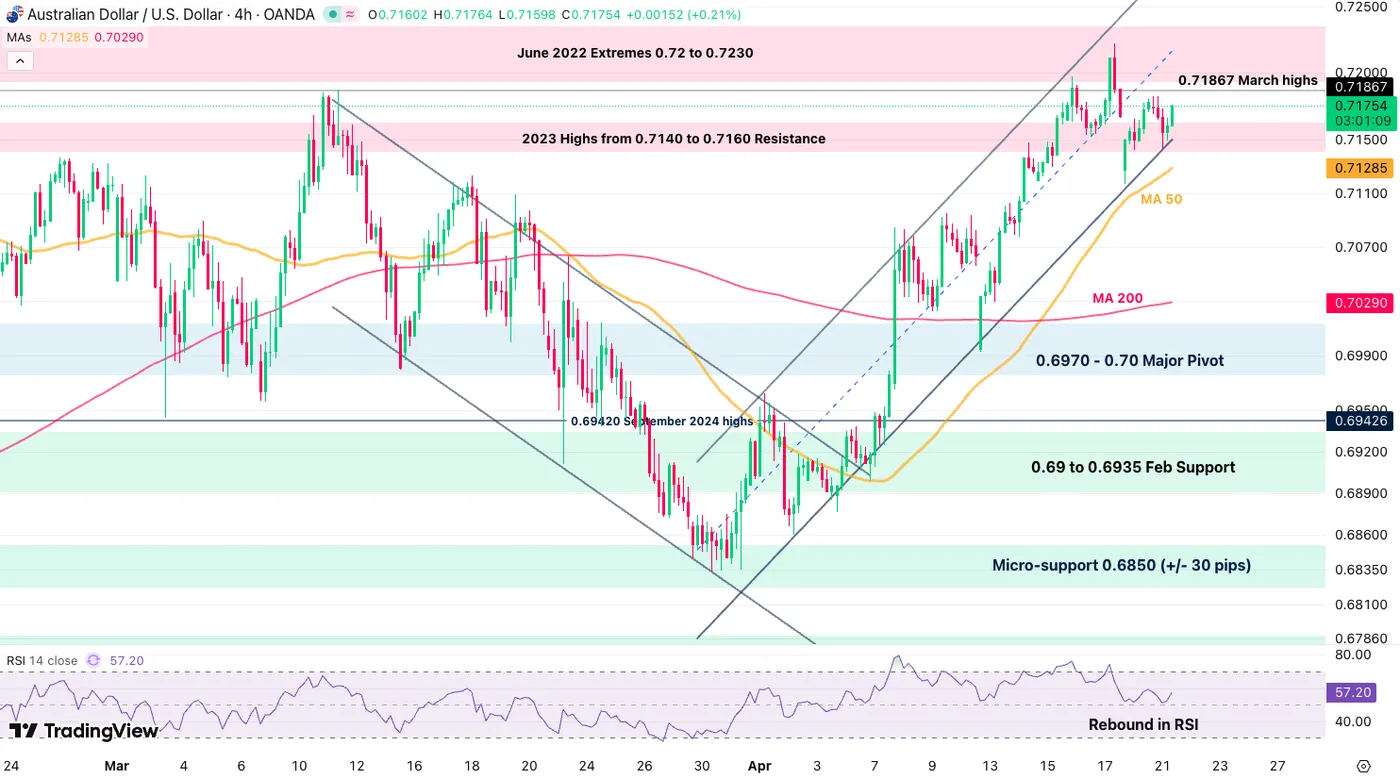
AUD/USD 4H Chart, April 21, 2026 – Source: TradingView
AUD/USD is taking somewhat of a lead, bouncing from the test of its upward channel bottom in recent action.
A break above 0.71860 (March Highs) would continue the bullish path ahead and if the channel was to hold (implying peace), a rally to 0.7250 could occur.
Nevertheless, the rebound attempt seems for now quite shy, hence the importance of the March high level. Failing to reject it could lead to a break of the bull channel.
Levels of interest for AUD/USD:
Resistance Levels
- 2023 Highs from 0.7140 to 0.7160 Resistance (broken)
- 0.71867 March highs
- June 2022 Extremes 0.72 to 0.7230
- Channel highs 0.7250
Support Levels
- 0.7150 Channel lows
- 4H 50-period MA - 0.71280
- 0.6970 - 0.70 Major Pivot
- 0.69 to 0.6935 Early Feb Support
- 0.68340 War lows
EUR/USD 4H Chart and Technical Levels
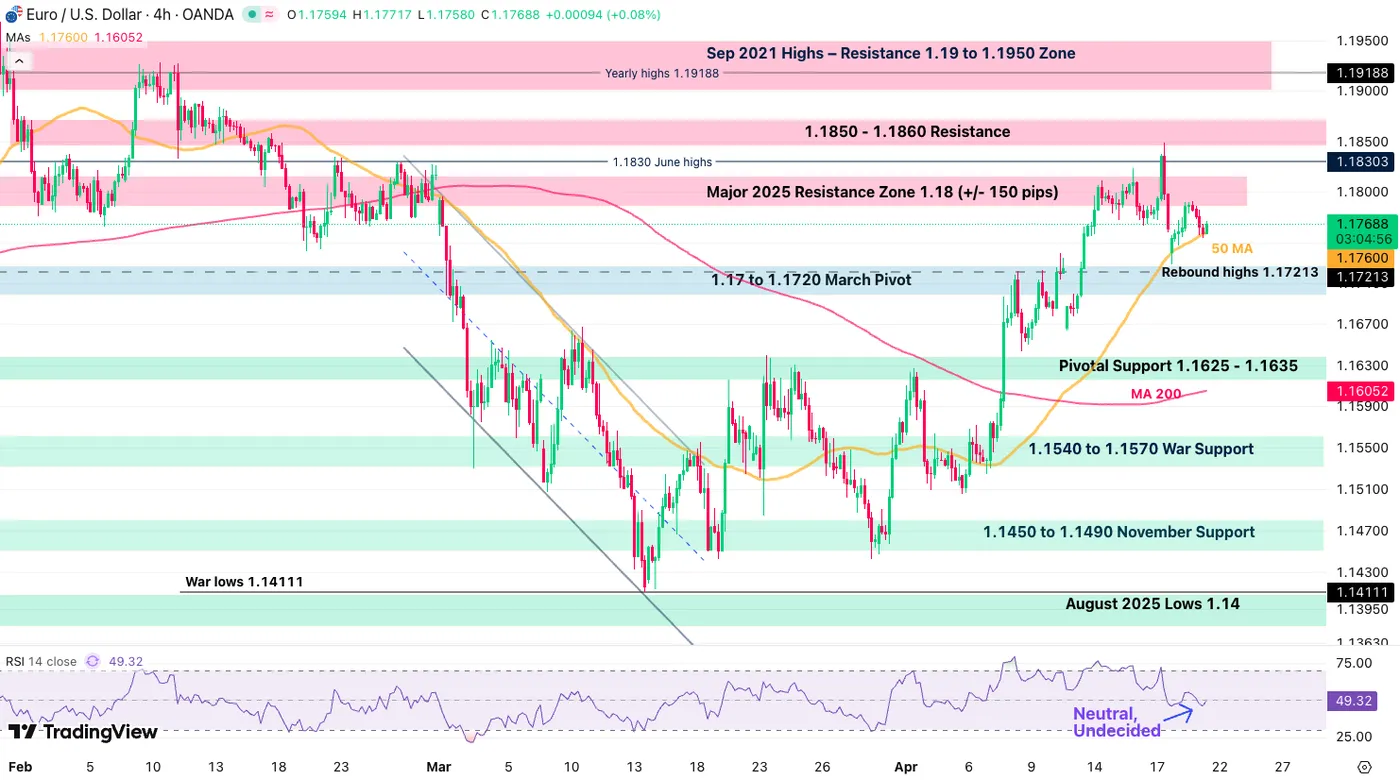
EUR/USD 4H Chart, April 21, 2026 – Source: TradingView
EUR/USD is showing sharply similar signs as the Dollar Index (naturally, in reverse), testing its 4H 50-period MA this time as support.
Bears did take the upper hand at the beginning of the week, rejecting sharply the test of the 1.1850 resistance and now trading close to 1,000 pips below.
Breaking below the MA hints at further downside, with confirmation below 1.17200.
Levels to place on your EUR/USD charts:
Resistance Levels
- Resistance Zone around 1.18 (+/- 150 pips)
- 1.1830 June 2025 highs
- 1.1850 to 1.1860 Recent Test
- Sep 2021 Highs – Resistance 1.19 to 1.1950 Zone
Support Levels
- 1.1760 4H 50-period MA
- 1.17 to 1.1720 March Pivot
- Rebound highs 1.17200 (bearish below)
- Major Pivot 1.16250 to 1.16350
- 1.1540 to 1.1570 War Support
- 1.1475 to 1.15 November Support
- War lows 1.1410
Safe Trades and keep a close eye on Ceasefire news!
Sunset Market Commentary
Markets
After being wrongfooted on Friday, markets don’t want to get ahead of themselves again as the clock ticks down to tomorrow’s night end of the US-Iran cease-fire. Brent crude trades stoic at $95/b while the headline roulette keeps spinning. It’s still unclear whether Iran will send a delegation to Islamabad while US president Trump repeated to be ready to restart the military campaign if Iran doesn’t bend to US demands. He suggests that extending the cease-fire is currently unlikely. Core bond yield curves show some bear flattening with the front end of the curve moving 3 to 5 bps higher in Europea, the US and the UK. The dollar gets more breathing room below the EUR/USD 1.18 big figure while stock markets lose some momentum intraday. They currently trade with some minor losses. The waiting game gives us some time to grasp through today’s eco numbers, starting with firmer than expected March US retail sales. Headline sales growth accelerated to 1.7% M/M with all underlying core series beating consensus as well; including the retail sales control group (+0.7% M/M vs +0.2%). Sales growth was broad-based with 12 out of 13 categories rising. The numbers nevertheless need to be downplayed somewhat as they are to be adjusted for inflation. Nevertheless, we raise our in-house US Q1 GDP Nowcast from 2.45% Q/Qa to 2.57%Q/Qa. German (April) ZEW investor sentiment dropped sharply: from -62.9 to -73.7 for the current situation index and from -0.5 to -17.2 for the outlook. The latter is the weakest reading since December 2022. ZEW President Wambach warned that the economic consequences of the Iran war for the German economy go far beyond price increases. “Businesses are concerned about long-term shortages of energy supply, and this discourages investment and weakens the effect of government stimuli.”
The number of UK employees on payrolls declined by 11k in March according to tax data published by the Office for National Statistics. Consensus expected a flat reading. The estimated number of vacancies has decreased in the latest quarter. Early estimates for January to March 2026 suggest a decrease of 29k (3.9%), to 711k compared with October to December 2025, which is the lowest level of vacancies since February to April 2021. Separate and more dated data from the Labour Force Survey showed the unemployment rate in the three months through February unexpectedly sliding from 5.2% to 4.9%, but that was mainly because of people dropping out of the jobs market. Private sector wage growth slowed to 3.2% during the same time window. The release triggered a minor move lower in sterling this morning but it was rapidly reversed. It doesn’t alter the fact that the Bank of England will stay put when it meets next week. Markets are interested in reaction functions from the ECB and the BoE to help decide on the faith of EUR/GBP. For the past 10 (!) trading sessions, the pair has been locked in a tiny trading range between 0.8685 and 0.8730.
News & Views
• The Iran war through its economic consequences has cost France between €4 and €6bn so far, its finance minister Lescure said today. The sharp rise in bond yields alone is estimated to add an extra €3.6bn to the budget. French yields have risen between 30 and 50 bps since the onset of the war. Measures to help households cope with the energy price shock come on top of that. Given France’s perilous state of public finances, Lescure said they plan to fully offset the budgetary impact, amongst others via spending freezes.
The Bank of Japan is leaning towards keeping its policy rate unchanged at 0.75% at next week’s policy meeting, people familiar said, adding that it would communicate a hawkish stance. The status quo would come amid inflation being above target for several years and with inflation forecasts at the April meeting being jacked up to reflect the energy price surge. The people noted, however, that the central bank sees little need to rush to a hike when the geopolitical and economic outlook is still as fluid as it is today. Holding steady in April does increase the likelihood of a June move if the economy holds up. Money markets have already sharply reduced the odds for an April hike to barely zero with BoJ leadership (including governor Ueda) not fully embracing such a move in recent speeches. June odds currently stand at 70%+ while July is all but priced in. The Japanese yen continues to trade near but just below the USD/JPY 160 multiyear lows seen end-April. A deeply negative real rate and the nature (energy) of the geopolitical driven uncertainty prevents JPY to benefit from its typical safe haven status.
Gold Ready for Short-Term Suffering for a Higher Goal
Throughout the conflict in the Middle East, gold has moved in tandem with risk assets and has shown a negative correlation with oil and the dollar. Unsurprisingly, Tehran’s announcement that it was opening the Strait of Hormuz triggered a surge in gold to monthly highs, whilst the US seizure of an Iranian tanker caused the precious metal to take a step down.
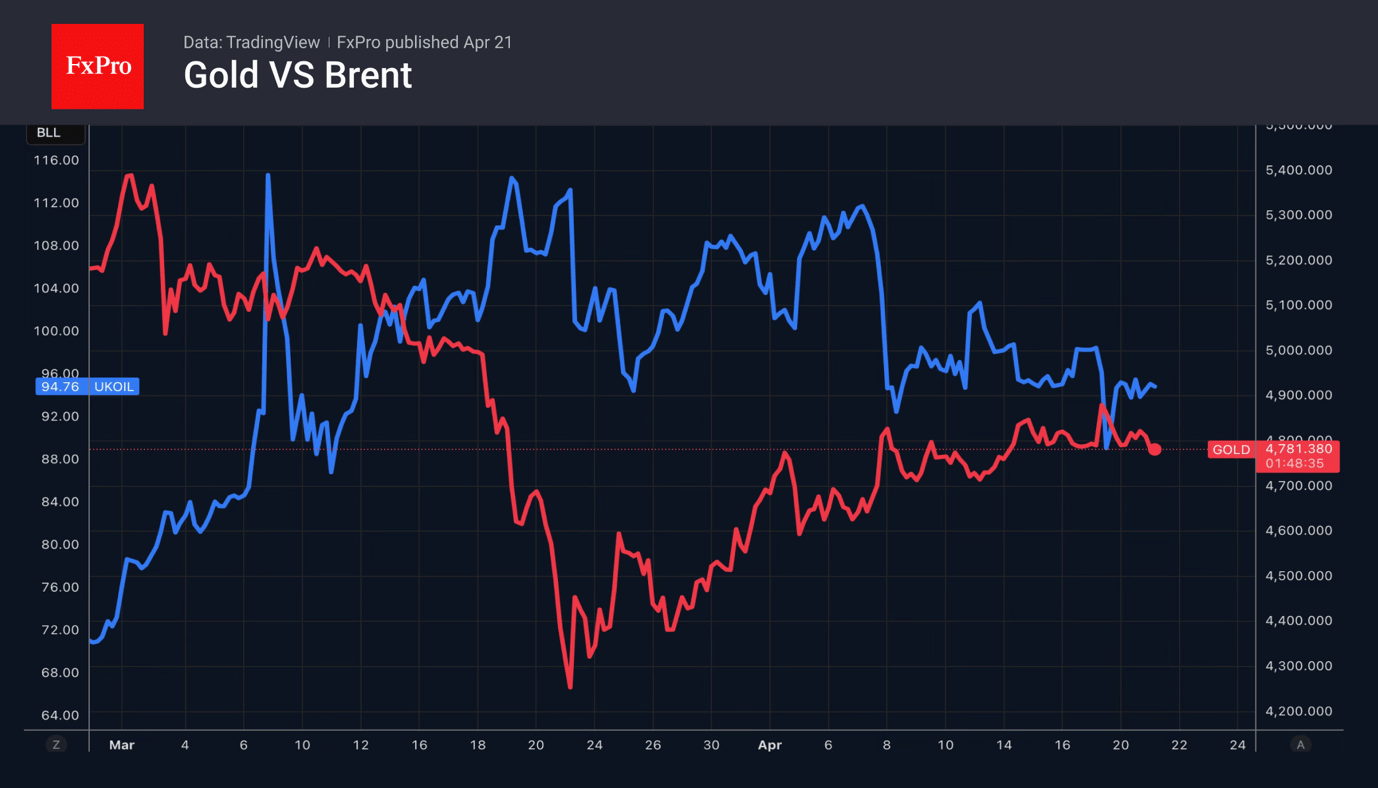
Markets are gradually growing weary of geopolitics and are beginning to consider the consequences of the conflict in the Middle East. Investors are asking: how high will inflation rise and how long will it last? Rapid consumer price inflation will force central banks to raise rates aggressively, which is negative for gold. Standard Chartered forecasts that the average price in the second quarter will fall to $4,605 per ounce before rising to $4,850 in the third.
However, if the Fed considers the inflation surge to be temporary, it will not tighten monetary policy. A fall in real Treasury yields could provide a tailwind for gold. Alongside monetary policy, HSBC cites central banks’ insatiable appetite for bullion, as well as concerns over the US budget deficit and financial stability, as drivers of growth.
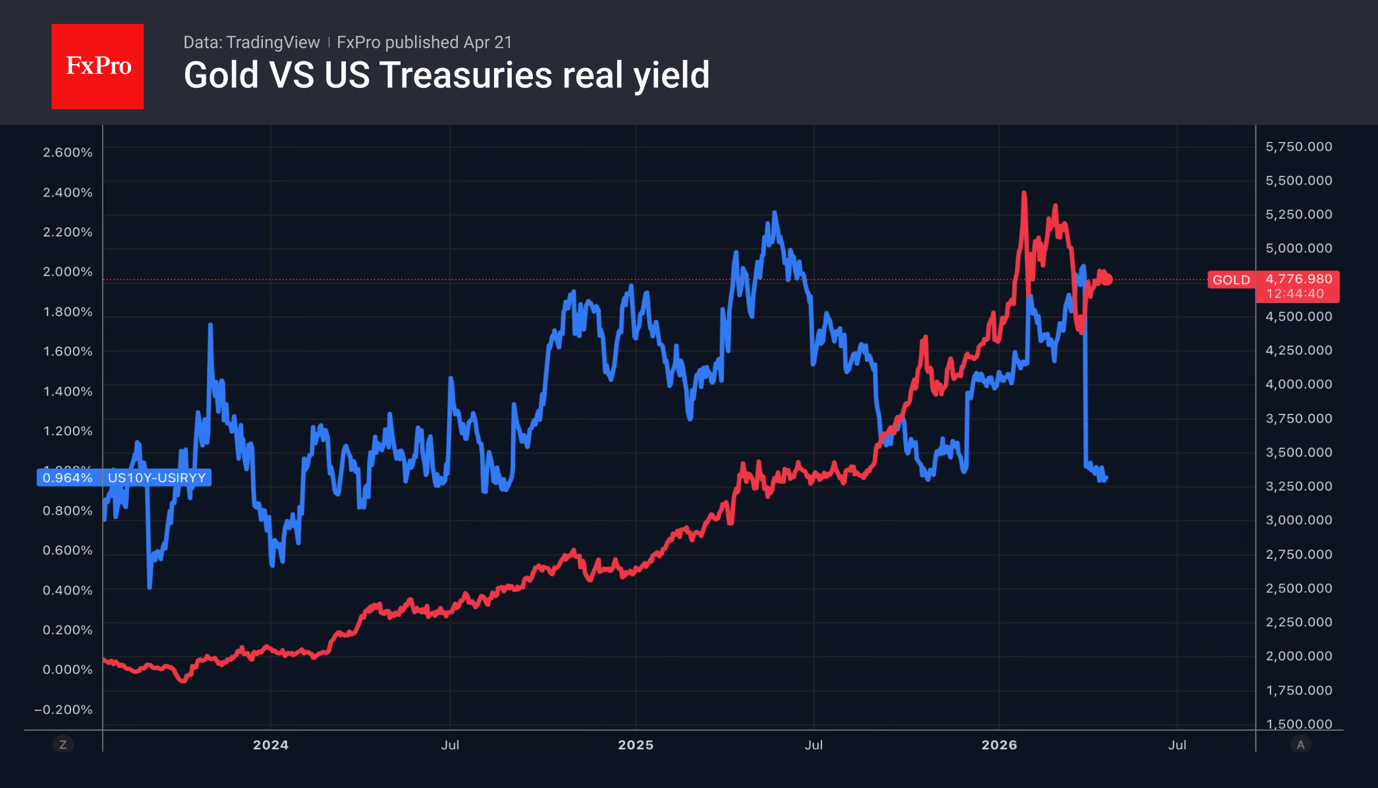
Despite gold’s sensitive reaction to news from the Middle East, it stands to benefit from both an end to the conflict and its extension. In the former scenario, inflation will not rise as high as feared, and central banks may abandon plans to raise rates. In the latter scenario, persistently high oil prices will deal a serious blow to the global economy, forcing central banks to focus on the risks of recession. And in such circumstances, they typically throw the economy a lifeline through large-scale monetary stimulus. This will create a favourable environment for rising precious metal prices.
USD/JPY Mid-Day Outlook
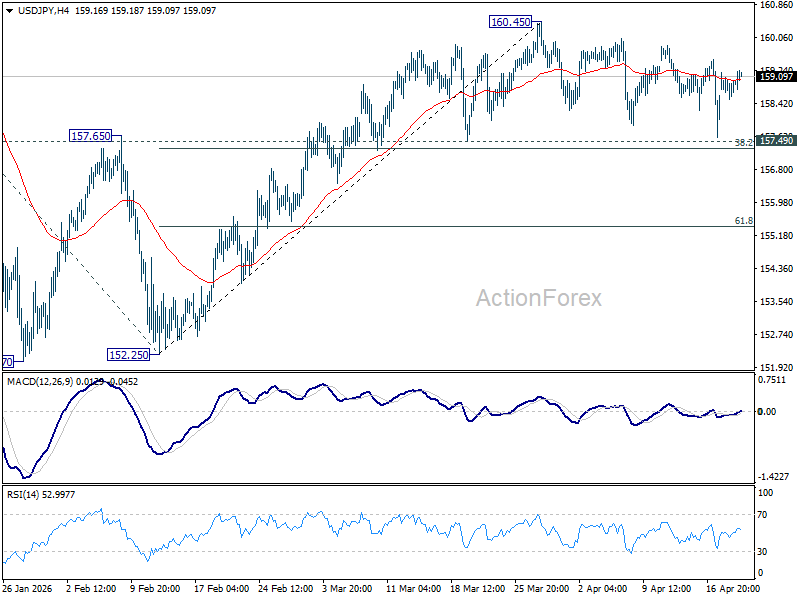
Daily Pivots: (S1) 158.51; (P) 158.86; (R1) 159.16; More...
No change in USD/JPY's outlook as consolidation continues below 160.45. Further rise is expected with 157.49 cluster support (38.2% retracement of 152.25 to 160.45 at 157.31) intact. On the upside break of 160.45 will target a retest on 161.94 high. However, firm break of 157.31/49 will bring deeper fall back to 61.8% retracement at 155.38 next.
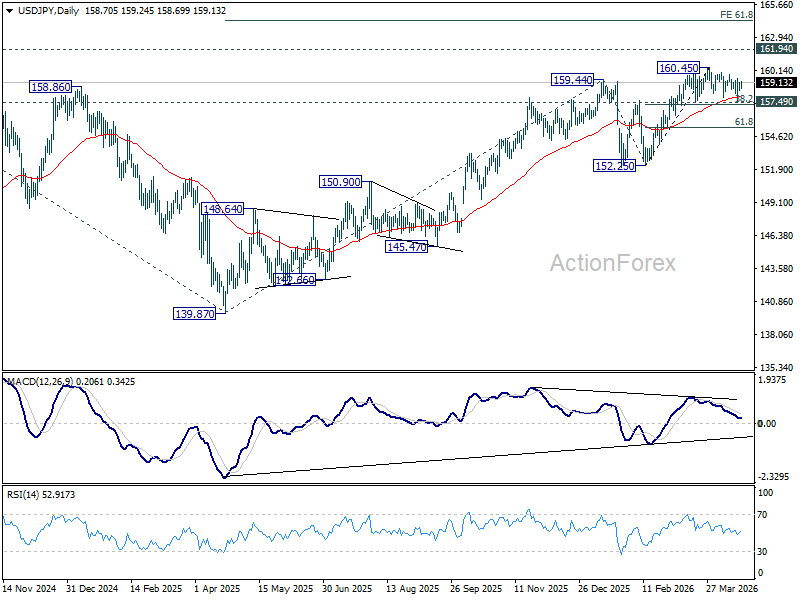
In the bigger picture, outlook is unchanged that corrective pattern from 161.94 (2024 high) should have completed with three waves at 139.87. Larger up trend from 102.58 (2021 low) could be ready to resume through 161.94. This will remain the favored case as long as 55 W EMA (now at 153.80) holds. Firm break of 161.94 will pave the way to 61.8% projection of 102.58 to 161.94 from 139.87 at 176.75.
USD/CHF Mid-Day Outlook
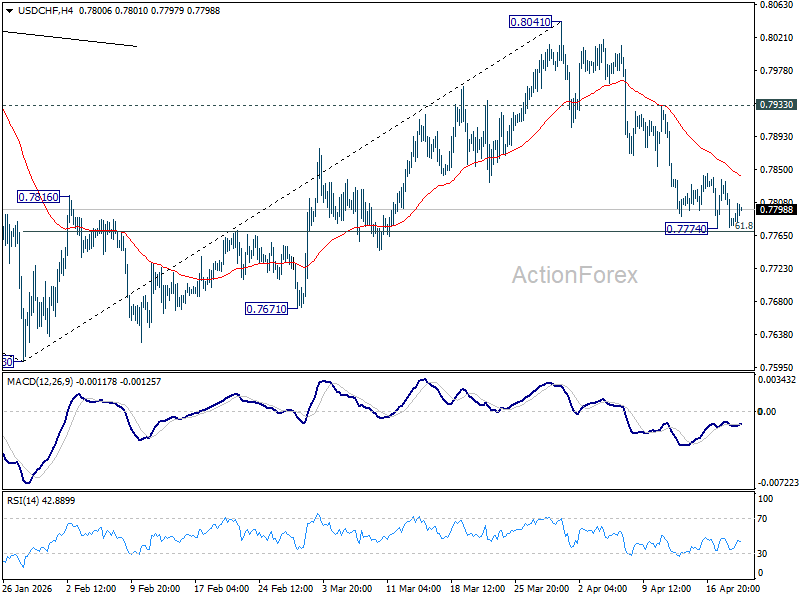
Daily Pivots: (S1) 0.7759; (P) 0.7800; (R1) 0.7824; More….
Intraday bias in USD/CHF remains neutral as consolidations continues above 0.7774. Upside of recovery should be limited below 0.7933 resistance to bring another fall. Sustained break of 61.8% retracement of 0.7603 to 0.8041 at 0.7770 will resume the decline from 0.8041 to retest 0.7603 low.
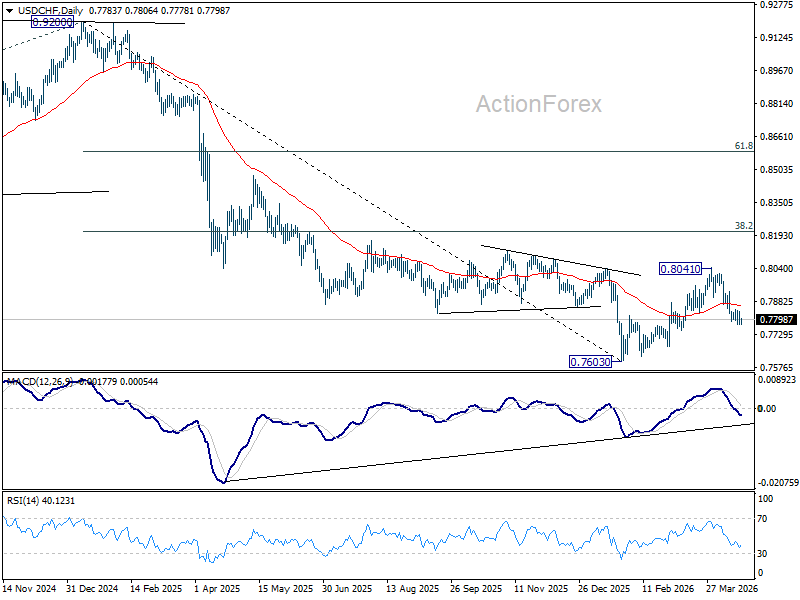
In the bigger picture, rebound from 0.7603 medium term bottom is seen as correcting the fall from 0.9200 only. Rejection by 55 W EMA (now at 0.8059) will affirm this bearish case, and setup down trend resumption to 100% projection of 1.0146 (2022 high) to 0.8332 from 0.9200 at 0.7382 at a later stage. Though, sustained break of 55 W EMA will suggest that it's probably correcting the larger scale down trend from 1.0146 (2022 high).
GBP/USD Mid-Day Outlook
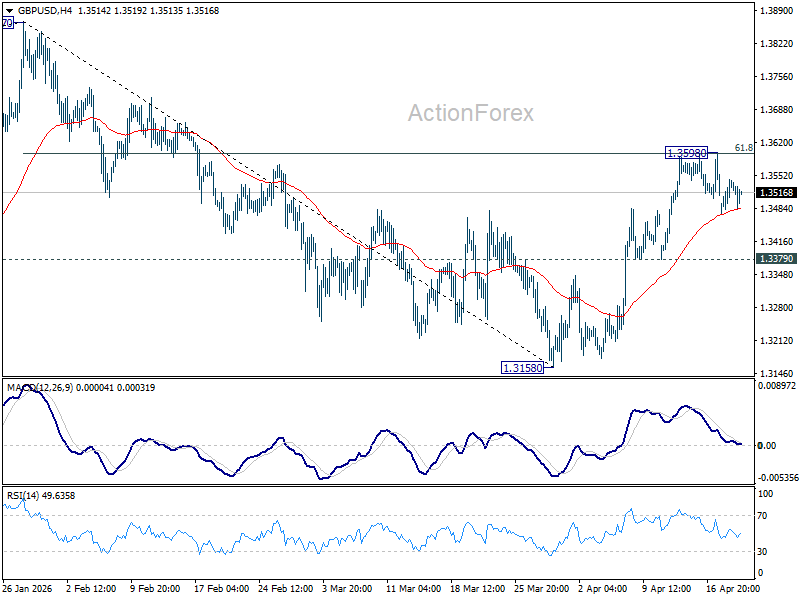
Daily Pivots: (S1) 1.3492; (P) 1.3519; (R1) 1.3562; More...
Intraday bias in GBP/USD remains neutral as it's extending consolidations below 1.3598. With 1.3379 support intact, further rise is favor. On the upside, sustained break of 61.8% retracement of 1.3867 to 1.3158 at 1.3596 will pave the way to retest 1.3867 high. However, firm break of 1.3379 will bring deeper fall back to 1.3158 low instead.
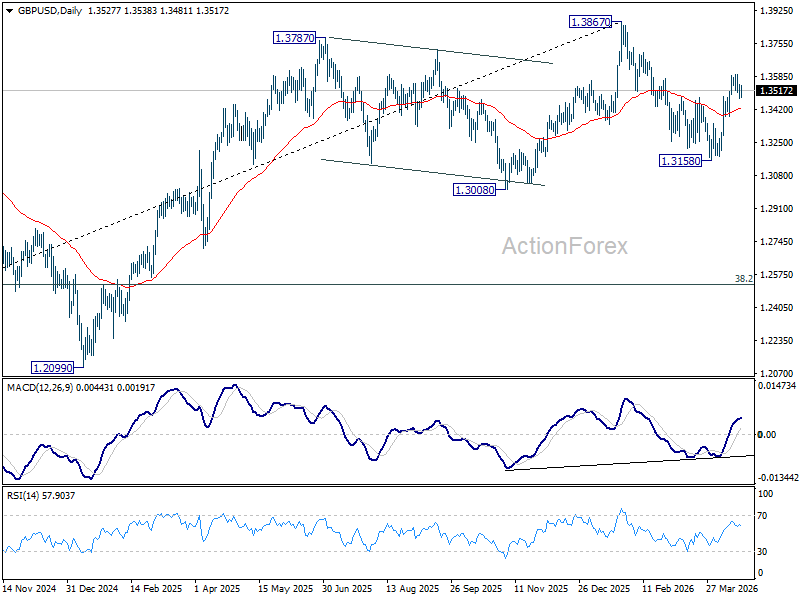
In the bigger picture, current development suggests that price actions from 1.3867 are merely a corrective pattern within the broader up trend from 1.0351 (2022 low). With 1.3008 support intact, medium term bullishness is maintained and break of 1.3867 is back in favor for a later stage, towards 1.4248 key resistance (2021 high).
EUR/USD Mid-Day Outlook
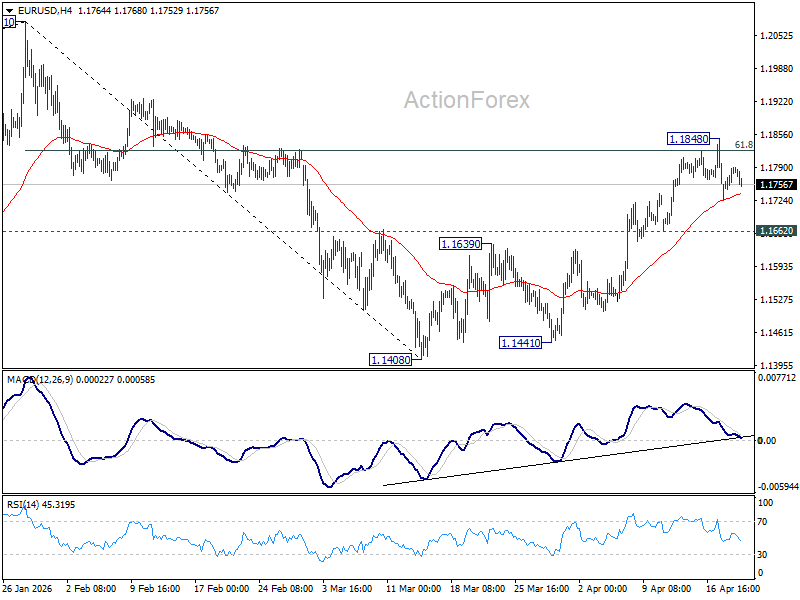
Daily Pivots: (S1) 1.1746; (P) 1.1768; (R1) 1.1809; More….
EUR/USD is still bounded in consolidations below 1.1848 and intraday bias remains neutral. With 1.1662 support intact, further rally is in favor. On the upside, sustained trading above 61.8% retracement of 1.2081 to 1.1408 at 1.1824 will pave the way to retest 1.2081 high. However, firm break of 1.1662 support will bring deeper decline back towards 1.1408 low instead.
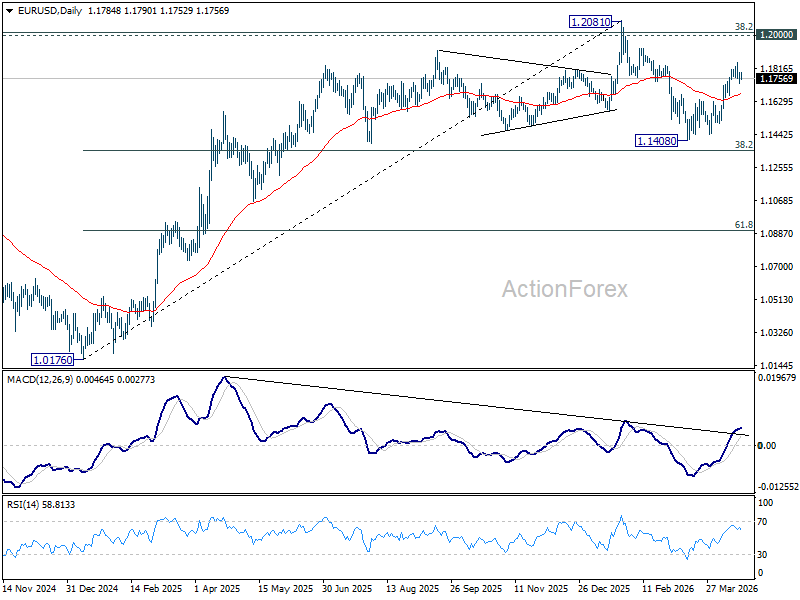
In the bigger picture, the strong support from 38.2% retracement of 1.0176 to 1.2081 at 1.1353 suggests that the pullback from 1.2081 is more likely a corrective move. Strong support was also found in 55 W EMA (now at 1.1507). Focus is back on 1.2 key cluster resistance level. Decisive break there will carry long term bullish implications. Nevertheless, break of 1.1408 support will revive the case of medium term bearish trend reversal.
Focus Shifts to Warsh’s Fed Testimony and Policy Pillars as Markets Await US–Iran Clarity
No confirmation on US–Iran talks means no conviction in markets—for now. The focus shifts to Kevin Warsh’s testimony before the Senate Banking Committee at 14:00 GMT. With geopolitics offering no clear signal, investors are turning to Warsh’s testimony for guidance on the future direction of the Federal Reserve and the credibility of its policy framework.
Warsh's prepared remarks have already been made public through advanced copies of his opening statement. He is focusing on three primary pillars to secure his confirmation:
Central Bank Independence: His most emphasized point is a vow to keep monetary policy "strictly independent." He is expected to tell the committee, "The Fed must stay in its lane," arguing that independence is at greatest risk when the central bank strays into fiscal or social policies.
Inflation Commitment: He has expressed a firm commitment to fighting inflation and achieving price stability, a move likely intended to calm markets concerned about potential political pressure for rapid rate cuts.
Response to Political Pressure: Addressing the friction between the White House and current Chair Jerome Powell, Warsh’s remarks suggest he views the Fed's insulation from short-term political pressure as a "mechanical necessity" for a stable economy.
With Powell’s term ending on May 15, today's testimony is the critical hurdle for Warsh to clear if the transition is to remain on schedule for mid-May.
In the currency markets, Kiwi is currently the strongest one for the week so far, boosted by today's Q1 NZ inflation data. Swiss Franc is the second best, and then Loonie. Yen is sitting at the bottom, followed by Aussie, and then Dollar. Euro and Sterling are positioning in the middles.
In Europe, at the time of writing, FTSE is down -0.14%. DAX is up 0.39% CAC is down -0.23%. UK 10-year yield is up 0.026 at 4.862. Germany 10-year yield is down -0.005 at 2.980. Earlier in Asia, Nikkei rose 0.89%. Hong Kong HSI rose 0.48%. China Shanghai SSE rose 0.07%. Singapore Strait Times rose 0.22%. Japan 10-year JGB yield fell -0.012 to 2.386.
US Retail Sales Surge 1.7% mom in March, Core Spending Signals Resilient Demand
US retail sales rose 1.7% in March, beating expectations, with strong gains in ex-auto spending. Core sales growth also signed resilient consumer momentum. Read More.
ECB’s de Guindos Says ‘Keep a Cool Head’ as Energy Prices Drive Inflation Uncertainty
The ECB is not rushing to act. De Guindos urges a “cool head” as energy prices drive inflation—but the real question is whether it spreads across the economy. Read More.
German ZEW Sentiment Sinks to -17.2 as Iran War Hits More Than Just Energy Costs
Germany’s ZEW economic sentiment falls sharply as Iran war fuels fears of energy shortages and weak investment, highlighting deeper risks to economic growth. Read More.
NZD/JPY to Resume Up Trend to 96.50 as Inflation Boosts RBNZ Rate Hike Bets
NZD/JPY is breaking higher as inflation pressures remain firm. With non-tradable prices holding up, markets are strengthening bets on an RBNZ rate hike later this year. The cross now looks ready to resume the medium term up trend towards 96.50 target. Read More.
NZ Inflation Holds at 3.1% as Non-Tradables Stay Firm, Energy Pressures Build
New Zealand inflation isn’t easing as expected. With CPI holding at 3.1% and non-tradable prices still firm, the data points to persistent domestic pressure—keeping RBNZ rate hike expectations alive. Read More.
New Zealand Business Confidence Slumps as Conflict Weighs, Inflation Pressures Rise, RBNZ July Hike Expected
New Zealand business confidence has dropped sharply as geopolitical tensions weigh on outlook—but pricing pressures are rising. With firms still lifting prices, NZIER sees the RBNZ moving toward a July rate hike. Read More.
EUR/USD Mid-Day Outlook
Daily Pivots: (S1) 1.1746; (P) 1.1768; (R1) 1.1809; More….
EUR/USD is still bounded in consolidations below 1.1848 and intraday bias remains neutral. With 1.1662 support intact, further rally is in favor. On the upside, sustained trading above 61.8% retracement of 1.2081 to 1.1408 at 1.1824 will pave the way to retest 1.2081 high. However, firm break of 1.1662 support will bring deeper decline back towards 1.1408 low instead.
In the bigger picture, the strong support from 38.2% retracement of 1.0176 to 1.2081 at 1.1353 suggests that the pullback from 1.2081 is more likely a corrective move. Strong support was also found in 55 W EMA (now at 1.1507). Focus is back on 1.2 key cluster resistance level. Decisive break there will carry long term bullish implications. Nevertheless, break of 1.1408 support will revive the case of medium term bearish trend reversal.