Sample Category Title
US Retail Sales Surge 1.7% mom in March, Core Spending Signals Resilient Demand
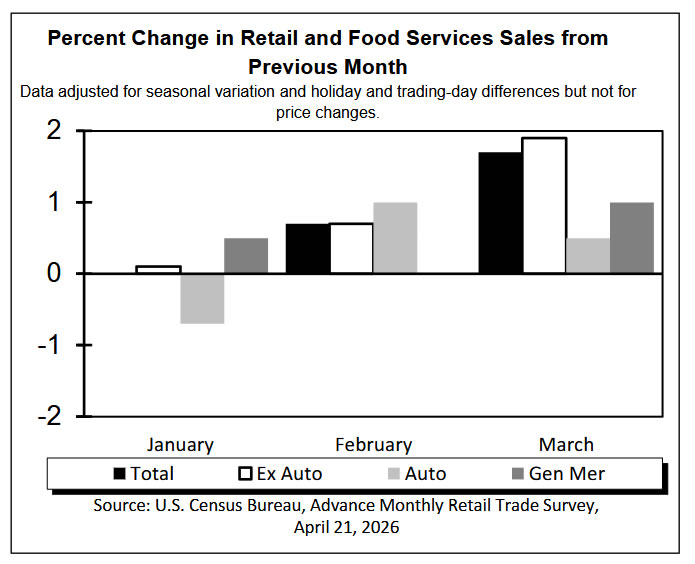
US retail sales rose 1.7% mom to USD 752.1B in March, beating expectations of 1.3% mom and pointing to stronger-than-anticipated consumer demand. Ex-auto sales climbed 1.9% mom to USD 612.4B, also above forecasts of 1.3% mom.
However, the composition shows a more nuanced picture. Sales excluding both autos and gasoline rose just 0.6% mom, indicating that core consumption growth was more moderate. Excluding gasoline alone, sales also increased 0.6% mom, suggesting that part of the headline strength may be linked to higher fuel prices rather than a broad-based acceleration in demand.
On a broader basis, retail sales for the January to March period rose 3.7% from a year ago, with non-store retailers leading gains at 10.1% yoy, highlighting continued strength in online spending.
| Data | Latest |
|---|---|
| Retail Sales | +1.7% |
| Ex-Auto Sales | +1.9% |
| Ex-Gasoline Sales | +0.6% |
| Ex-Auto & Gasoline | +0.6% |
Dollar Index: Trades Within Extended Range as Investors Await Fresh Direction Signals
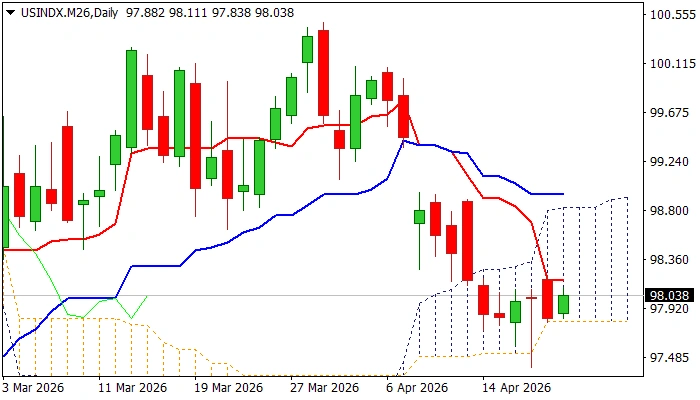
The Dollar was firmer in Asian / European trading on Tuesday and partially recover Monday’s losses (down 0.36% for the day), but near-term action remains within the boundaries of recent congestion ($97.40/$98.22) as traders await fresh direction signals, mainly from the Middle East peace talks.
Technical studies on daily chart remain predominantly negative (MAs in full bearish configuration with several bear-crosses being formed / negative momentum studies) but partially countered by Friday’s long-tailed Doji candle, which points to strong downside rejection and the downside attempts being so far limited by the base of ascending and thickening daily Ichimoku cloud ($97.80).
Fresh strength eyes initial resistance at $98.20 zone (near-term range top, reinforced by daily Tenkan-sen, turned sideways) break of which to ease immediate downside risk and expose more significant barriers at $98.57 (Fibo 38.2%$100.48/$97.40), $98.82 (daily cloud top) and 98.94 (50% retracement / daily Kijun-sen.
Otherwise, the downside would remain vulnerable (particularly in case the price remains within current congestion) though firm break through cloud base will be needed to generate fresh negative signal and expose next targets at $97.30 zone (Friday’s spike low / Fibo 61.8% of $95.38/100.48 / lower 20-d Bollinger band).
However, geopolitical factor is expected to remain the main driver, with greenback to face increased pressure on scenario of positive developments in the region (continuation of the peace talks / extended ceasefire / potential peace agreement) that would reduce demand for safe haven dollar, ease fears of stronger inflationary pressure = change of Fed’s recent narrative of need for policy tightening and make the dollar less attractive for investors.
Res: 98.15; 98.30; 98.52; 98.82.
Sup: 97.91; 97.50; 97.75; 97.31.
ECB’s de Guindos Says ‘Keep a Cool Head’ as Energy Prices Drive Inflation Uncertainty
ECB Vice-President Luis de Guindos signaled a cautious approach ahead of next week’s policy meeting, emphasizing the need to assess whether higher energy costs are feeding into broader inflation. Speaking in Spain, he stressed that policymakers must “keep a cool head” amid what he described as “tremendous uncertainty.”
De Guindos noted that current energy price developments sit between the ECB’s baseline scenario—where inflation rises only temporarily—and a more adverse scenario involving persistent spillovers into other prices. The key question for policymakers is whether rising oil and gas costs begin to affect wages and services, which would justify a stronger policy response.
His comments align with recent signals from President Christine Lagarde and other officials that the ECB is not yet ready to react to energy-driven inflation alone. The central bank appears set to hold rates steady next week, maintaining a wait-and-see stance as it evaluates incoming data.
Chart Alert: Bullish Flag Formation in Copper (XCU/USD) as 2nd US-Iran Peace Talks Loom
Key takeaways
- Risk-on rebound fuels copper rally: Copper surged ~17% from its March low, driven by improved sentiment after the US–Iran ceasefire, recovering most war-related losses and stabilizing near pre-conflict levels.
- Fundamentals are still supportive: Global manufacturing activity remains in expansion (PMI diffusion ~72%), providing a solid demand backdrop for copper, with upcoming flash PMI data as a key near-term catalyst.
- Bullish flag signals potential breakout: A consolidation pattern suggests continuation higher if 6.0680 breaks, targeting 6.1755–6.2910; failure below 5.8790 risks a deeper pullback toward moving average support zones.
Copper (XCU/USD) has also benefited from a revival of risk-on appetite in the past seven trading sessions due to the temporary two-week ceasefire agreement between the US and Iran since 8 April 2026 to negate the risk of stagflation driven by fears of a prolonged global oil supply disruption.
Dr Copper has benefited from recent risk-on behaviour
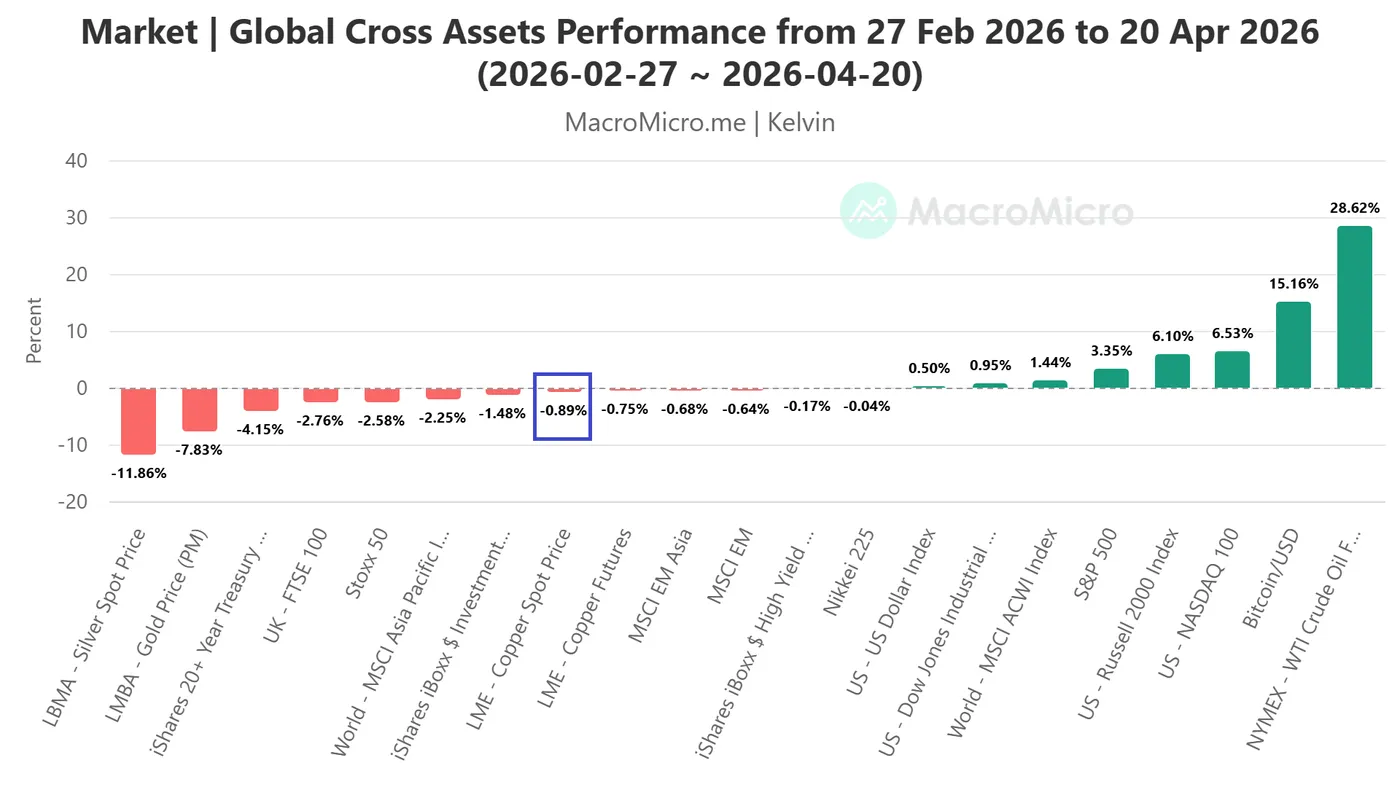
Fig. 1: Global Cross Assets Performance from 27 Feb 2026 to 20 Apr 2026 (Source: MacroMicro).
Copper has rallied by 17% from the 23 March 2026 low of 5.1889 to print a two-month high of 6.1037 on 15 April 2026 as market participants look forward to a peace deal resolution between the US and Iran, erasing its early loss of 14% from the onset of the US-Iran war. Based on the 27 February 2026 pre-war baseline till Monday, 20 Apr 2026, LME spot copper has traded almost unchanged at -0.75% (see Fig. 1).
In the past three days, a game of poker has emerged as both sides are trying to build a “stronger hand” ahead of the second round of peace talks to take place in Pakistan, either on Tuesday or Wednesday, as stated by US President Trump via a media interview.
The US has continued to enact a naval blockade on Iranian-registered oil tankers in the Strait of Hormuz, and Iran has continued to force a closure in the strait to prevent international vessels from transporting and obtaining oil supplies in the GCC region.
Global manufacturing PMI is the second driver to watch
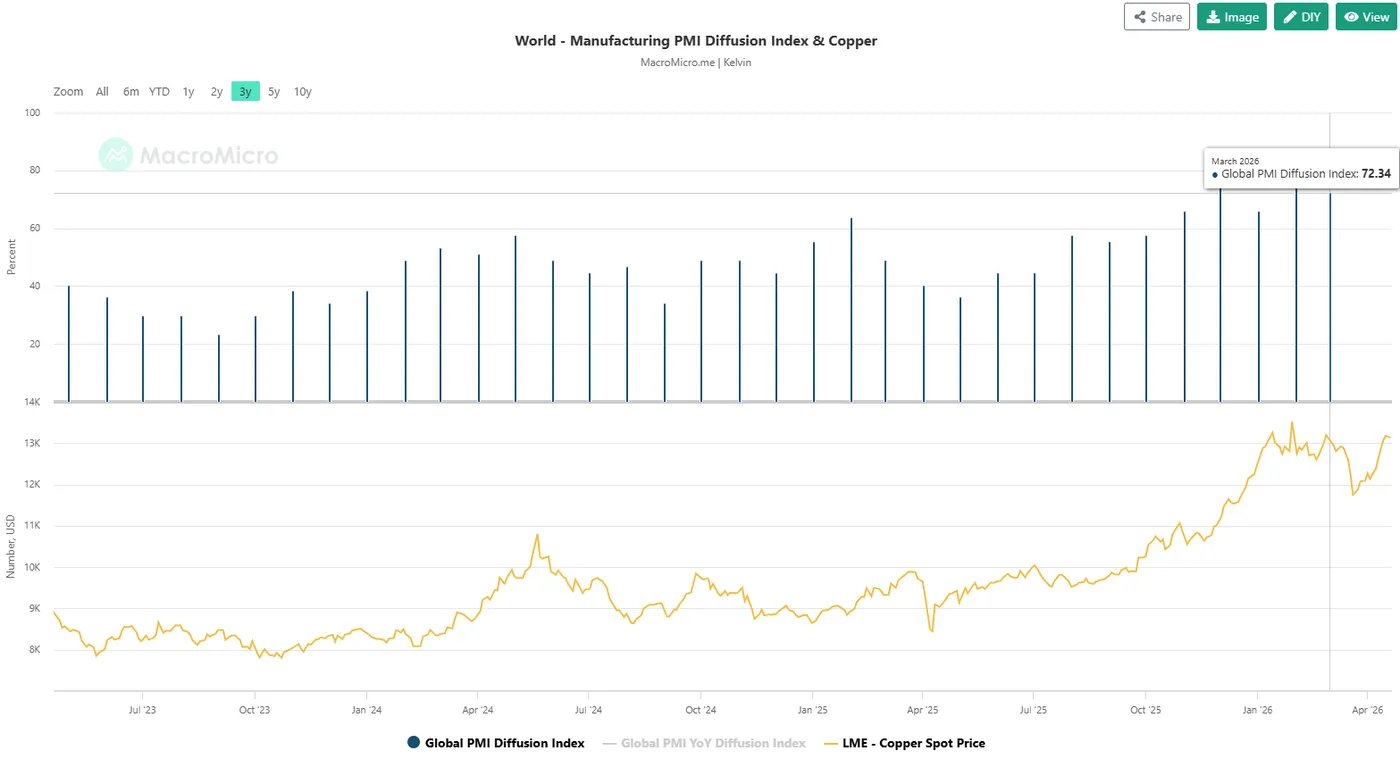
Fig. 2: Global Manufacturing PMI Diffusion Index as of March 2026 (Source: MacroMicro).
The longer-term price movement of copper is highly sensitive to manufacturing activities, as it is a vital component in the global manufacturing supply chains and industrial usage. Higher manufacturing activities tend to translate to a higher demand for copper, in turn, creating a positive feedback loop into the price of copper.
Manufacturing Purchasing Managers’ Index data compiled by S&P Global can be used as a leading indicator to gauge manufacturing activities.
Despite the rising risk of stagflation in the past six weeks since the start of the US-Iran war on 28 February 2026, on the aggregate, global manufacturing activities were still growing at a modest pace in March 2026.
The PMI Diffusion Index measures the proportion of countries whose manufacturing PMI is above or equal to 50 (an indication of expansion in activities), where it stood at 72.3% in March 2026, just down slightly from 74.5% in April 2026 (see Fig. 2).
Hence, there are still more than 50% of global economies’ manufacturing sectors in expansion modes, in turn, providing long-term bullish support for copper prices.
On Thursday, 23 April 2026, S&P Global will release flash PMI data for a slew of developed economies (Australia, Japan, the Eurozone, the UK, and the US). Therefore, a continuation of the expansion pace seen in these economies’ manufacturing PMIs is likely to maintain the ongoing short-term bullish trend of copper (XCU/USD).
Let's now focus on the short-term trajectory (1 to 3 days) of copper (XCU/USD) and its supporting elements from a technical analysis perspective.
Copper (XCU/USD) – Potential upside trigger at 6.0680
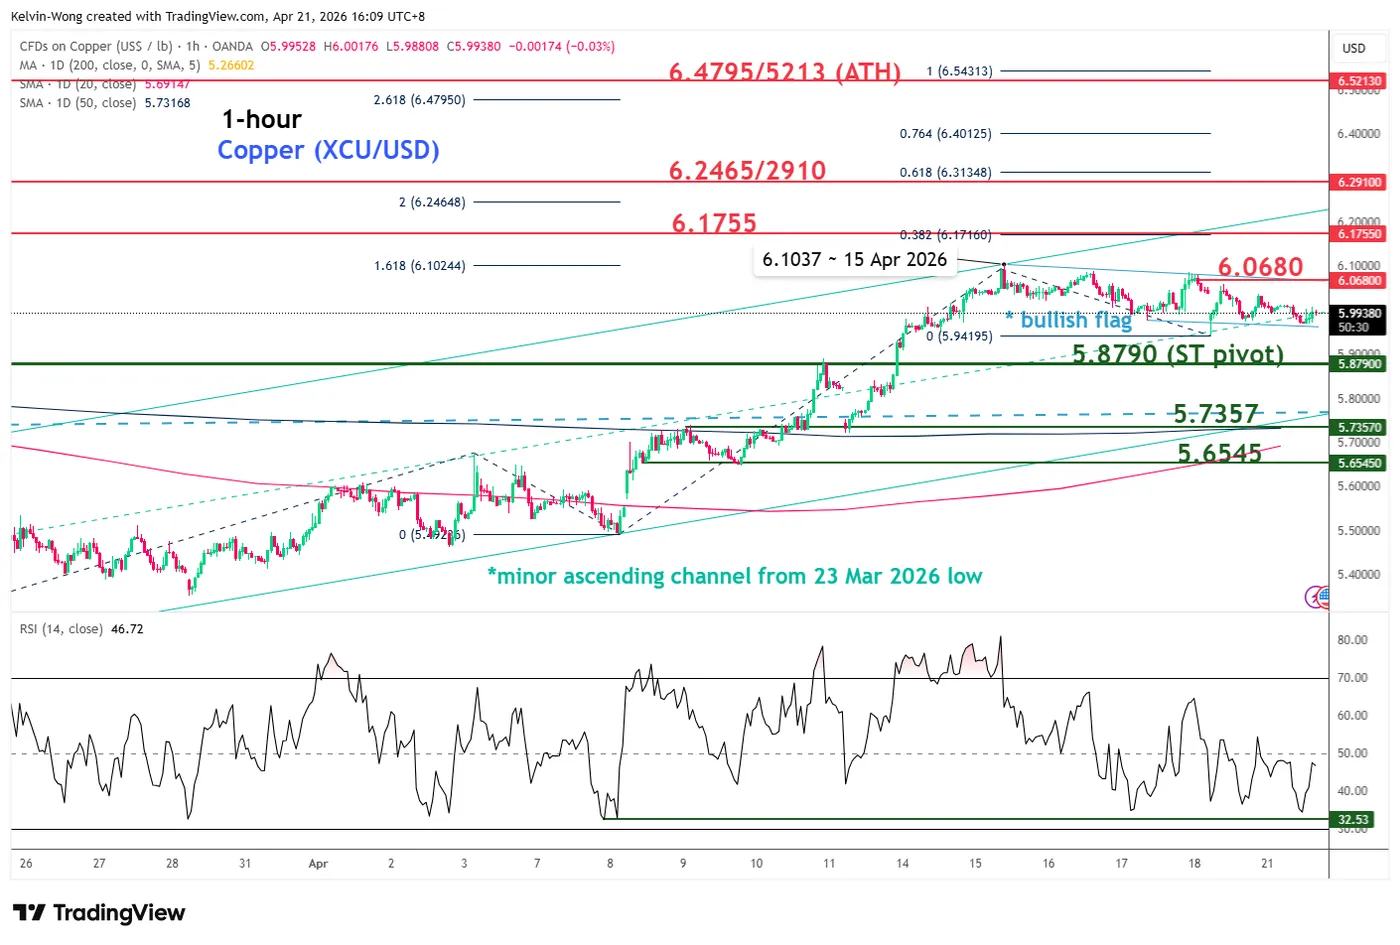
Fig. 3: Copper (XCU/USD) minor trend as of 21 Apr 2026 (Source: TradingView).
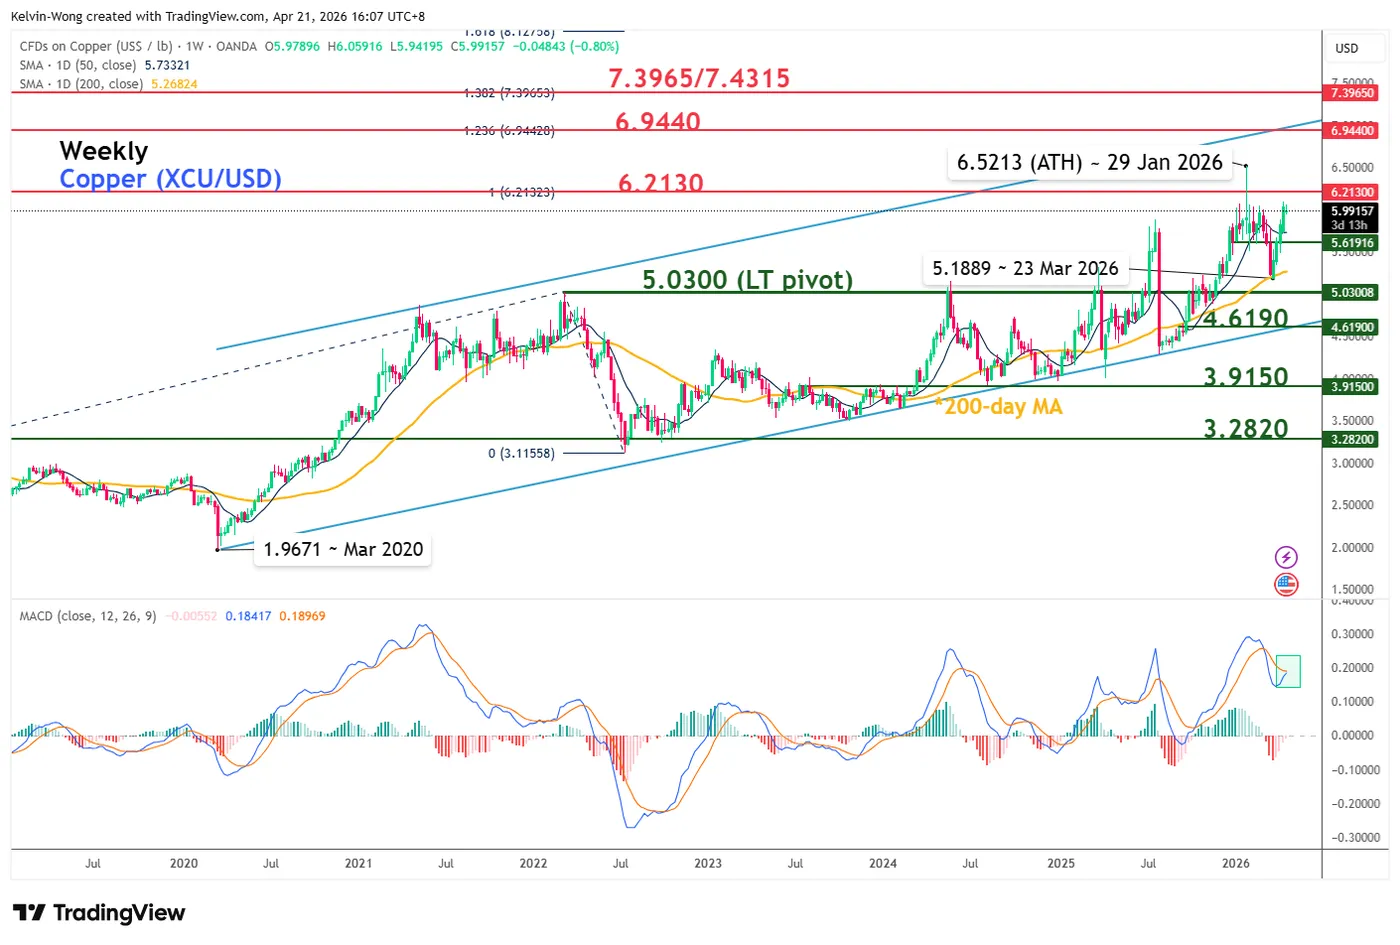
Fig. 4: Copper (XCU/USD) long-term secular trend as of 21 Apr 2026 (Source: TradingView).
Copper (XCU/USD) has shaped a minor corrective pull-back of 2.65% from its recent two-month high of 6.1037 printed on 15 April 2026.
Watch the 5.8790 key short-term pivotal support, and a clearance of 6.0680 (upper boundary of the bullish flag) triggers the start of another potential bullish impulsive up move sequence (see Fig. 3).
The next intermediate resistances stand at 6.1755 and 6.2465/6.2910 (also a Fibonacci extension).
On the other hand, a break and an hourly close below 5.8790 invalidates the bullish tone for another round of minor corrective decline to expose the next intermediate support zone of 5.7357/5.6545 (also the 20-day and 50-day moving averages).
Key elements to support the near-term bullish bias on copper (XCU/USD)
- The recent corrective pull-back from the 15 April 2026 high of 6.1037 has taken the form of a bullish consolidation chart pattern called “bullish flag,” with its upper boundary acting as near-term resistance at 6.0680.
- The price action of copper (XCU/USD) has continued oscillating within a minor ascending channel in place since the 23 March 2026 low and still has room to move towards the upper boundary of the channel at around 6.1755/6.2910.
- The hourly RSI momentum indicator has managed to stage a rebound close to its support at the 32 level.
CHFJPY Achieves New Highs from Blue Box Zone
In this technical blog, we will look at the past performance of the 4-hour Elliott Wave Charts of CHFJPY. In which, the rally from September 2024 low is unfolding as an impulse sequence. Therefore, called for more upside to take place. We knew that the structure in the pair should remains incomplete & should see more upside. So, we advised members not to sell the pair & buy the dips in 3, 7, or 11 swings at the blue box areas. We will explain the structure & forecast below:
CHFJPY 4-Hour Elliott Wave Chart From 3.31.2026
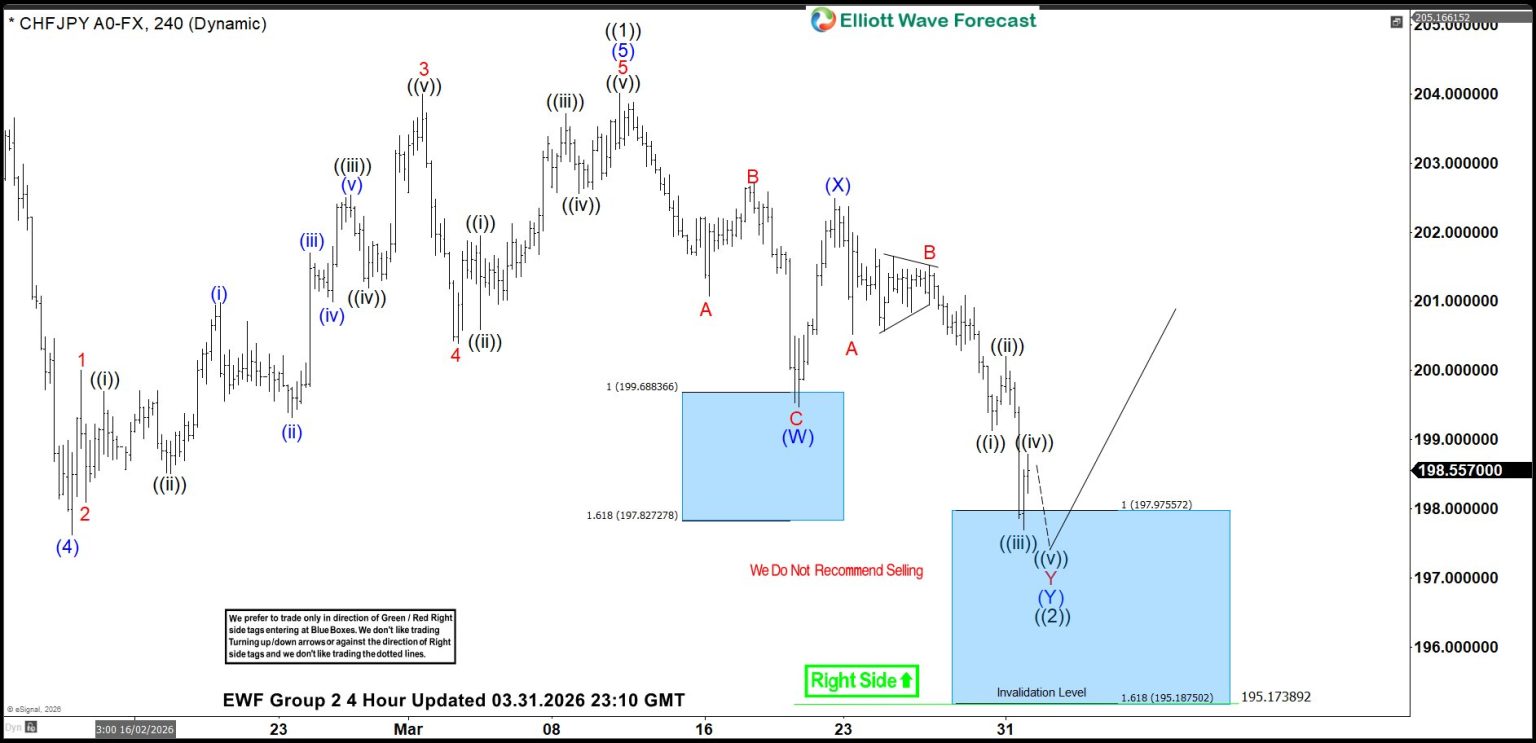
Here’s the 4-hour Elliott wave Chart from 3.31.2026 update. In which, the rally to 204.01 high completed wave ((1)) & made a pullback in wave ((2)). The internals of that pullback unfolded as Elliott wave double correction where wave (W) ended at 199.47 low. Then a bounce to 202.49 high-ended wave (X) & started the (Y) leg lower towards 197.97- 195.18 blue box area. From there, buyers were expected to appear looking for new highs ideally or for a 3-wave bounce minimum.
CHFJPY Latest 4-Hour Elliott Wave Chart From 4.20.2026
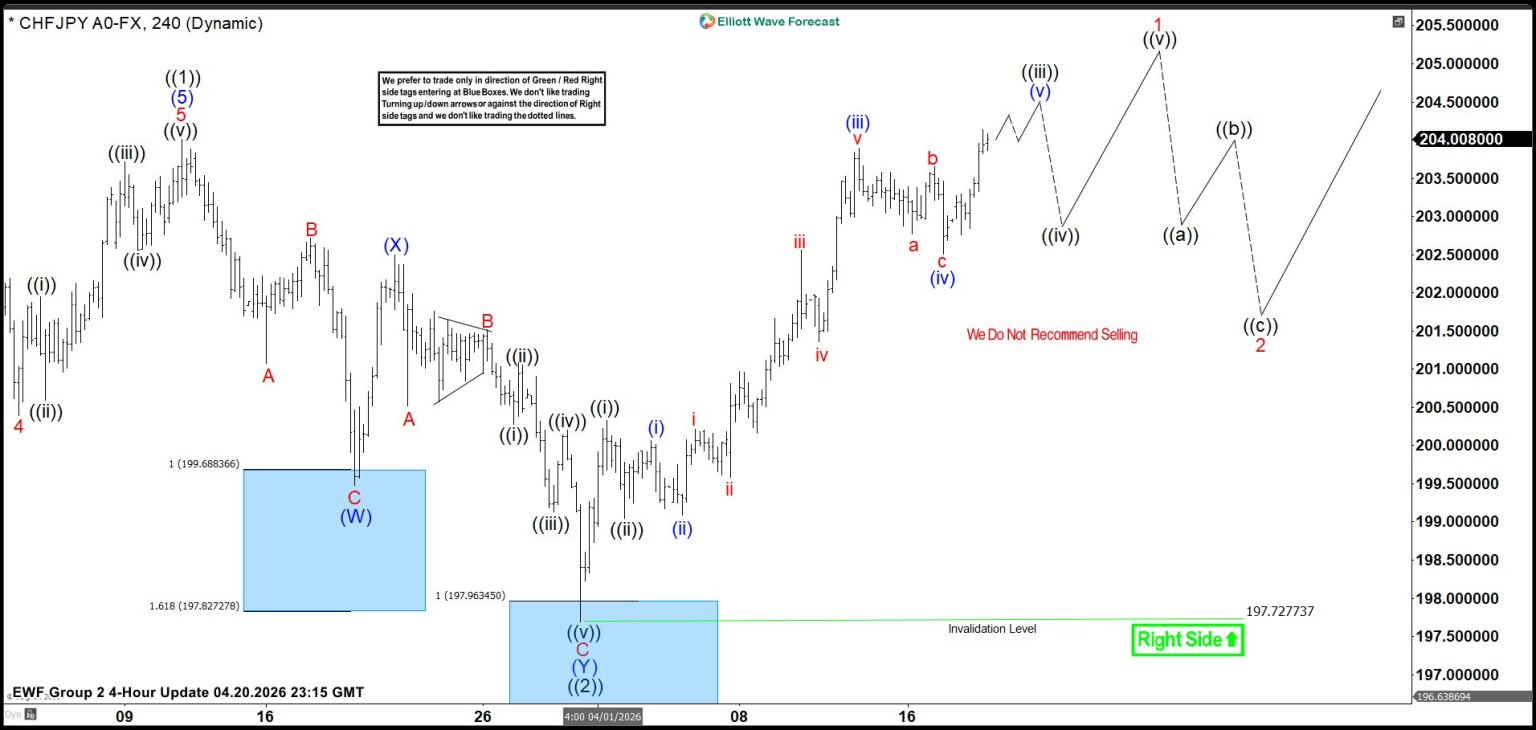
This is the latest 4-hour Elliott wave Chart from the 4.20.2026 update. In which the pair is showing a strong reaction higher taking place, right after ending the double correction within the blue box area. Allowed members to create a risk-free position shortly after taking the long position at the blue box area. Since than the pair has already made a new high above previous wave ((1)) high confirming the next leg higher towards 205.51- 207.92 initial target area before profit taking & next pullback unfolds.
Euro Has Closed the Gap But is in No Hurry to Rise
- Talks between the US and Iran are likely to take place.
- Divergence in monetary policy is supporting EURUSD.
EURUSD managed to close the gap down formed at the market open on Monday but is in no hurry to move higher. Investors prefer to wait for Iran’s participation in talks with the US and the outcome of those discussions. The ceasefire expires on 21 April, and Donald Trump says an extension is unlikely. The White House chief claims that the Americans continue to block the Strait of Hormuz and are threatening Tehran with more bombing.
Meanwhile, US investors are preparing for Kevin Warsh’s congressional hearings. The nominee for Fed chair believes that the central bank’s independence lies in its own hands. The US president may comment on the Fed’s decisions but cannot influence it. The nominee finds himself in an extremely difficult position, as some Republicans do not intend to support his candidacy while the Jerome Powell investigation is ongoing.
Donald Trump has promised to dismiss him from the Committee at the end of his term on 15 May if a new nominee is not approved. The power struggle is casting a shadow over the US dollar. The turmoil could put pressure on the greenback, as could the resumption of talk of a cut in the federal funds rate.
Kevin Warsh has repeatedly referred to Alan Greenspan. Greenspan kept rates steady during his tenure as Fed Chair, whilst other central banks were raising them. The rationale was the rise in productivity spurred by the Internet revolution. Artificial intelligence may also curb price growth, allowing the Fed to pursue a more accommodative monetary policy and putting pressure on the USD.
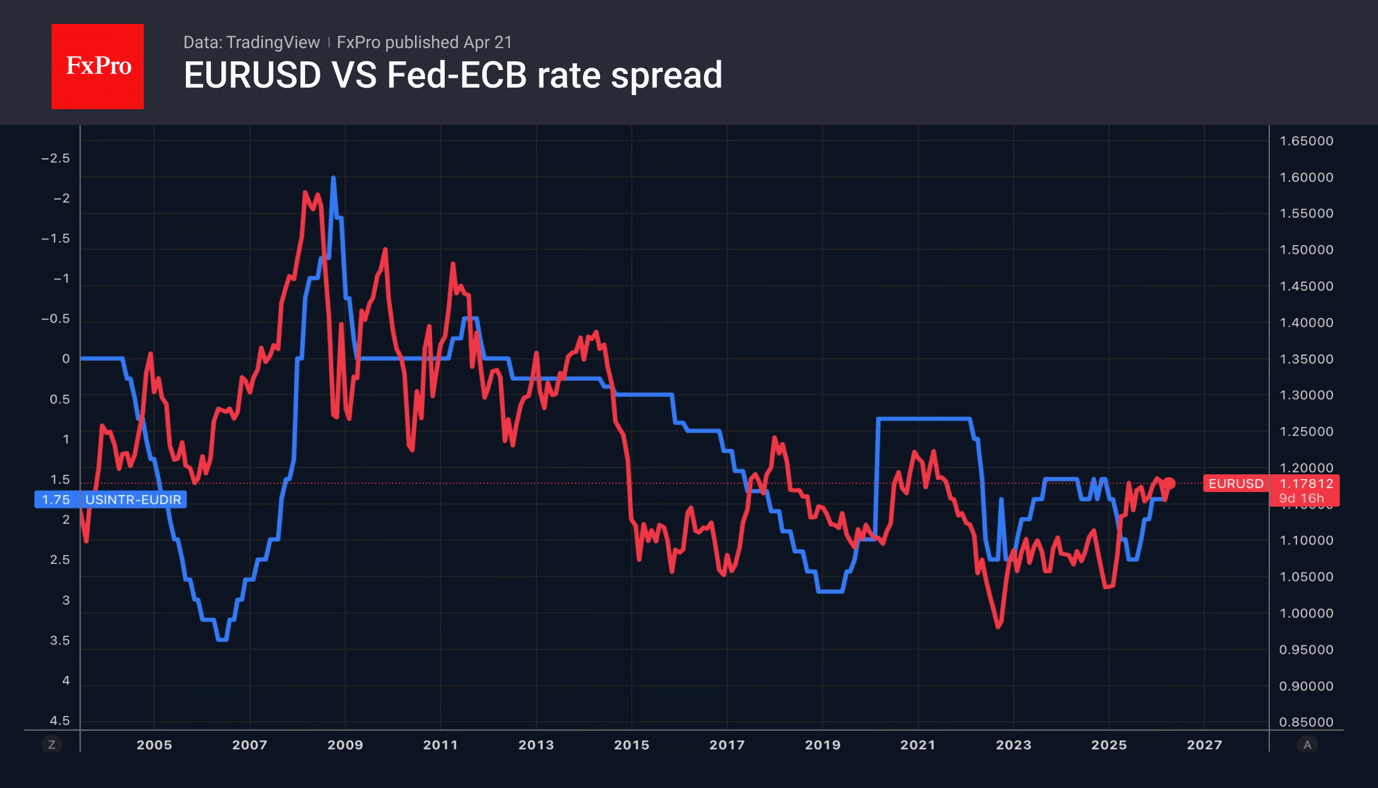
The euro was supported by a statement from Christine Lagarde, who said that the ECB would raise rates higher than expected if governments were too generous. They would provide significant assistance to households facing rising energy costs, but this could push eurozone inflation above 6%. In turn, this would force the European Central Bank to tighten monetary policy aggressively, bolstering the EURUSD by narrowing the interest rate differential between the ECB and the Fed.
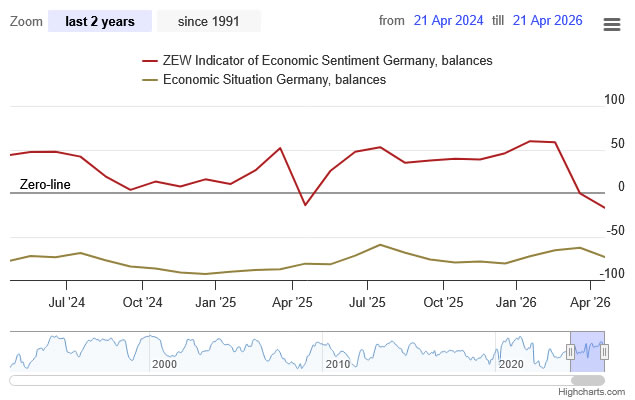
German ZEW Sentiment Sinks to -17.2 as Iran War Hits More Than Just Energy Costs
Germany’s economic sentiment deteriorated sharply in April, with the ZEW Economic Sentiment index plunging from -0.5 to -17.2, well below expectations of -6.7, and marking the lowest level since late 2022.The weakness is not limited to expectations. The Current Situation Index fell from -62.9 to -73.7, also undershooting forecasts of -69.5, signaling that the economy is already under pressure.
Across the Eurozone, sentiment followed a similar pattern, with the headline index dropping from -8.5 to -20.4 and the current conditions gauge falling by -13.1 points to -43.0.
According to ZEW President Achim Wambach, the impact of the Iran War extends beyond rising energy costs. Businesses are increasingly concerned about "long-term shortages of energy supply", which is discouraging investment and weakening the effectiveness of government support measures.
Sector data reinforces the negative trend. While expectations for the automotive sector remain deeply negative but stable, outlooks for chemicals, pharmaceuticals, and metals deteriorated significantly. Construction sentiment also turned negative. The broad-based decline suggests that the drag from geopolitical uncertainty is spreading across industries.
| Data | Latest | Previous |
|---|---|---|
| Germany ZEW Economic Sentiment | -17.2 | -0.5 |
| Germany Current Situation Index | -73.7 | -62.9 |
| Eurozone ZEW Economic Sentiment | -20.4 | -8.5 |
| Eurozone Current Situation Index | -43.0 | -29.9 |
Crypto: Sentiment Recovering, Bitcoin Finds Support at Ever-Higher Levels
Market Overview
The crypto market cap rose by 2.52% over the past 24 hours to $2.56 trillion. Among the most liquid coins, the top gainers are Basic Attention Token (+7.7%), Immutable (+7.6%) and Toncoin (+5.9%). Lagging are Tron (−0.74%), Uniswap (−0.68%) and Algorand (+0.2%).
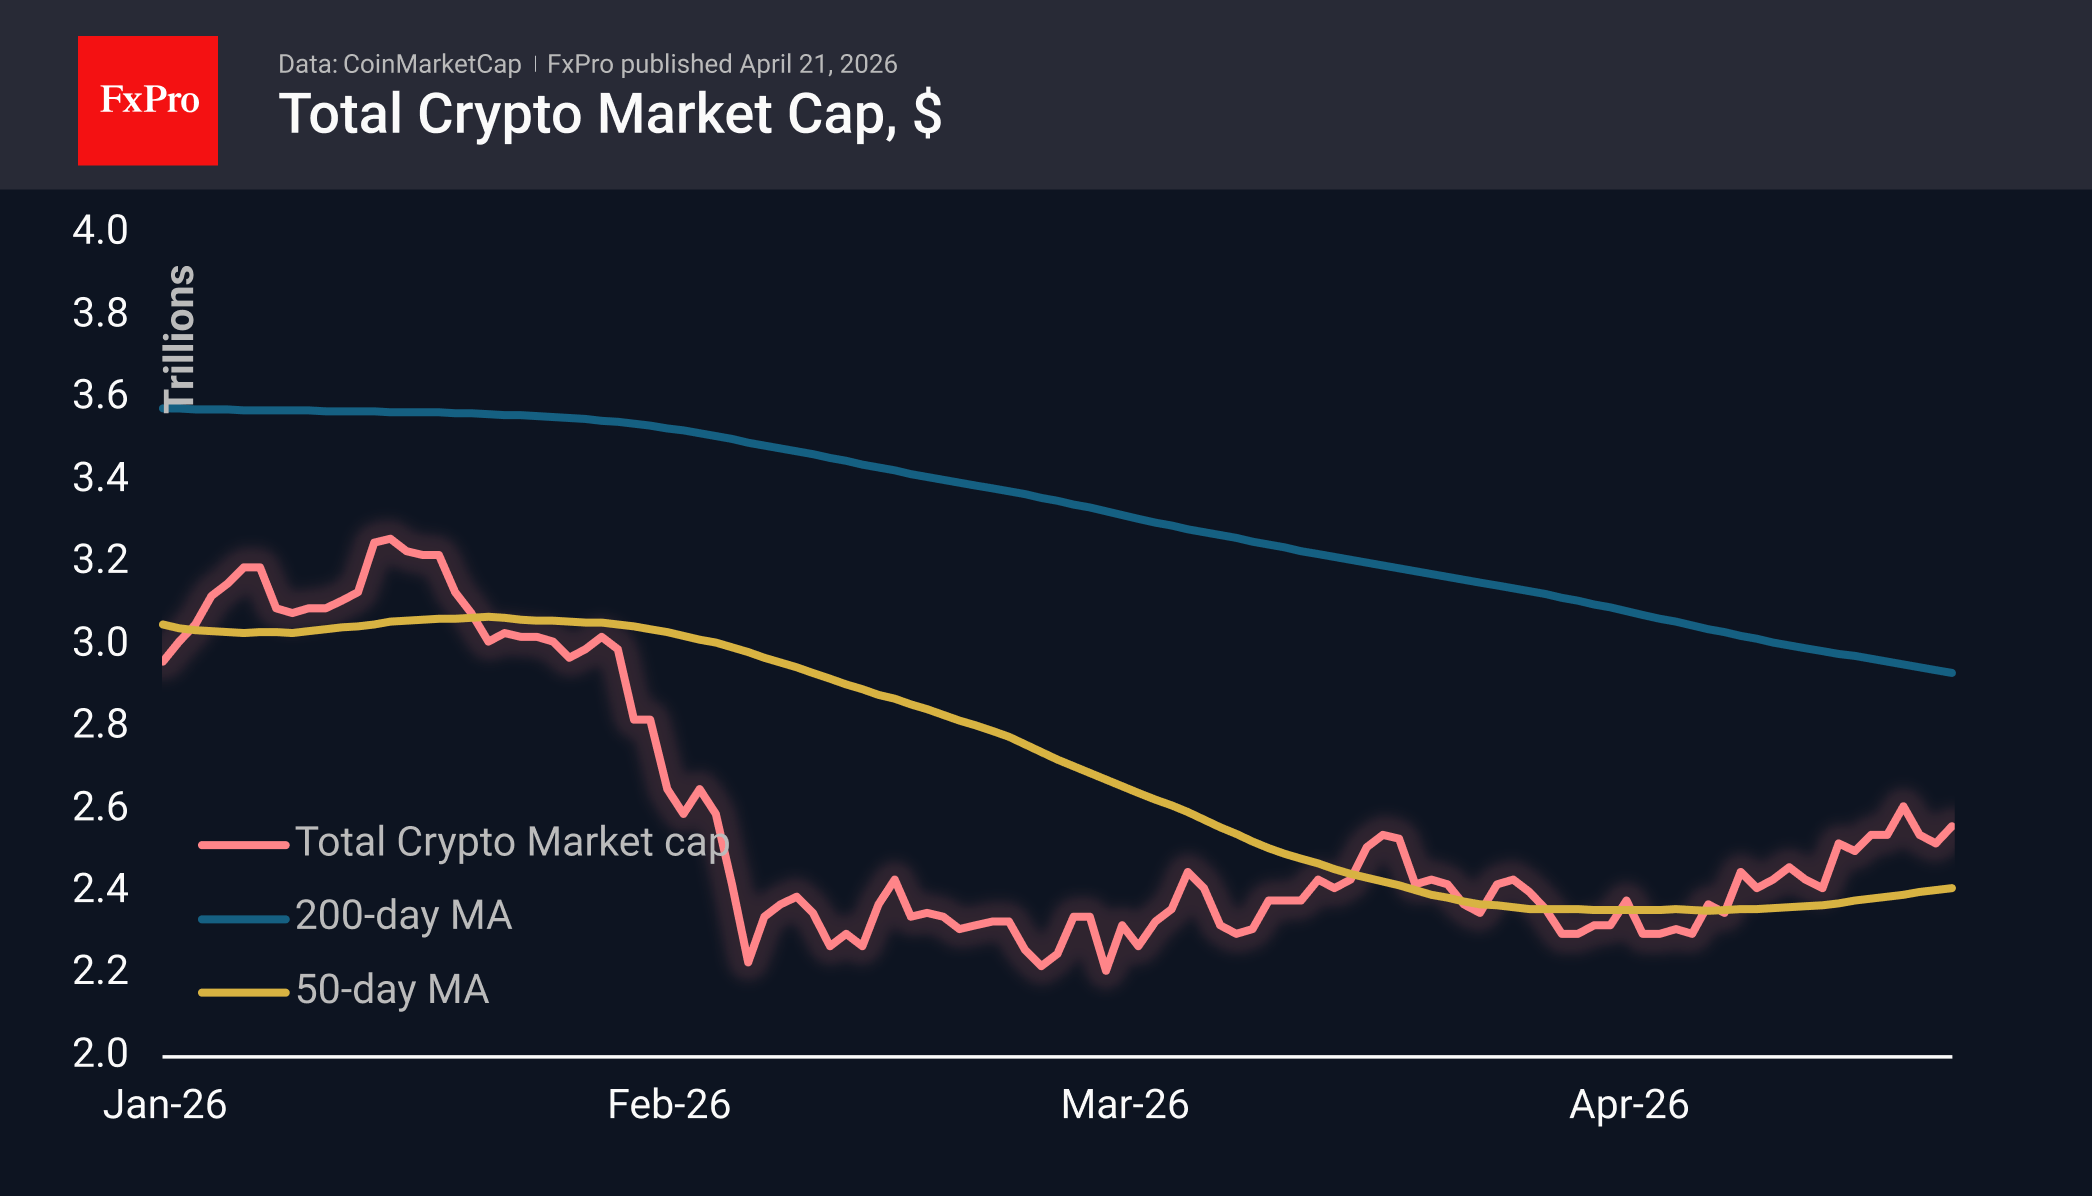
The sentiment index is continuing its recovery, rising to 33, its highest level since 19 January. This remains in fear territory but is now close to neutral levels.
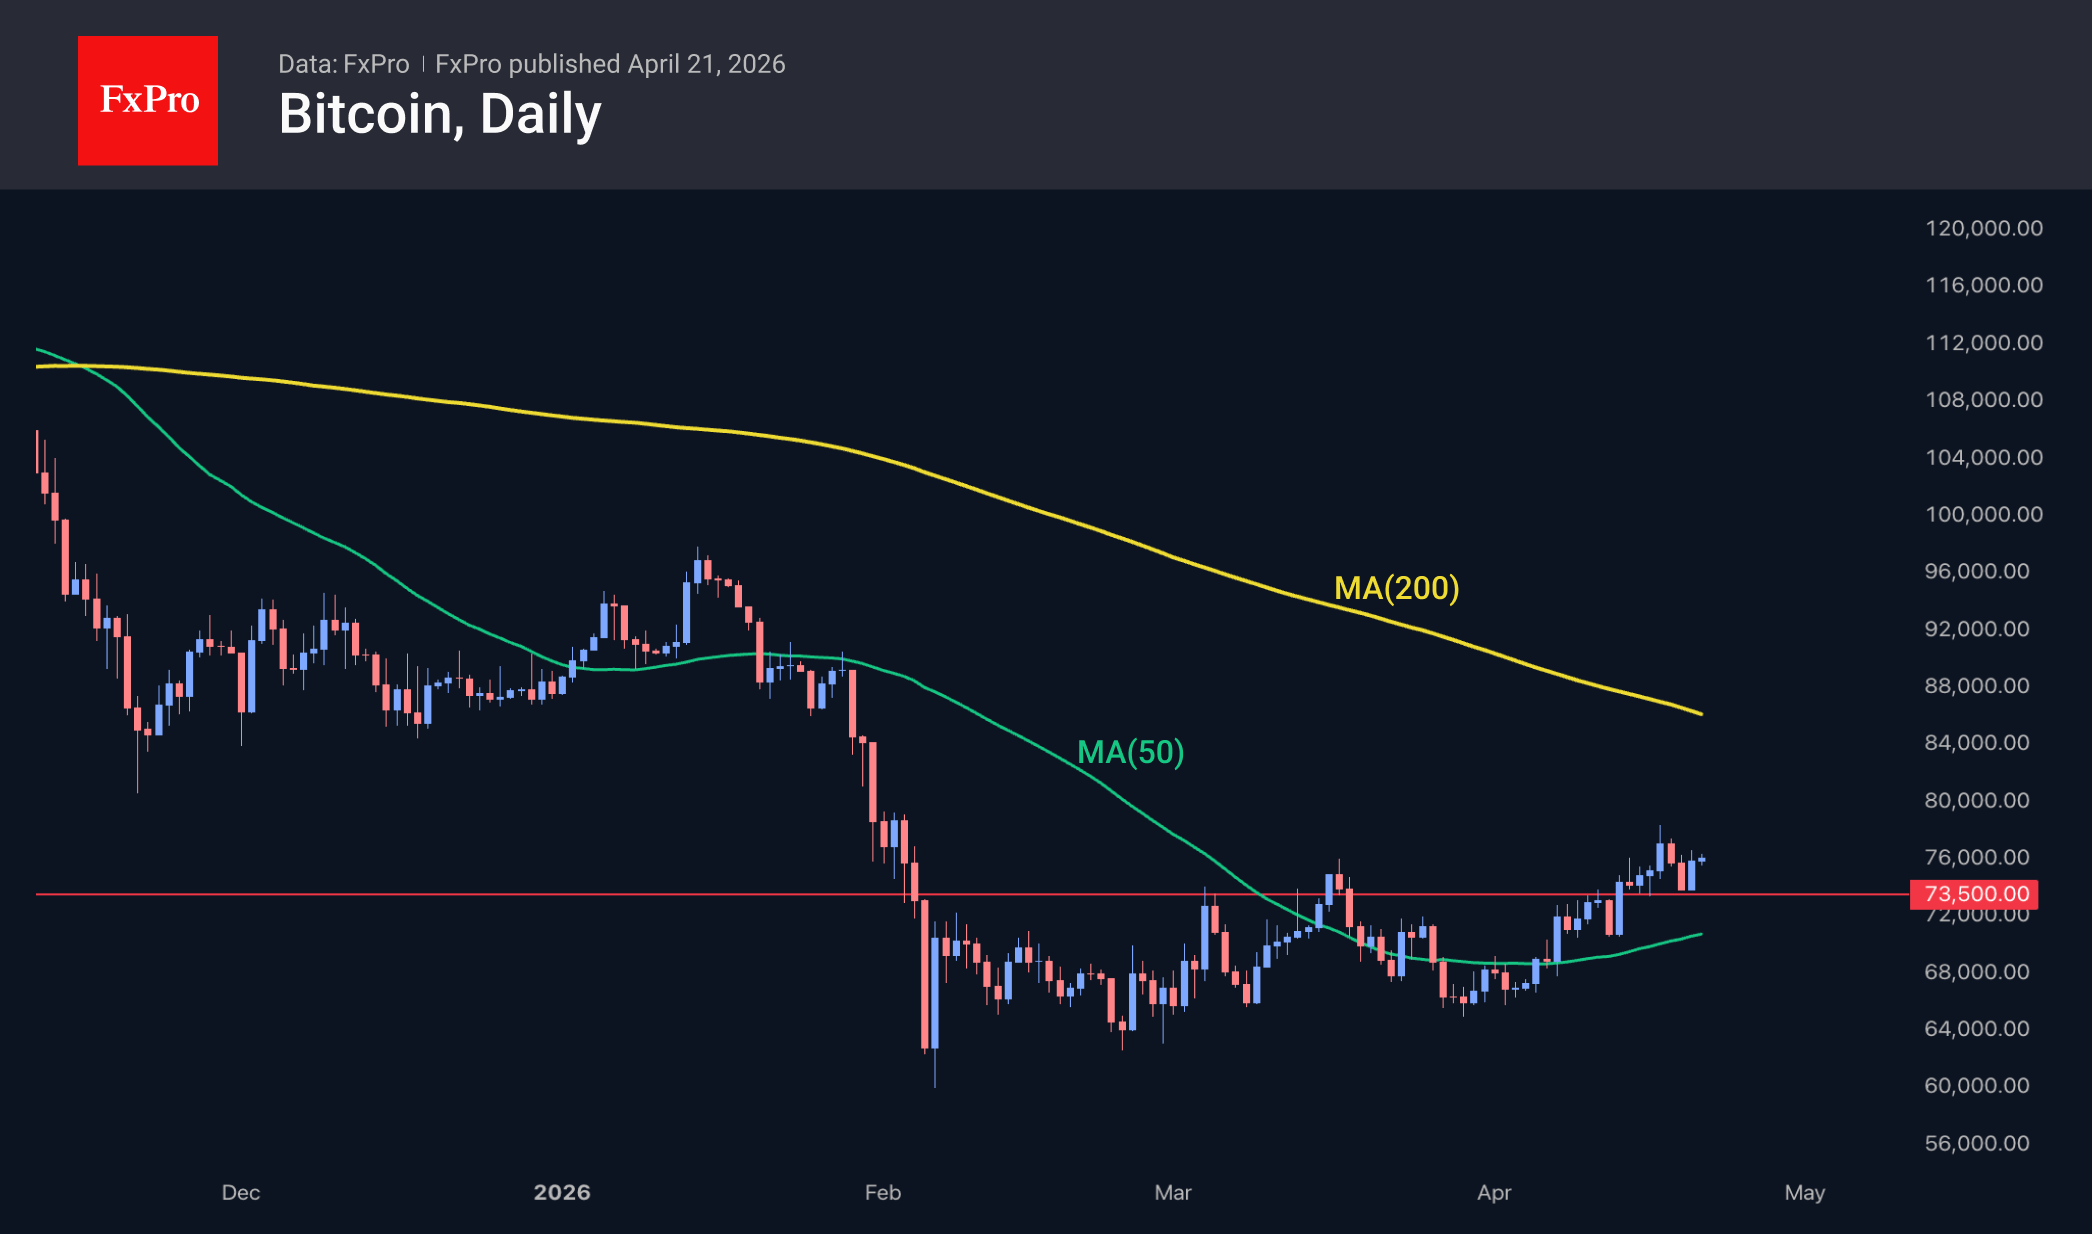
Bitcoin is trading at $76K, having found support at March’s highs during yesterday’s intraday pullback. This classic transformation of resistance into support points to further positive momentum in the coming days towards $86K, where the 200-day moving average and the support zone from late last year are concentrated.
News Background
According to CoinShares, global investments in crypto funds rose by $1.401 billion last week, hitting their highest level since mid-January. Investments in Bitcoin increased by $1.116 billion, in Ethereum by $328 million, in Chainlink by $5 million, and in Sui by $2 million. Investments in XRP fell by $56 million, and in Solana by $2 million.
Bitcoin has consolidated above the realised price of short-term holders at around $69,400, notes analyst Darkfost. This helps restore confidence among traders who have recently entered the market and reduces the likelihood of their rapid capitulation.
65% of Japanese institutional investors use Bitcoin to diversify their portfolios, according to a survey by Japanese financial holding company Nomura. 31% of respondents view the market outlook positively. Most investors plan to allocate between 2% and 5% of their capital to crypto assets over the next three years.
Strategy has made its largest Bitcoin purchase since November 2024, acquiring 34,164 BTC for $2.54 billion at an average price of $74,395 per coin. Strategy now holds 815,061 BTC, purchased for $61.6 billion at an average price of $75,527 per Bitcoin.
Over the past week, BitMine has increased its purchases to 101,627 ETH. The company’s reserves have exceeded 4.97 million ETH, representing 4.12% of the Ethereum supply. ETH is showing resilience amid geopolitical instability and is in demand in AI and asset tokenisation, noted BitMine CEO Tom Lee.
Investors withdrew over $13 billion from DeFi protocols in two days following Saturday’s $292 million hack of the Kelp, liquid restaking protocol.
Pound Declines Amid Geopolitics and Political Risks
GBP/USD traded at 1.3515 on Tuesday as the US dollar strengthened. Pressure on the pound intensified at the start of the week following a sharp escalation of the US-Iran conflict, with markets fearing the breakdown of the truce and rotating into safe-haven assets.
The trigger was heightened tensions around the Strait of Hormuz. The US reported the detention of an Iranian vessel, while Tehran refused to participate in further negotiations. This development supported higher oil prices and boosted demand for the dollar.
An additional factor weighing on sterling is domestic UK politics. Prime Minister Keir Starmer has come under pressure following the scandal surrounding the appointment of Peter Mandelson as ambassador to the US. The market is watching his parliamentary address and assessing the risks of political instability.
Despite the current decline, the pound remains close to two-month highs and is up approximately 2% for the month. It had previously been supported by expectations of de-escalation in the Middle East. If political pressure on the government intensifies further, the pound could give back some of its recent gains.
Technical Analysis
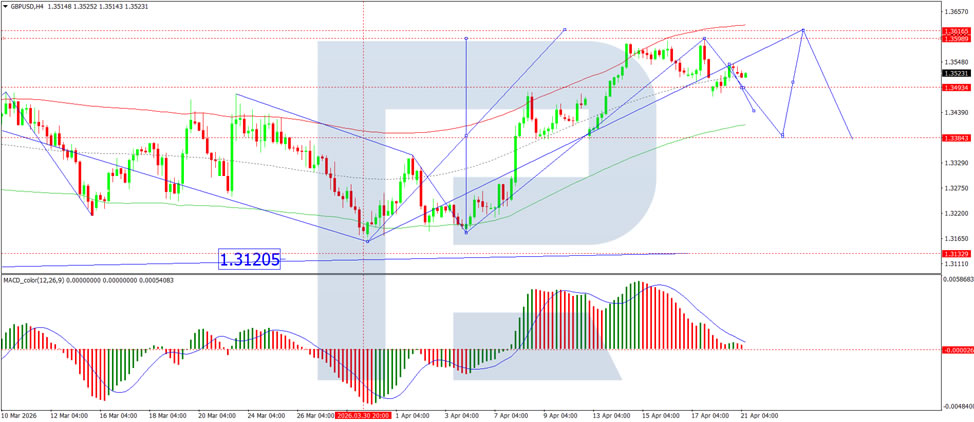
On the H4 GBP/USD chart, the market is forming a wide consolidation range above 1.3494, currently extending up to 1.3545. A move lower towards 1.3333 is likely in the near term. Following this correction, a new consolidation range is likely to form. An upside breakout would open potential for a continuation wave to 1.3611, while a downside breakout would suggest further movement to 1.3120. Technically, this scenario is confirmed by the MACD indicator, with its signal line above the zero level and pointing firmly downwards.
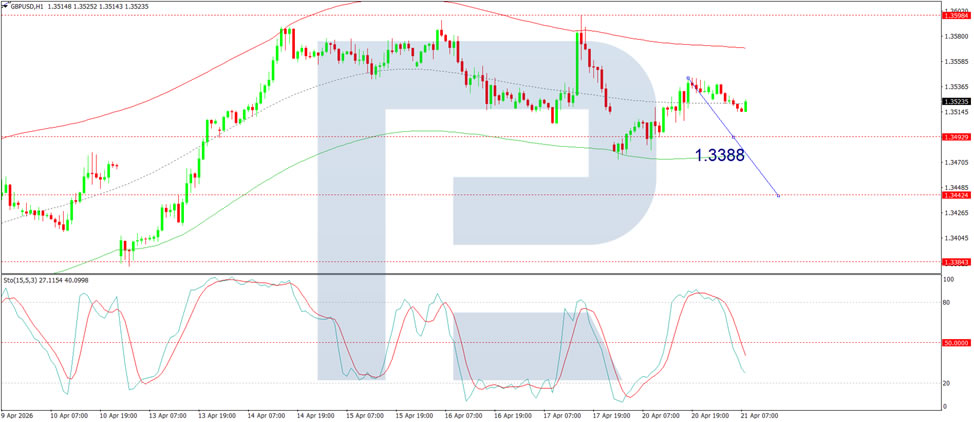
On the H1 chart, the market has formed a compact consolidation range around the 1.3515 level. A downside breakout could lead to a move towards 1.3444, followed by a possible rise to 1.3495. Technically, this scenario is confirmed by the Stochastic oscillator, with its signal line below the 20 level and pointing firmly downwards.
Conclusion
The pound has come under pressure as renewed US-Iran tensions around the Strait of Hormuz drive safe-haven demand for the dollar. At the same time, domestic political uncertainty adds an extra layer of risk. The detention of an Iranian vessel and Tehran's refusal to negotiate have revived energy supply concerns and pushed oil prices higher. Meanwhile, the scandal surrounding the UK ambassador appointment has put Prime Minister Starmer in a difficult position, with markets assessing the potential for political instability. Despite the current pullback, sterling remains near two-month highs, having gained 2% this month. However, technical indicators suggest further near-term downside, and the pound could give back more of its recent gains if geopolitical or political pressures intensify.
GBP/JPY Daily Outlook
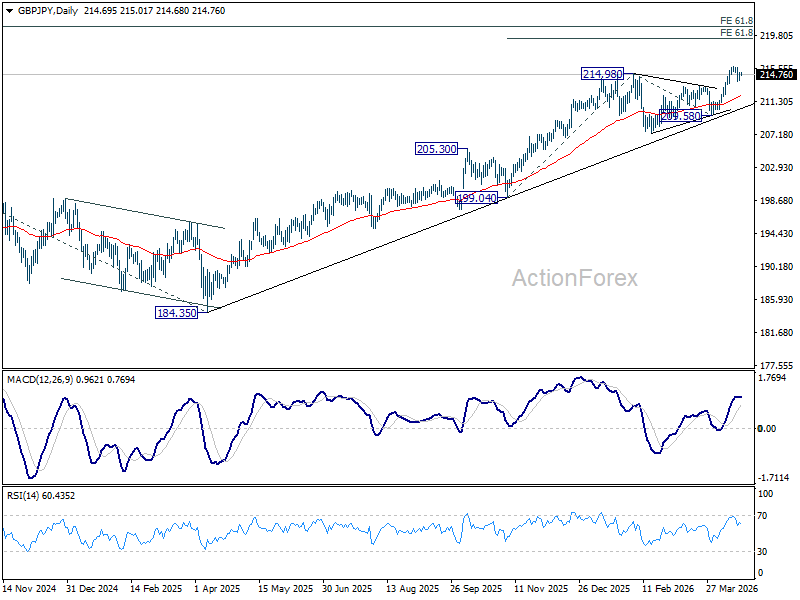
Daily Pivots: (S1) 214.36; (P) 214.73; (R1) 215.34; More...
GBP/JPY is extending consolidations below 215.98 and intraday bias remains neutral. Further rise is expected as long as 213.29 resistance turned support holds. Firm break of 215.89 will resume larger up trend to 61.8% projection of 199.04 to 214.98 from 209.58 at 219.43.
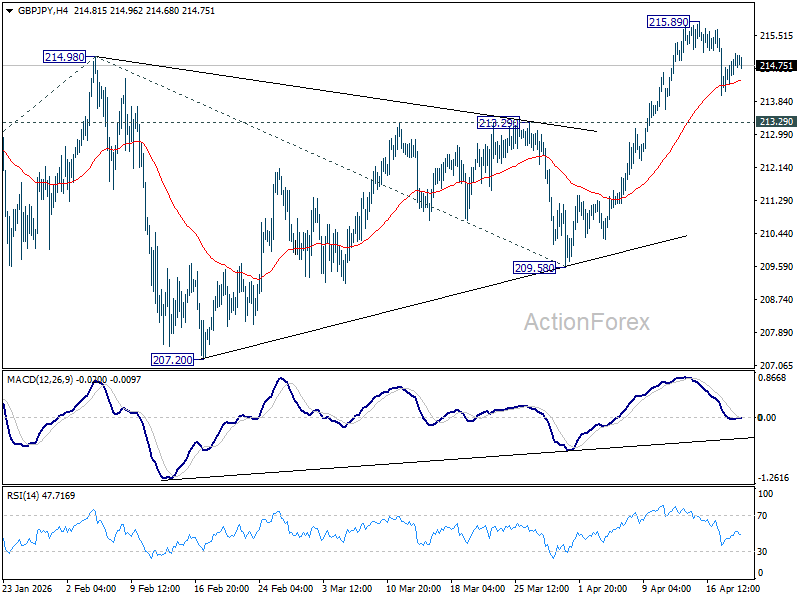
In the bigger picture, up trend from 123.94 (2020 low) is still in progress. Firm break of 214.98 will target 61.8% projection of 148.93 (2022 low) to 208.09 (2024 high) from 184.35 at 220.90. This will remain the favored case as long as 55 W EMA (now at 204.83) holds, even in case of another deep pullback.