Sample Category Title
Altcoins Upbeat, Bitcoin Hesitant to Breakout
Market picture
The crypto market added 0.5% in 24 hours to $2.46 trillion as a rebound in risk appetite in stocks helped altcoins attract buying interest. The Crypto Fear & Greed Index added 1 point to 72 (Greed).
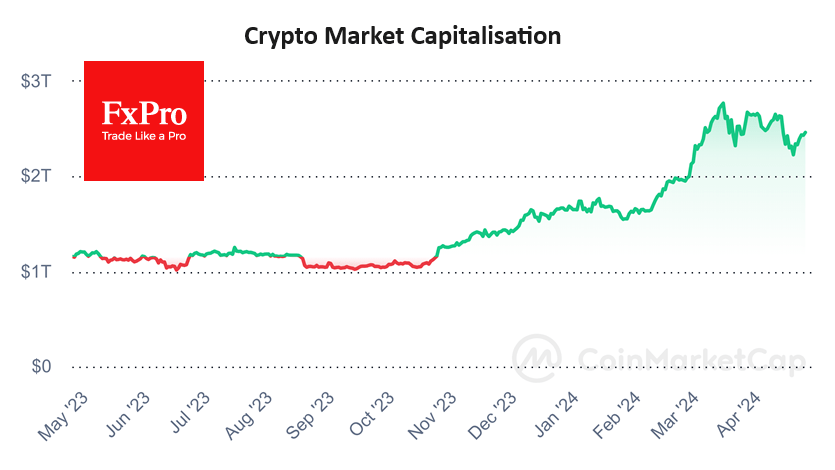
Bitcoin is avoiding sharp swings and is trading at $66.75K on Wednesday morning, adding 0.3% in 24 hours but remaining inside the previous day’s range. It looks like a very cautious testing of the 50-day moving average (now at $67.3K), but just shy of surpassing it for the third day in a row.
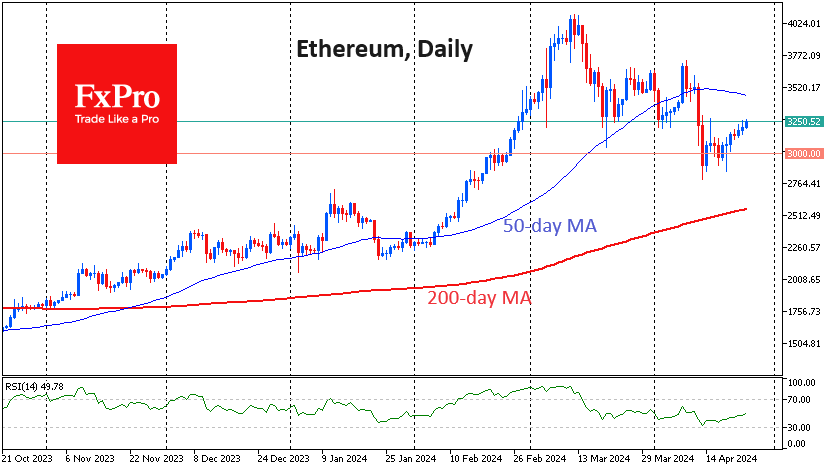
Ethereum appears more upbeat, adding 2.3% in 24 hours to $3250, once again near the highs since 13 April. However, Ethereum’s decline has been deeper, pulling the price back below the support area of March and the first few days of April. Right now, the price is 6% below the 50-day MA that Bitcoin is nearing.
News background
Thanks to Bitcoin’s halving, crypto assets are recovering from losses caused by geopolitical tensions, ETC Group noted. The positive effects of the halving are not expected to begin to manifest themselves until about 100 days after the event – in August.
The US SEC has extended the review period for Franklin Templeton’s application to launch an Ethereum-based spot ETF. The next deadline is 11 June. After that date, the SEC will have to either give the green light or reject the application to launch the new product.
Bitcoin is entering a “DeFi summer” similar to Ethereum in 2020 thanks to record fees, Bernstein noted. Activity on the network is largely due to the launch of the Runes protocol.
According to The Block Data Dashboard, the combined market value of USD-linked stablecoins has risen to $165.2bn, the highest since June 2022, with 70% of this market share in USDT.
A class action lawsuit has been filed against Binance in Canada. A group of investors claim that the exchange violated local securities laws. Binance announced that it would cease operations in Canada back in May 2023.
AUD/USD Rises Sharply on Inflation News
The Consumer Price Index for Australia was released this morning. According to ForexFactory:
→ CPI in quarterly terms: actual = 1.0%, expected = 0.8%, previous value = 0.6%;
→ CPI in annual terms: actual = 3.5%, expected = 3.4%, previous value = 3.4%.
Rising inflation figures suggest that the Reserve Bank of Australia's tight monetary policy may continue beyond expectations - which is why the Australian dollar has jumped higher relative to other currencies.
Thus, from the minimum of the year against the US dollar, recorded on April 19, the Ausssie rose in price by more than 2%.
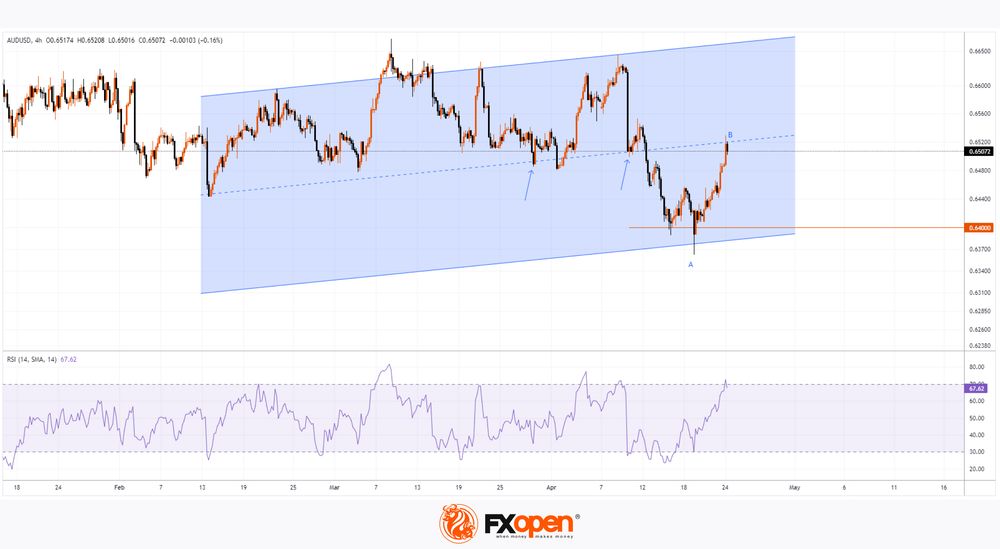
Technical analysis of the AUD/USD chart today shows that:
→ the price has reached the median of the ascending channel. Previously, this line served as support (as shown by the arrows), so there is reason to believe that it will provide resistance after rapid growth;
→ at the same time, the key support appears to be the level of 0.64, where the lower border of the channel lies;
→ the RSI indicator is in the overbought zone.
It is possible that in the short term there will be a correction after a sharp increase in the price of AUD/USD — for example, by 50% of the A→B impulse.
And to assess the long-term outlook, the upcoming release of important data for the United States will provide valuable information:
→ US GDP, tomorrow at 15:30 GMT+3
→ Personal Consumption Expenditures (PCE) USA, on Friday at 15:30 GMT+3.
Trade over 50 forex markets 24 hours a day with FXOpen. Take advantage of low commissions, deep liquidity, and spreads from 0.0 pips. Open your FXOpen account now or learn more about trading forex with FXOpen.
This article represents the opinion of the Companies operating under the FXOpen brand only. It is not to be construed as an offer, solicitation, or recommendation with respect to products and services provided by the Companies operating under the FXOpen brand, nor is it to be considered financial advice.
Gold Price Corrects Gains While Oil Price Regains Strength
Gold price rallied above $2,400 before correcting lower. Crude oil price is rising and it could climb further higher toward the $85.50 resistance.
Important Takeaways for Gold and Oil Prices Analysis Today
- Gold price rallied significantly above $2,400 and recently corrected lower against the US Dollar.
- It cleared a key bearish trend line with resistance at $2,310 on the hourly chart of gold at FXOpen.
- Crude oil prices are moving higher above the $82.00 resistance zone.
- There was a break above a connecting bearish trend line with resistance at $82.00 on the hourly chart of XTI/USD at FXOpen.
Gold Price Technical Analysis
On the hourly chart of Gold at FXOpen, the price was able to climb above the $2,350 resistance, as mentioned in the previous analysis. The price even broke the $2,400 level before the bears appeared.
The price traded close to the $2,420 zone before there was a downside correction. There was a move below the $2,355 pivot zone. The price settled below the 50-hour simple moving average and RSI dipped below 50. Finally, it tested the $2,290 zone.
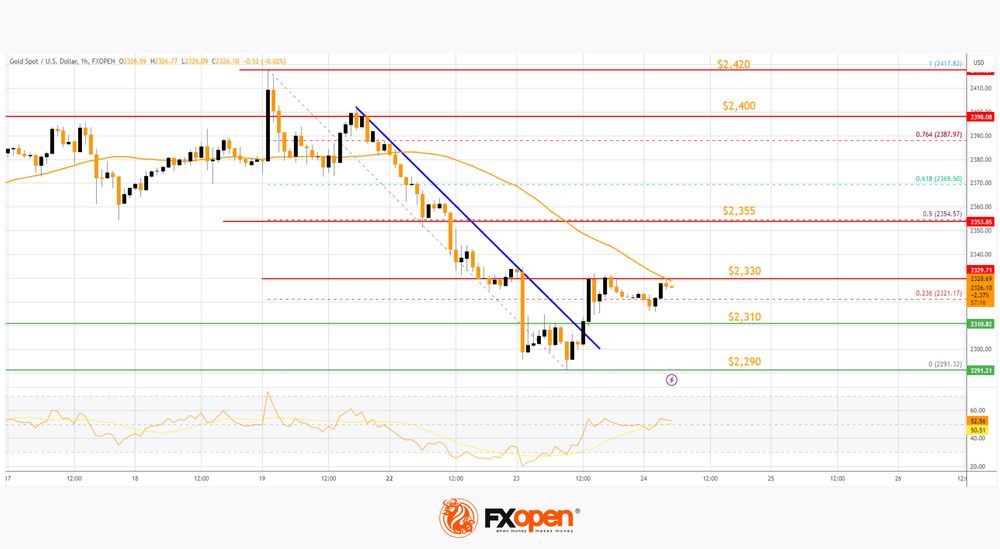
The price is now correcting losses above the 23.6% Fib retracement level of the downward move from the $2,417 swing high to the $2,291 low. It surpassed a key bearish trend line with resistance at $2,310.
Immediate resistance on the upside is near the 50-hour simple moving average and $2,330. The next major resistance is near the 50% Fib retracement level of the downward move from the $2,417 swing high to the $2,291 low at $2,355.
An upside break above the $2,355 resistance could send Gold price toward $2,400. Any more gains may perhaps set the pace for an increase toward the $2,420 level. If there is no fresh increase, the price could continue to move down.
Initial support on the downside is near the $2,310 level. The first major support is $2,290. If there is a downside break below the $2,290 support, the price might decline further. In the stated case, the price might drop toward the $2,265 support.
Oil Price Technical Analysis
On the hourly chart of WTI Crude Oil at FXOpen, the price started a decent increase against the US Dollar. The price gained bullish momentum after it broke the $81.10 resistance.
There was a break above a connecting bearish trend line with resistance at $82.00. The bulls pushed the price above the 50-hour simple moving average and the RSI climbed toward 65. There was a clear move above the 50% Fib retracement level of the downward move from the $85.48 swing high to the $80.59 low.
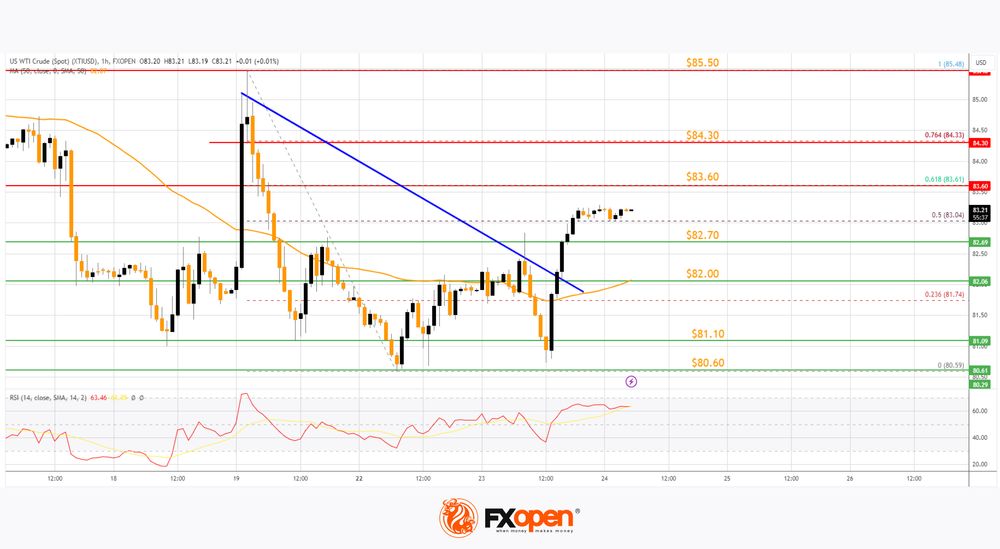
Immediate resistance is near the $83.60 level. It is close to the 61.8% Fib retracement level of the downward move from the $85.48 swing high to the $80.59 low.
If the price climbs further higher, it could face resistance near $84.30. The next major resistance is near the $85.50 level. Any more gains might send the price toward the $87.00 level.
Conversely, the price might correct gains and test the $82.70 support. The next major support on the WTI crude oil chart is near the 50-hour simple moving average at $82.00. If there is a downside break, the price might decline toward $81.10. Any more losses may perhaps open the doors for a move toward the $80.00 support zone.
This article represents the opinion of the Companies operating under the FXOpen brand only. It is not to be construed as an offer, solicitation, or recommendation with respect to products and services provided by the Companies operating under the FXOpen brand, nor is it to be considered financial advice.
German Ifo business climate rises to 89.4, economy stabilizing thanks to service providers
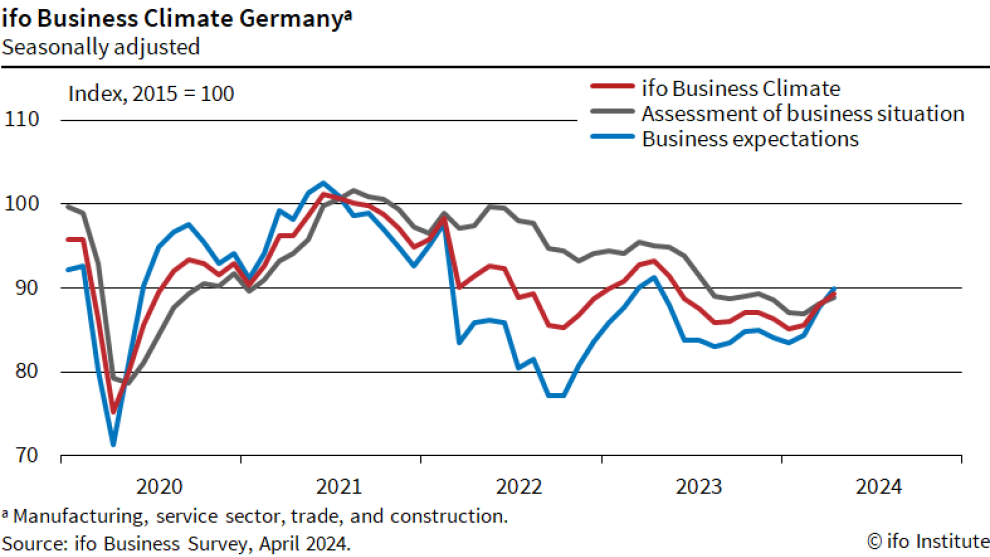
German Ifo Business Climate rose from 87.8 to 89.4 in April, above expectation of 88.5. Current Assessment Index rose from 88.1 to 88.9, above expectation of 88.7. Expectations Index also improved from 87.5 to 89.9, above expectation of 88.9.
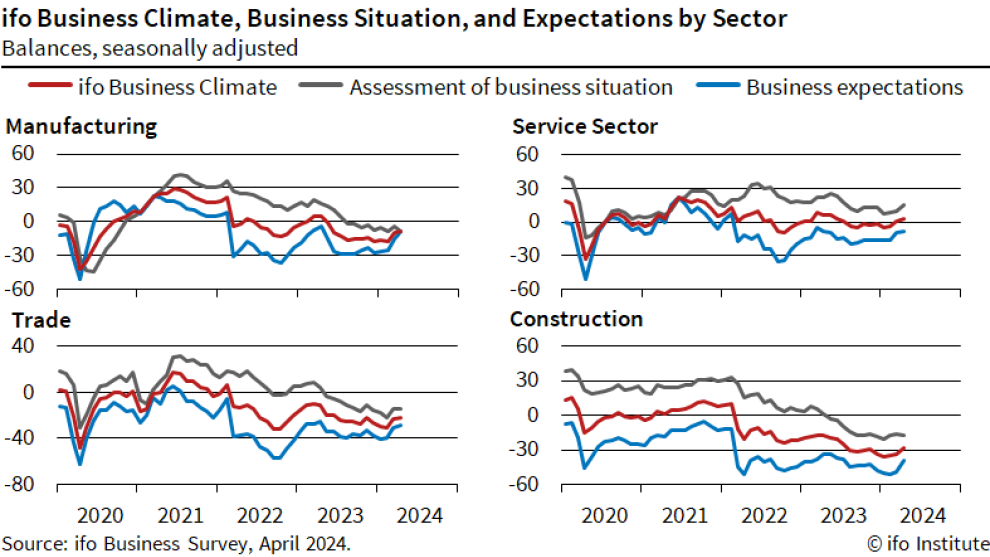
By sector, manufacturing rose from -9.9 to -8.5. Services rose from 0.4 to 3.2. Trade rose from -22.9 to -22.0. Construction rose from -33.2 to -28.5.
If said, "Companies were more satisfied with their current business. Their expectations also brightened. The economy is stabilizing, especially thanks to service providers."
GBPUSD Bounces Off 1.2300 But Remains at Risk
- GBPUSD posts new 5-month low
- Price holds in bearish tendency
- MACD and stochastics suggest upside move
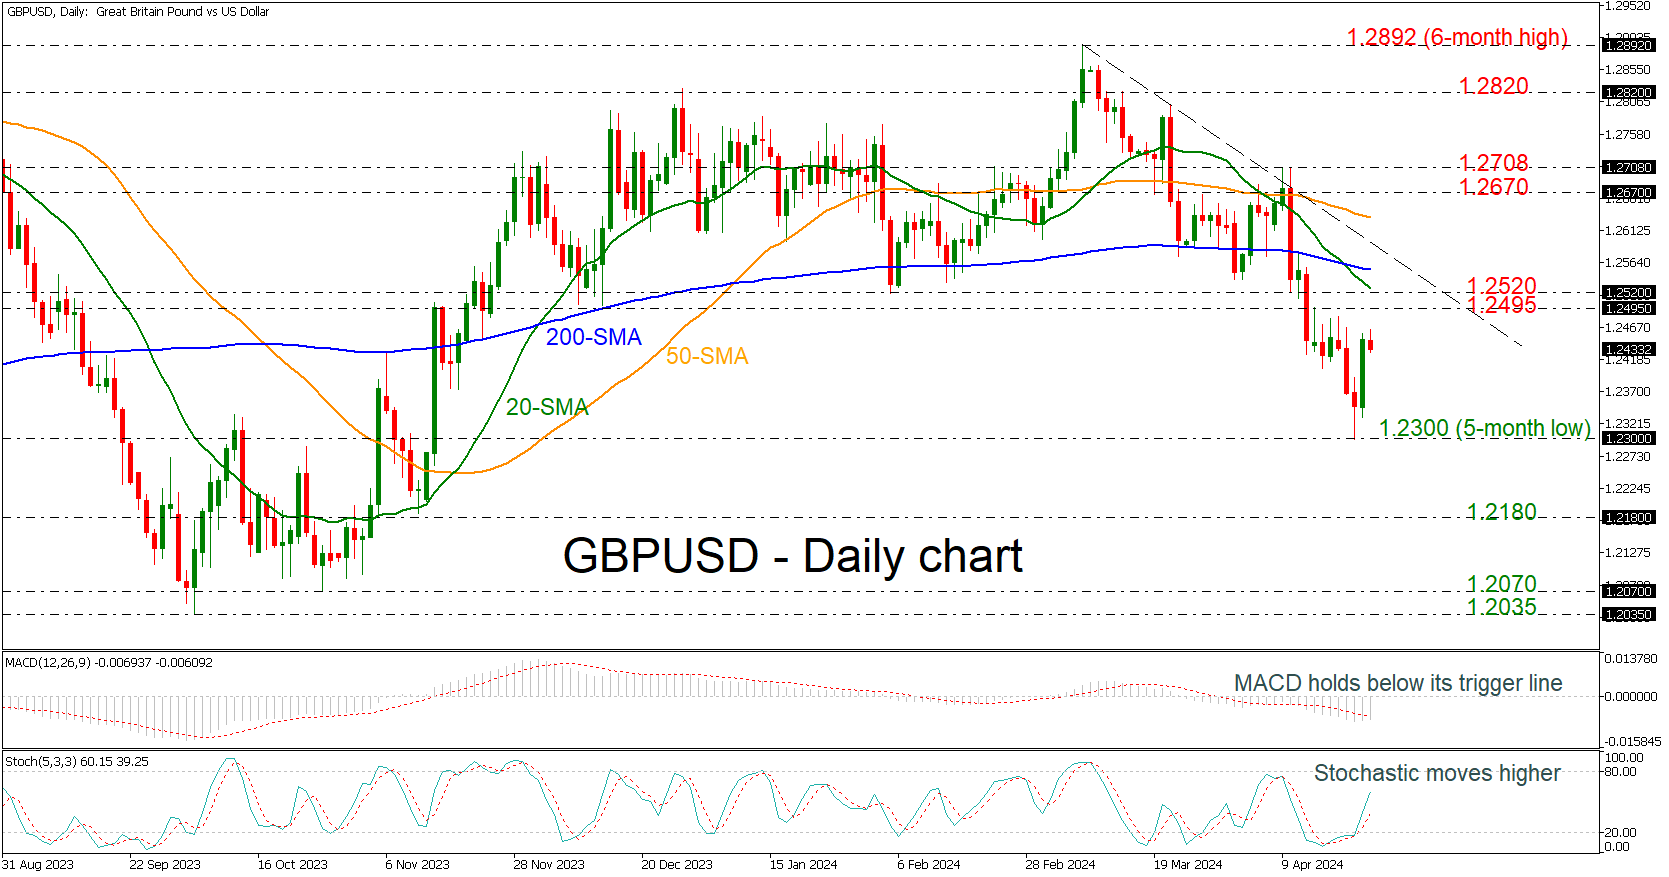
GBPUSD is recovering from the five-month low of 1.2300 that was posted on Monday and is heading towards the restrictive region of 1.2495-1.2520. The pair has started a bearish tendency since the price peaked at 1.2892 in the short-term timeframe.
According to technical oscillators, the MACD is trying to cross its trigger line to the upside beneath the zero level. Also, the stochastic oscillator is moving strongly higher following the rebound off the oversold territory.
If traders continue to buy the pair, then the price could meet the aforementioned region and the 20-day simple moving average (SMA) around 1.2520. Slightly higher, the 200-day SMA at 1.2555 and the near-term descending trend line at 1.2585 may block the upside movement.
On the other hand, a move lower again could retest the previous trough of 1.2300 before tumbling further towards the 1.2180 bottom, registered on November 10.
In a nutshell, GBPUSD is in a bearish mode in the short-term picture as it is standing beneath the downtrend line and the SMAs.
ECB’s Nagel cautions: June rate cut may not lead to further easing
At a conference today, Joachim Nagel, Bundesbank President and ECB Governing Council member, said that if data in the next six weeks bolster confidence in achieving ECB’s 2% inflation target, he would support a reduction in interest rates in June. However, he emphasized that "such a step would not necessarily be followed by a series of rate cuts.”
He stressed the current climate of uncertainty, noting, "Given the current uncertainty, we cannot pre-commit to a particular rate path." This approach underscores ECB's strategy of making decisions "meeting by meeting and based on incoming data."
Further, Nagel admitted of his reservations and expressed that he is "not fully convinced yet" that price growth is firmly on a path toward target. Core inflation, particularly within the services sector, remains elevated, driven by persistent strong wage growth, which tends to be more durable than goods inflation.
Nevertheless, by June "we will know a lot more," about the inflation path, he added.
GBP/JPY Daily Outlook
Daily Pivots: (S1) 191.45; (P) 192.15; (R1) 193.47; More..
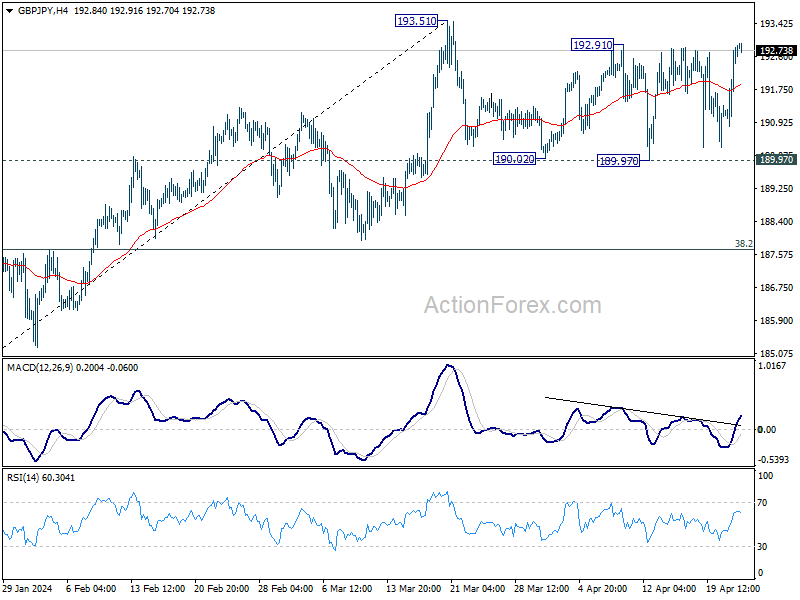
GBP/JPY is still bounded in range below 193.51 and intraday bias remains neutral. Further rally is expected with 189.97 support intact. On the upside, firm break of 193.51 will resume larger up trend to 195.86 long term resistance. Nevertheless, decisive break of 189.97 will indicate that it's at least correcting the rise from 178.32, and target 38.2% retracement of 178.32 to 193.51 at 187.70.
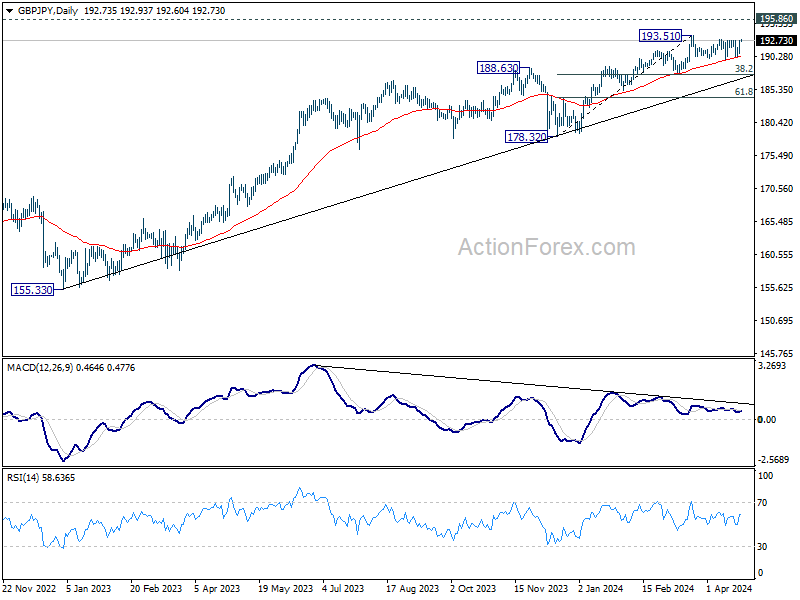
In the bigger picture, current rally is part of the up trend from 123.94 (2020 low), and is in progress for 195.86 long term resistance (2015 high). Break of 187.94 support is needed to be the first sign of medium term topping. Otherwise, outlook will remain bullish in case of retreat.
EUR/JPY Daily Outlook
Daily Pivots: (S1) 164.98; (P) 165.36; (R1) 166.09; More...
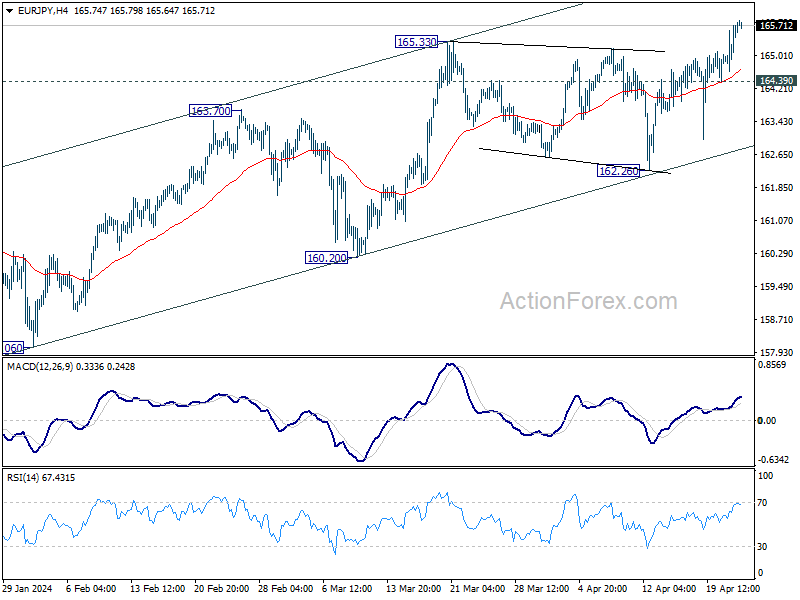
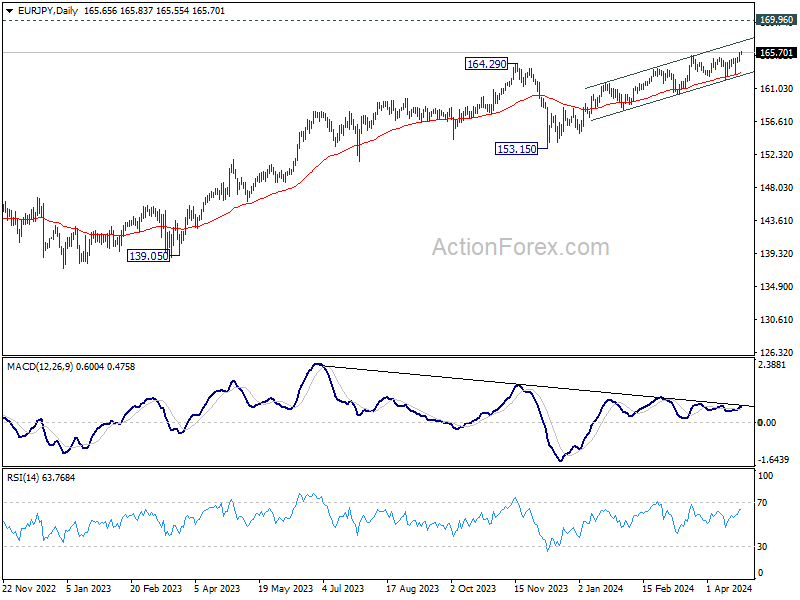
Intraday bias in EUR/JPY remains on the upside for the moment. Current up trend should target 169.96 key resistance next. On the downside, break of 164.39 minor support will turn intraday bias neutral again first. But outlook will continue to stay bullish as long as 162.26 support holds, in case of retreat.
In the bigger picture, current rally is part of the up trend from 114.42 (2020 low), which is still in progress. Next target is 169.96 (2008 high). Break of 160.20 support is needed to be the first sign of medium term topping. Otherwise, outlook will stay bullish in case of retreat.
EUR/GBP Daily Outlook
Daily Pivots: (S1) 0.8578; (P) 0.8611; (R1) 0.8630; More...
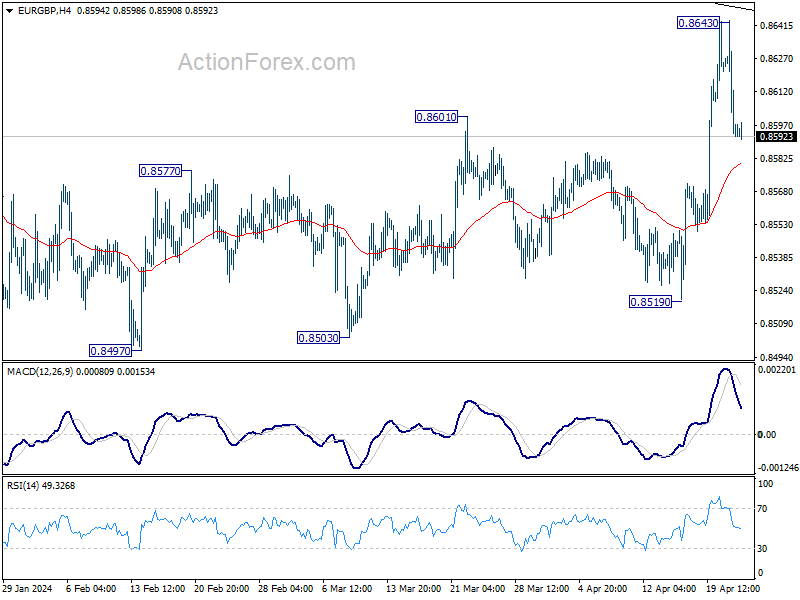
Intraday bias in EUR/GBP is turned neutral first with current retreat. On the upside, decisive break of medium term trend line resistance (now at 0.8649) will solidify the bullish case of trend reversal, and target 0.8764 resistance next. However, sustained break of 55 4H EMA (now at 0.8580) will indicate rejection by the trend line, and bring retest of 0.8491/7 support zone instead.
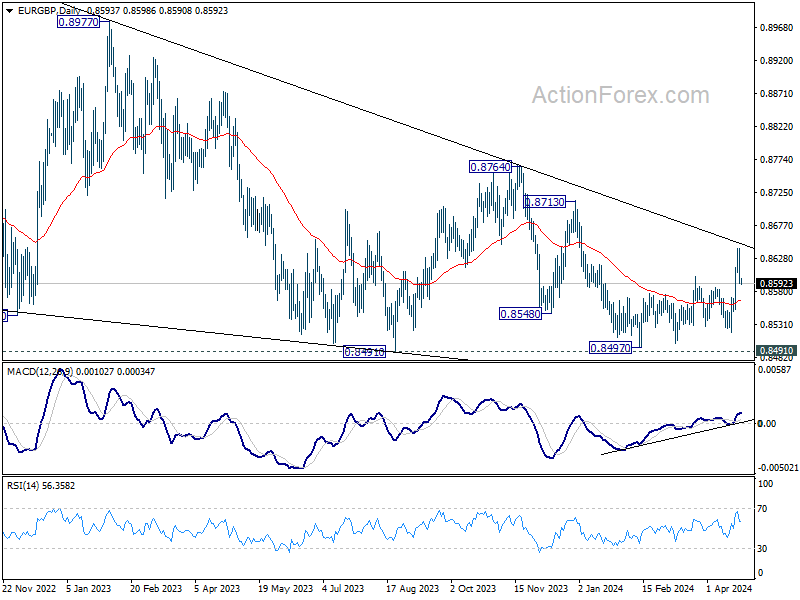
In the bigger picture, outlook is mixed up by current strong rebound. On the upside, sustained break of the trend medium term trend resistance will argue that the down trend from 0.9267 (2022 high) has completed as a triangle pattern. Further rise should then be seen through 0.8764 resistance next. However, rejection by the trend line will retain medium term bearishness for another fall through 0.8491 at a later stage.
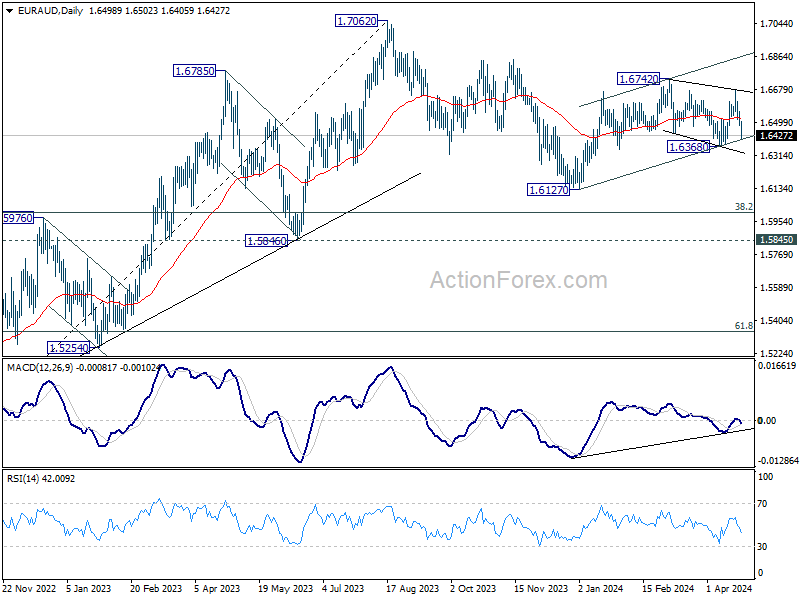
EUR/AUD Daily Outlook
Daily Pivots: (S1) 1.6468; (P) 1.6516; (R1) 1.6545; More...
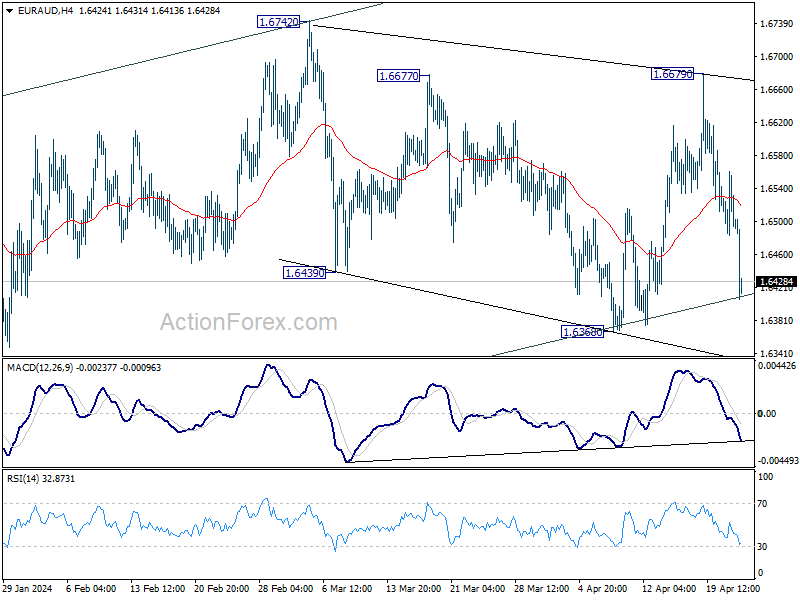
Outlook is mixed up by deeper than expected fall from 1.6679. On the downside, firm break of 1.6368 support will revive that case that rebound from 1.6127 has completed at 1.6742. Fall from there is seen as the third leg of the pattern from 1.7062. Deeper decline would then be seen to 1.6127 support and below.
In the bigger picture, fall from 1.7062 medium term top is seen as a correction to the up trend from 1.4281 (2022 low). In case of another fall, strong support is expected around 1.5846 and 38.2% retracement of 1.4281 to 1.7062 at 1.6000 to bring rebound. Break of 1.7062 is in favor as a later stage.