

Sample Category Title
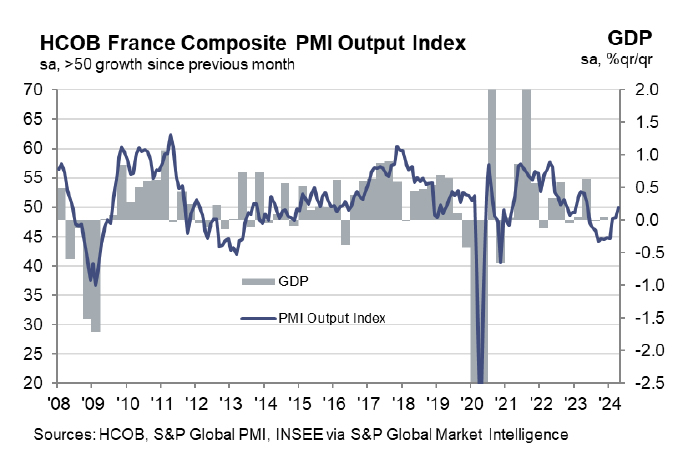
France PMI composite rises to 49.9, back on track driven by services
France PMI Manufacturing fell from 46.2 to 44.9 in April, below expectation of 46.9. But PMI Services rose from 48.3 to 50.5, above expectation of 49.0, an 11-month high. PMI Composite rose from 48.3 to 49.9, also an 11-month high.
Norman Liebke, an economist at Hamburg Commercial Bank, has confidently stated that the French economy is "back on track," highlighting the significant role of the services sector in driving this recovery.
Meanwhile, inflation levels remain a concern, with elevated prices driven by higher wages along with rising energy and oil prices. Both output price inflation and input prices saw reacceleration, maintaining levels clearly above 50.
NZDUSD Bounces Off 5-Month Low
- NZDUSD declines sharply within descending channel
- Drops to its lowest since November before paring some losses
- Oscillators are deep in their negative territories
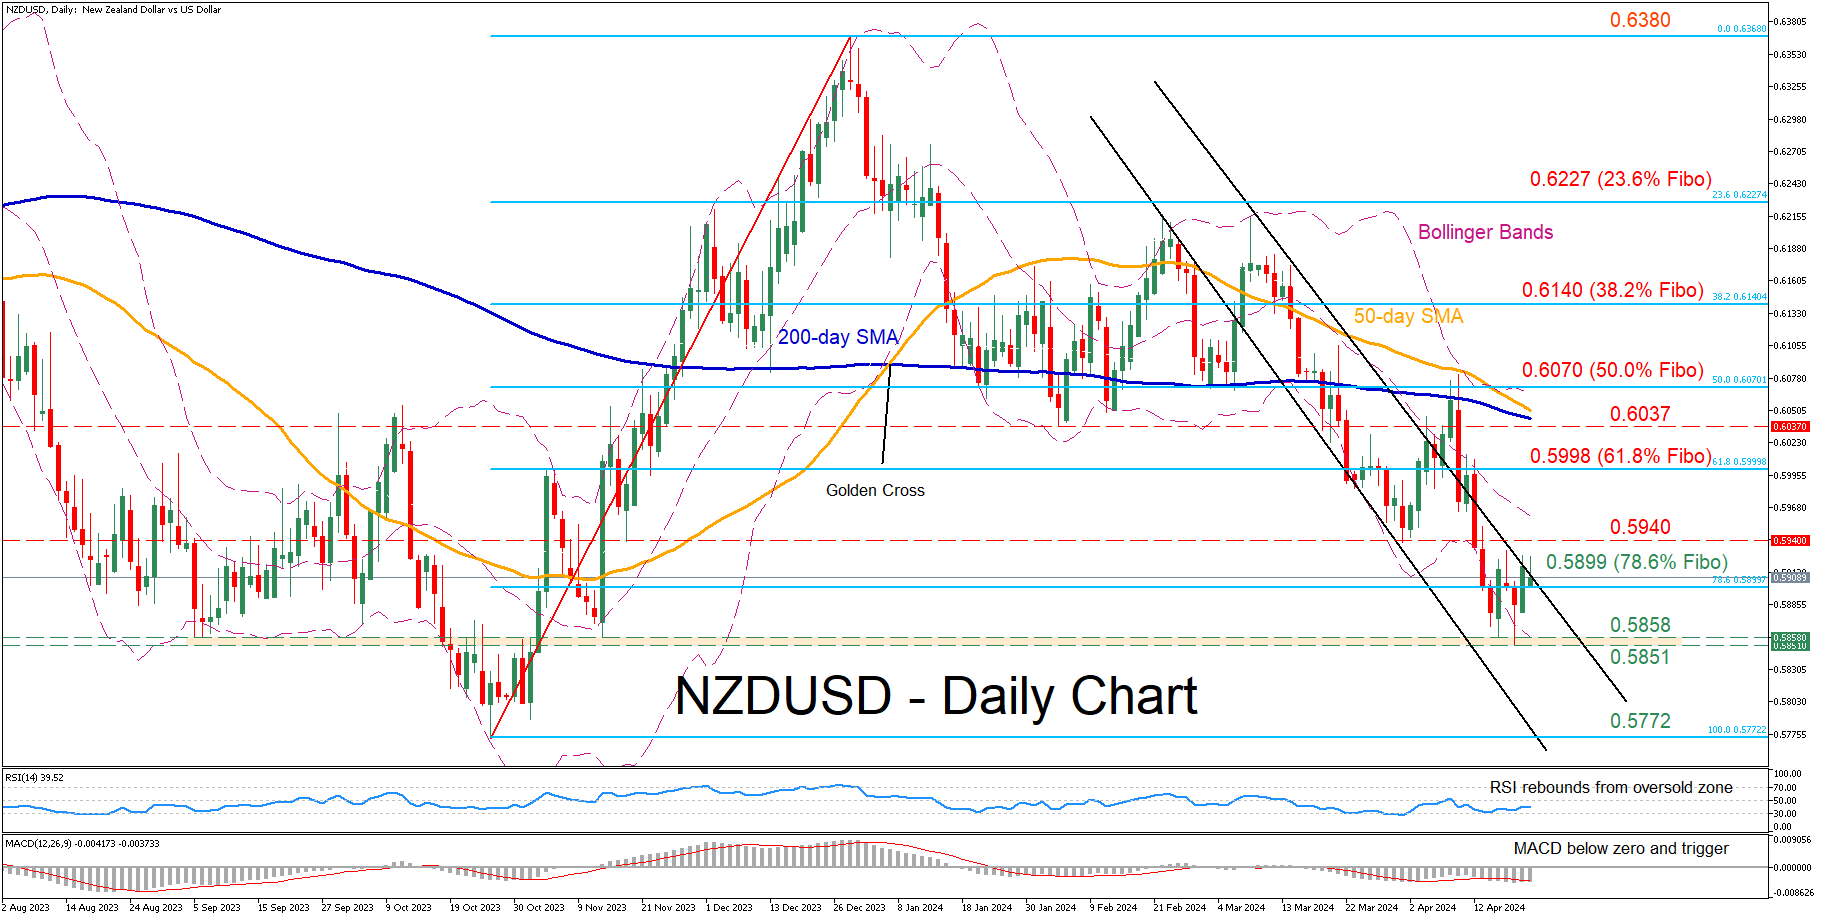
NZDUSD has been in an aggressive downtrend since its double rejection at the 0.6217 region in early March. Although the pair posted a fresh five-month bottom of 0.5851 last week, it seems that the retreat has paused for now.
Given that both the RSI and MACD remain tilted to the downside, the price might revisit 0.5899, which is the 78.6% Fibonacci retracement of the 0.5772-0.6380 upleg. A violation of that region could pave the way for the 0.5858-0.5851 range, defined by the recent five-month bottom and the September-November support. Failing to halt there, the pair could challenge the 2023 low of 0.5772.
On the flipside, should the pair rotate back higher, immediate resistance could be found at the previous support of 0.5940. Further advances could then cease around the 61.8% Fibo of 0.5998. Conquering this barricade, the bulls may attack the February support zone of 0.6037, which could serve as resistance in the future.
Overall, NZDUSD plummeted to a fresh five-month low but managed to recoup some losses as the decline reached oversold conditions. However, the pair is clearly not out of the woods just yet as near-term risks remain heavily tilted to the downside.
Is Gold Ready for Bearish Correction?
- Gold dives towards 2,300
- MACD and RSI decline from overbought regions
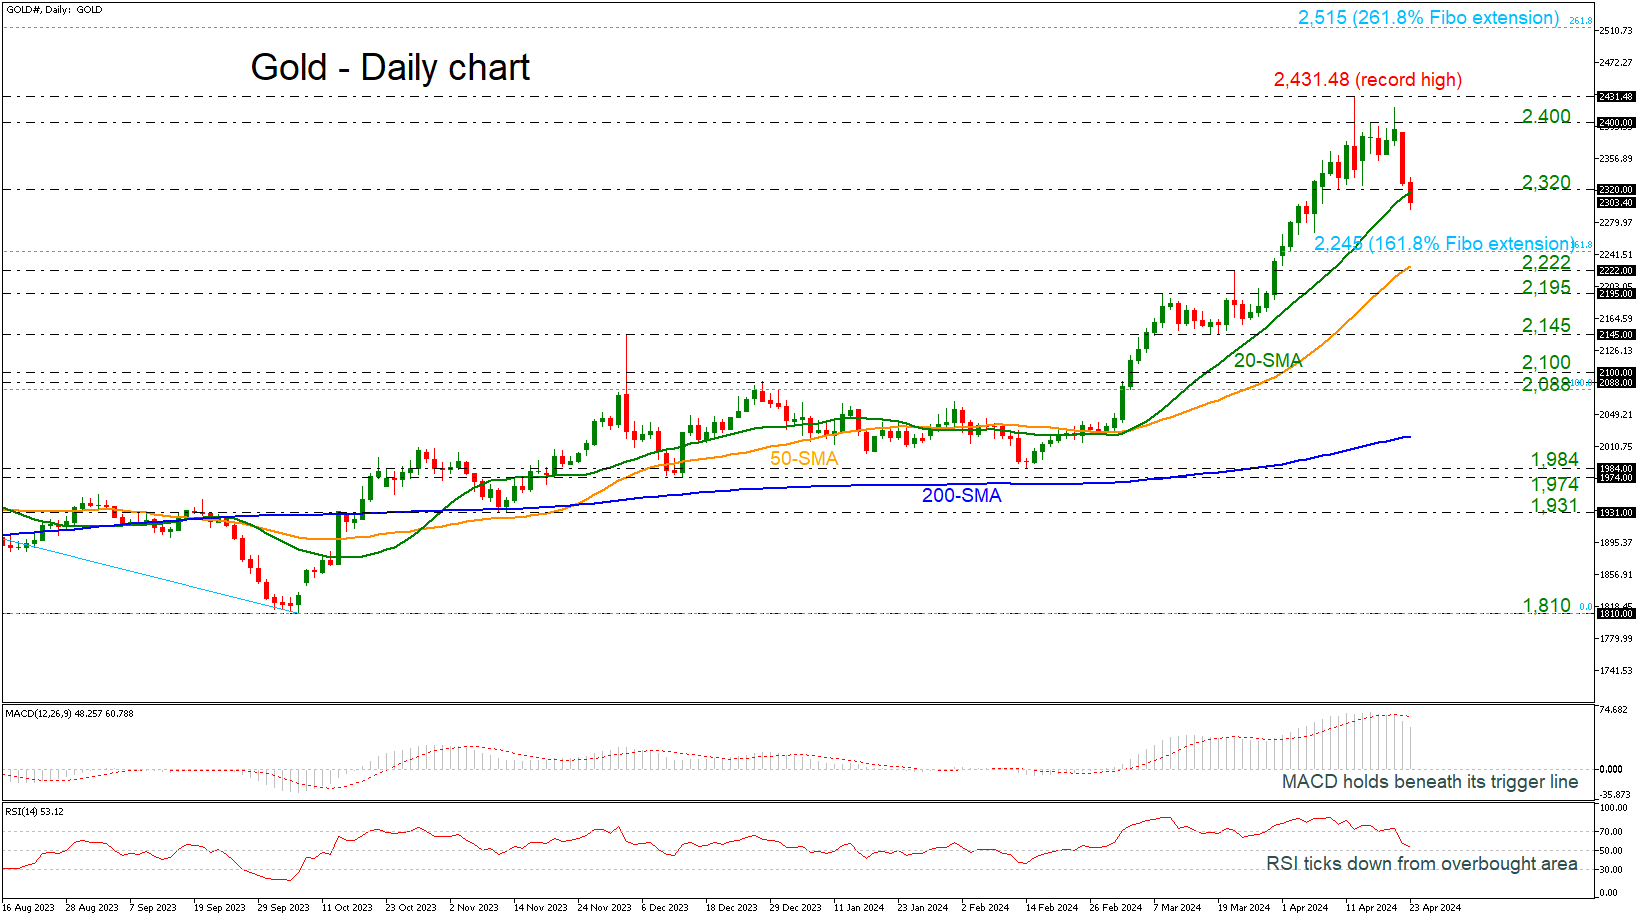
Gold prices have been underperforming in the past two days, breaking back below the 2,320 and the 20-day simple moving average (SMA).
Momentum indicators are pointing to a negative bias in the short term with the RSI ticking strongly to the downside. The MACD is easing beneath its trigger line losing its positive momentum. Both are confirming that a downside correction may be on the cards.
Further losses could see the 161.8% Fibonacci extension level of the down leg from 2,079 to 1,1810 at 2,245 come into play. A drop below the 50-day SMA, which stands near 2,222 would reinforce the bearish structure in the short term and open the way towards the next key levels of 2,195 and 2,145.
In the event of an upside reversal, the 2,400 round number could act as a barrier before being able to re-challenge the record peak of 2,431.48. A rally above this level could shift the outlook back to positive, hitting the 261.8% Fibonacci extension level of 2,515.
All in all, gold prices are in the process of a potential downside retracement before switching the near-term outlook back to bullish.
GBP/JPY Daily Outlook
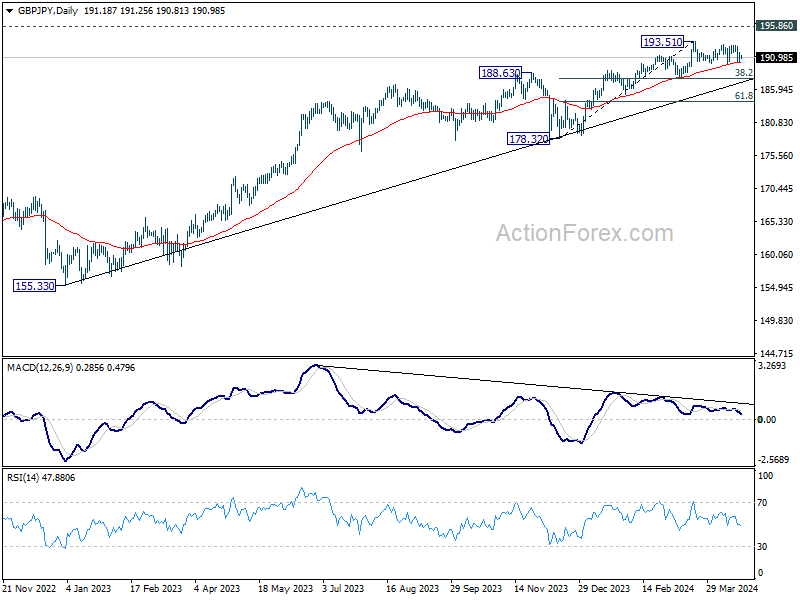
Daily Pivots: (S1) 190.46; (P) 191.08; (R1) 191.84; More..
No change in GBP/JPY's outlook. Intraday bias stays neutral as consolidations from 193.51 could extend further. On the upside, firm break of 193.51 will resume larger up trend to 195.86 long term resistance. Nevertheless, decisive break of 190.02 will indicate that it's at least correcting the rise from 178.32, and target 38.2% retracement of 178.32 to 193.51 at 187.70.
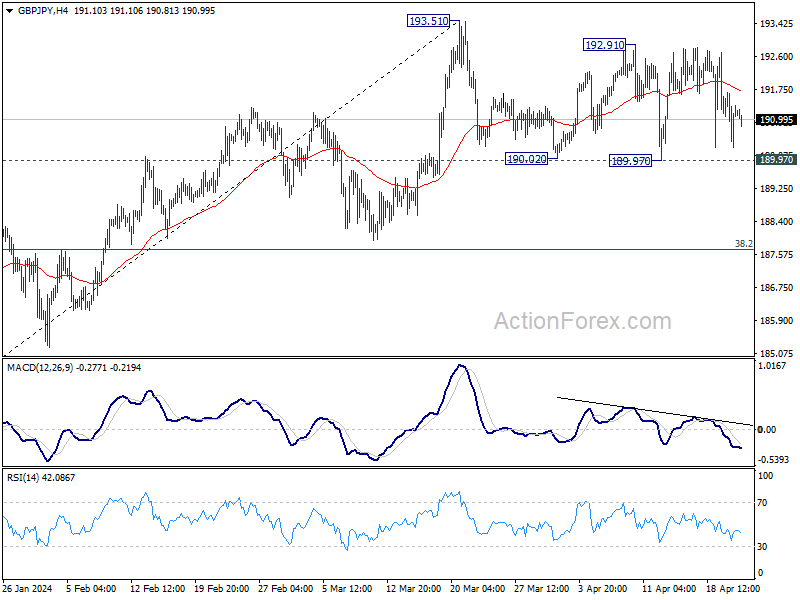
In the bigger picture, current rally is part of the up trend from 123.94 (2020 low), and is in progress for 195.86 long term resistance (2015 high). Break of 187.94 support is needed to be the first sign of medium term topping. Otherwise, outlook will remain bullish in case of retreat.
EUR/JPY Daily Outlook
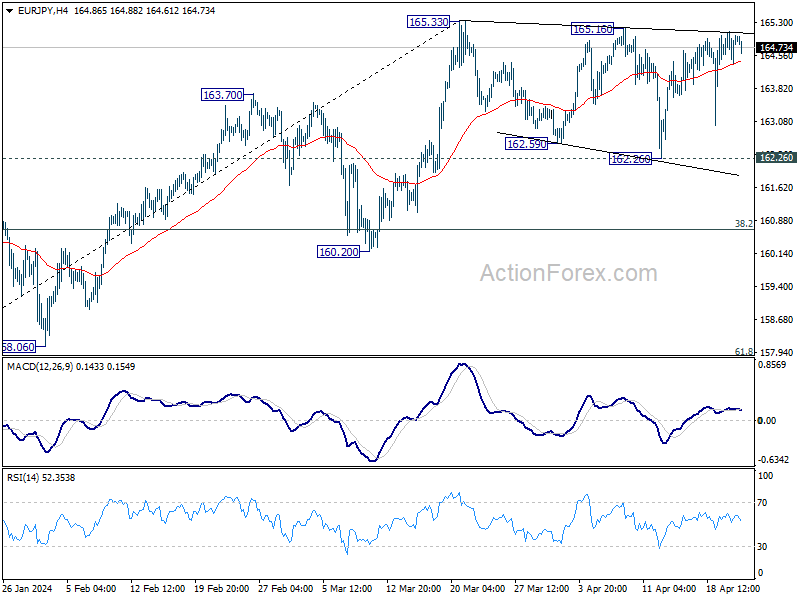
Daily Pivots: (S1) 164.55; (P) 164.82; (R1) 165.25; More...
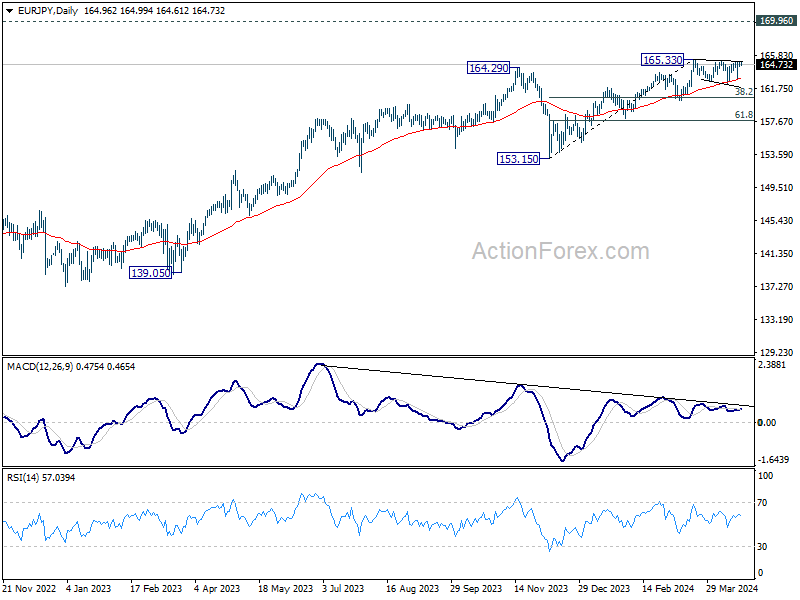
Range trading continues in EUR/JPY and intraday bias stays neutral. Consolidation from 165.33 could extend further. On the upside, firm break of 165.33 will resume larger up trend towards 169.96 key resistance next. However, decisive break of 162.59 will argue that it's at least correcting the rise from 153.15, and target 38.2% retracement of 153.15 to 165.33 at 160.67.
In the bigger picture, current rally is part of the up trend from 114.42 (2020 low), which is still in progress. Next target is 169.96 (2008 high). Break of 160.20 support is needed to be the first sign of medium term topping. Otherwise, outlook will stay bullish in case of retreat.
EUR/GBP Daily Outlook
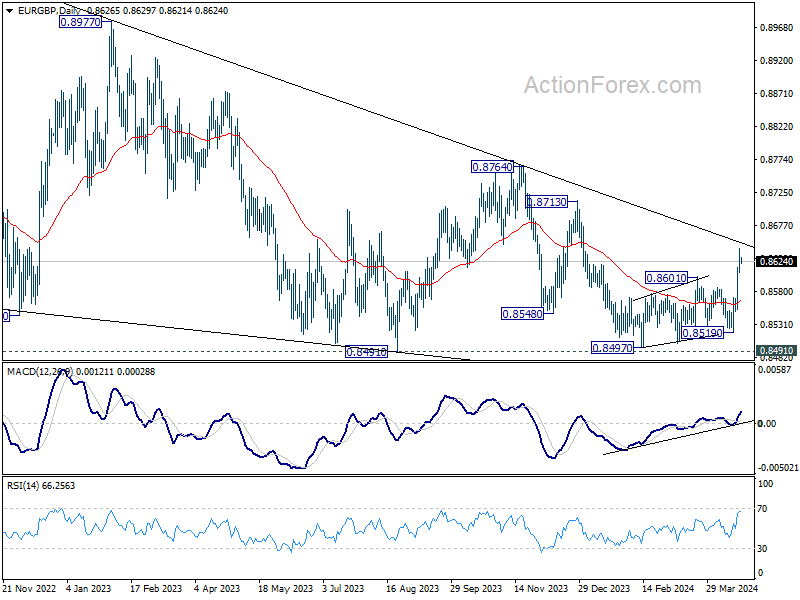
Daily Pivots: (S1) 0.8607; (P) 0.8626; (R1) 0.8645; More...
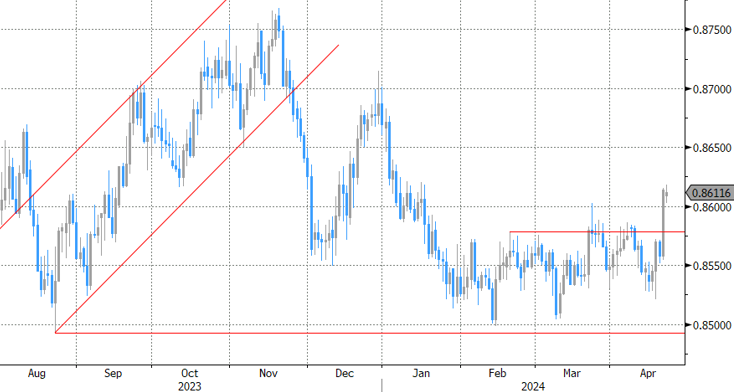
Intraday bias in EUR/GBP remains on the upside and outlook is unchanged. Fall from 0.8764 has probably completed already. Further rally would be seen to medium term trend line resistance (now at 0.8649). Decisive break there will solidify this bullish case and target 0.8764 resistance next. On the downside, below 0.8596 minor resistance will turn intraday bias neutral again first.
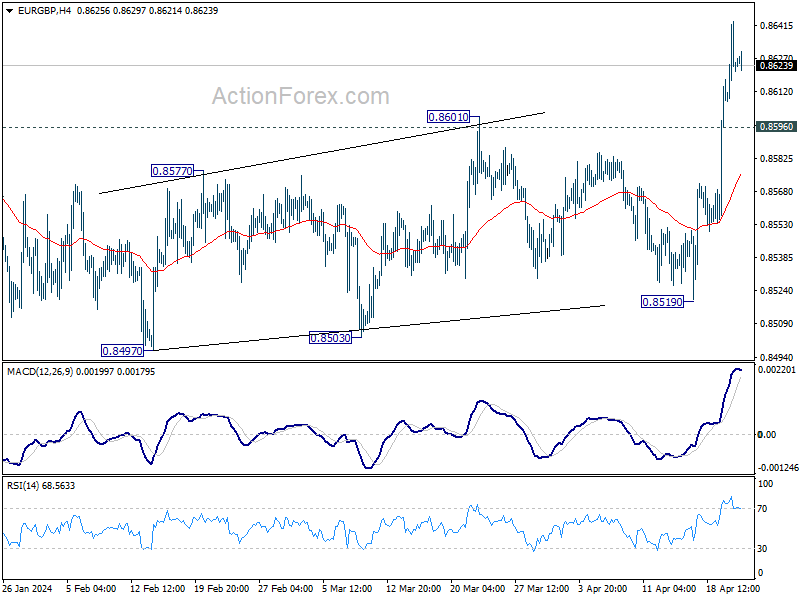
In the bigger picture, outlook is mixed up by current strong rebound. On the upside, sustained break of the trend medium term trend resistance will argue that the down trend from 0.9267 (2022 high) has completed as a triangle pattern. Further rise should then be seen through 0.8764 resistance next. However, rejection by the trend line will retain medium term bearishness for another fall through 0.8491 at a later stage.
EUR/AUD Daily Outlook
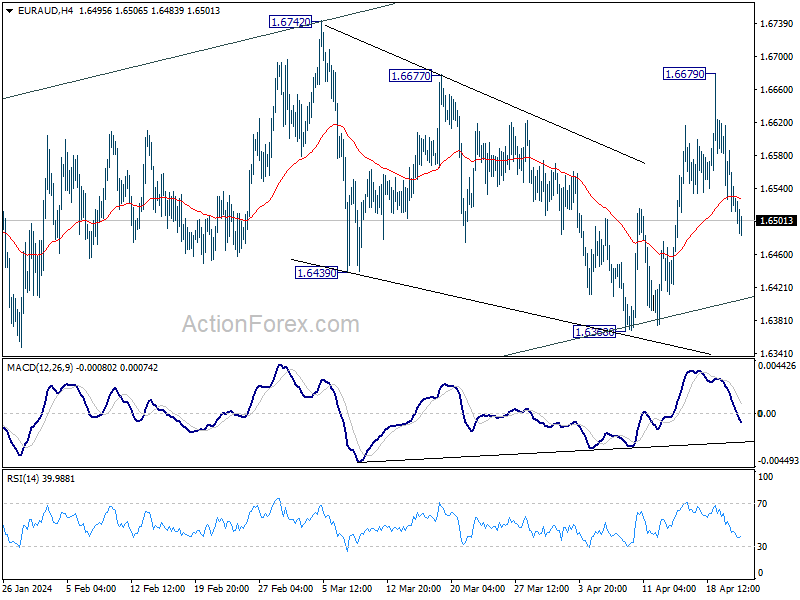
Daily Pivots: (S1) 1.6479; (P) 1.6556; (R1) 1.6597; More...
Intraday bias in EUR/AUD remains neutral at this point. For now, further rally will remain mildly in favor as long as 1.6368 support holds. Corrective fall from 1.6742 could have completed with three waves down to 1.6368. Above 1.6678 will target a retest on 1.6742 resistance next.
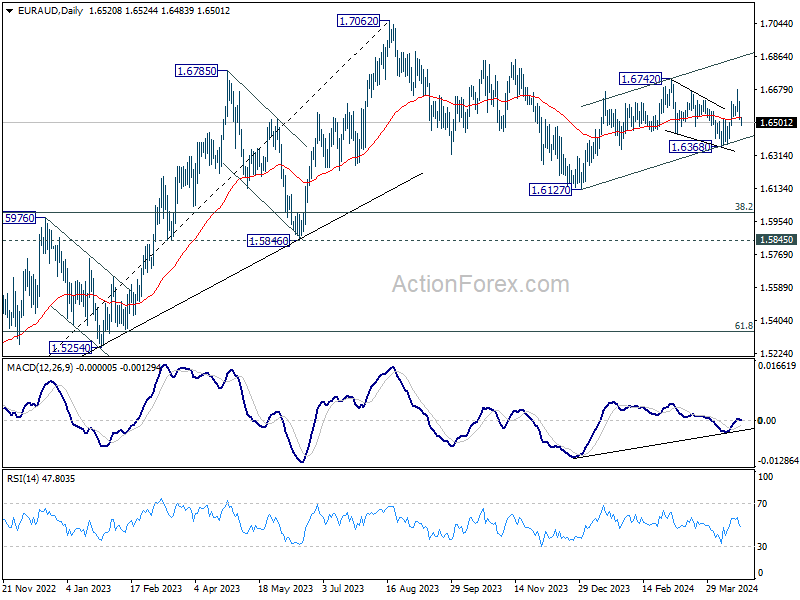
In the bigger picture, fall from 1.7062 medium term top is seen as a correction to the up trend from 1.4281 (2022 low). In case of another fall, strong support is expected around 1.5846 and 38.2% retracement of 1.4281 to 1.7062 at 1.6000 to bring rebound. Break of 1.7062 is in favor as a later stage.
EUR/CHF Daily Outlook
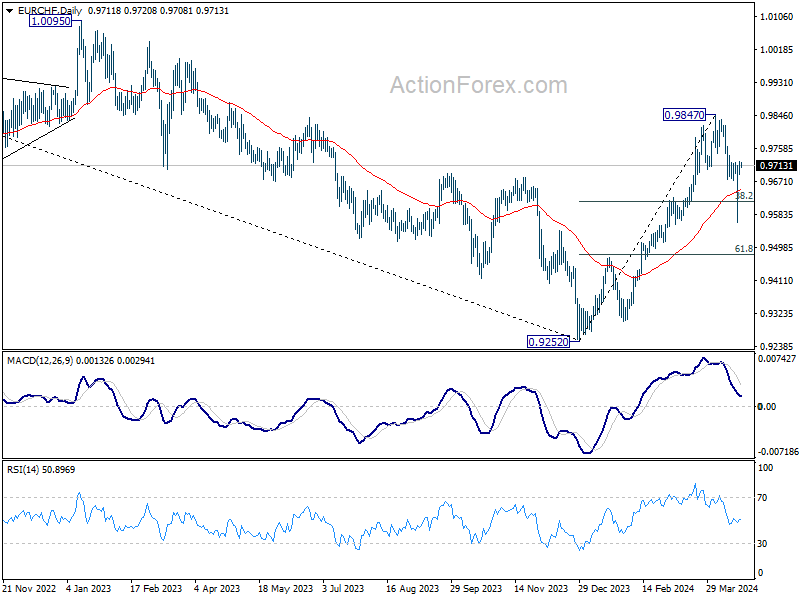
Daily Pivots: (S1) 0.9695; (P) 0.9711; (R1) 0.9732; More...
No change in EUR/CHF's outlook and intraday bias stays neutral. On the upside, firm break of 0.9721 resistance will argue that correction from 0.9847 has completed already, and turn intraday bias back to the upside for retesting 0.9847. However, break of 0.9563 will bring deeper fall to 61.8% retracement of 0.9252 to 0.9847 at 0.9479.
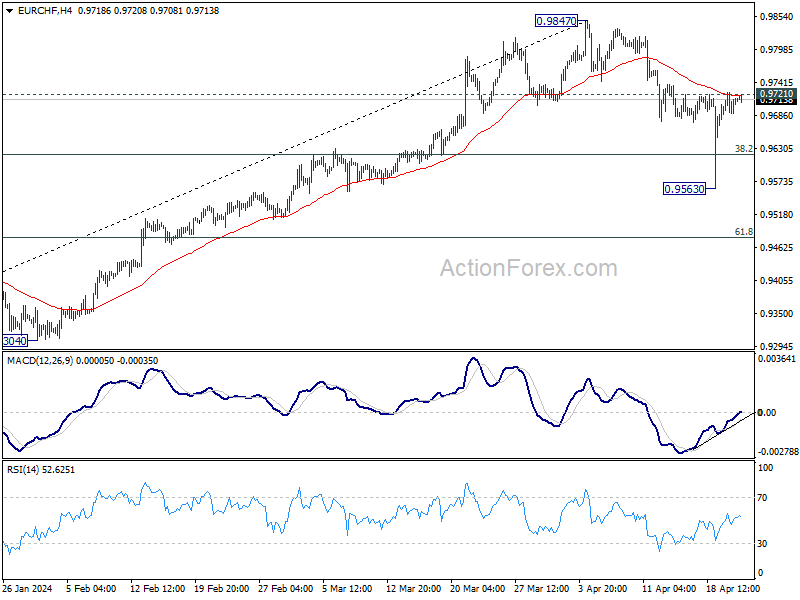
In the bigger picture, while 55 D EMA (now at 0.9644) was breached, EUR/CHF rebounded strongly since then. Rise from 0.9252 medium term bottom should still be in progress. Break of 0.9847 will target 38.2% retracement of 1.2004 (2018 high) to 0.9252 (2023 low) at 1.0303, even as a correction to the down trend from 1.2004. however, sustained trading below 55 D EMA will argue that the rebound has completed.
Japanese Yen Isn’t Impressed This Morning by Yet Another Verbal Intervention Warning
Markets
German and EU swap rates yesterday tested YTD highs in absence of strong market drivers. These technical resistance levels stood their ground with rebounding stock markets (Nasdaq +1.1%) offering some counterweight as well. Unlike yesterday, today’s agenda could be an inspiring one both in EMU and in the US. April PMI confidence indicators are scheduled for release. The current dire economic outlook keeps the consensus bar rather low both for manufacturing (46.5 from 46.1) and services (51.8 from 51.5). Germany and France have been the main laggards in past months so we recall improving April German ZEW (agree, investor) sentiment and a less pessimistic tone in the latest monthly outlook by the German Bundesbank. The BuBa suggested that the nation might have avoided a winter recession. The economic situation brightened somewhat but remains weak at its core. Matching consensus or doing better could be sufficient in the current environment to push yields through resistance levels, both at the front and at the long end of the curve. European money markets are more and more coming to terms with the fact that a bumpy H2 inflation path, the Fed’s hold, somewhat better economic momentum and a higher neutral rate limit the scope for more rate cuts after June. Yesterday’s suggestion by Portuguese governor Centeno that the central bank could lower its policy rate by a cumulative 100 bps this year seems very unrealistic. Room for repositioning in the other direction (less rate cuts) could temporarily limit the downside in EUR/USD. On today’s US side of the equation we get April PMI’s as well. They are expected to hum along at 52. March new home sales and April Richmond Fed manufacturing index are on the agenda as well. Other wildcards include the start of the US Treasury’s end-of-month refinancing operation with a record volume $69bn 2-yr Note auction and Q1 earnings with eg Tesla after trading.
The Japanese yen (USD/JPY 154.75) isn’t impressed this morning by yet another verbal intervention warning by FM Suzuki nor by BoJ governor Ueda’s renewed call for a less easy monetary policy if the price trend rises towards 2% in line with the BoJ outlook. The BoJ meets on Friday and gives a new (quarterly) economic assessment. We keep a close eye on UK PMI’s and speeches by BoE chief economist Pill and BoE Haskel as well given GBP-weakness since last Friday. EUR/GBP yesterday closed at its highest level since the first trading day of this year (0.8627). The pair could advance further as the BoE aligns itself with the ECB rather than with the Fed.
News & Views
ECB Villeroy said that the central bank can’t be the solution to the funding of the green transition at it is legally impossible and would risk stoking inflation. Villeroy indicated that monetary financing of the green transition could fuel inflation just as the EMU is exiting a crisis of record high inflation. Such an approach would also be a breach of the European treaties that prohibit deficit financing. “There is a monetary illusion according to which central banks could shoulder the main part of the burden”, he said. The BoF Governor also indicated that private sources should provide the main part of the financing as fiscal sources are scarce.
Czech central bank policymaker Holub assessed that there was no need for the CNB to accelerate the pace of rate cuts amid signs of a strengthening economy and expectations of delayed and more gradual easing by the major central banks. Holub advocated a 75 bps step at the March CNB policy meeting as inflation returned to the 2% CNB target faster than expected. Since then, the Czech economy showed signs of a rebound in household consumption and better activity overall. In this respect, Holub expects the CNB to upwardly revise its 2024 growth forecast at the next meeting (from 0.6% for this year). Along with expected slower cuts in the US and EMU this suggests that keeping the current pace of 50 bps at the May 2 meeting would be more appropriate. Holub expects inflation in 2024 to develop in the upper half of the +/- 1% range around the 2% target. Stronger wage growth could still contribute to elevated service inflation. Holub also indicated that the CNB has to take into account that CZK may stay a bit weaker than expected. For now, Holub didn’t see much reason to challenge current market pricing of interest rates falling to 4% over the next year (policy rate currently 5.75%).
Graphs
GE 10y yield
ECB President Lagarde clearly hinted at a summer (June?) rate cut and seems to have broad backing. EMU disinflation will continue the next two months and bring headline CPI (temporary) at/below the 2% target. Together with weak growth momentum, this gives backing to deliver a first 25 bps rate cut. A more bumpy inflation path in H2 2024 and the Fed’s higher for longer strategy make follow-up move difficult.
US 10y yield
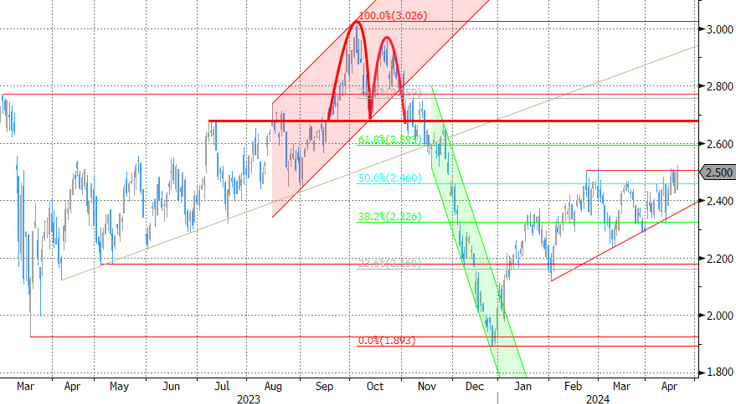
The March dot plot contained several hawkish elements including a symbolically higher neutral rate. In our view they set the stage for a later (September at the earliest) start of a possibly shallower cutting cycle. Upcoming CPI readings (through base effects) and resilient eco data should confirm this. US yields continue to enjoy a solid bottom across the maturity spectrum, setting fresh YTD highs.
EUR/USD
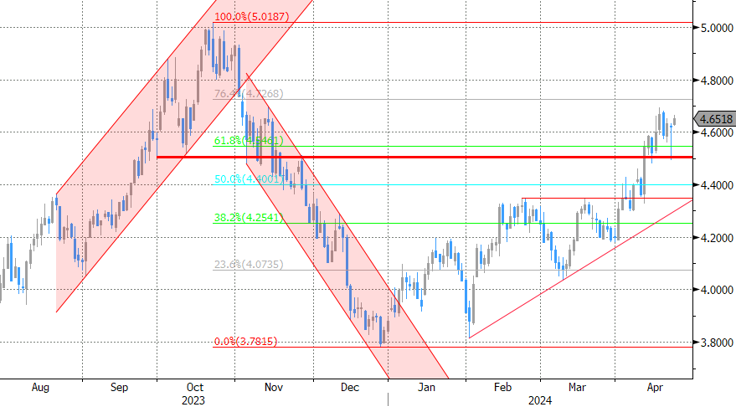
Economic divergence (US > EMU) and a likely desynchronized rate cut cycle with the ECB exceptionally taking the lead pulled EUR/USD towards the YTD low at 1.0695. Stronger-than-expected US March inflation figures forced a technical break, opening the path to last year’s low at 1.0494.
EUR/GBP
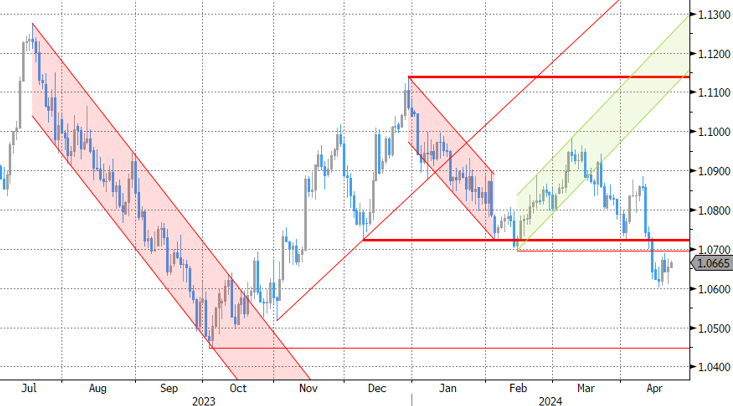
Debate at the Bank of England is focused at the timing of rate cuts. Most BoE members align with the ECB rather than with Fed view, suggesting that the disinflation process provides a window of opportunity to make policy less restrictive (in the near term). Sterling’s downside turned more vulnerable with the topside of the sideways EUR/GBP 0.8493 - 0.8768 trading range serving as the first real technical reference.
Without of Hawkish Stance from BoJ, USD/JPY Will Likely Continue Upside Trajectory
The week started on a hopeful note after the de-escalation of tensions between Israel and Iran. Gold shortly fell below $2300 per ounce in Asia. Brent dipped below the $86pb level, as US crude tested the 50-DMA to the downside. Equities rebounded. The Stoxx 600 index jumped past the 50-DMA and the 500 psychologic mark, while the S&P500 regained the 5000 handle.
On the economic calendar, a series of PMI data are expected to confirm a slight improvement in global activity levels. But the data will also highlight the growing divergence between the US where manufacturing is gaining further momentum in the expansion territory and Germany, which is still deeply in the contraction territory with manufacturing PMI sitting between 41-43 range. The PMI data will hardly prove those betting for diverging Federal Reserve (Fed) and (European Central Bank (ECB) policies wrong, and should back a further slide in the EURUSD toward the 1.05 level.
Elsewhere, the yen bears are cautiously pushing the USDJPY toward the 155 psychological resistance to see if that level would trigger a response from the Japanese authorities – which eventually won’t matter beyond clearing the short-term bears. In the absence of a hawkish stance from the Bank of Japan (BoJ), the USDJPY will likely continue its upside trajectory. Cable, on the other hand, is slightly better bid after tipping a toe below the 1.23 on Monday, backed by a growing chorus that the Bank of England (BoE) will eventually hike its rates before the Fed.
In the absence of major economic data today, like jobs, growth and inflation, FX traders will continue to digest the idea that the Fed is moving away from the rate cutting dream and let the US and European treasury auctions and S&P500 earnings gain the headlines.
How bad doctor?
The expectations regarding Tesla’s Q1 performance are weak - to say the least. The profit is seen down by 40% compared to the same time last year, the car deliveries were down by 8.5% in Q1, the controversial price cuts didn’t help Tesla gain market share, but they will certainly cause a sizeable profit meltdown.
But alas, the company decided that it would continue to cut the price of its vehicles again last weekend and said that Musk is willing to cut 20% of jobs globally after announcing, last week, that it would cut 10% of its global workforce and abandon the idea of a cheap model – that could’ve boosted profits rapidly - and prioritize Elon Musk’s robotaxi dream – which will hardly show in results in a predictable timeline to justify the company’s still hefty market valuation. Plus, thousands of Cybertrucks were recalled due to technical problems and Elon Musk is pushing for his $56bn pay package amid growing controversies regarding his decisions and future perspectives. The company’s share price and the PE ratio are going down rapidly, and there are not many barriers to slow down or reverse the selloff.
Tesla dived another 3.40% yesterday and the PE ratio is now below 55. The selloff could continue if the company fails to convince investors on three major points. 1. Are sales continuing to fall after the sharp Q1 decline? 2. Is it a good idea to continue cutting the price of EVs provided that the latest cuts didn’t necessarily help boost sales? 3. Are robotaxis and self-driving cars realistic in terms of profit and growth?
Too much optimism kills optimism
Elsewhere, optimism regarding the S&P500 earnings reigns - which to me is an alarming sign. A recent Bloomberg survey showed that almost two-thirds of people surveyed expected the earnings give a further boost to the S&P500 – that’s apparently the highest vote of confidence for corporate earnings since the beginning of the poll in October 2022. And when confidence is this high, it often suggests that we are getting closer to a turning point. We start seeing an increased volatility – a sign of rising stress – in the most popular tech stocks. This earnings season will certainly not go down the market’s throat as smoothly as present optimism suggests. Even less so as the Fed expectations are no longer supportive of market valuations.