Sample Category Title
GBP/USD Daily Outlook
Daily Pivots: (S1) 1.2396; (P) 1.2481; (R1) 1.2535; More...
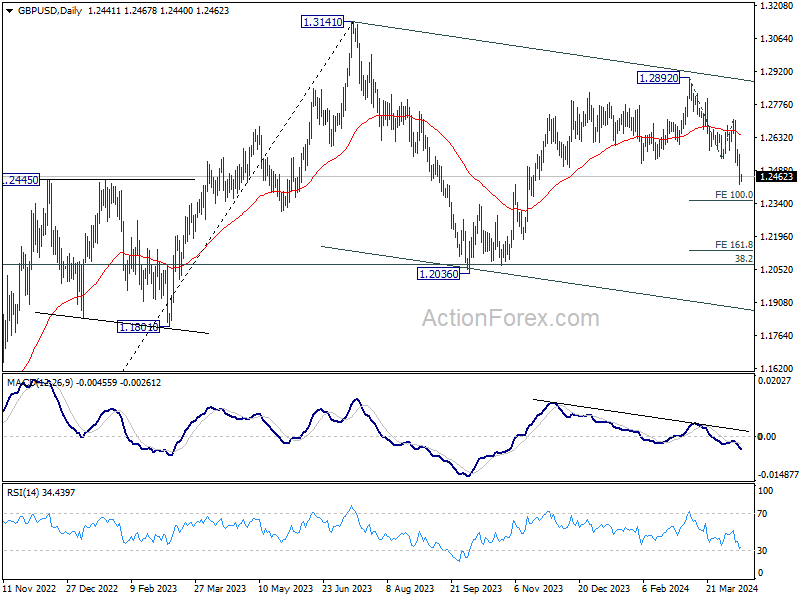
Intraday bias in GBP/USD remains on the downside at this point. Current fall from 1.2892 is in progress for 100% projection of 1.2892 to 1.2538 from 1.2708 at 1.2354. Firm break there will target 161.8% projection at 1.2207 next. On the upside, above 1.2510 minor resistance will turn bias neutral and bring consolidations first, before staging another decline.
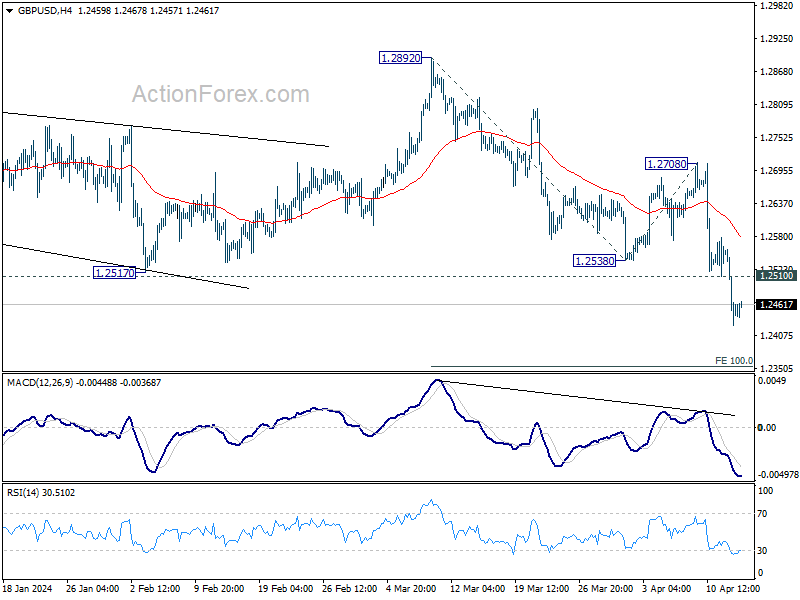
In the bigger picture, price actions from 1.3141 medium term top are seen as a corrective pattern to up trend from 1.0351 (2022 low). Fall from 1.2892 is seen as the third leg. Deeper decline would be seen to 1.2036 support and possibly below. But strong support should emerge from 61.8% retracement of 1.0351 to 1.2452 at 1.1417 to complete the correction.
Could Have Been Worse
Risk appetite is better this Monday morning than it was last Friday when the world was bracing for the Iranian retaliation on Israel. Iran fired more than 300 drones and missiles on Israel on Saturday night, but only a small number reached Israel, limiting damages. There were no fatalities, just an army base was slightly damaged. Good news is Teran called the operation a success and declared that it won’t take further actions unless Israel responds. Oil traded slightly lower as the first reaction to the weekend news, while gold gapped higher at the open as last week’s rising tensions left a sour taste in investors’ mouth. Elsewhere, base metals including copper, iron and aluminum surged after the US and the UK decided to impose sanctions on Russian supplies. Spot aluminum jumped more than 5% while copper futures advanced to the highest levels since last summer. The dollar index consolidated on Monday after a 2% jump last week.
Too strong to cut
The US dollar strengthens on the back of a severe deterioration in Federal Reserve (Fed) rate cut expectations following strong jobs and inflation data, and the dollar outlook remains comfortably bullish.
The US 2-year yield hit 5% post-US CPI data, and the probability of a June Fed rate cut fell to around 22%. July cut expectations is around 50-50, and a September rate cut is given around 73% chance.
And you know the election narrative that the Fed may not opt for a rate cut approaching the November presidential election, which would delay the first cut to after the election. And some believe that the Fed’s next move won’t be a cut, but a rate hike to tame rising inflationary pressures. That’s a significant readjustment compared to the expectation of six rate cuts in January.
Diverging fortunes
While the US data continues to cement the strength of the US economy and the fact the US doesn’t need to cut rates – and should not be cutting rates with heating inflation - the rate cut expectations elsewhere remain pretty solid. Last week’s European Central Bank (ECB) meeting gave another hint that the bank will more likely than not cut its own rates in June. ECB Chief Christine Lagarde said that the ECB is data dependent and not Fed dependent and other members noted that it’s time to ‘diverge’ from the Fed, as the US consumers are relentless – and the US government is very supportive – with Biden looking to cancel $7.4bn in student debt to please young voters before the election.
As a result, the gap between the Fed and the ECB rate cut expectations widened to the highest level this year following a dovish ECB stance and another set of strong jobs and inflation read in the US. And the chatter of a further euro depreciation to parity against the US dollar is being brought back on the table. At the current levels, the RSI indicator is very close to the oversold territory, meaning that the euro was sold too rapidly in a too short period of time and a correction could be needed. But most traders will be looking to sell the tops in the EURUSD on the back of the growing divergence between the soft ECB and the Fed – that simply can’t justify a rate cut this summer.
Earnings
The S&P 500 posted its worst weekly performance since late October 2023. Mixed bank earnings didn’t help improve mood on Friday. JPM tanked 6.5% as net interest income missed expectations and slipped from the previous quarter as investors chased higher returns. The latter is a real joy killer among investors who were expecting to hear how much more net interest income the bank could gain with a delayed rate cut from the Fed. Similarly, deposits that don’t pay interest at Wells Fargo slumped 18% in Q1
This week, the earnings season gains momentum with the rest of the US big banks, Netflix and TSM due to announce their Q1 results. The expectation is a 3.8% annual growth in S&P500 companies’ earnings per share in the Q1, while profits for the Magnificent Seven are expected to have risen around 38%. Another strong quarter in terms of earnings could slow a potential selloff in the S&P500 – that sees the selling pressure rise on the back of rising hawkish voices. But a softer-than-expected earnings season will likely trigger profit taking.
Halving
Bitcoin slumped over the weekend as rising geopolitical tensions weighed on risk appetite. Bitcoin halving is expected to happen in the coming days. Lower supply is fundamentally supportive of an asset’s valuation, but we might not see a clear kneejerk reaction to Bitcoin halving as most of it is already priced in.
USD/CHF Daily Outlook
Daily Pivots: (S1) 0.9105; (P) 0.9126; (R1) 0.9164; More....
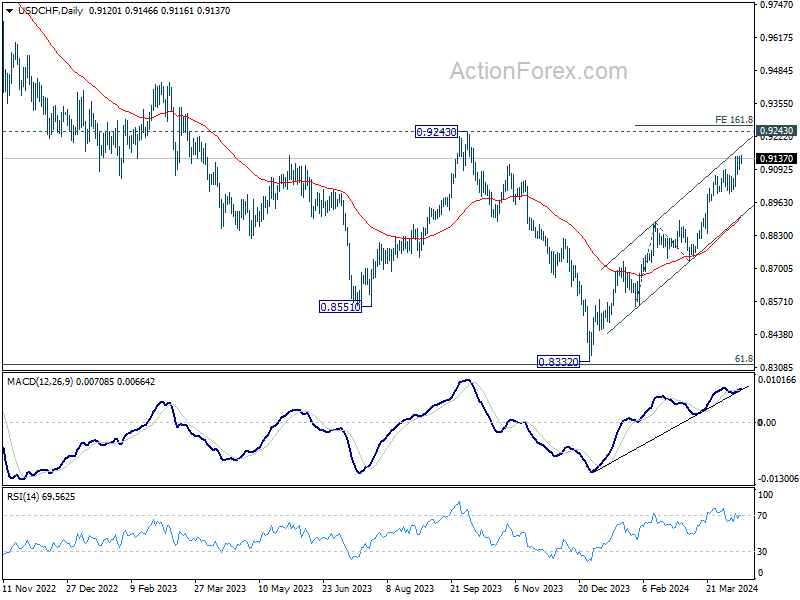
Intraday bias in USD/CHF remains neutral as consolidation from 0.9146 might extend. Further rally is expected as long as 0.8996 support holds. Above 0.9146 will target 161.8% projection of 0.8550 to 0.8884 from 0.8728 at 0.9268.
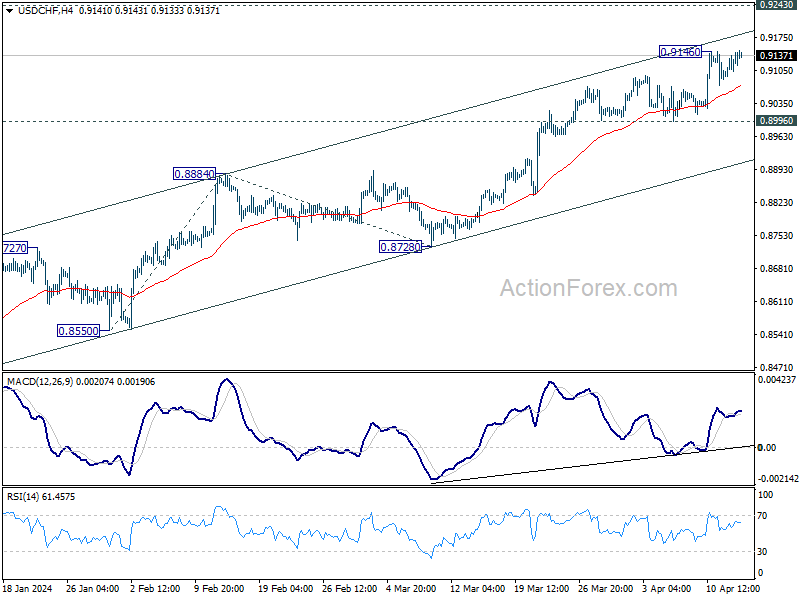
In the bigger picture, price actions from 0.8332 medium term bottom as tentatively seen as developing into a corrective pattern to the down trend from 1.0146 (2022 high). Further rise would be seen as long as 0.8728 support holds. But upside should be limited by 0.9243 resistance, at least on first attempt. However, decisive break of 0.9243 will argue that the trend has already reversed and turn medium term outlook bullish.
USD/JPY Daily Outlook
Daily Pivots: (S1) 152.78; (P) 153.08; (R1) 153.58; More...
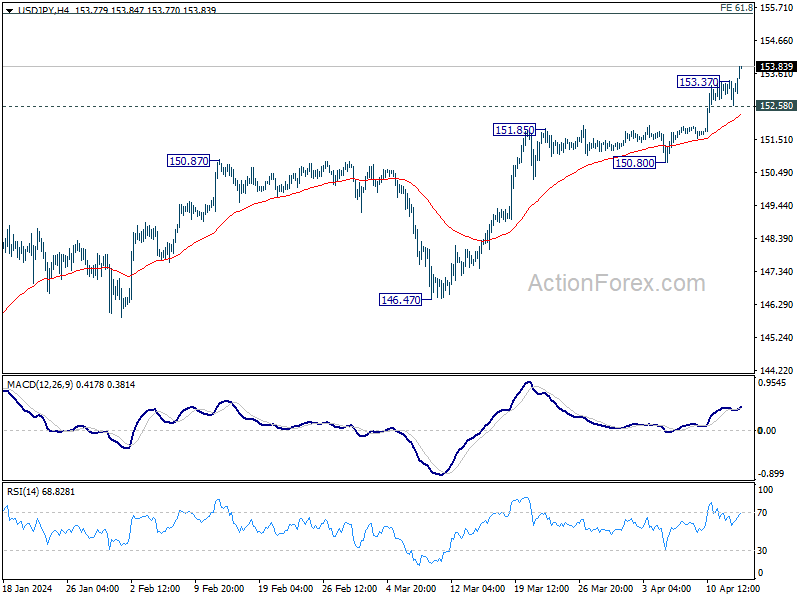
Intraday bias in USD/JPY is back on the upside as USD/JPY's up trend resumed through 153.37 temporary top. Further rally should be seen to 155.20 fibonacci projection level next. On the downside, below 152.58 will turn intraday bias neutral and bring consolidations again, before staging another rally.
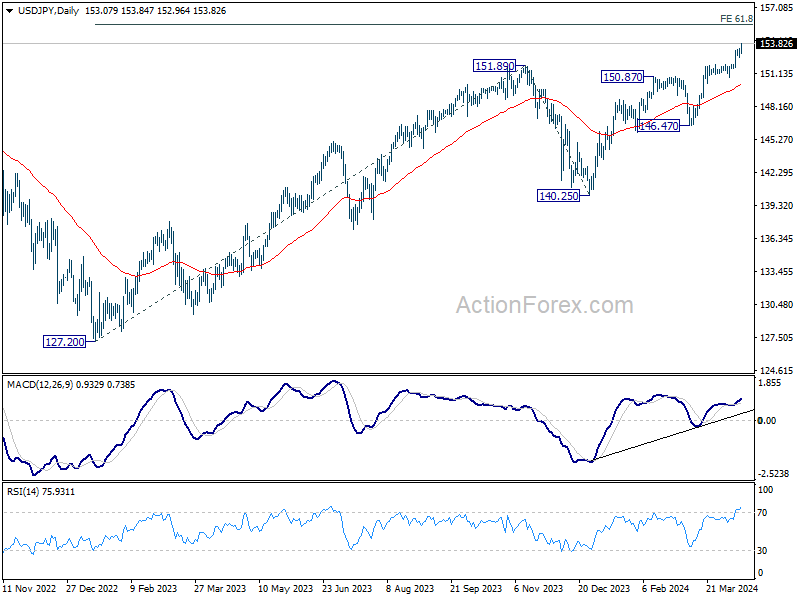
In the bigger picture, current rise from 140.25 is seen as the third leg of the up trend from 127.20 (2023 low). Next target is 61.8% projection of 127.20 to 151.89 from 140.25 at 155.20. Outlook will now remain bullish as long as 146.47 support holds, even in case of deep pullback.
Yen Hits 34-Year Low Against Dollar Amid Inaction from Japanese Authorities
The forex markets are primarily focused on Yen's continued broad-based decline as another trading week commences. In particular, the Japanese currency has now reached a new 34-year low against Dollar. Despite frequent official warnings and the expressed readiness to intervene against speculative movements, Japanese authorities have yet to take concrete action. Finance Minister Shunichi Suzuki reiterated today that Japan is "closely monitoring developments" and remains prepared to "take all necessary steps," yet the absence of intervention has left many market participants surprised and Yen's weakness unabated.
In other areas of the global financial markets, reactions have been relatively subdued to geopolitical events in the Middle East over the weekend. For what it claimed to be retaliation to an attack on its Damascus consulate, Iran launched drone and missile attack to Israel, causing modest damage. Iran stated that it considered "the matter concluded." This development, while significant, has not sparked substantial volatility in the broader markets.
In the currency spectrum, while most major pairs and crosses are trading within the ranges established last week, the USD/JPY stands out with its pronounced movements. Australian Dollar is showing mild strength with other commodity currencies. Dollar, Yen, and Swiss Franc are weaker. Euro and Sterling are positioned in the middle.
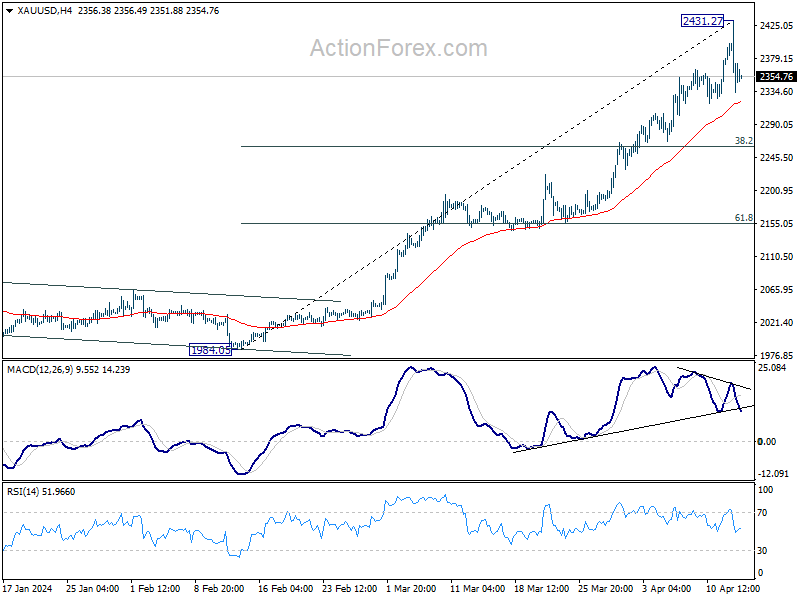
Technically, considering bearish divergence condition in 4H MACD, Gold has likely formed a short term top at 2431.27 already. Some consolidations should follow now, with risk of deeper pullback through 55 4H EMA (now at 2321.76). But strong support should be seen from 38.2% retracement of 1984.05 to 2431.27 at 2260.43) to bring rebound. Gold's up trend is still expected to resume to 2500 handle before forming a major top around there.
In Asia, at the time of writing, Nikkei is down -0.93%. Hong Kong HSI is down -0.65%. China Shanghai SSE is up 1.27%. Singapore Strait Times is down -0.99%. Japan 10-year JGB yield is down -0.0085 at 0.858.
ECB's Villeroy: June rate cut, then by gradualistic easing this year
ECB Governing Council member Francois Villeroy de Galhau indicated an interest rate cut is on the table at the next meeting in June. Onwards, there would be more policy loosening this year with a "gradualism" approach.
"Bar a surprise, we should decide on the first cut at our next meeting on June 6. We are indeed growing more and more confident in the disinflation path," Villeroy said in an interview with Le Journal du Dimanche.
"The interest rate tool has been an effective weapon against inflation. We had to lift that rate to 4% but it is less than in the United States, where it stands at 5.5%," he added.
Further elaborating on the future direction of ECB policy, Villeroy emphasized a cautious but flexible approach to further rate reductions: "The June rate cut should be followed by more rate cuts by the end of the year; I call for a pragmatic and yet adequately nimble gradualism, based on economic data."
Moreover, Villeroy made it clear that while ECB is moving away from the high-interest rate environment of recent years, it does not intend to revert to the ultra-low or negative rates that characterized the period from 2015 to 2022.
NZ BNZ services plummets to 47.5, signaling over 2% GDP contraction
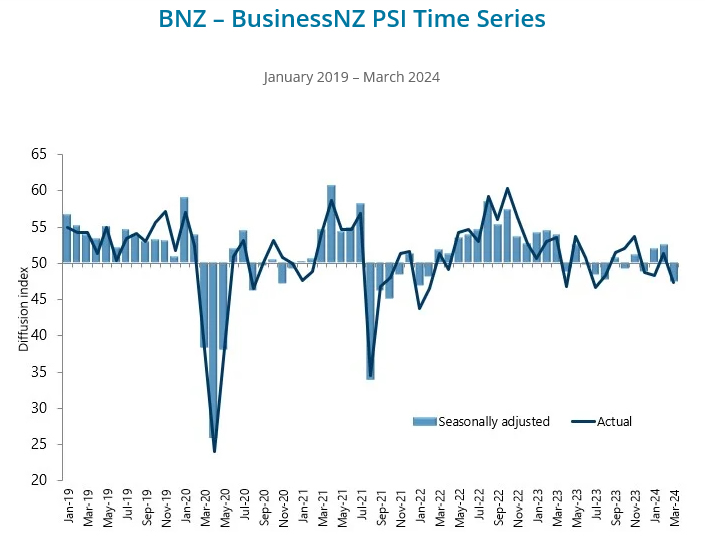
New Zealand's service sector saw a significant downturn in March, as evidenced by BusinessNZ Performance of Services Index, which fell sharply from 52.6 to 47.5. This decline places the index back in contraction territory, and well below its long-term average of 53.4.
The components of the PSI painted a concerning picture: activity and sales saw a steep decline from 52.4 to 44.8. While employment showed a slight improvement, rising marginally from 49.4 to 50.1, new orders and business fell significantly from 55.5 to 48.3. Stocks and inventories also dropped from 52.2 to 46.9, and supplier deliveries was stagnant at 48.7.
Business sentiment mirrored these negative trends, with proportion of negative comments rising sharply to 63.0% in March, up from 57.3% in February and 53.0% in January. Respondents frequently cited ongoing recession and persistent inflationary pressures, including rising costs of living, as key factors impacting their operations.
BNZ Senior Economist Doug Steel stated, "Combining today's weak PSI activity with last week's similarly weak PMI activity, yields a composite reading that would be consistent with GDP falling by more than 2% compared to year-earlier levels. That is much weaker than what folk are forecasting."
Inflation data from Japan, UK, Canada and New Zealand to highlight the week
A slew of important economic data are featured this week, with inflation figures from Japan, UK, Canada, and New Zealand being the main focuses.
Canadian CPI stands out as potentially the most impactful, given its direct implications on BoC's rate decisions. Market participants are keenly watching this data as it could sway the likelihood of a June rate cut. While upside surprises might reduce the chances of such a cut, downside surprises could reinforce the case for the commencement of monetary easing.
For BoE, slower-than-expected decline in CPI would reinforce the likelihood of limiting rate cuts to just two for the year, beginning in September. For New Zealand, Q1 CPI data will be critical in shaping RBNZ's economic projections due in May. Following the surprisingly hawkish statement last week, economists are maintaining the expectation that there will be no RBNZ rate cuts until 2025, although this outlook could shift depending on upcoming inflation trends. Japan's CPI release, on the other hand, is expected to have a more subdued impact. With BoJ unlikely to consider another rate hike until the second half of the year, the immediate repercussions of this data may be limited.
Beyond these specific inflation-related releases, the week is also loaded with other significant data points that could affect global market sentiment. These include US retail sales, which will offer insights into consumer spending trends; Germany's ZEW economic sentiment indicator, which gauges the six-month economic outlook among financial experts; employment and retail sales data from the UK; employment figures from Australia; and China's GDP.
Here are some highlights for the week:
- Monday: New Zealand BNZ services; Japan machines orders; Swiss PPI; Eurozone industrial production; Canada housing starts, manufacturing sales, wholesale sales; US retail sales, Empire state manufacturing, business inventories, NAHB housing index.3
- Tuesday: China GDP, industrial production, retail sales, fixed asset investment; UK employment; Eurozone trade balance; Germany ZEW economic sentiment; Canada CPI; US building permits and housing starts, industrial production.
- Wednesday: New Zealand CPI; Japan trade balance; UK CPI, PPI; Eurozone CPI final; Fed's Beige Book.
- Thursday: Australia employment, NAB quarterly business confidence; Japan tertiary industry index; Swiss trade balance; US jobless claim, Philly Fed survey, existing home sales.
- Friday: Japan CPI; Germany PPI; UK retail sales.
USD/JPY Daily Outlook
Daily Pivots: (S1) 152.78; (P) 153.08; (R1) 153.58; More...
Intraday bias in USD/JPY is back on the upside as USD/JPY's up trend resumed through 153.37 temporary top. Further rally should be seen to 155.20 fibonacci projection level next. On the downside, below 152.58 will turn intraday bias neutral and bring consolidations again, before staging another rally.
In the bigger picture, current rise from 140.25 is seen as the third leg of the up trend from 127.20 (2023 low). Next target is 61.8% projection of 127.20 to 151.89 from 140.25 at 155.20. Outlook will now remain bullish as long as 146.47 support holds, even in case of deep pullback.
Economic Indicators Update
| GMT | Ccy | Events | Actual | Forecast | Previous | Revised |
|---|---|---|---|---|---|---|
| 22:30 | NZD | Business NZ PSI Mar | 47.5 | 53.0 | 52.6 | |
| 23:50 | JPY | Machinery Orders M/M Feb | 7.70% | 0.80% | -1.70% | |
| 06:30 | CHF | Producer and Import Prices M/M Mar | 0.20% | 0.10% | ||
| 06:30 | CHF | Producer and Import Prices Y/Y Mar | -2.00% | |||
| 09:00 | EUR | Eurozone Industrial Production M/M Feb | 0.80% | -3.20% | ||
| 12:30 | CAD | Manufacturing Sales M/M Feb | 0.70% | 0.20% | ||
| 12:30 | CAD | Wholesale Sales M/M Feb | 0.80% | 0.10% | ||
| 12:30 | USD | Empire State Manufacturing Index Apr | -9 | -20.9 | ||
| 12:30 | USD | Retail Sales M/M Mar | 0.40% | 0.60% | ||
| 12:30 | USD | Retail Sales ex Autos M/M Mar | 0.50% | 0.30% | ||
| 14:00 | USD | Business Inventories Feb | 0.30% | 0.00% | ||
| 14:00 | USD | NAHB Housing Market Index Apr | 52 | 51 |
NZ BNZ services plummets to 47.5, signaling over 2% GDP contraction
New Zealand's service sector saw a significant downturn in March, as evidenced by BusinessNZ Performance of Services Index, which fell sharply from 52.6 to 47.5. This decline places the index back in contraction territory, and well below its long-term average of 53.4.
The components of the PSI painted a concerning picture: activity and sales saw a steep decline from 52.4 to 44.8. While employment showed a slight improvement, rising marginally from 49.4 to 50.1, new orders and business fell significantly from 55.5 to 48.3. Stocks and inventories also dropped from 52.2 to 46.9, and supplier deliveries was stagnant at 48.7.
Business sentiment mirrored these negative trends, with proportion of negative comments rising sharply to 63.0% in March, up from 57.3% in February and 53.0% in January. Respondents frequently cited ongoing recession and persistent inflationary pressures, including rising costs of living, as key factors impacting their operations.
BNZ Senior Economist Doug Steel stated, "Combining today's weak PSI activity with last week's similarly weak PMI activity, yields a composite reading that would be consistent with GDP falling by more than 2% compared to year-earlier levels. That is much weaker than what folk are forecasting."
ECB’s Villeroy: Jun rate cut, then by gradualistic easing this year
ECB Governing Council member Francois Villeroy de Galhau indicated an interest rate cut is on the table at the next meeting in June. Onward, there would be more policy loosening this year with a "gradualism" approach.
"Bar a surprise, we should decide on the first cut at our next meeting on June 6. We are indeed growing more and more confident in the disinflation path," Villeroy said in an interview with Le Journal du Dimanche.
"The interest rate tool has been an effective weapon against inflation. We had to lift that rate to 4% but it is less than in the United States, where it stands at 5.5%," he added.
Further elaborating on the future direction of ECB policy, Villeroy emphasized a cautious but flexible approach to further rate reductions: "The June rate cut should be followed by more rate cuts by the end of the year; I call for a pragmatic and yet adequately nimble gradualism, based on economic data."
Moreover, Villeroy made it clear that while ECB is moving away from the high-interest rate environment of recent years, it does not intend to revert to the ultra-low or negative rates that characterized the period from 2015 to 2022.
EUR/USD Takes Hit As Israel-Iran Tension Escalates
Key Highlights
- EUR/USD started a major decline below the 1.0780 support.
- It traded below a key bullish trend line with support at 1.0850 on the 4-hour chart.
- Iran launched more than 300 drones and missiles at Israel in an unprecedented attack late Saturday.
- Gold prices rallied above $2,400 before there was a sharp downside correction.
EUR/USD Technical Analysis
The Euro faced an increase in selling pressure from 1.0880 against the US Dollar. EUR/USD traded below the 1.0850 and 1.0820 support levels.
Looking at the 4-hour chart, the pair traded below a key bullish trend line with support at 1.0850. Recently, Iran launched more than 300 drones and missiles at Israel. It escalated tensions and sparked a strong buying interest among safe havens like the US Dollar.
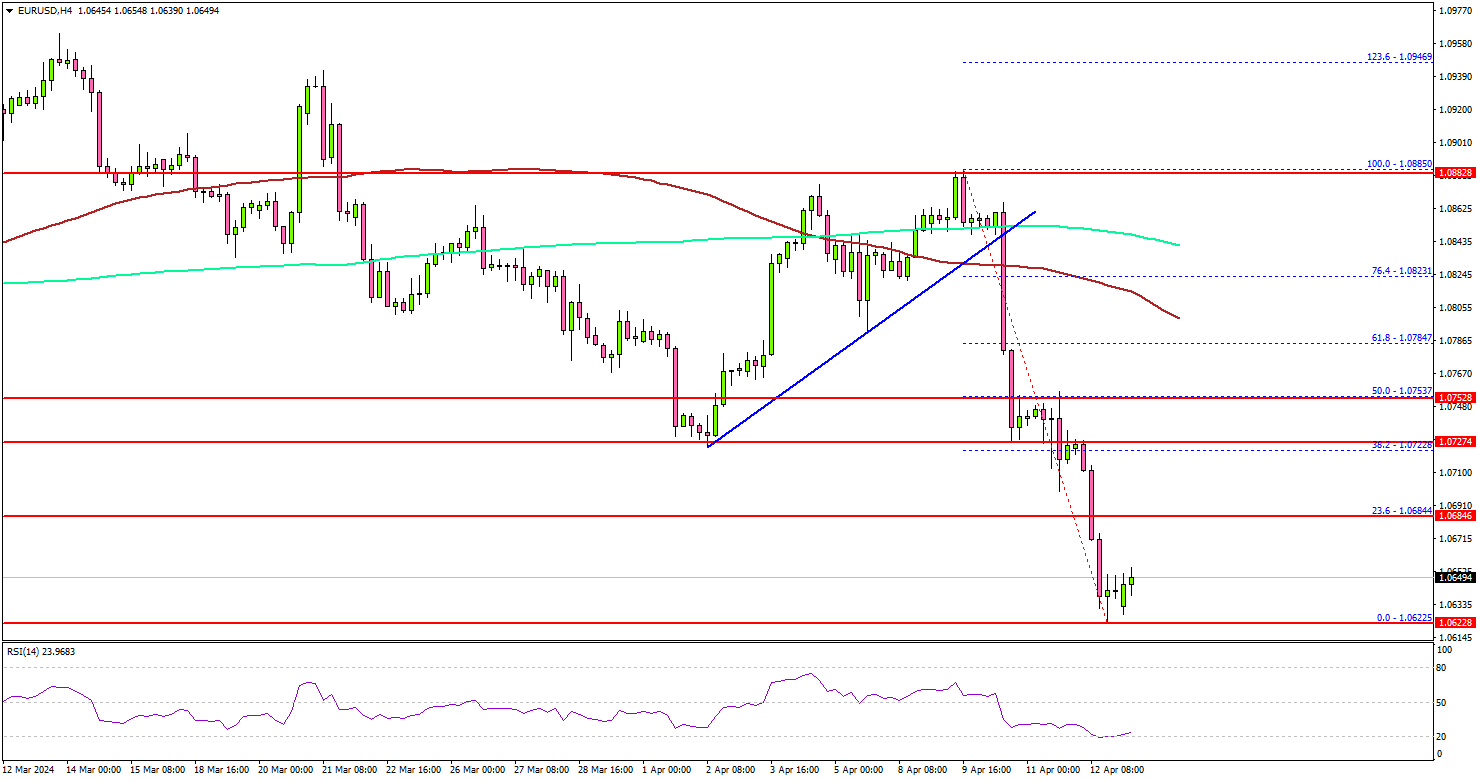
EUR/USD dived below the 1.0750 and 1.0720 support levels. It even settled below the 100 simple moving average (red, 4-hour) and the 200 simple moving average (green, 4-hour).
Immediate support is near the 1.0620 level. The next major support is at 1.0580. If there is a downside break below the 1.0580 support, the pair could decline toward the 1.0550 support. Any more losses might send the pair toward the 1.0520 level in the near term.
On the upside, the pair is facing hurdles near 1.0685. The first key resistance is near the 1.0720 zone. A clear move above the 1.0720 resistance could send the pair further higher. In the stated case, EUR/USD could rise toward the 1.0800 level.
Looking at Gold, the price rallied further above the $2,400 level before the bears appeared and sparked a sharp decline.
Economic Releases
- US Retail Sales for March 2024 (MoM) – Forecast +0.3%, versus +0.6% previous.
EURGBP Elliott Wave : Selling The Rallies at Blue Box Area
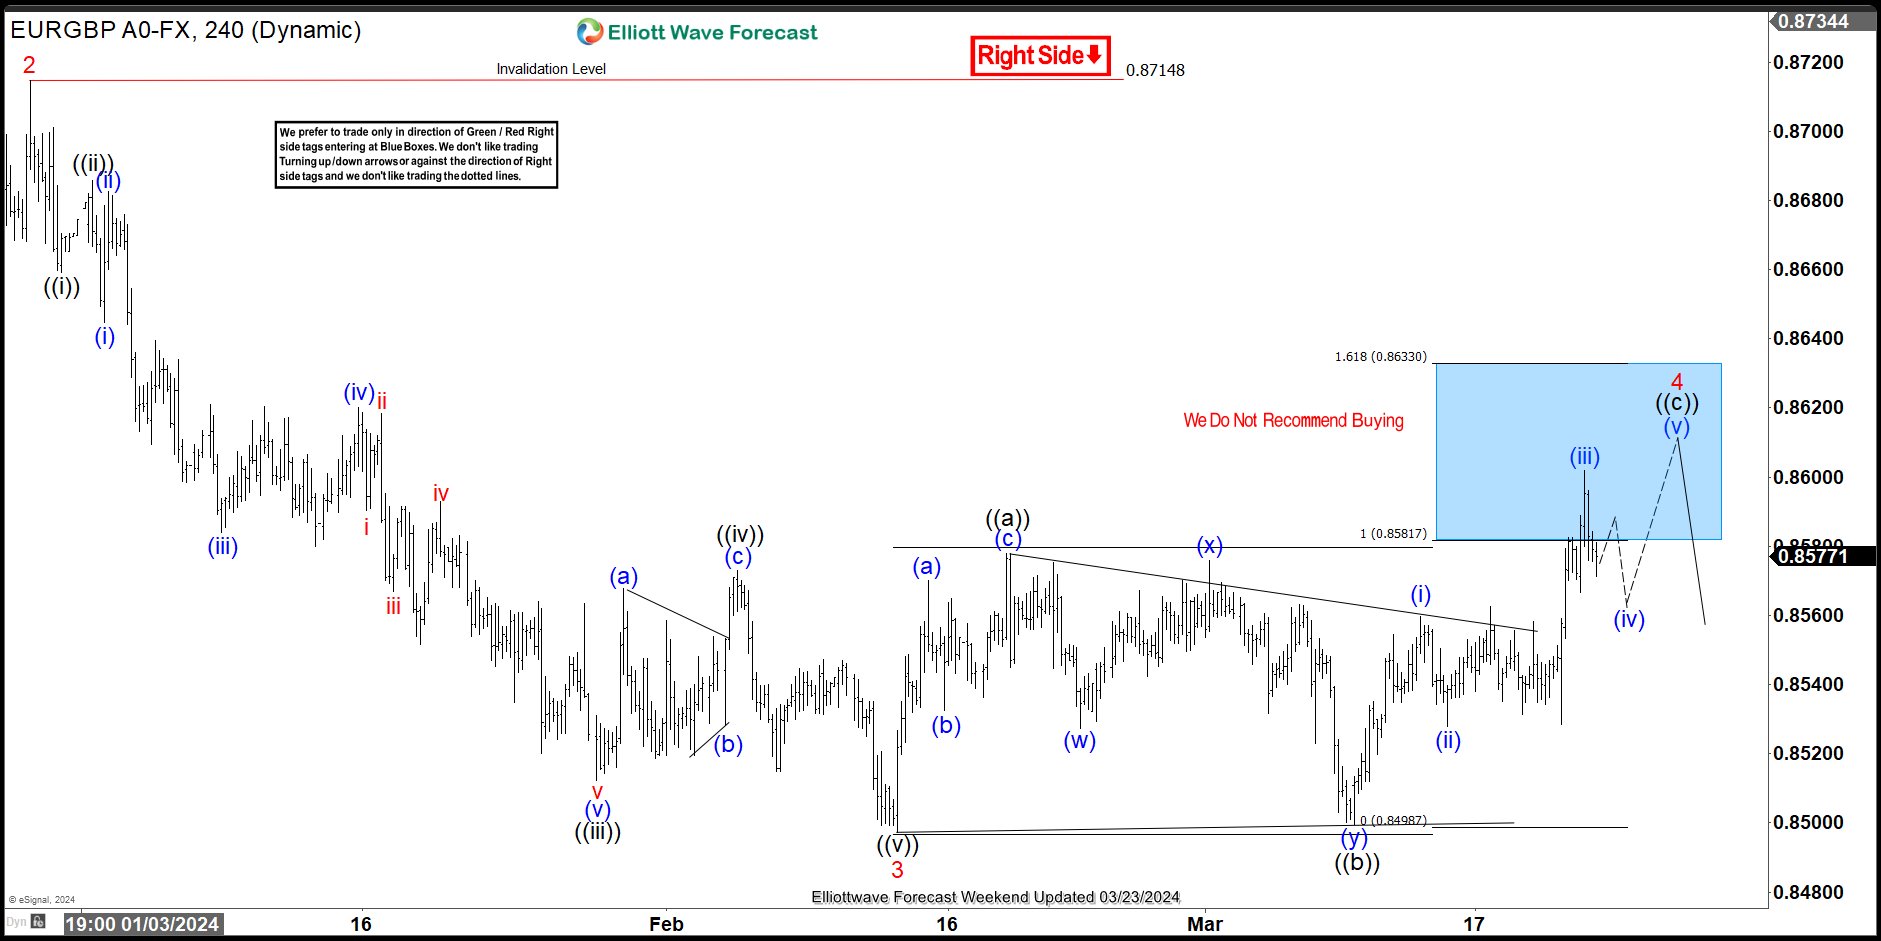
Hello fellow traders. In this technical article we’re going to take a quick look at the Elliott Wave charts of EURGBP published in members area of the website. Our team recommended members to avoid buying , while keep favoring the short side in the pair. Recently we got recovery that reached our selling zone. The pair found sellers and made reaction from the blue box as expected. In the further text we are going to explain the Elliott Wave Forecast and trading strategy.
EURGBP Elliott Wave 4 Hour Chart 03.23.2024
The pair is correcting the cycle from the 0.87148 peak , giving us 4 red recovery. The price has already reached the extreme zone at 0.85817-0.86330 (Blue Box – sellers zone). So, we are aware that another marginal push up may or may not be seen within the blue box. Alternatively, 4 red can be already completed at the 0.86019 high as Elliott Wave Double Three Pattern. We don’t recommend buying the pair and prefer the short side from the blue box zone. As the main trend is bearish, we expect to see at least 3 waves pullback from our selling zone. Once the decline reaches 50 Fibs against the ((b)) black low, we will make the short position risk-free (put SL at BE) and take partial profits. Invalidation for the short trades is a break above 1.618 fib ext: 0.8633.
Quick reminder:
Our charts are easy to trade and understand:
Red bearish stamp+ blue box = Selling Setup
Green bullish stamp+ blue box = Buying Setup
Charts with Black stamps are not tradable. 🚫
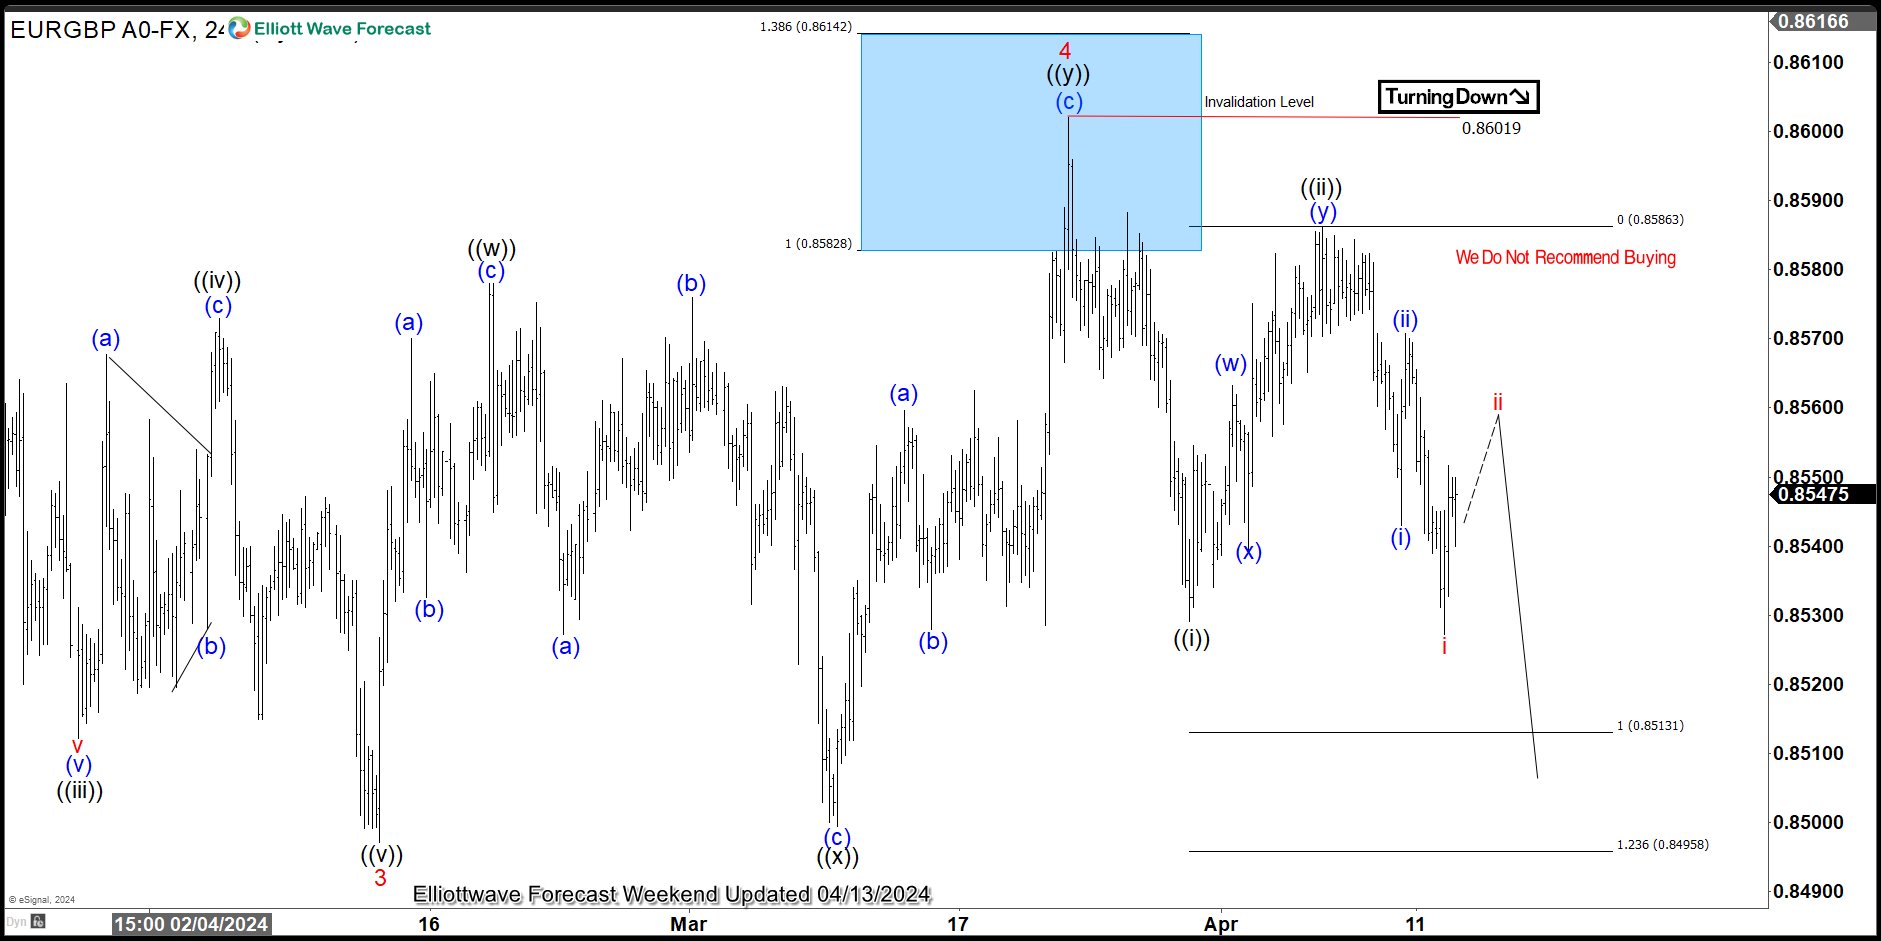
EURGBP Elliott Wave 4 Hour Chart 04.13.2024
The pair found sellers at the Blue Box area: 0.85817-0.86330. The recovery completed at the 0.86019 high, and we are receiving a good reaction from the selling zone. The decline reached and exceeded 50 fibs against the connector’s low. So, members who took the short trade are currently enjoying profits in risk-free positions. While below the 0.86019 high, the next leg down can be in progress toward new lows.
USDCAD Wave Analysis
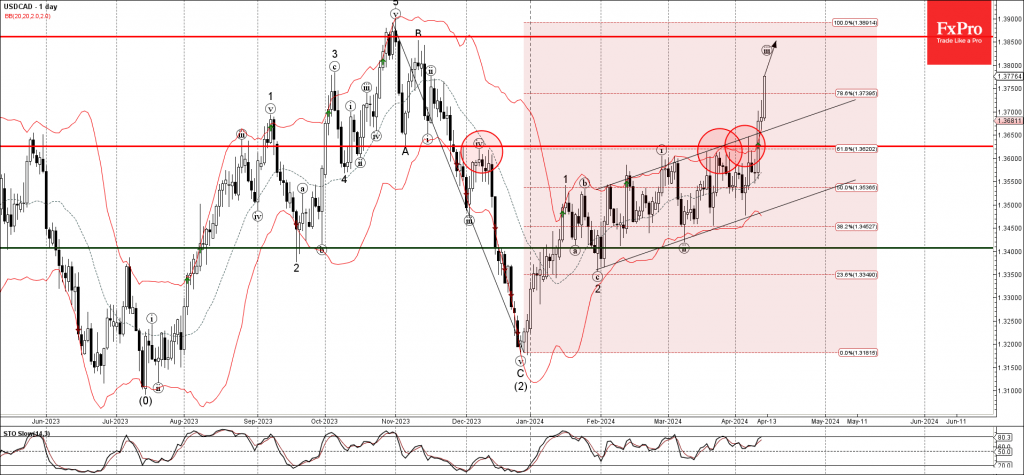
- USDCAD broke key resistance level 1.3625
- Likely to rise to resistance level 1.3860
USDCAD rising strongly after the earlier breakout of the key resistance level 1.3625 (which has been reversing the price from December) intersecting with the 61.8% Fibonacci correction of the downward ABC correction (2) from November.
The breakout of the resistance level 1.3625 coincided with the breakout of the daily up channel from January.
USDCAD can be expected to rise further to the next resistance level 1.3860 (former multi-month high from October, and the target for the completion of the active impulse iii).