

Sample Category Title
Crude Oil’s Tactical Retreat, Unlikely Turn Around
Oil is losing more than 1% on Monday, below $84 a barrel for WTI and below $89 for Brent after Friday’s rollercoaster, when prices peaked above $87 and $91.6, respectively. The drivers were geopolitics, where fears of an escalation of the conflict between Israel and Palestine fueled the growth. The decline was helped by the relatively conciliatory rhetoric of the US and the strengthening of the dollar.
A double top – a reversal technical pattern – was recorded on the oil charts. The RSI exit from the overbought zone on daily timeframes also supports the idea of further price decrease. In addition, a short-term downward trend can be identified from the fifth of April.
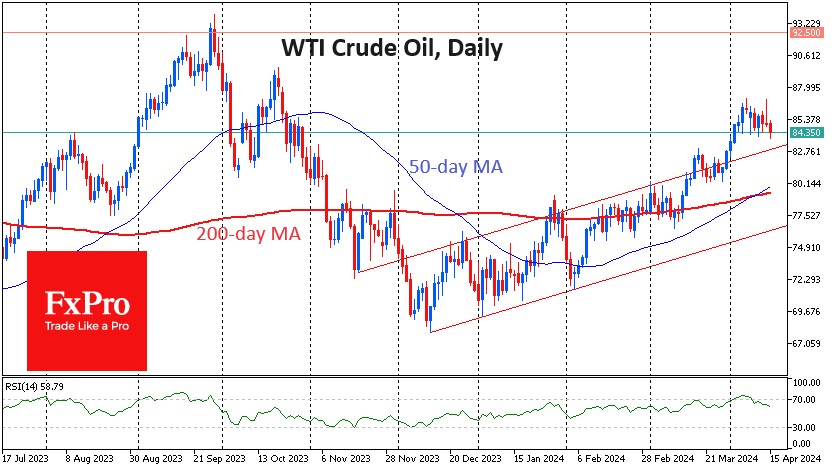
The strengthening of the dollar due to the shift in expectations for the key Fed rate has been visibly eating away at risk appetite since the beginning of April, leaving oil no escape from this trend.
Nevertheless, there are still doubts that we are seeing the start of a downtrend rather than short-term profit-taking.
Firstly, we saw an acceleration in oil growth at the end of March, and the current pullback so far fits into the uptrend. It is worth watching closely the price dynamics near the previous peak ($82.50-83.0) and the previous local bottom ($80.50). A rebound from one of these support levels will reinforce the idea that this is still a bull market for oil.
Secondly, the supply and demand balance is on the bulls’ side. Economic growth in Europe is still gaining momentum, America is not slowing down, and China is in the stimulus phase. Oil supply is in no hurry to expand despite the recent price increase. The US has been producing at a rate of 13.1M B/D for the past five weeks, and the number of oil rigs is just over 500, de facto stagnating so far this year.
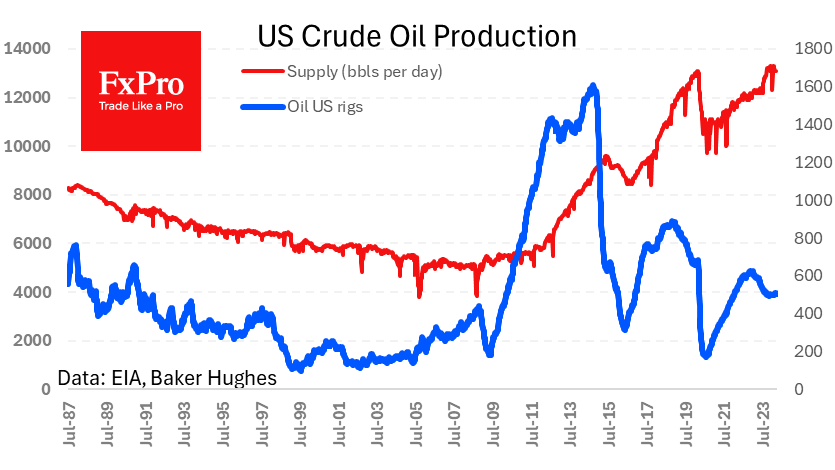
Simply put, we’re sticking with the idea for now that WTI crude won’t easily fall below $80 in the coming days. The chances are much higher that it will find buyer support somewhere between $80.50 and $82.5 on a combination of geopolitics, strong demand and stagnant production.
NZ Dollar Slides to Five-Month Low
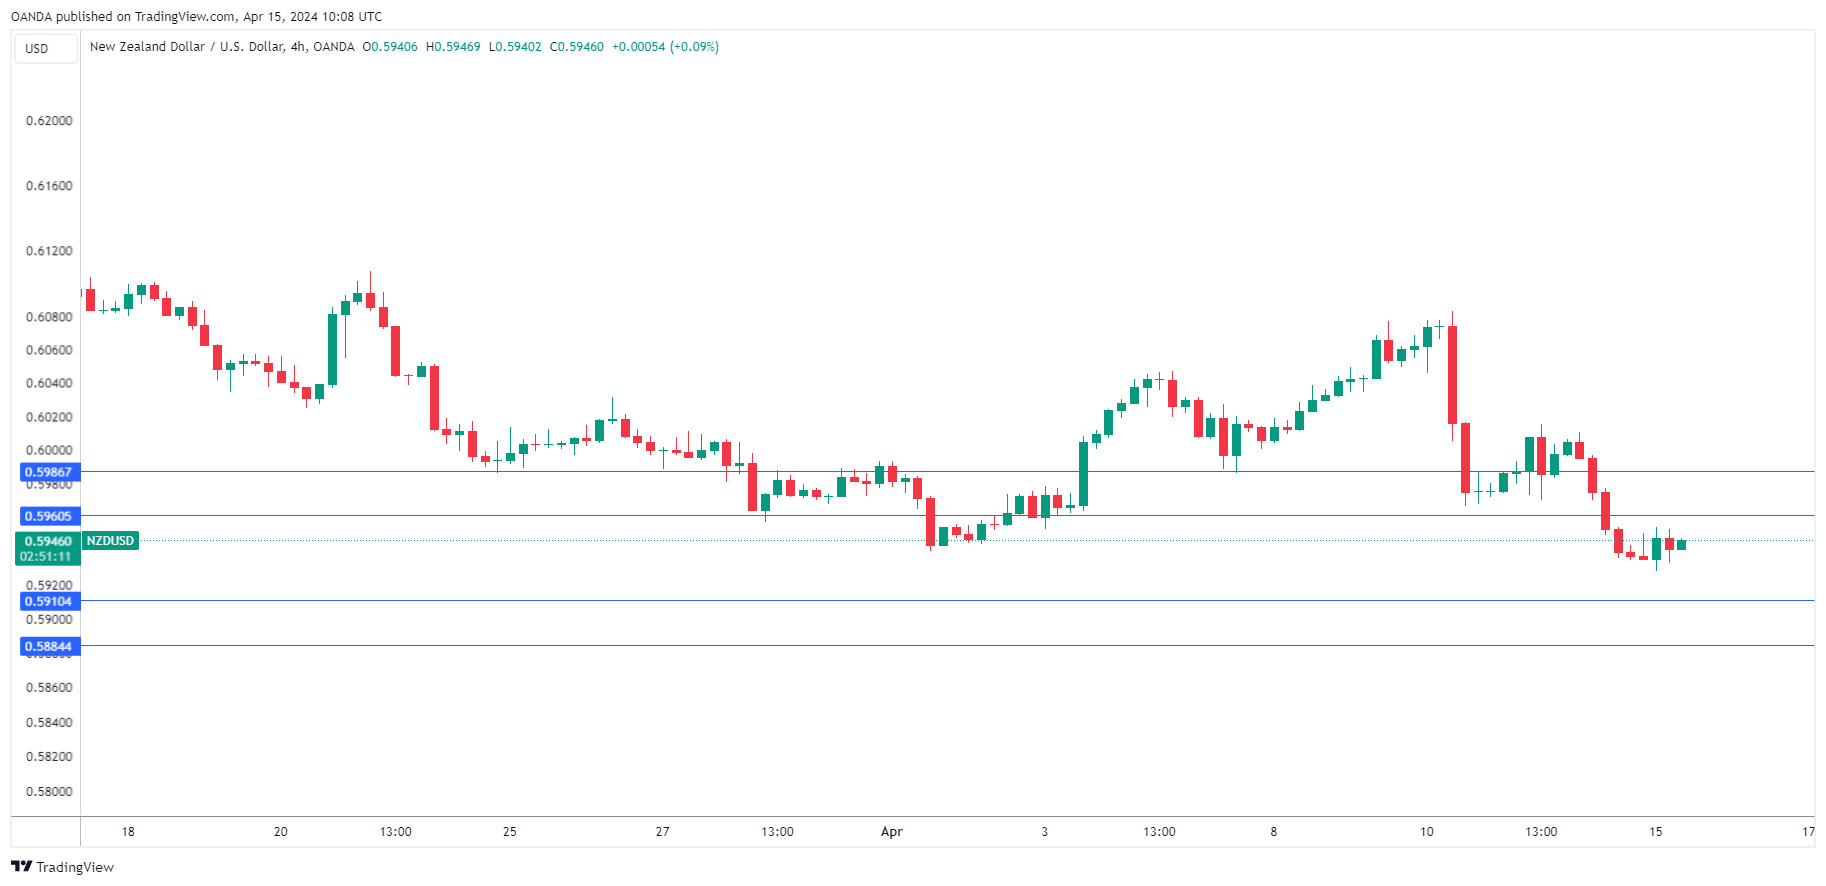
The New Zealand dollar has stabilized on Monday after as sharp decline of 1% on Friday. In the European session, NZD/USD is trading at 0.5945, up 0.14%. The New Zealand dollar dropped as low as 0.5927 earlier, its lowest point since November 14.
NZ Services PSI declines
New Zealand’s services sector had a dismal March, as the economy continues to show signs of distress. The BusinessNZ Services PSI slid to 47.5, down from a revised 52.6 in February and shy of the market forecast of 53.4. This was the lowest level since January 2022 and ended two straight months of expansion. The 50 level separates contraction from expansion.
The soft services release follows last week’s Business NZ Manufacturing PMI, which dropped from 49.3 to 47.1 in March, marking 13th straight month of contraction and missing the forecast of 50. These readings indicate that New Zealand’s economic downturn may worse than thought and could bring forward the central bank’s plans to lower interest rates.
The Reserve Bank of New Zealand kept rates unchanged at 5.50% for a sixth straight time last week and said that maintaining a restrictive policy would enable CPI to fall within the 1% to 3% target range before the end of the year.
The markets will be keeping a close eye on Chinese data on Tuesday. The highlight is GDP for the fourth quarter, which is expected to grow by 5%, down from 5.2% in Q3. Industrial production and retail sales are also expected to decelerate, which could translate into losses for the New Zealand dollar as China is New Zealand’s biggest export market.
NZD/USD Technical
- NZD/USD is putting pressure on resistance at 0.5960, followed by resistance at 0.5986
- There is support at 0.5910 and 0.5884
USD/JPY Outlook: Resumes Rally After a Brief Pause
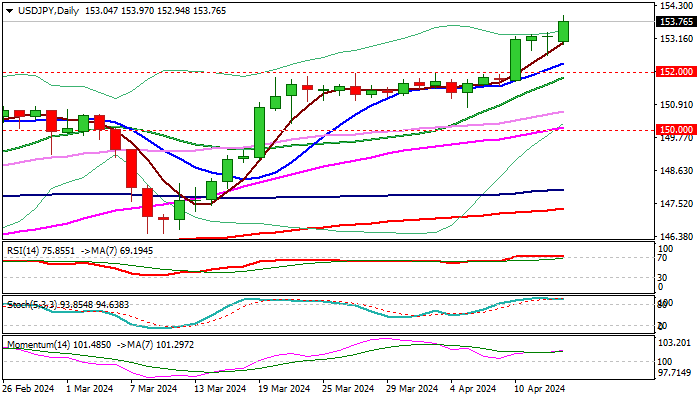
USDJPY resumes uptrend on Monday, after a brief pause last Thu/Fri and hit new multi-decade high, just ticks ahead of 154.00 round-figure barrier.
Bulls hold grip despite increased pressure from overbought studies, with last week’s close above former pivotal barriers at 152.00 zone, adding to bullish signals.
Initial resistances lay at 154.00/25, guarding targets at 155.00/29 (psychological / Fibo 200% projection of the rally from 146.48, Mar 8 low).
Near-term bias to remain firmly with bulls while the price action stays above rising 10DMA (152.32) while loss of strong supports at 152.00 zone (former tops / 20DMA) would increase risk of deeper pullback.
Although fears of intervention have eased, markets remain cautious, as Japan’s authorities are ready to intervene to support weakening yen.
Res: 154.00; 154.25; 155.00; 155.29.
Sup: 152.94; 152.32; 152.00; 150.80.
Crypto Let Off Steam Rather than Start a Reversal
Market picture
It was a non-boring weekend for the cryptocurrency market. Market sentiment swung sharply towards buying the dollar and selling stocks, gold, and cryptos on Friday afternoon. Also operating over the weekend, the crypto market accelerated its decline on Saturday, with capitalisation falling to $2.2 trillion (-18% from Monday’s peak) but began to recover on Sunday and has risen to $2.42 trillion (-7% in seven days) at the time of writing.
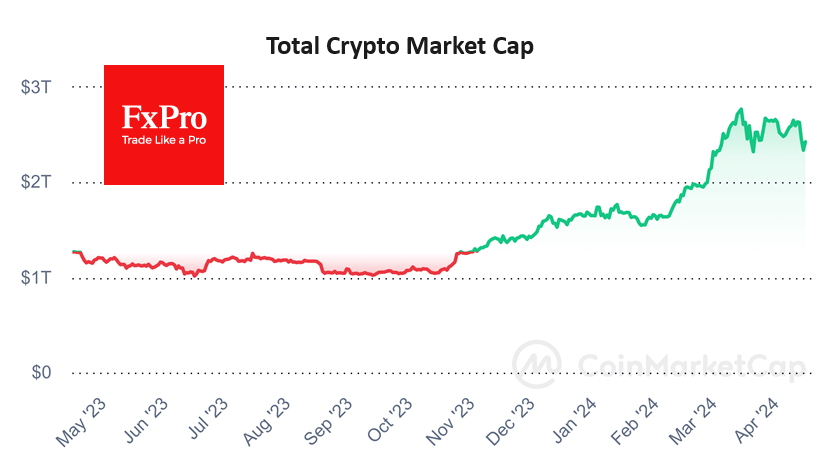
Bitcoin’s weekly decline was the largest in eight months and, in dollar terms, the largest on record since the November 2022 FTX crash. Following Bitcoin, other digital assets collapsed as well. Many of the largest altcoins lost about a third of their value over Friday and Saturday.
Bitcoin dipped below $60K over the weekend, but a recovery on Sunday and at the start of the day on Monday brought the price back up to $66.2K. The weekend’s failure made the technical picture more contradictory. On the bullish side, BTCUSD met strong buying on the decline to the 61.8% retracement level from the rise from the lows at the beginning of the year to the peaks in March. It’s a classic correction that often clears the way to the upside.
Bears, on the other hand, may cite a sharp dip below the 50-day moving average, which could break the multi-month uptrend. But we see this dip as a repeat of the January correction – necessary to keep buyers interested and to shake weak hands out of the market.
News background
CryptoQuant said the current cryptocurrency market crash is necessary to reset traders’ unrealised profits to zero – usually a bottom signal in bull markets. MicroStrategy founder Michael Saylor emphasised that “chaos is good for bitcoin”.
If spot bitcoin ETFs are launched in Hong Kong, demand from Chinese mainland investors could reach $25bn, Matrixport expects. According to Bloomberg, Hong Kong may approve ETFs based on the first cryptocurrency and Ethereum as early as 15 April.
Crypto Nova believes that altcoin season is just around the corner. The bitcoin dominance index “is in a sideways movement, and that almost always happens before a reversal”.
Solana developers said they have started testing solutions to deal with congestion and increasing network errors. The update is not yet available on the main Solana network, which will give developers a chance to test the innovations.
Robert Kiyosaki confirmed Kathy Wood’s prediction and also stated that he expects Bitcoin to grow to the $2.3 million ARK Invest predicts by 2030. Kiyosaki also noted that he doesn’t trust Wall Street financial products, preferring to buy BTC through the spot market rather than via ETFs.
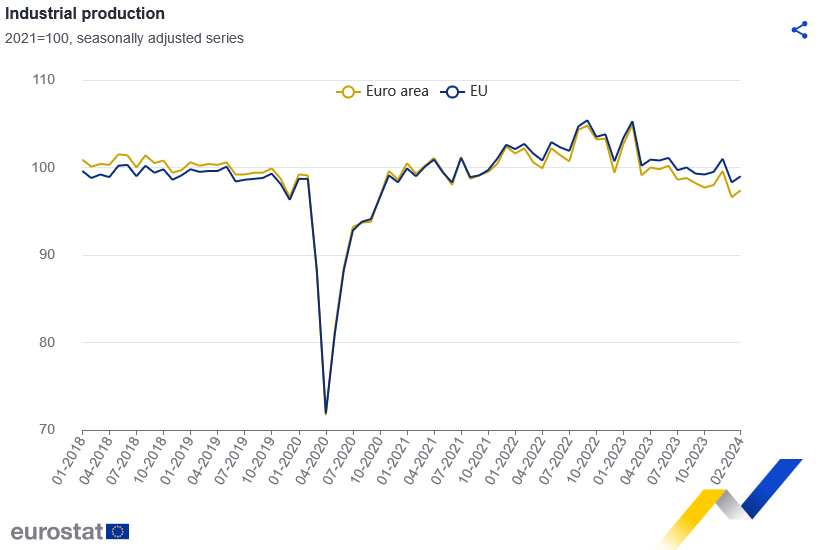
Eurozone industrial production rises 0.8% mom in Feb, EU up 0.7% mom
Eurozone industrial production rose 0.8% mom in February, matched expectations. Production increased by 0.5% for intermediate goods, 1.2% for capital goods, and 1.4% for durable consumer goods. On the other hand, production by -3.0% for energy, and -0.9% for non-durable consumer goods.
EU industrial production rose 0.7% mom. The highest monthly increases were recorded in Ireland (+3.8%), Hungary (+3.5%) and Slovenia (+3.3%). The largest decreases were observed in Croatia (-4.6%), Lithuania (-3.0%) and Belgium (-2.7%).
Gold: Sharp Pullback from New All-Time High Warns that Bulls Might be Losing Traction
Gold keeps firm tone in early Monday, despite strong pullback from new record high ($2431) in late Friday trading.
Growing geopolitical tensions and fears of escalation of the conflict in the Middle East continue to fuel demand for safe haven bullion, with strong buying from the central banks and prospects of Fed rate cuts in coming months, adding to bullish outlook.
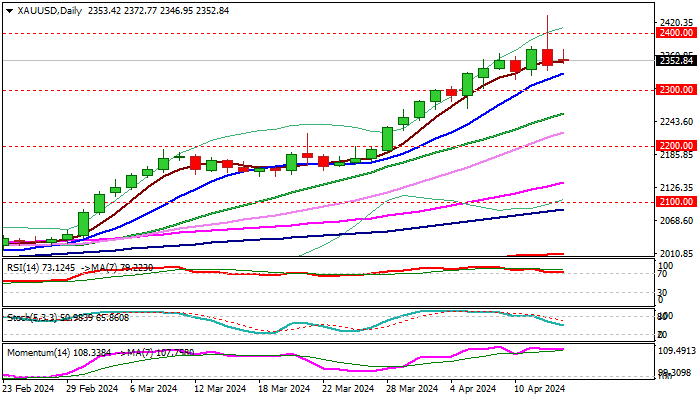
However, Friday’s strong upside rejection, which left bearish daily candle with long upper shadow, generates initial signal of a bull-trap and warns that bulls may take a breather for consolidation / shallow correction on overbought conditions
Solid supports at $2329 (rising 10DMA) and psychological $2300 level should keep the downside protected for fresh push higher, with break of $2431 to expose targets at $2453 and $2500
Caution on dips below $2300 handle which would risk test of lower pivot at $2260 (Fibo 38.2% of $1984/$2431 upleg), reinforced by rising 20DMA.
Res: 2372; 2400; 2431; 2453.
Sup: 2329; 2300; 2260; 2224.
ECB’s Simkus anticipates three rate cuts this year, possibly four
ECB Governing Council member Gediminas Simkus forecasted three 25bps rate cuts for this year, with a potential for a fourth. "I see a higher than 50% chance there will be more than three cuts this year," he told reporters.
Simkus also highlighted that the ECB might not stop at just one rate cut in June, stating, "I see a higher than zero chance that an interest rate cut may follow also in July. The July decision will be important in setting the trajectory."
Regarding the pace and magnitude of these rate cuts, Simkus emphasized a cautious approach. He remarked that there is "no urgency to cut rates" by more than 25bps at a time, indicating he preference for gradual adjustments rather than larger, more aggressive cuts.
Gold in a Wait-and-See Mode
- Gold opens near Friday’s closing price as safe-haven demand stabilizes
- Bulls wait for a break above 2,430; Bears anticipate a drop below 2,325
It was a harsh weekend, as Iran’s retaliatory missile and drone attack against Israel sparked concerns of global conflict. But Israel successfully blocked the airstrike from a distance a distance, averting another record rally in the safe-haven gold.
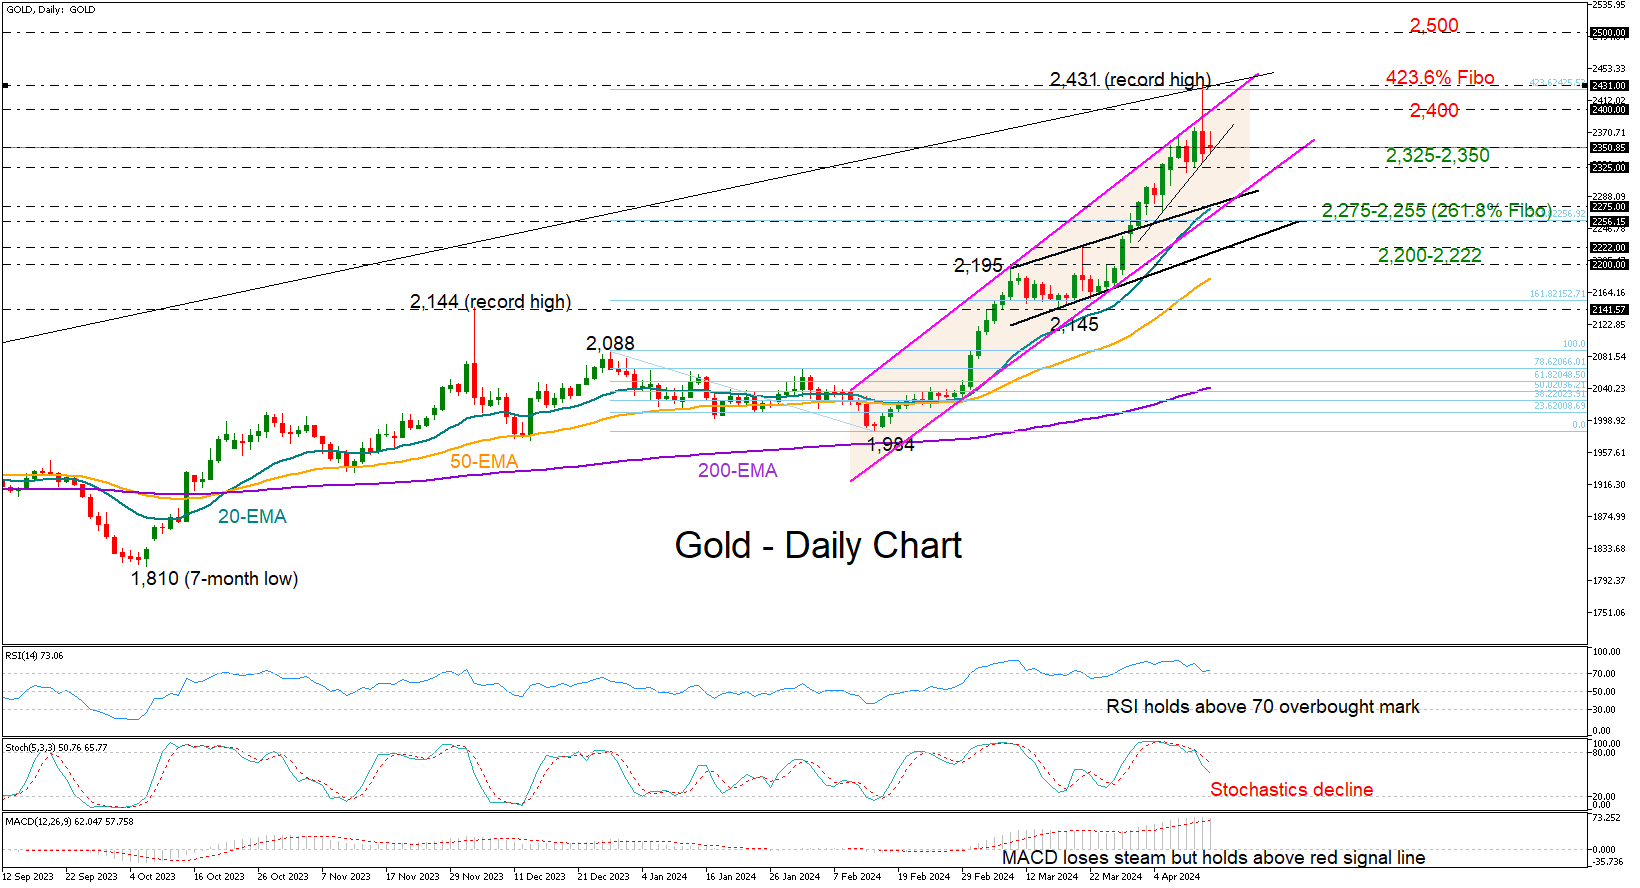
Bullion started the day steady, remaining close to the 2,350 level, which aligns with the 20-period EMA on the four-hour chart, after reaching a record high of 2,431 on Friday.
Technically, overbought conditions are still present. Thus, it is possible that a downside correction will occur in the near future. However, in order for selling pressures to intensify, the bears need to crack the 2,325 floor. In this case, the price could tumble towards the 2,255-2,275 territory, where the 20-day EMA and the broken short-term resistance line from March are located. Even lower, the price could pause within the 2,200-2,222 region.
On the upside, the 2,400-2,430 zone, which includes the 423.6% Fibonacci extension of the December-February downfal and the upper boundary of a bullish channel, will be closely watched. A decisive break higher could see an advance towards the 2,500 psychological level. Nevertheless, for that to happen, buyers might need a significant deterioration in global geopolitical conditions.
Overall, gold maintains a strong bullish trend in the big picture. A sustainable move above 2,430 or below 2,325 could navigate the market accordingly.
Gold Technical: At Risk of Mean Reversion Corrective Decline After 19% Gain
- Commitments of Traders aggregate net bullish open positions of large speculators in the Gold futures market have flashed a bearish contrarian condition.
- The recent rally in Gold (XAU/USD) has been primarily driven by an increase in geopolitical risk premium arising from Middle East tensions. A lack of fresh catalysts after the latest Iran retaliation offensive moves toward Israel increases the risk of profit-taking activities in Gold (XAU/USD).
- Watch the key short-term pivotal resistance of US$2,390 on Gold (XAU/USD).
Gold (XAU/USD) has had a fantastic performance year-to-date with a gain of +15% as of last Friday, 12 April surpassing both the two major US stock indices; S&P 500 (+9%), and Nasdaq 100 (+10%) over a similar period.
The bulk of its current yearly gain has taken place in the prior month of March (+9%), and April (+5.5% month-to-date as of 15 April) as its price actions staged a bullish breakout above a major range resistance of US$2,075 in place since early August 2020.
Also, the current bullish tone seen in Gold (XAU/USD) has been reinforced by rising geopolitical risk premiums, primarily from the Middle East with ongoing fears of tit-for-tat retaliation maneuvers between Israel and Iran over the ongoing Israel-Hamas war.
In the past two months, the inverse relationship between Gold (XAU/USD) and the US 10-year Treasury real yield has broken down due to an increasing odd of stagflation risk revival via the conduit of higher oil prices (from ongoing Middle East tensions that may trigger a supply side reduction or disruption in oil flows) that eventually sees higher inflationary expectations that prevent the US Federal Reserve from enacting an aggressive interest rate cut cycle, in turn may dampen aggregate demand through a higher cost of funding environment.
Large speculative players’ net bullish positioning hit an extreme level
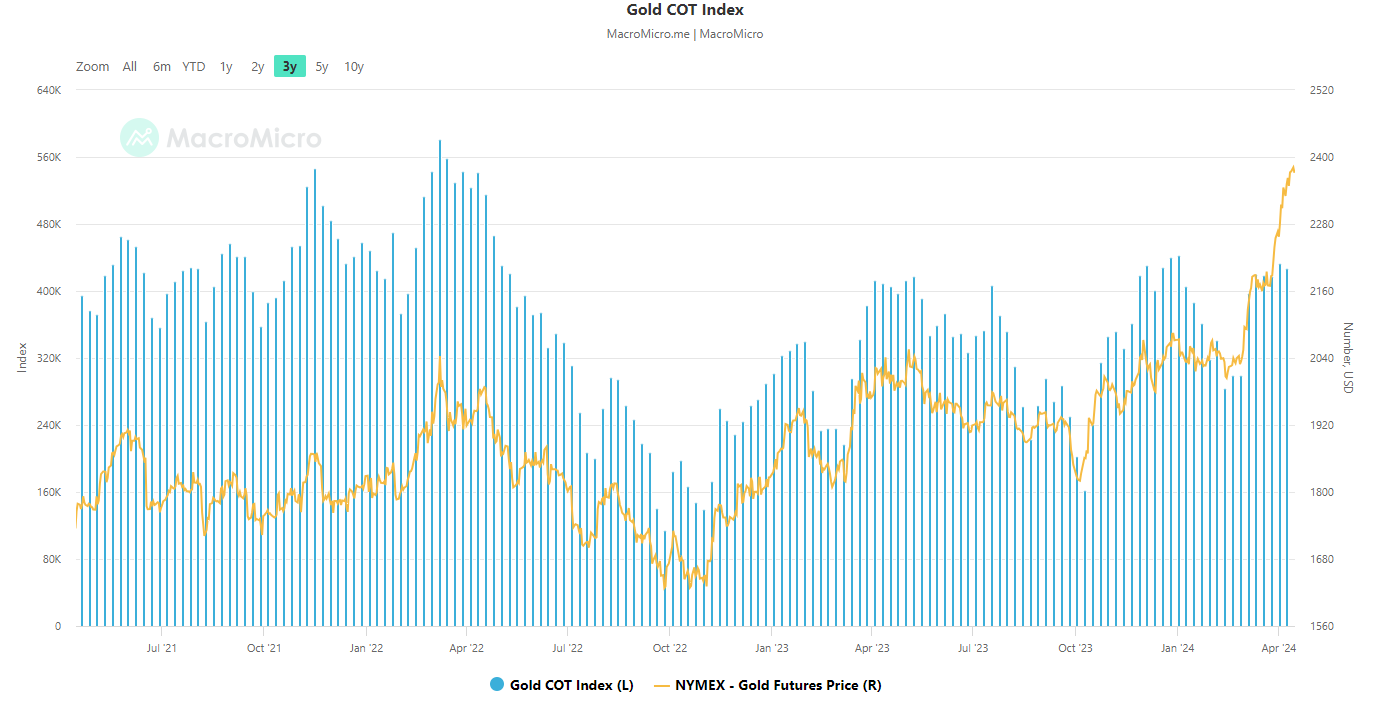
Fig 1: Commitments of Trader large speculators’ net positioning in Gold futures as of 8 April 2024 (Source: Macro Micro, click to enlarge chart)
Based on the latest data Commitments of Traders data as of 8 April 2024 (compiled by Macro Micro), the aggregate net bullish open positions of large speculators in the gold futures market of NYMEX (after offsetting the aggregate positions of large commercial hedgers) have risen to +427,001 contracts (net long), its highest level in almost two years with +431,020 contracts recorded on 2 May 2022 (see Fig 1).
Given that net open large speculative positioning flows (primarily from hedge funds) are contrarian in nature which suggests that a relatively high level of net positioning is likely to see an opposite reaction in price actions.
In the current context of Gold (XAU/USD) movements, the risk of further profit-taking activities cannot be ruled out as it recorded a loss of -1.2% last Friday, 12 April, its worst daily performance since 13 Feb 2024 after hitting a fresh intraday all-time high of US$2,431.
Since large speculators have committed a relatively high amount of net bullish open positioning, a further potential rise in Gold (XAU/USD) needs to have fresh catalysts as last week’s rally has been in anticipation of Iran’s retaliation attacks on Israel which has already taken effect on last Saturday.
Therefore, lack of fresh catalysts in the Middle East to drive up geopolitical risk premium (the main factor that is leading the two-month bullish movement in gold prices), Gold (XAU/USD) may eventually see late buyers rushing to exit their positions which increases the risk of a liquidity cascading downward effect on Gold (XAU/USD) prices in the short-term.
An overstretched uptrend increases the risk of corrective mean reversion decline toward the 20-day moving average
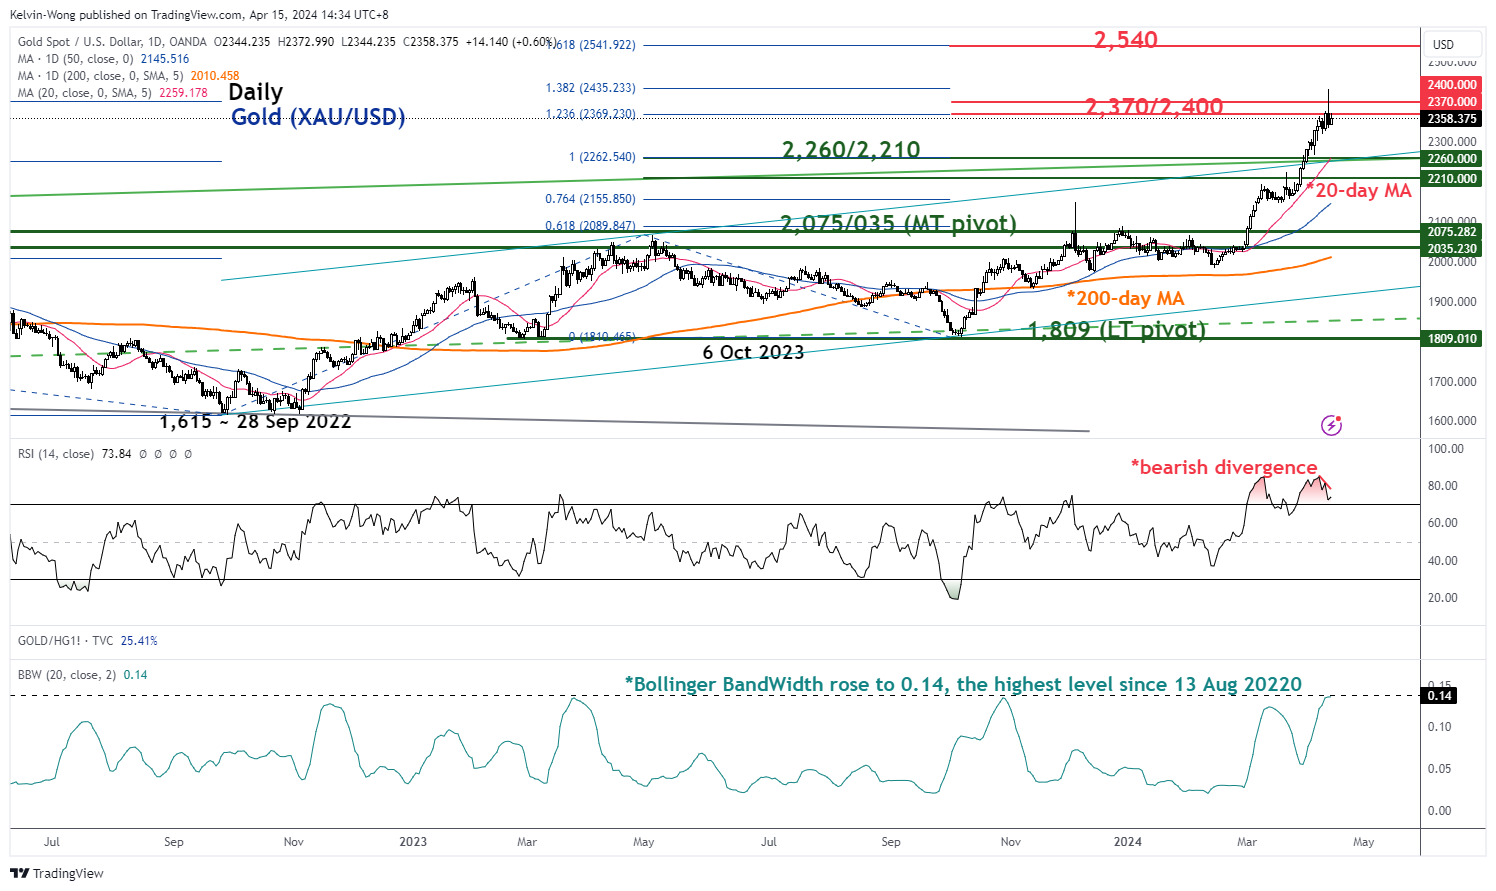
Fig 2: Gold (XAU/USD) medium-term trend as of 15 Apr 2024 (Source: TradingView, click to enlarge chart)
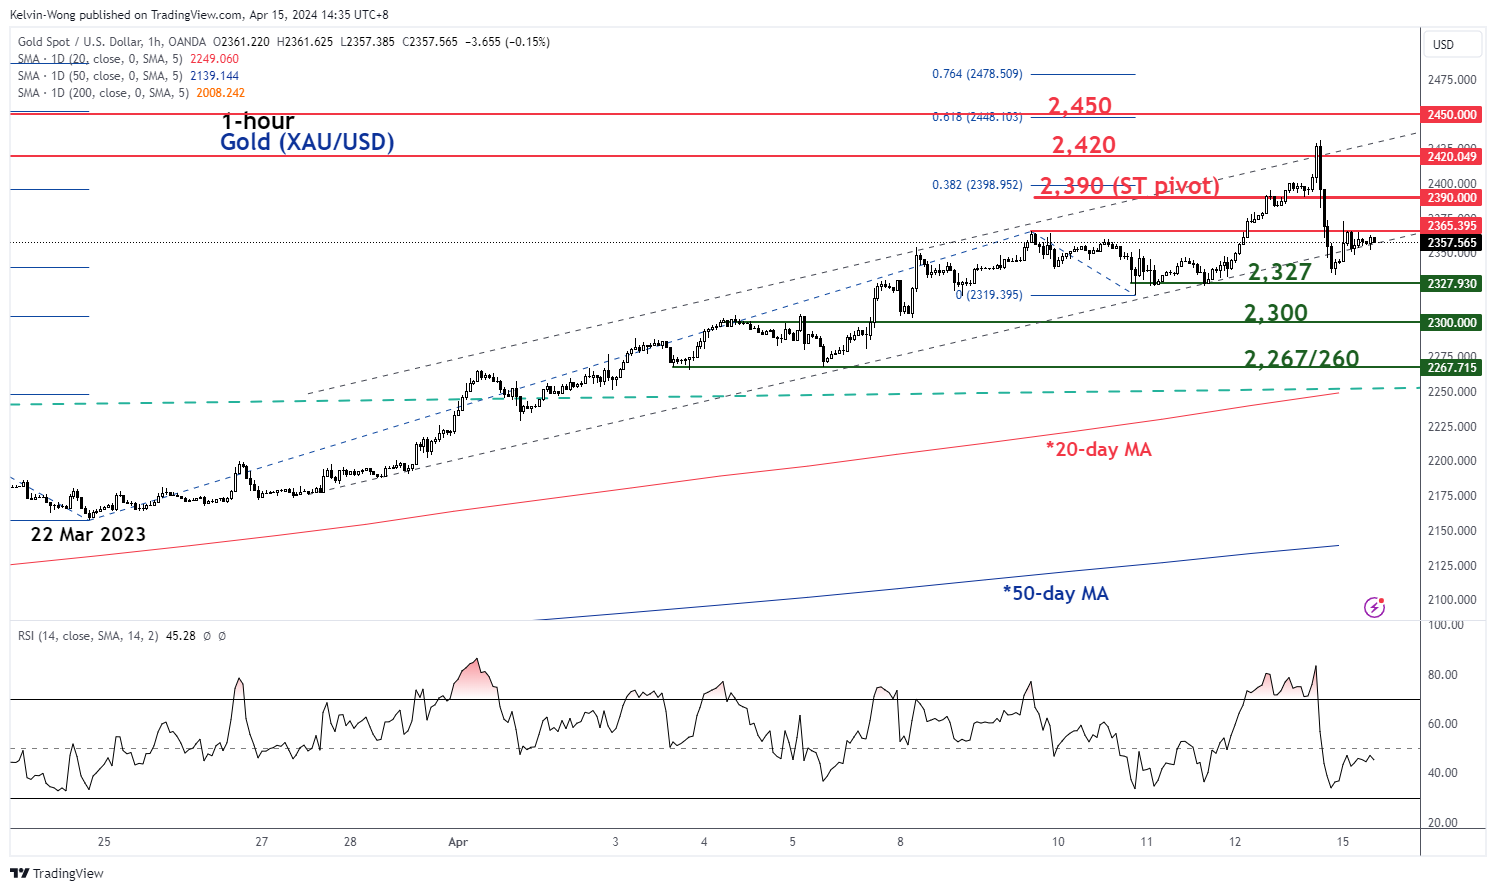
Fig 3: Gold (XAU/USD) short-term trend as of 15 Apr 2024 (Source: TradingView, click to enlarge chart)
Considering the relatively high level of net bullish positioning in large speculators toward gold futures as highlighted earlier, it does not imply with certainty that the next price action movement for Gold (XAU/USD) is a medium-term bearish reversal.
So far, the short and medium-term uptrend phases for Gold (XAU/USD) remain intact as current price actions continued to oscillate above its 20-day and 50-day moving average.
Based on a statistical and technical analysis standpoint, the two-month rally of +19% hit a current all-time intraday high of US$2,431on last Friday and is considered overstretched as its price actions hit more than two positive standard deviations away from its 20-day moving average (the mean). Hence, a short-term minor corrective pull-back may be imminent at this juncture.
This overstretched upside price actions observation can be illustrated clearly with the steep upmove seen in the daily Bollinger BandWidth indicator where it rose to 0.14 last Friday, its highest level since 13 August 2020 (see Fig 2).
In addition, the daily RSI momentum indicator has traced out a bearish divergence condition at its overbought region which increases the odds of the mean reversion decline scenario.
Watch the US$2,390 short-term pivotal resistance on Gold (XAU/USD), a break below near-term support of US$2,327 exposes the next intermediate supports at US$2,300 and US$2,260 (also the upward-slopping 20-day moving average) (see Fig 3).
On the other hand, a clearance above US$2,390 invalidates the corrective minor mean reversion decline scenario for a continuation of the impulsive upmove sequence for the next intermediate resistance to come in at US$2,450 in the first step.
Brent Oil Price Did Not Rise Despite Iran’s Attack on Israel
As you know, Iran launched a missile attack on Israel over the weekend. This could greatly increase the price of Brent oil, given that Iran is one of the top 10 oil producing countries, and the fact of the strike could provoke further escalation in the region.
However, at the beginning of the trading week, the price of Brent oil is below the levels at which they were at the end of last week. How so?
It is acceptable to assume the impact that the price reflects market risks and the expectations of its participants:
→ As the media wrote last week, the blow was expected after Israel’s attack on the Iranian mission.
→ The risk of escalation is not as high as it could be. According to the Washington Post, Biden advises Netanyahu to “slow down” after the Iranian attack. Administration officials said the United States would not join in any response to Tehran's attack and suggested Israel avoid escalation.
How might the situation develop further on the oil market?
From the point of view of technical analysis of the price of Brent oil, as we wrote on April 4, the upper limit of the blue channel is around USD 92 per barrel of Brent.
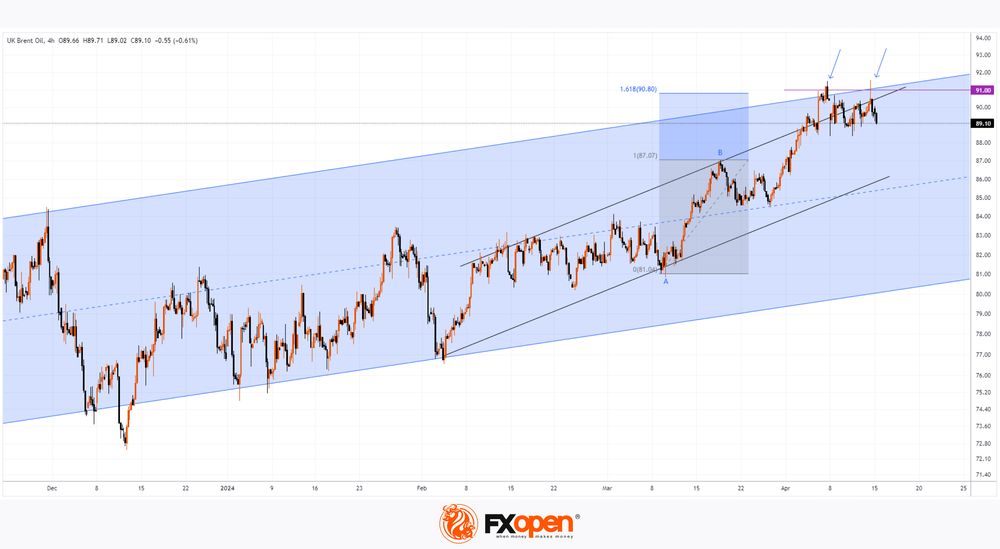
→ Fears of escalation pushed the price beyond the USD 91 level, but it failed to gain a foothold there.
→ The price quickly returned below the USD 91 level (as shown by the arrows) — a sign of bearish activity.
→ Resistance to price growth is provided by both the upper border of the blue channel and the upper border of the intermediate ascending channel (shown by black lines).
Please note that if we take the A→B impulse as a 100% basis, then at the price level of USD 90.80 per barrel of Brent there is a Fibonacci resistance level of 1.618.
Therefore, there is reason to assume that the price of oil may form a correction to the lower black support line if there are no signs of escalation (then the price of oil may rise closer to USD 100, as CNBC writes). And for the current US authorities, it is believed that rising oil prices are unprofitable due to the upcoming elections.
Start trading commodity CFDs with tight spreads. Open your trading account now or learn more about trading commodity CFDs with FXOpen.
This article represents the opinion of the Companies operating under the FXOpen brand only. It is not to be construed as an offer, solicitation, or recommendation with respect to products and services provided by the Companies operating under the FXOpen brand, nor is it to be considered financial advice.