Sample Category Title
Crypto Market: A Breather After the Climb
Market picture
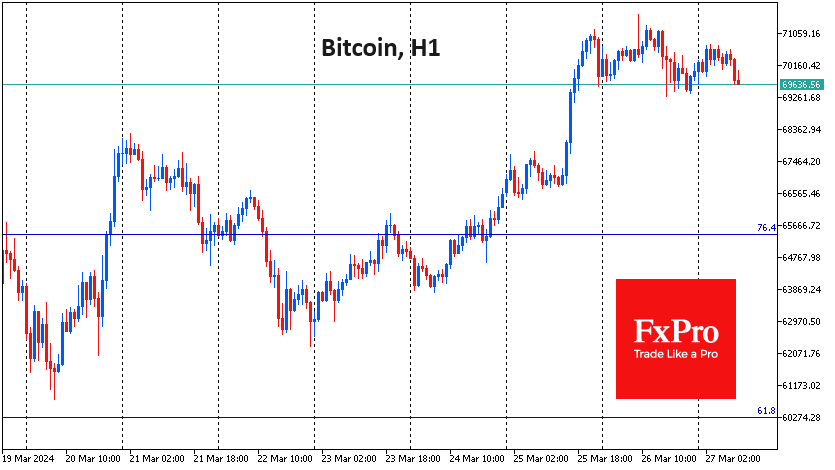
The capitalisation has stabilised around the $2.63 trillion level, losing 1.7% in 24 hours, but very close to where it was at the end of the day on Monday. Bitcoin is down 1.2%, Ethereum lost 2.3%, BNB sank 3%, and Solana is minus 4%. On the surface, the trend is for a deeper pullback in the coins that have rallied the most in recent days.
Bitcoin has fallen back below $70K, which can be attributed to the bulls’ need to let off steam and the general decline in risk appetite in global markets. The short-term focus for traders will be to see if Bitcoin can retest Tuesday’s intra-day lows near $69.5K. A break below this level could signal a more protracted correction.
New background
The US Department of Justice has filed charges against one of the world’s largest crypto exchanges, KuCoin, and two of its founders. The exchange is accused of ignoring US anti-money laundering laws and failing to monitor suspicious transactions as US law requires.
Bitcoin is more like a precious metal than a risky asset, according to BlackRock. However, it is unsuitable for high concentration in portfolios because of volatility, which becomes a huge risk factor.
The recent correction in BTC has almost completely repeated the pattern seen before the 2020 halving. Bitcoin has pulled back 18% in this cycle, while the asset is down just over 19% in 2020, the Rekt Capital analyst noted.
Spot Ethereum ETFs will be approved in May despite claims of the SEC’s “lack of engagement” with applicants, Grayscale believes. Many of the details had already been worked out before the spot bitcoin ETFs were approved. Bloomberg puts the chances of the ETH ETF being approved at “a very pessimistic 25%”.
The US SEC has asked a New York court to order Ripple to pay a $2 billion fine for violating securities laws. The case regarding the company’s institutional sales of XRP is ongoing.
According to Arkham Intelligence, the anonymous whale, who had been sleeping since 2019 with a balance of 94,500 bitcoins (the fifth largest accumulated coin), became active on the eve of the halving. He split his assets between three newly created cryptocurrency wallets. Santiment believes that such transactions could be a sign of preparation for a sale.
NIKKEI-225 Analysis Indicates Possibility of Correction from Historically High Levels
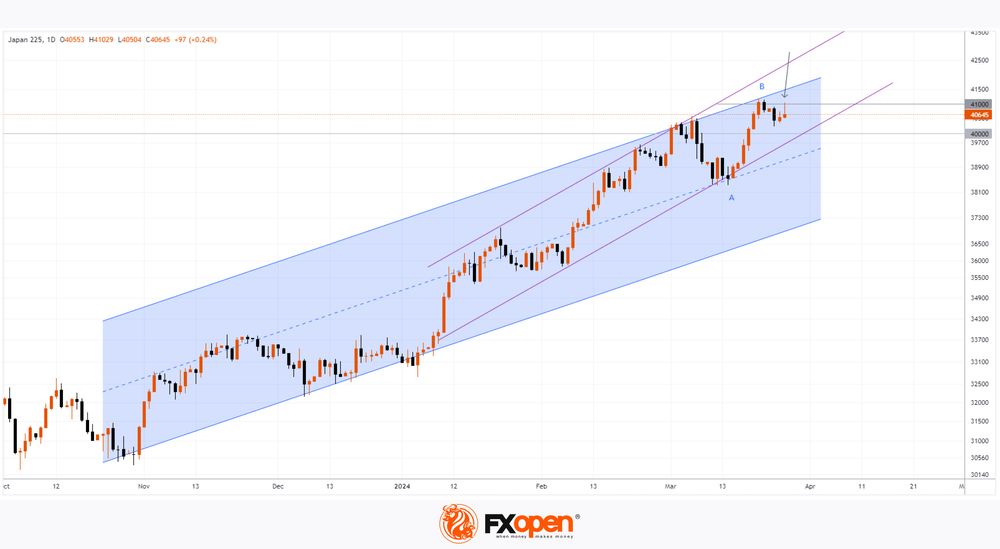
On March 21, the value of the Japanese stock index reached a historical maximum, exceeding the level of 41,100 points. This was facilitated by:
→ Weak yen supporting exporters. It increases the value of profits earned abroad for a large number of companies that sell their products abroad and then convert the profits into yen.
→ Demand for shares of Japanese companies paying dividends. For example, shares of air conditioner manufacturer Daikin Industries rose by 2.82%.
At the same time, the NIKKEI-225 chart signals indicate the likelihood of a correction, since:
→ The price is near the upper border of the ascending channel, from which resistance can be expected.
→ Based on the results of trading in the Asian session, a long upper shadow is forming on today’s candle – a sign of selling pressure (as shown by the arrow). It seems that the price of NIKKEI-225 is difficult to stay above the level of 41,000.
If the Japanese stock market follows a correction scenario, the price of NIKKEI-225 may be supported by:
→ the lower boundary of a steeper ascending channel (shown in purple), which runs in the area of the Fibonacci level = 50% of the A→B impulse;
→ psychological level of 40,000.
Bearish sentiment for NIKKEI-225 could be triggered by decisions from the Bank of Japan and the Ministry of Finance, which are concerned about the weakness of the yen — the USD/JPY rate is today near a 34-year low.
Trade global index CFDs with zero commission and tight spreads. Open your FXOpen account now or learn more about trading index CFDs with FXOpen.
This article represents the opinion of the Companies operating under the FXOpen brand only. It is not to be construed as an offer, solicitation, or recommendation with respect to products and services provided by the Companies operating under the FXOpen brand, nor is it to be considered financial advice.
Australian Dollar Slides to Three-Week Low
The AUD/USD pair is declining, reaching 0.6539 on Wednesday.
The Australian dollar is heading back to a three-week low following the release of softer-than-expected consumer price index (CPI) data from Australia.
For February 2024, inflation in Australia stood at 3.4%, unchanged from the previous report, in contrast to the anticipated slight increase to 3.5%. This marks the lowest inflation level since November 2021.
Last week, the Reserve Bank of Australia (RBA) held its meeting and decided to keep the interest rate unchanged at 4.35% annually. The rate remains at a 12-year peak, unchanged for the third consecutive meeting. The RBA’s stance has slightly shifted; the regulator no longer indicates further rate hikes, confident that inflation will ease pressure. This opens the possibility of rate reductions later in the year.
The US dollar is strengthening today amid growing expectations that the Federal Reserve will maintain interest rates high for an extended period. This contrasts with forecasts of monetary policy easing by other central banks, some of which could occur before the Fed’s actions.
Technical Analysis of AUD/USD
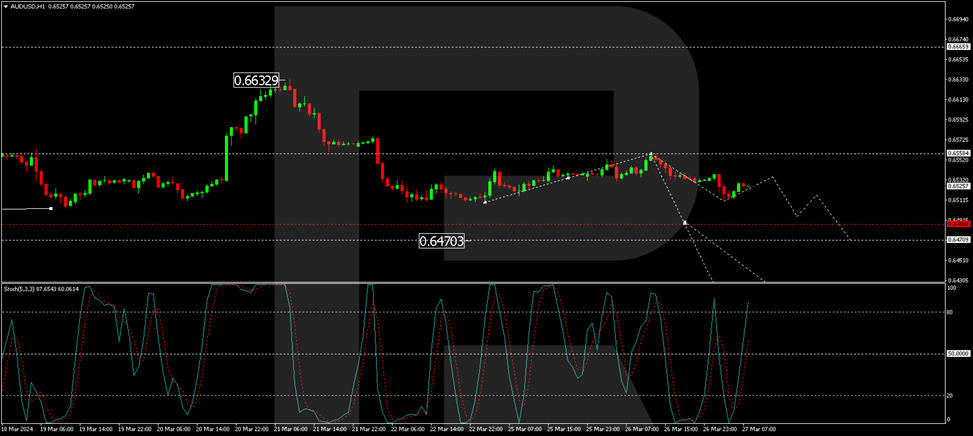
On the H4 chart of AUD/USD, a correction to 0.6558 has been completed. The market is continuing to develop a declining wave to 0.6486. After reaching this level, a consolidation range is expected. With a downward exit from this range, there is a potential for further decline to 0.6417. This target is local. The MACD indicator supports this scenario, with its signal line below zero and strictly directed downwards.
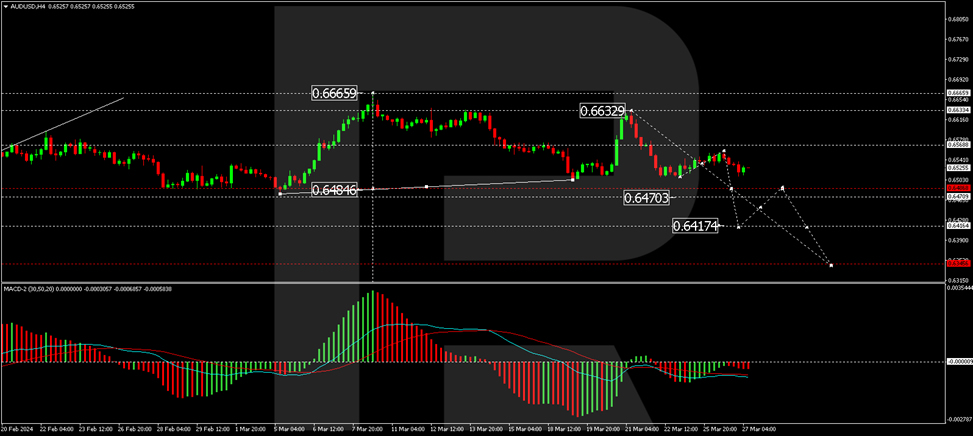
On the H1 chart, AUD/USD is forming a declining wave structure towards 0.6486. After reaching this level, a corrective phase to 0.6533 may occur, followed by a decline to 0.6470, with the potential to continue the trend towards 0.6417. The Stochastic oscillator confirms this scenario, with its signal line above 80 and preparing for a decline to 20.
Are USDJPY Bulls Ready for a New Record High?
- USDJPY trades higher again, testing the October 21, 2022 high
- Last week's events have renewed the bullish pressure as intervention risk increases
- Momentum indicators support the bullish move; all eyes are on the stochastic oscillator
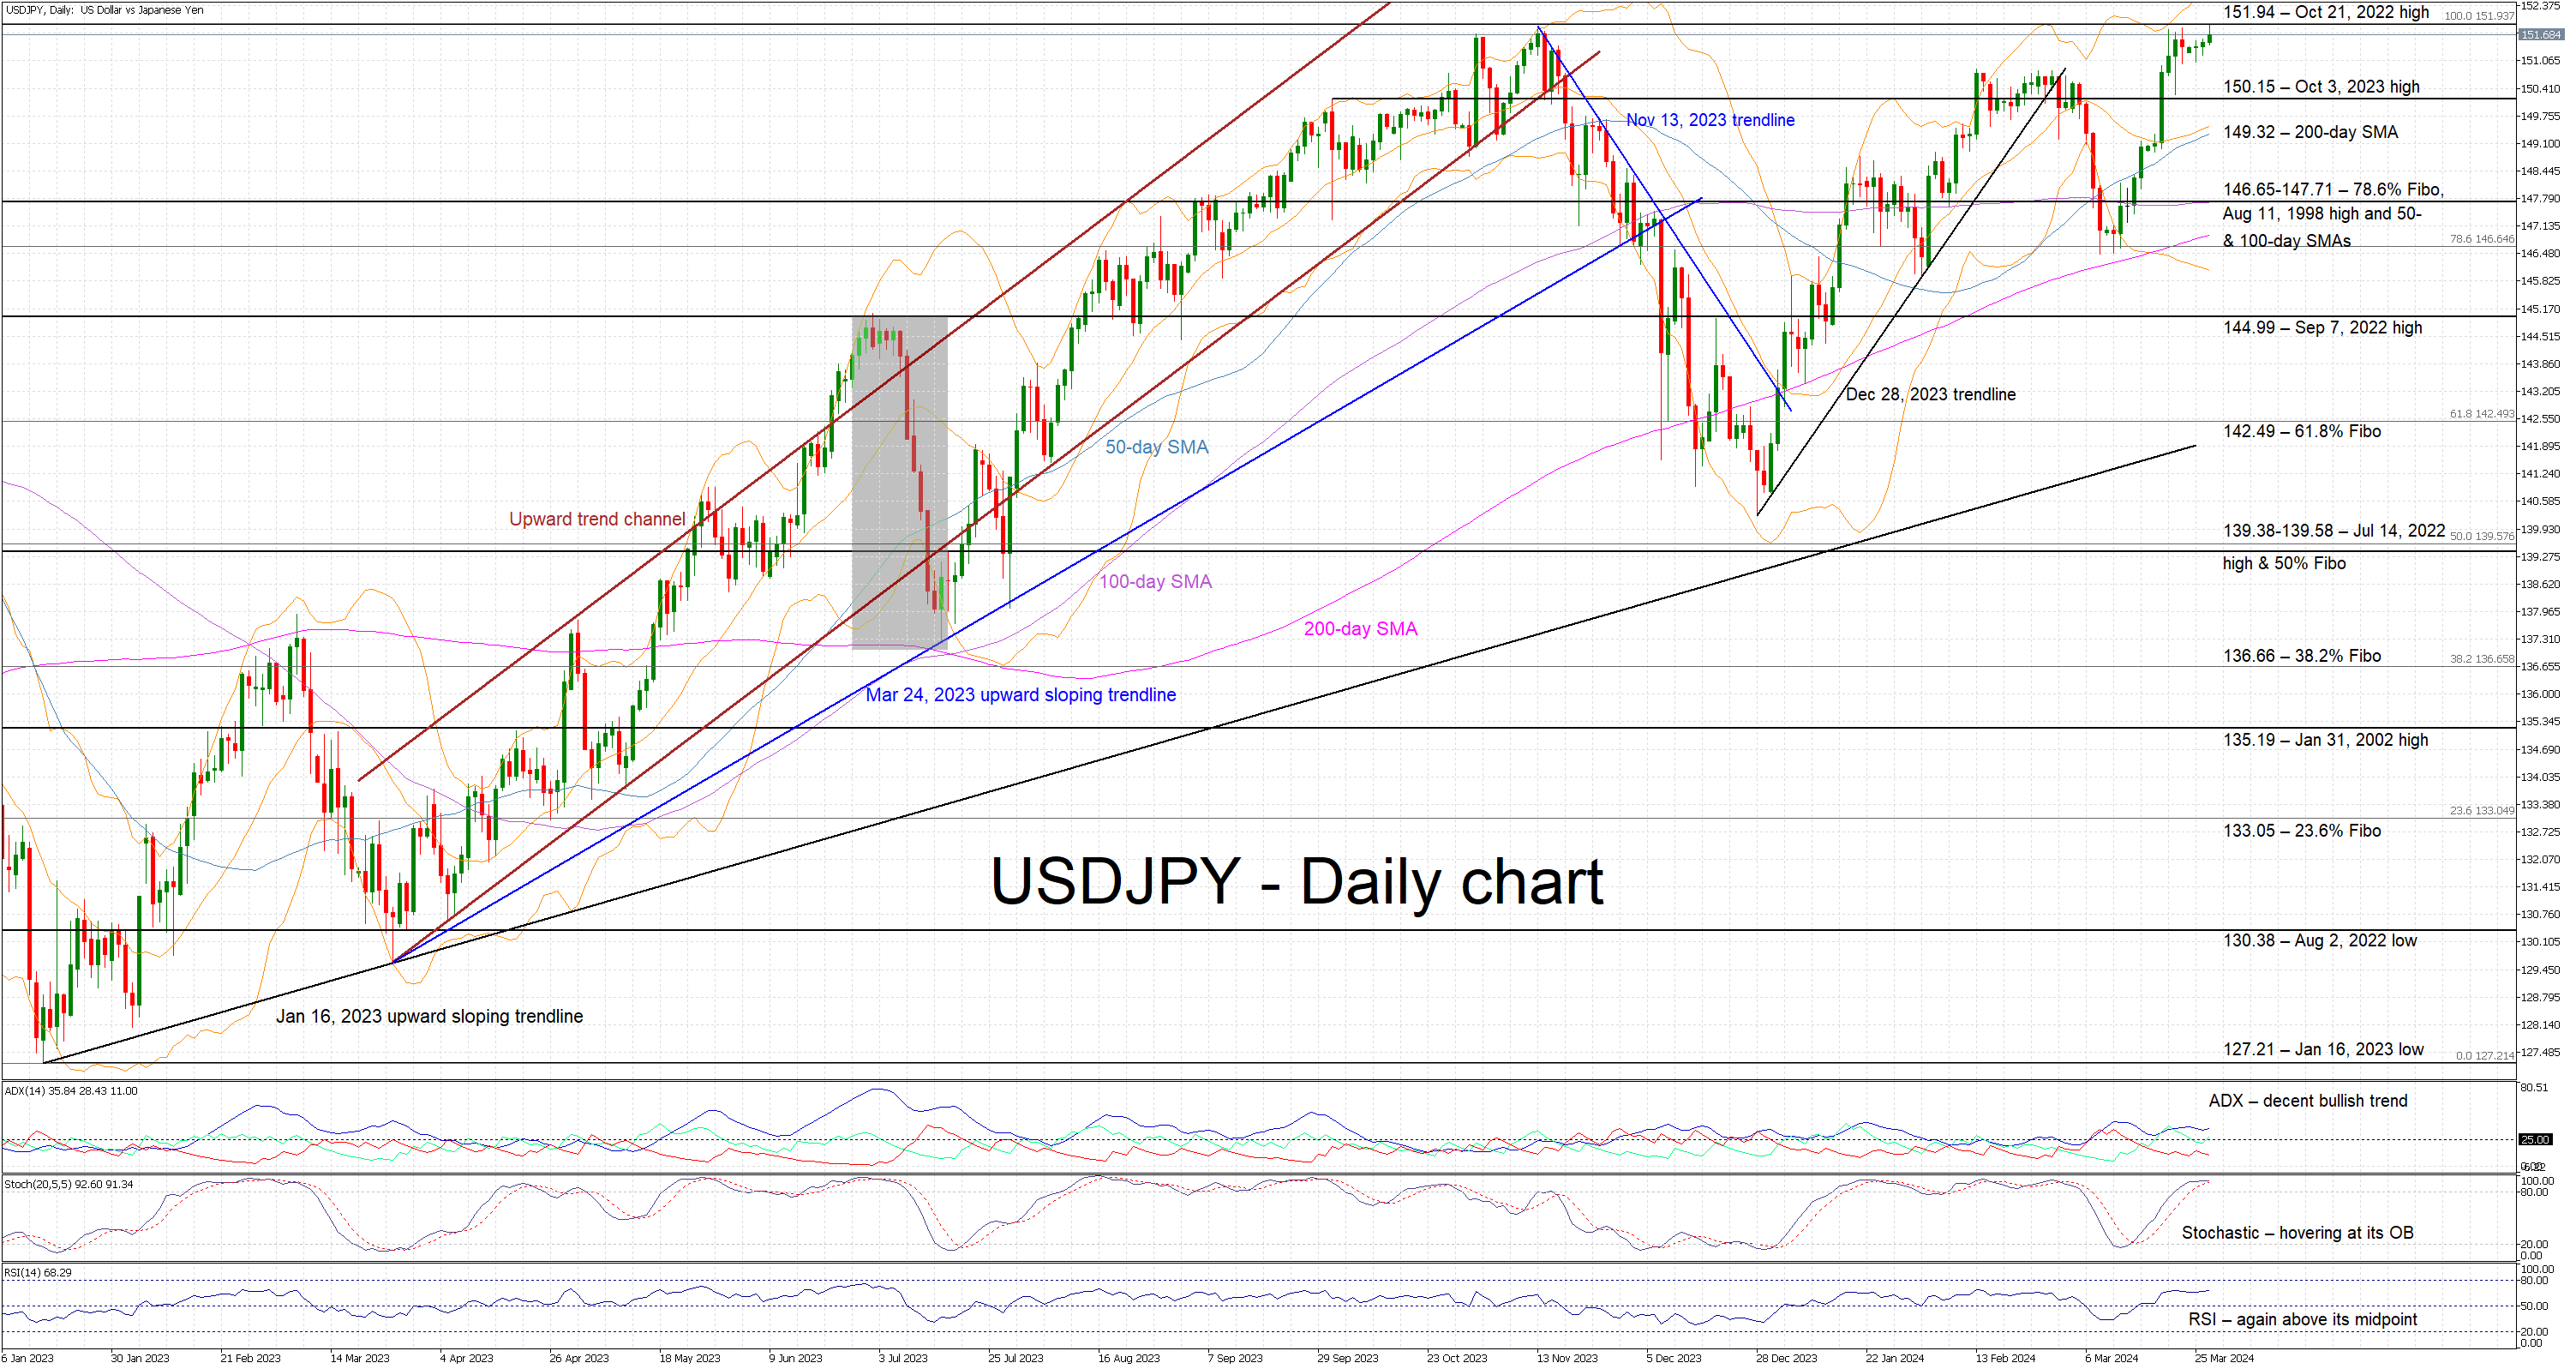
USDJPY is continuing its journey north and it is now testing the October 21, 2022 high at 151.94 as last week’s events have probably invigorated the bulls. With the USDJPY firmly above the 150 threshold, the intervention risk is rising although the Japanese authorities appear somewhat relaxed at this stage. Interestingly, lower liquidity this week due to the Easter break could offer a short-term breather to JPY.
In the meantime, the momentum indicators remain mostly supportive of the current rally. More specifically, the Average Directional Movement Index (ADX) is trading sideways, above the 25 threshold, and thus signalling a weak bullish trend in USDJPY. Similarly, the RSI is comfortably above its 50-midpoint, but it appears unable to record a higher high. More importantly, the stochastic oscillator is hovering inside its overbought (OB) territory. It can stay there for a while before attempting a break below both its moving average and OB area.
Should the bulls remain confident, they could try to lead USDJPY above October 21, 2022 high at 151.94 and record a new 34-year high. The next plausible target could be at the 155 area which will most likely provoke stronger commentary from Japanese officials and increase the chance for an actual market intervention.
On the flip side, the bears are keen to retake market control and push USDJPY back below the October 3, 2023 high at 150.15 and towards the 200-day simple moving average (SMA) at 149.32. If successful, they could then have a go at testing the support set by the much busier and more important 146.65-147.71 range. This is populated by the 78.6% Fibonacci retracement of the October 21, 2022 - January 16, 2023 downtrend, the August 11, 1998 high, and the 50- and 100-day SMAs. Hence, a move below this range could prove significant from a momentum perspective.
To sum up, USDJPY bulls are vying for a new higher high amidst lower liquidity and without provoking a strong response from the Japanese authorities.
Will EURJPY Re-Test 16-Year High Soon?
- EURJPY rebounds off 163.30, holding above rising trend line
- Bullish bias in longer-term timeframes
- But MACD and RSI loses momentum in near term
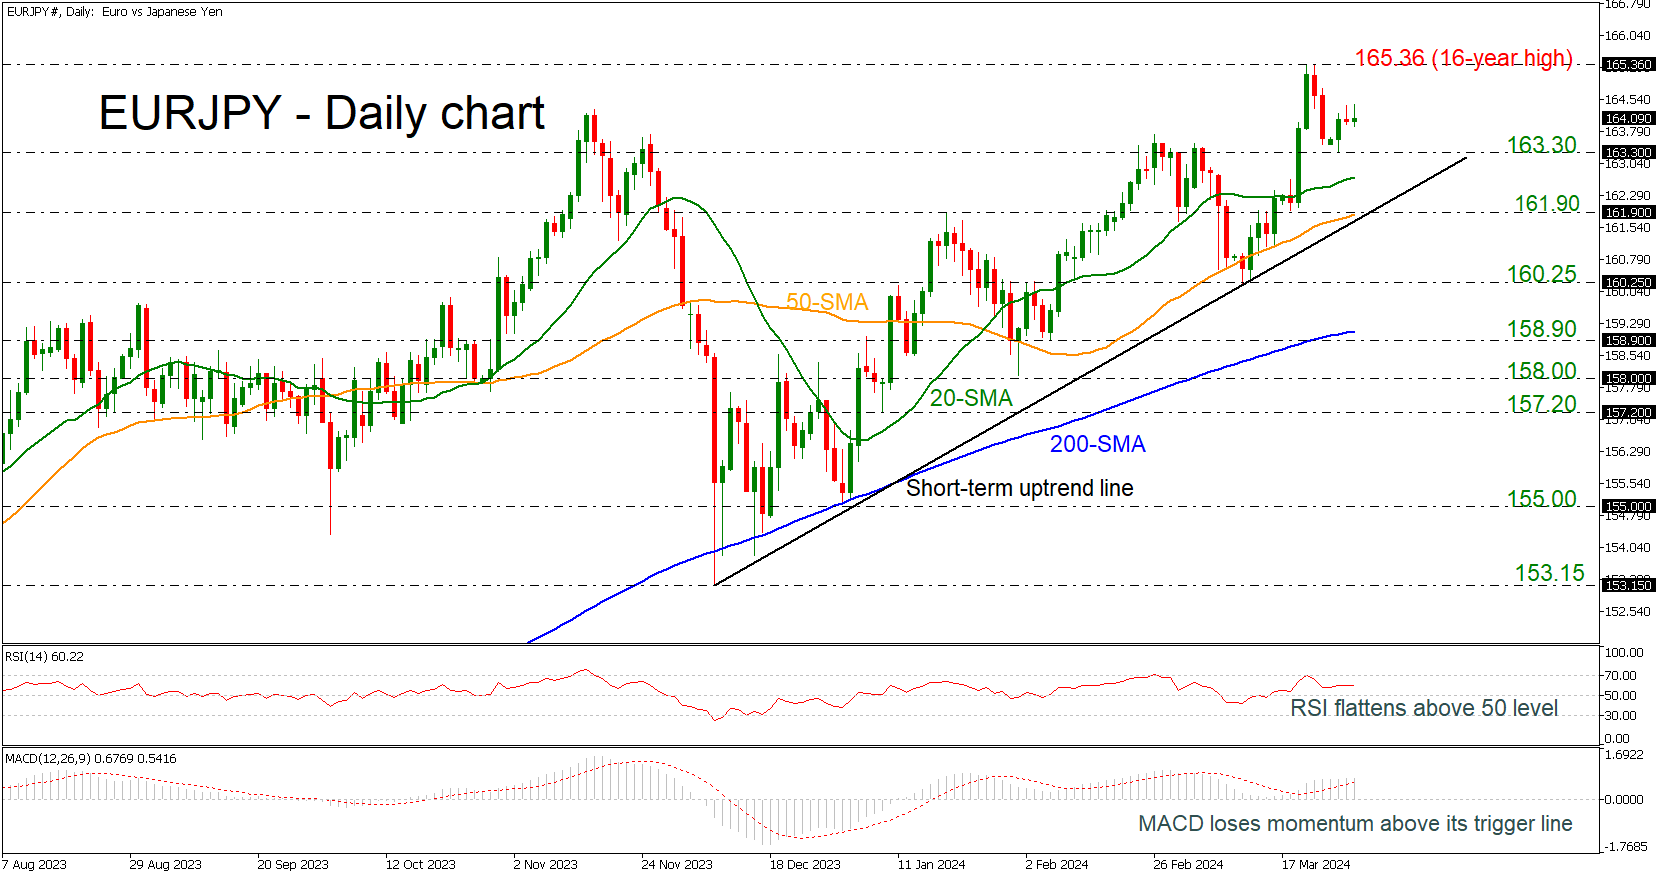
EURJPY found support at the 163.30 barrier and is moving again towards the 16-year high of 165.36 that was recorded on March 20.
The pair has been remaining in an upward tendency since December 7, but the technical oscillators are indicating weakening bias. The RSI is flattening above the neutral threshold of 50, while the MACD is losing some steam above its trigger and zero lines.
In the wake of negative pressures, the market could meet immediate support at 163.30 before it heads lower to the 20-day simple moving average (SMA) at 162.73. A successful move below this level could see a retest of the previous low of 161.90, which overlaps with the 50-day SMA and the short-term uptrend line. In case of steeper declines, the pair could breach this trough, diving to 160.25, which used to provide support on March 11.
On the flip side, a move to the upside could see immediate resistance at the multi-year high of 165.36 before travelling towards the July 2007 peak at 169.00, but traders should also be cautious near the psychological level of 166.00, 167.00 and 168.00 first.
Turning to the long and medium-term pictures, the market seems to be in a strong bullish mode. Zooming into the near-term outlook a neutral outlook could be placed only if there is break of the 200-day SMA at 159.10.
GBP/USD Dives While USD/CAD Gains Bullish Pace
GBP/USD declined below the 1.2665 support zone. USD/CAD is rising and might aim for more gains above the 1.3610 resistance.
Important Takeaways for GBP/USD and USD/CAD Analysis Today
- The British Pound started a fresh decline from the 1.2800 resistance zone.
- There was a break below a key rising channel with support at 1.2630 on the hourly chart of GBP/USD at FXOpen.
- USD/CAD is showing positive signs above the 1.3555 support zone.
- There was a break above a major bearish trend line with resistance near 1.3575 on the hourly chart at FXOpen.
GBP/USD Technical Analysis
On the hourly chart of GBP/USD at FXOpen, the pair started a fresh decline from the 1.2800 zone. The British Pound traded below the 1.2690 support to move into further a bearish zone against the US Dollar.
The pair even traded below 1.2665 and the 50-hour simple moving average. Finally, the bulls appeared near the 1.2580 level. A low was formed at 1.2575 and the pair recently attempted a recovery wave. The pair climbed above the 1.2600 level.
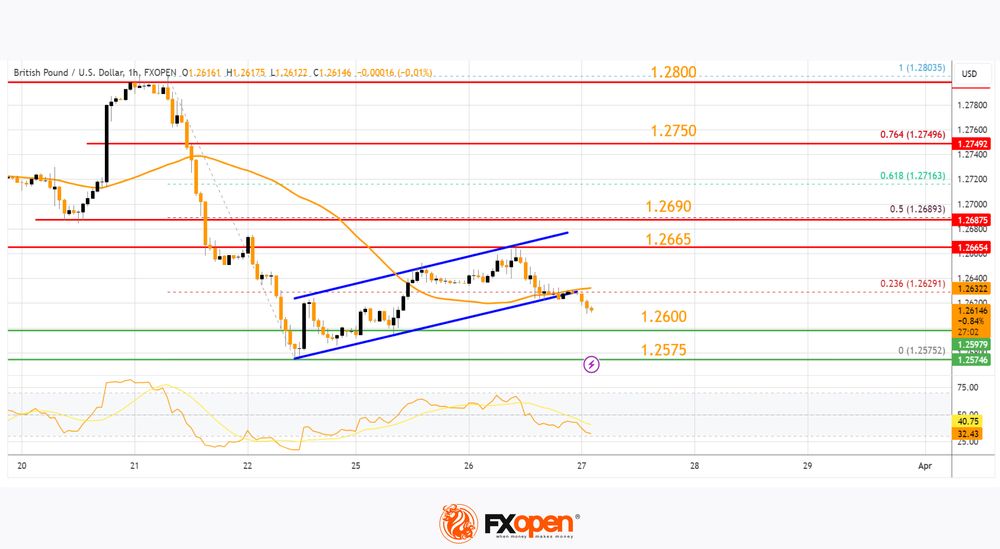
It cleared the 23.6% Fib retracement level of the downward move from the 1.2803 swing high to the 1.2575 low. However, the bears were active near 1.2665 and pushed the pair lower again.
There was a break below a key rising channel with support at 1.2630. Initial support on the GBP/USD chart sits at 1.2600. The next major support sits at 1.2575, below which there is a risk of another sharp decline. In the stated case, the pair could drop toward 1.2500.
Immediate resistance on the upside is near the 1.2665 level. The first major resistance is near the 50% Fib retracement level of the downward move from the 1.2803 swing high to the 1.2575 low at 1.2690.
A close above the 1.2690 resistance might spark a steady upward move. The next major resistance is near the 1.2750. Any more gains could lead the pair toward the 1.2800 resistance in the near term.
USD/CAD Technical Analysis
On the hourly chart of USD/CAD at FXOpen, the pair formed a strong support base above the 1.3445 level. The US Dollar started a fresh increase above the 1.3515 resistance against the Canadian Dollar.
The bulls pushed the pair above the 50% Fib retracement level of the main decline from the 1.3613 swing high to the 1.3552 low. There was a break above a major bearish trend line with resistance near 1.3575.
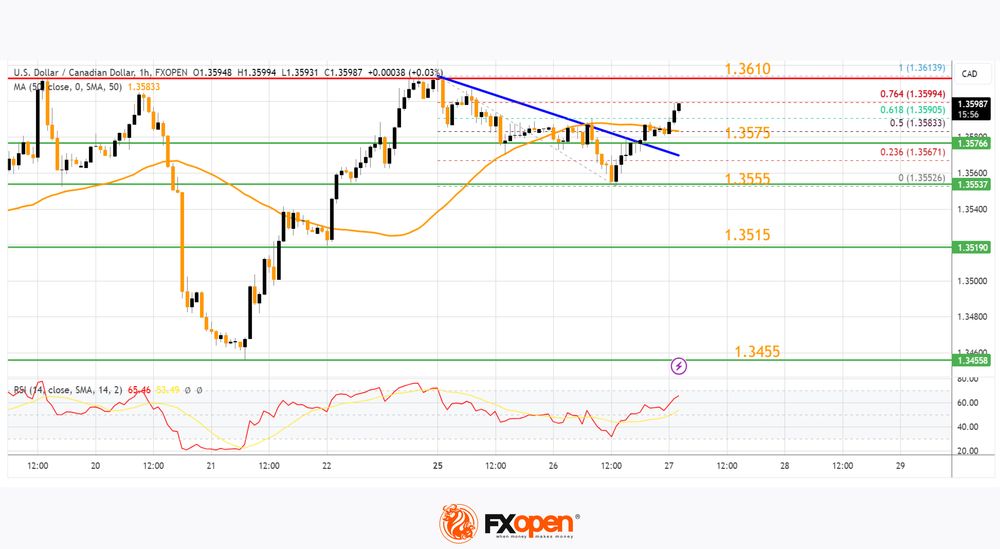
The pair cleared the 50-hour simple moving average and climbed above 1.3590. It is now consolidating near the 76.4% Fib retracement level of the main decline from the 1.3613 swing high to the 1.3552 low. Initial resistance sits near the 1.3610 zone.
A clear upside break above 1.3610 could start another steady increase. The next major resistance is the 1.3640 level. A close above the 1.3640 level might send the pair toward the 1.3700 level. Any more gains could open the doors for a test of the 1.3750 level.
Initial support is near the 50-hour simple moving average and 1.3575. The next major support is near 1.3555 on the same USD/CAD chart.
The main support sits near 1.3515. A downside break below the 1.3515 level could push the pair further lower. The next major support is near the 1.3455 support zone, below which the pair might visit 1.3400.
Trade over 50 forex markets 24 hours a day with FXOpen. Take advantage of low commissions, deep liquidity, and spreads from 0.0 pips. Open your FXOpen account now or learn more about trading forex with FXOpen.
This article represents the opinion of the Companies operating under the FXOpen brand only. It is not to be construed as an offer, solicitation, or recommendation with respect to products and services provided by the Companies operating under the FXOpen brand, nor is it to be considered financial advice.
Further Yen Losses Avoided as Fin Min Suzuki Warned
Markets
Quite a long series of US data (including consumer confidence, house price data, durable goods orders and regional business sentiment) yesterday failed to provide any clear directional guidance for US and broader markets trading. US and German yields lost 1-2 bps across the curve. This low volatility environment initially supported a further upward drift in equities, but US indices surrendered in the final hour of trading. The S&P 500 closed 0.28% lower. The Eurostoxx 50 still finished in green (+0.40%) at a multi-year top. The dollar overcame initial softness, but the move already occurred before the correction in US equities. DXY closed at 104.30. EUR/USD intraday filled offers above 1.086, but closed at 1.083. The dollar outperformed the yen despite ongoing interventions warnings from Japanese officials (close 151.56).
In central Europe, the forint drew some comfort as the Hungarian central bank (MNB) scaled back the pace of rate cuts from 100 bps in February to 75 bps yesterday (to 8.25%). The MNB downwardly revised its 2024 inflation outlook to a range of 3.5%-5.0%. However, financial stability issues make the MNB to follow a careful approach. Vice governor Virag at the press conference even indicated that MNB policy entered a new phase due to market risks. Virag signaled a further slowing of the pace of rate cuts in Q2. The forint strengthened from levels close to EUR/HUF 397 yesterday morning to close near EUR/HUF 395.5.
This morning Asian equities are trading mixed with China underperforming and Japan outperforming. The Nikkei (+0.9%) just missed a new record close. The yen touched the weakest level against the dollar since 1990, but the USD/JPY 152 barriers survives. BOJ member Naoki Tamura advocated slow but steady further policy normalization. However, these comments didn’t change market perception that conditions will remain loose for quite some time to come, keeping the yen in the defensive. Further yen losses were avoided as Fin Min Suzuki warned that they are watching market moves with a high sense of urgency and that they will take bold measures against excessive moves. Intervention fears pushed USD/JPY back to the 151.7 area. However, ‘hard money’ is probably needed to give the yen some real breathing space. Later today, there are no important data in the US. In Europe confidence data from the European Commission will be published and Spanish inflation data might give a first glimpse of the EMU March inflation dynamics. The Swedish Riksbank is expected to leave its policy rate unchanged, but markets will look out how strongly it reconfirms guidance on a possible rate cut already in H1. In core US and EMU yield markets we expect more technical trading ahead of additional EMU national inflation data tomorrow and the US PCE deflators on Friday. EUR/USD still is at risk of losing the 1.0796 support area.
News & Views
Australia’s monthly CPI indicator rose 3.4% y/y in February. Prices have been rising at that pace for three consecutive months now. Excluding volatile items including fuel, fruit and vegetables, a core gauge rose 3.9%, down from 4.1%. The Australian Bureau of Statistics singled out housing (4.6%), food (3.6%), alcohol and tobacco (6.1%) and insurance & financial services (8.4%) as the most significant contributors. Within housing, rents increased by 7.6%. The acceleration from 7.4% in January reflects a tight rental market and low vacancy rates across the country. Food price rises were the slowest (annually) since January 2022 amid falling prices in meat and seafood as well as fruit and vegetables. Holiday travel and accommodation prices eased 1.3% y/y. The Australian dollar fell marginally as the 3.4% outcome defied market expectations for a minor uptick to 3.5%. But AUD/USD soon recovered, trading virtually unchanged around 0.653.
Cocoa prices topped $10 000 per ton for the first time ever yesterday. Prices have been steadily rising since 2023 and hovered just north of $4000 at the beginning of the year. The meteoric rise in just two months finds its roots in poor harvests from key African producers. Bad weather and old, decaying trees suffering from disease have slashed crop yields in Ivory Coast and Ghana, which together cover more than two-thirds of the world output. The price surge is likely to have been exacerbated by a short squeeze as well.
Dollar Pushes Higher as S&P 500 Set for 5th Monthly Gain
Yesterday was a slow day in terms of data and information flow and a strong day in terms of meme trading and speculation, as Donald Trump’s Truth Social flew with its own wings for the first time yesterday, following last week’s successful merger with DWAC. Trump’s Media and Technology Group rose up to 60% under the ticker DJT before settling 16% higher at the end of the session, giving the day traders a nice swing. Reddit also saw some nice intraday volatility. The mother of meme stocks GME, is also showing signs of life since the beginning of this week, but that appetite will likely rapidly fade after the share price tanked 15% in the afterhours trading, after an earnings and revenue missed.
Appetite for meme stocks and cryptocurrencies is back and that’s an important gauge for overall risk appetite. Traders are confident in the upcoming rate cuts. Robust US growth doesn’t scare as long as inflation continues to ease. And even the recent rise in inflation doesn’t concern much as it is believed to be temporary.
As such, the Fed is expected to cut rates in June for the first time, yesterday’s 5-year bond auction in the US saw strong demand and the S&P500 retreated slightly from an ATH. The collapse of the Baltimore bridge dampened the mood for some companies that will see their trade routes distorted. The most concerned are automakers; transport of coal, gasoline and grains will also be disturbed.
But if all goes well, the S&P 500 is set to print a fifth consecutive monthly gain – a thing that has not happened since 2013. The major risks to the rally is a renewed pullback of Federal Reserve (Fed) cut expectations and/or a possible deterioration in earnings expectations. What’s also interesting regarding the Fed’s rate cut expectations is that, the expectation of 3 rate cuts is intact, but if and only if the first rate cut happens by summer. Many investors think that if the Fed doesn’t cut by June or July, there won’t be any cut this year. So, it’s 3 cuts or none. In the base case scenario of 3 cuts, the stock rally is expected to broaden beyond technology, the S&P500 equal index is expected to catch up with the normal weighted index, interest should also broaden in favour of small and mid-cap stocks, and commodities like gold, copper and oil.
US crude is under pressure this morning as the API report printed a surprise 9.3-mio increase in US oil inventories last week. The expectation was a 1.2-mio decrease and the official EIA data is due today. But buyers are seen into $80pb level as the growing excitation of rate cuts from the major central banks give support to the oil bulls right now.
Elsewhere, bad news continued to flow in for Apple. This time it’s about the company’s iPhone sales in China which plunged 33% in February compared to a year earlier and an insider denied the speculated collaboration between Apple and Baidu – which could’ve been a certain boost to the company’s China sales. Price-wise, Apple slid to close below the $170 per share yesterday, the share price stepped into the medium term bearish consolidation zone after having slipped below the major 38.2% Fibonacci retracement on the 2023 rally. There is a greater chance that we see a further slide in Apple than the contrary. Apple will reveal its AI strategy on June 10. Until then, investors will remain skeptical regarding how the company will make AI a priority.
Finally a quick recap for the FX. The dollar index pushes higher due to mounting edginess before Friday’s core PCE print and the fact that most Western traders will be off to their Easter holiday to hunt for expensive chocolate bunnies. Therefore traders are preparing for a potential bad surprise in advance. The USDJPY is testing the Japanese officials’ limits near the 152 level, as the EURUSD is softer before Spanish inflation and Eurozone sentiment data. Inflation in Spain is seen higher for March, a hotter-than-expected figure could slow the euro’s weakness against the greenback but will unlikely derail the expectation of a June cut for the European Central Bank (ECB). Across the Channel, Cable is under pressure as well on the back of growing dovish Bank of England (BoE) bets. But the direction in most major peers depends on the US dollar’s trajectory. And that’s on Friday’s PCE data’s shoulders.
GBP/JPY Daily Outlook
Daily Pivots: (S1) 191.09; (P) 191.39; (R1) 191.67; More.....
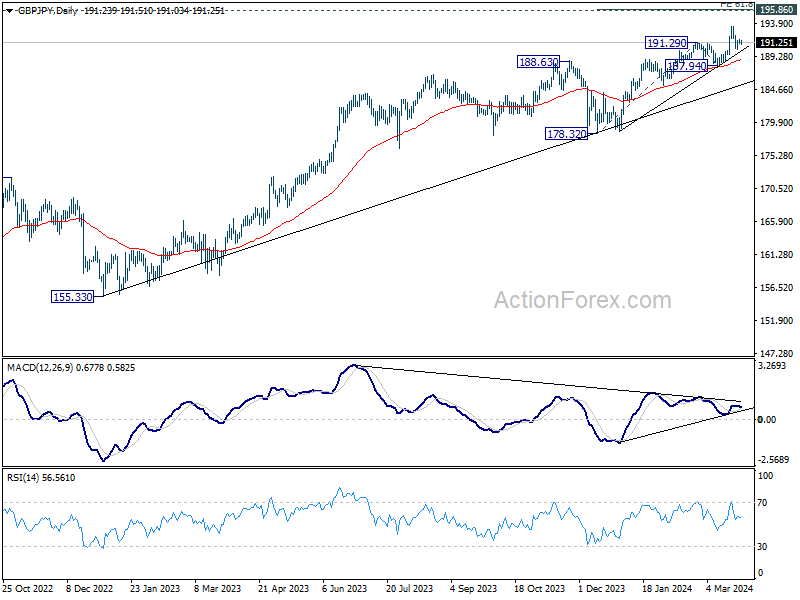
Intraday bias in GBP/JPY remains neutral for the moment. More consolidations could be seen but outlook will stay bullish as long as 187.94 support holds. On the upside, break of 193.51 will resume larger up trend to 61.8% projection of 178.32 to 191.29 from 187.94 at 195.95, which is close to 195.86 long term resistance.
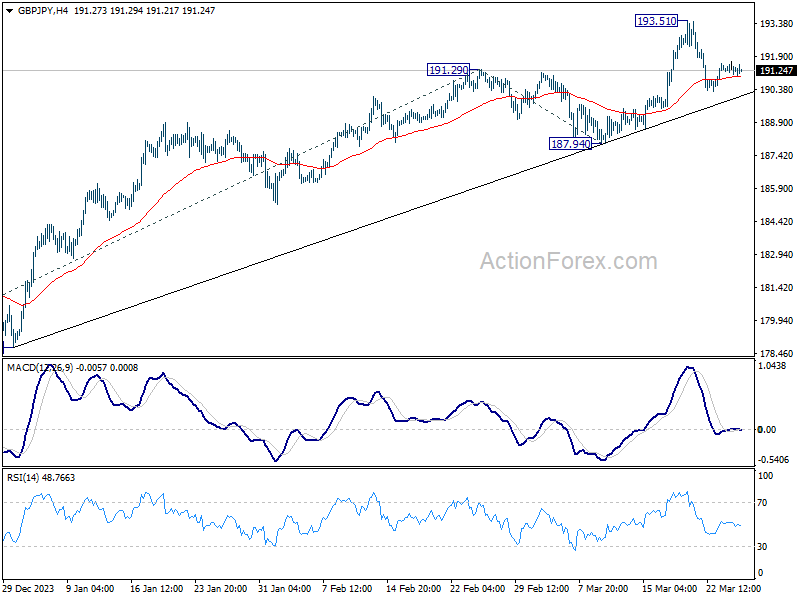
In the bigger picture, current rally is part of the up trend from 123.94 (2020 low), and is in progress for long term resistance (2015 high). Break of 187.94 support is needed to be the first sign of medium term topping. Otherwise, outlook will remain bullish in case of retreat.
EUR/JPY Daily Outlook
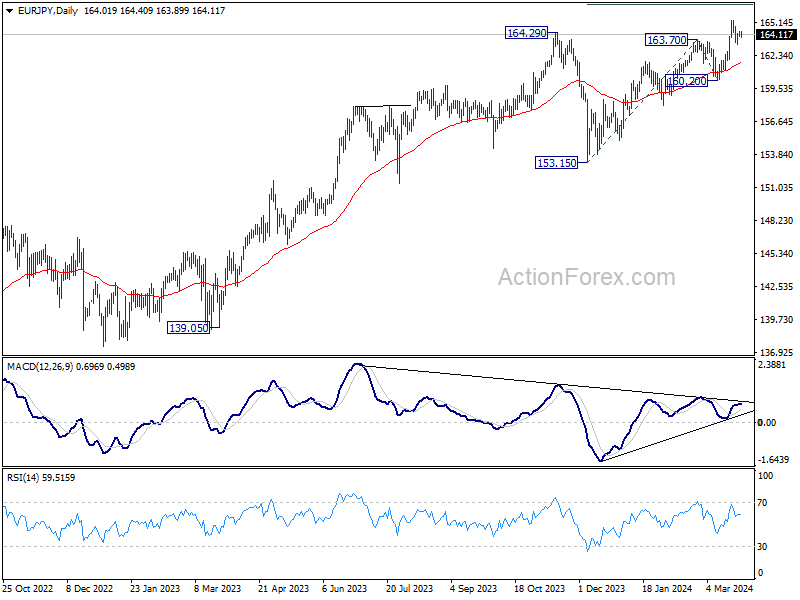
Daily Pivots: (S1) 163.94; (P) 164.17; (R1) 164.39; More...
Intraday bias in EUR/JPY remains neutral for consolidations below 165.33. Downside of current retreat should be contained by 55 4H EMA (now at 163.57) to bring rebound. On the upside, break of 165.33 will resume larger up trend to 61.8% projection of 153.15 to 163.70 from 160.20 at 166.71. However, sustained break of 55 4H EMA will turn bias to the downside for deeper fall to 160.20 support instead.
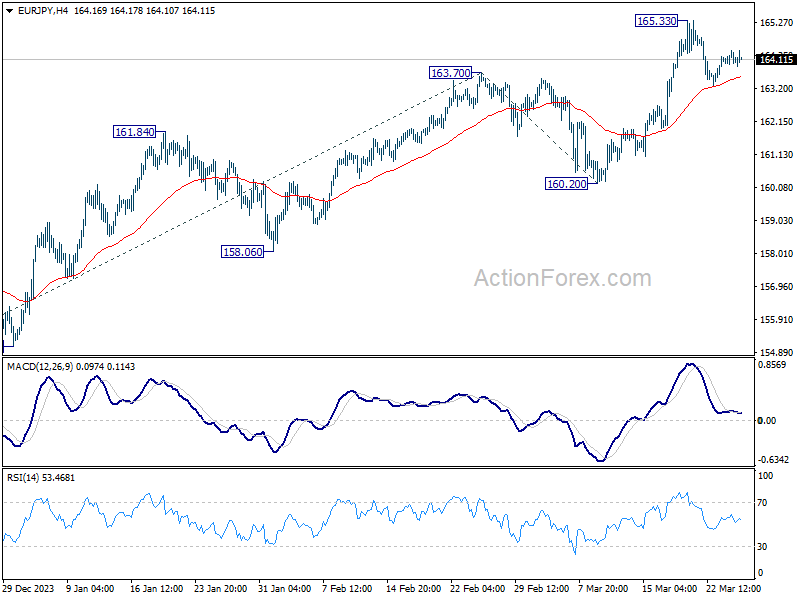
In the bigger picture, current rally is part of the up trend from 114.42 (2020 low), which is still in progress. Next target is 169.96 (2008 high). Break of 160.20 support is needed to be the first sign of medium term topping. Otherwise, outlook will stay bullish in case of retreat.