Sample Category Title
BoJ opinions: Board emphasizes caution in historic shift away from negative rate
At last week's policy meeting, which marked the conclusion of Japan's extensive easing program and its first interest rate hike since 2007, BoJ board members underscored the importance of a cautious approach. The Summary of Opinions from this pivotal gathering highlighted board members' perspectives on the delicate balance required in this new phase of monetary policy.
One member stressed the necessity of maintaining a "cautious stance", especially in light of ending the negative interest rate policy, pointing out that "Japan's economy is not in a state where rapid policy interest rate hikes are necessary."
Furthermore, clarity and communication were emphasized as crucial elements in this transitional period. "It is important to clearly communicate through the use of various methods that the changes in the monetary policy framework proposed at this monetary policy meeting will not be a regime shift toward monetary tightening," another member articulated.
The summary also conveyed concerns about the potential impact of premature expectations on Japan's economic stability. A member warned of the risks associated with policy changes sparking speculative expectations misaligned with economic fundamentals, which could inadvertently destabilize financial conditions. Such volatility could "dampen the momentum of the virtuous cycle operating in Japan's economy and delay the achievement of the inflation target."
Fed’s Waller: Latest data confirm no rush for interest rate cuts
In a speech overnight, Fed Governor Christopher Waller articulated that Fed is in "no rush" to initiate interest rate cuts. This position comes in light of recent economic developments, suggesting that interest rates may need to be maintained at their current restrictive levels "longer than previously thought."
Waller acknowledged the significant strides made in curbing inflation last year and the substantial improvement in labor market balance. Yet, he expressed reservations about the pace of continued progress, stating, "the data we have received so far this year has made me uncertain about the speed of continued progress."
This uncertainty has been fueled by economic indicators over the past month, with Waller highlighting February's robust job growth of 275k and a three-month average job growth of 265k, alongside persistently high inflation metrics.
Particularly concerning to Waller is a notable jump in Core PCE inflation to 0.4% on a monthly basis in January, a significant increase from an average of around 0.1% in the fourth quarter. These observations have solidified Waller's belief that there is "no rush to cut the policy rate," advocating for a continuation of the Fed's current restrictive stance, "for longer than previously thought."
Waller remains optimistic about making further progress towards disinflation, which could eventually justify a reduction in the federal funds rate target range within the year. But he asserts "until that progress materializes, I am not ready to take that step."
SNB Schlegel: No target for Franc exchange rate, intervenes as necessary
SNB Vice President, Martin Schlegel, clarified overnight that the central bank does not adhere to a specific target for Swiss Franc's exchange rate. Instead, Schlegel reiterated the usual stance that the bank "monitors the exchange rate closely and intervenes in the foreign-exchange market as necessary."
Separately, in its Quarterly Bulletin, SNB noted that "Many economic indicators suggest that economic activity was slightly more dynamic in the first quarter of 2024 than in the preceding quarters."
The report attributed this "moderate" growth primarily to the service sector's resilience, while highlighting continued stagnation in the manufacturing sector. SNB acknowledged that "persistently weak global demand" remains a significant hurdle for manufacturing, with Swiss Franc's exchange rate increasingly being cited by companies as a contributing challenge.
CAD: Markets Await GDP Release
During the Asian session on Wednesday, the USDCAD pair rebounded after two days of losses, reaching around 1.3590. This uptick is fueled by a stronger US dollar and lower crude oil prices, which put pressure on the Canadian dollar. The decline in Western Texas Intermediate (WTI) oil prices to approximately $80.70 is attributed to a surplus in API Weekly Crude Oil Stock, indicating an oversupply. Bank of Canada (BoC) Senior Deputy Governor Carolyn Rogers raised concerns about Canada's low productivity and highlighted inflation concerns. Meanwhile, the US Dollar Index (DXY) rose amid a risk-off sentiment ahead of the US Personal Consumption Expenditures (PCE) release, but declining US Treasury yields suggest market expectations of potential rate cuts by the US Federal Reserve.
CADJPY - H1 Timeframe
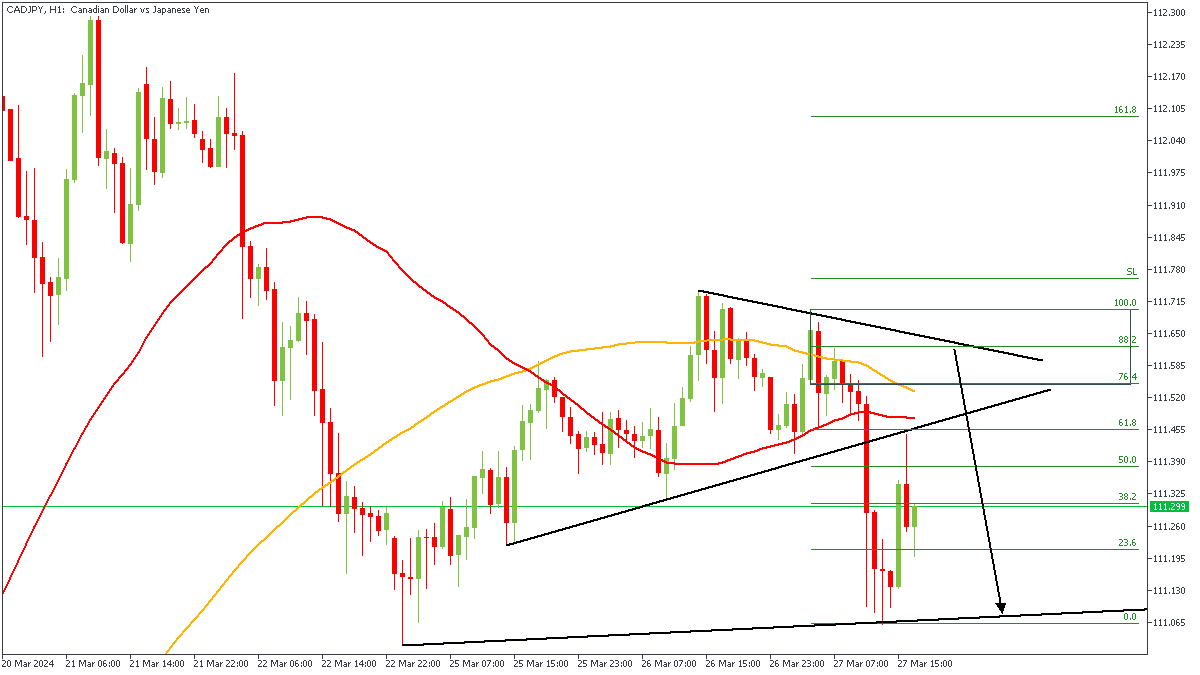
The breakout of price from the wedge pattern on the 1-hour timeframe of CADJPY can be seen to have created a break in the market structure. It is my expectation to see price complete a proper retest of the supply zone responsible for the break of structure. In line with this, the 88% of the Fibonacci retracement, bearish array of the moving averages, and the moving average resistance are my confluence for the bearish sentiment.
Analyst’s Expectations:
- Direction: Bearish
- Target: 111.232
- Invalidation: 111.712
NZDCAD - H1 Timeframe
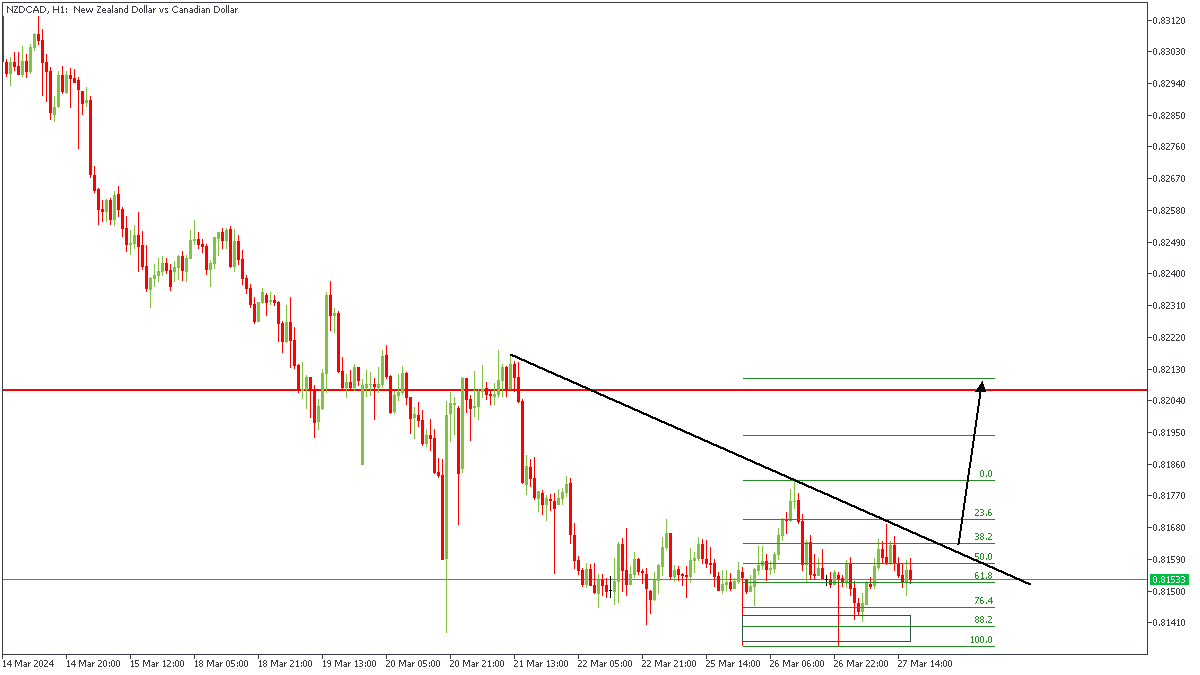
NZDCAD is currently consolidating below the trendline resistance, which indicates the likelihood of a breakout soon. Following this, I expect to see a breakout above the trendline resistance before settling for a long position on NZDCAD, in the meantime however, my fingers are crossed.
Analyst’s Expectations:
- Direction: Bullish
- Target: 0.82049
- Invalidation: 0.81457
EURCAD - H4 Timeframe
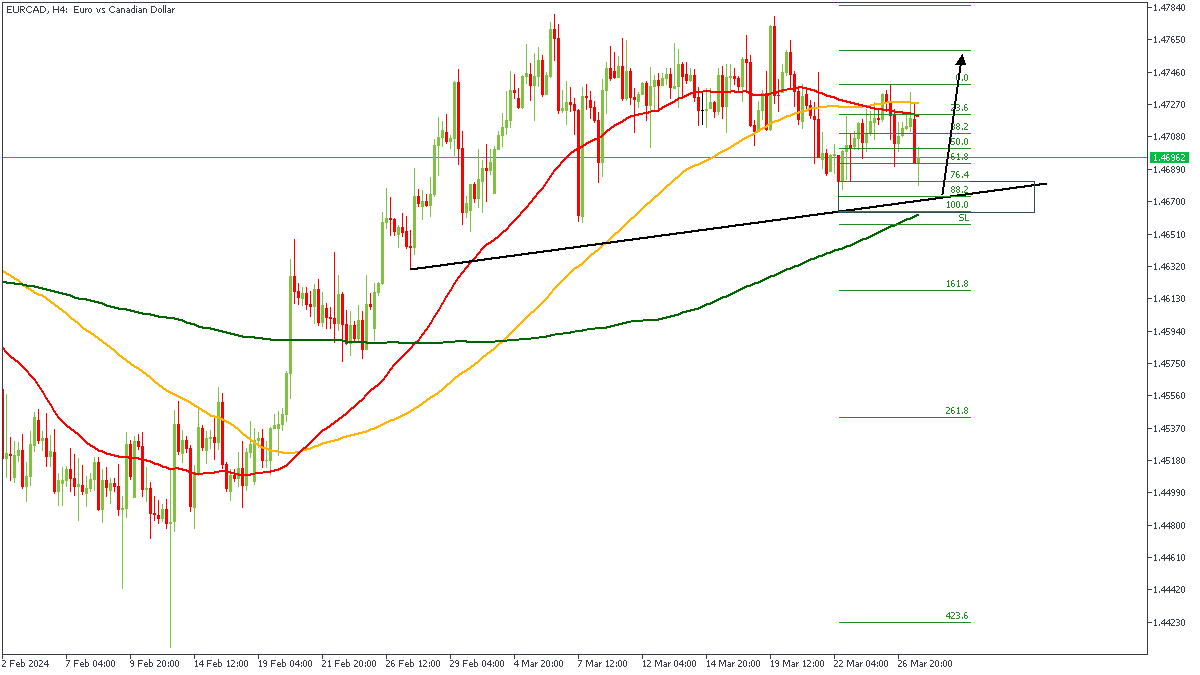
EURCAD is currently approaching a trendline support; implying the likelihood of a bullish rejection from the support line. There is also the presence of a Fibonacci retracement level, 200-period moving average support, and the demand zone as further confluences for the bullish sentiment.
Analyst’s Expectations:
- Direction: Bullish
- Target: 1.47460
- Invalidation: 1.46604
CONCLUSION
The trading of CFDs comes at a risk. Thus, to succeed, you have to manage risks properly. To avoid costly mistakes while you look to trade these opportunities, be sure to do your due diligence and manage your risk appropriately.
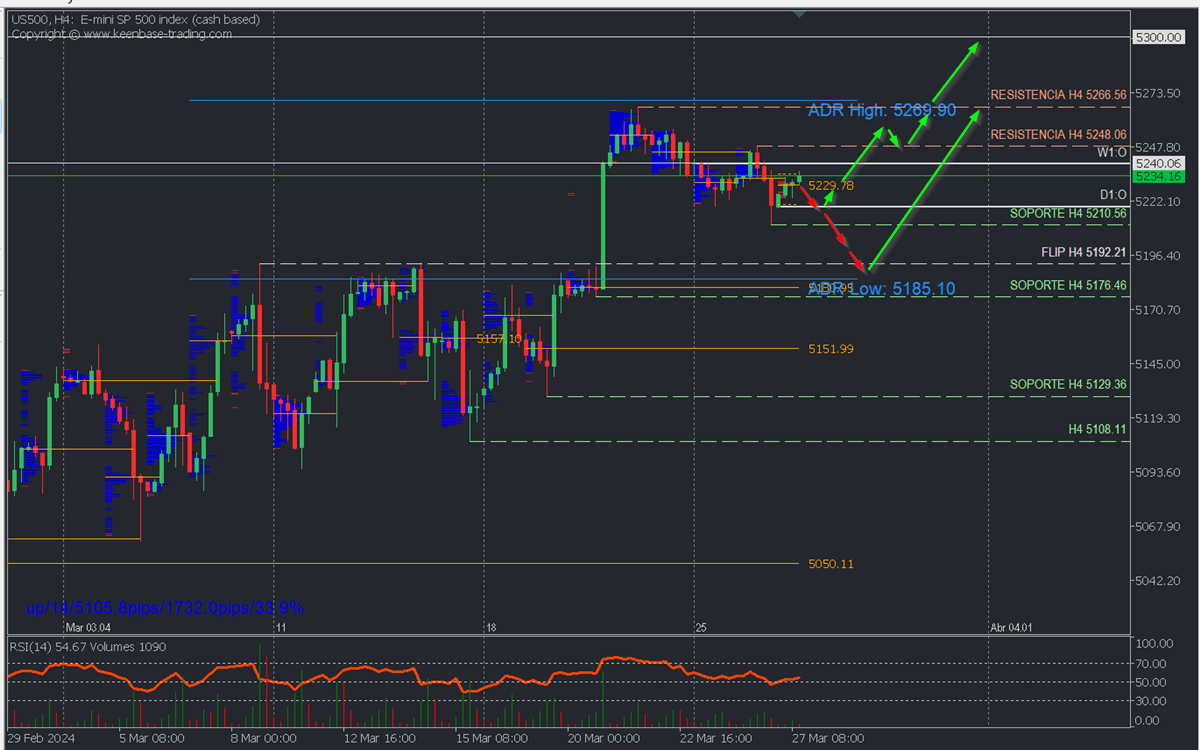
US500: Further Correction Towards 5192 Before Resuming Purchases
Bearish Scenario: Sales below 5220 with TP1: 5210 and TP2: 5192.21 with S.L. above 5248 or at least 1% of account capital*.
Bullish Scenario: Buys above 5225 (if price fails to break below decisively) with TP1: 5235, TP2: 5242, TP3: 5248, TP4: 5255, TP5: 5290, and TP6 (Swing): 5300 with S.L. below 5210 or at least 1% of account capital*. Apply trailing stop
Scenario from H4 chart:
US500 continues within a macro bullish trend and has been undergoing a corrective phase since late last week, which has covered 50% of the volume inefficiency (gap) from Wednesday after the Fed meeting.
This correction is leaving the level 5248.06 as the last relevant resistance, implying that until this level is broken with two confirming bullish moves. The price respects the last selling zone around 5233, the current correction could extend towards the flip level (resistance turned support) at 5192.21 and the buying zone around 5180 - 5185, very close to the last intraday support at 5176.46.
This decline towards the nearest buying zone from last week will activate the bulls to trigger a new price rally towards the selling zones left by the decline until they are broken to extend purchases.
On the other hand, the decisive breakout of Tuesday's buying zone at 5233 will test the weekly opening (W1:O) and the last relevant resistance at 5248.06, whose decisive breakout with a candle body or two confirming moves will renew the bullish trend-seeking to surpass last week's resistance and current all-time high at 5266.56 with a target in the coming days or weeks to reach 5300. RSI above 50 confirms the corrective scenario and bull dominance.
*Uncovered POC: POC = Point of Control: It is the level or zone where the highest volume concentration occurred. If there was a bearish movement from it previously, it is considered a selling zone and forms a resistance zone. On the contrary, if there was a bullish impulse previously, it is considered a buying zone, usually located at lows, thus forming support zones.
**Consider this risk management suggestion
**It is important that risk management be based on capital and traded volume. For this, a maximum risk of 1% of capital is recommended. It is suggested to use risk management indicators like the Easy Order.
USDJPY Eyes 1990 Highs: Intervention or Reversal?
The reversal of the Bank of Japan’s monetary policy tightening at the beginning of March not only failed to reverse, but also added to the Yen’s weakening trend. The systematic pressure on the Japanese currency raises even more questions, given that the Fed and ECB are less than three months away from widely expected rate cuts.
The USDJPY rose to 151.97 on Wednesday morning, seven pips above the November 2022 high and four pips above the October 2022 high, when intervention reversed the rate sharply. Wednesday’s high was the highest since 1990.
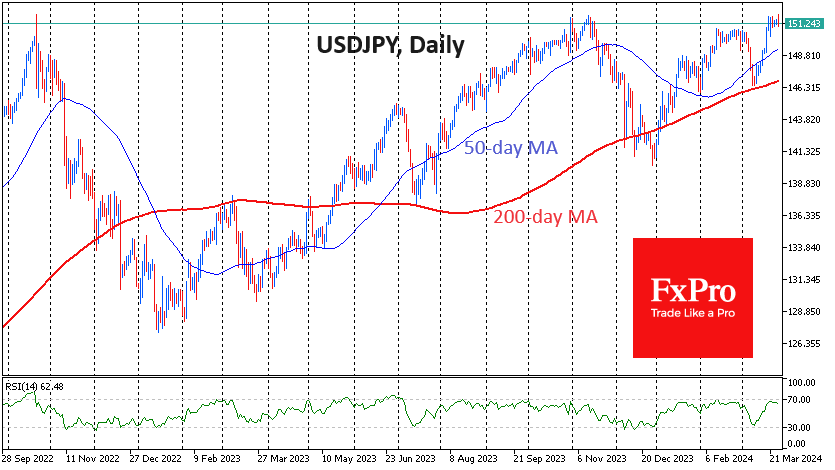
The 152 level looks like a tried and tested intervention zone to prevent the Yen from weakening. In recent days, we have heard repeated statements from government and central bank officials that there is no fundamental reason for the Yen to weaken. Such signs sound like the threat of intervention, which is dangerous for short-term speculators.
Moreover, this is the third time in two years that the Yen has approached this level. On the previous two occasions, we saw a strong and sustained reversal, and the market is close to forming a reflex against this level.
However, the bulls also have a strong argument on their side.
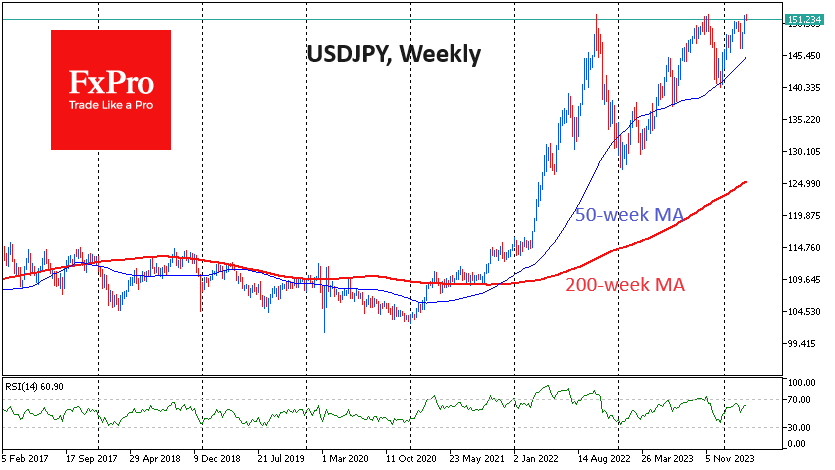
Corrections are becoming increasingly shallow. USDJPY lost 16% in three months after approaching 152 in 2022. In 2023, however, the decline was around 7.5%. At the end of February, the pair rose gently towards 151 and turned sharply lower but rallied again after a 3.5% decline.
The initial USDJPY spike in 2022 made an impressive contribution to inflation, as, at its peak, the pair was over 33% higher than a year earlier. Long-term yen volatility is falling, and inflation is on track to stabilise around the target of 2%. Therefore, it makes no sense for the Ministry of Finance and the Bank of Japan to continue making 152 a red line. We are likely to see more rhetoric and possibly more policy rate hikes in the coming months, but not as dramatic FX interventions as in 2022 or late 2023.
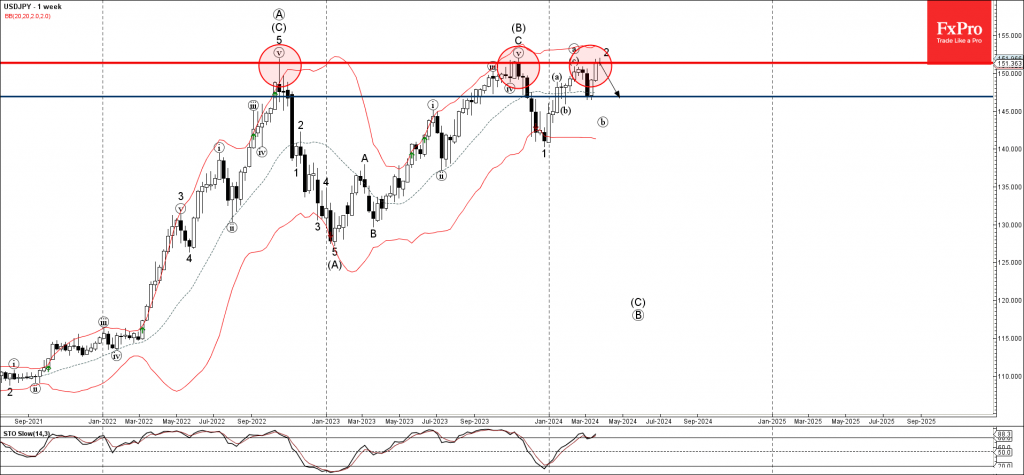
USDJPY Wave Analysis
- USDJPY reversed from multi-year resistance level 151.357
- Likely to fall to support level 146.90
USDJPY currency pair recently reversed up from the powerful multi-year resistance level 151.357 (former monthly high from 2022), standing close to the upper weekly Bollinger Band.
The downward reversal from the resistance level 151.357 stopped the previous minor corrective wave 2 of the weekly downward impulse sequence (C) from last year.
Given the still overbought weekly Stochastic, USDJPY currency pair can be expected to fall further to the next support level 146.90 (low of the previous weekly correction).
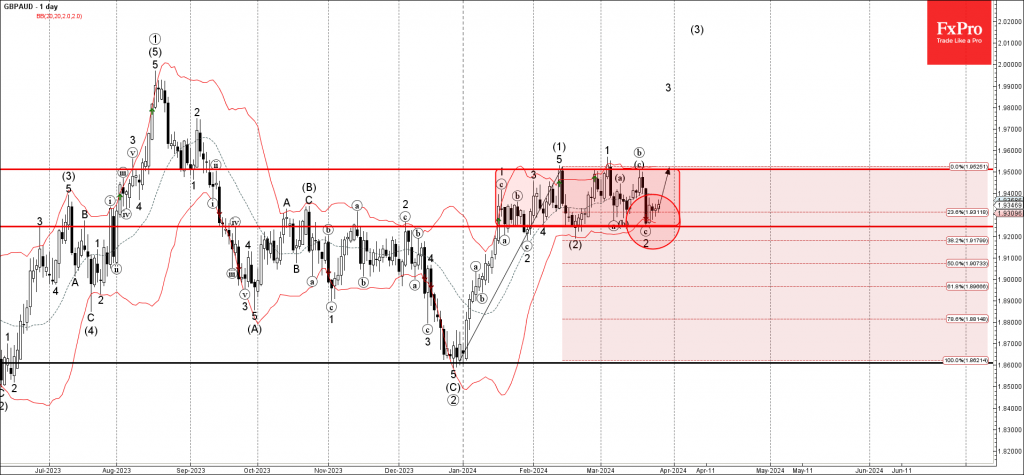
GBPAUD Wave Analysis
- GBPAUD reversed from support level 1.9245
- Likely to rise to resistance level 1.9500
GBPAUD currency pair recently reversed up from the support level 1.9245 (lower border of the narrow sideways price range from January), intersecting with lower daily Bollinger Band.
The upward reversal from the support level 1.9245 started the active minor impulse wave 3, which belongs to wave (3) from February.
Given the rising bullish sterling sentiment, GBPAUD currency pair can be expected to rise further to the next resistance level 1.9500 (upper border of the active sideways price range).
GER 40 Index Marks Highs After Highs
- German 40 index hits all-time high
- Uptrend shows ongoing strength, but a pause is likely
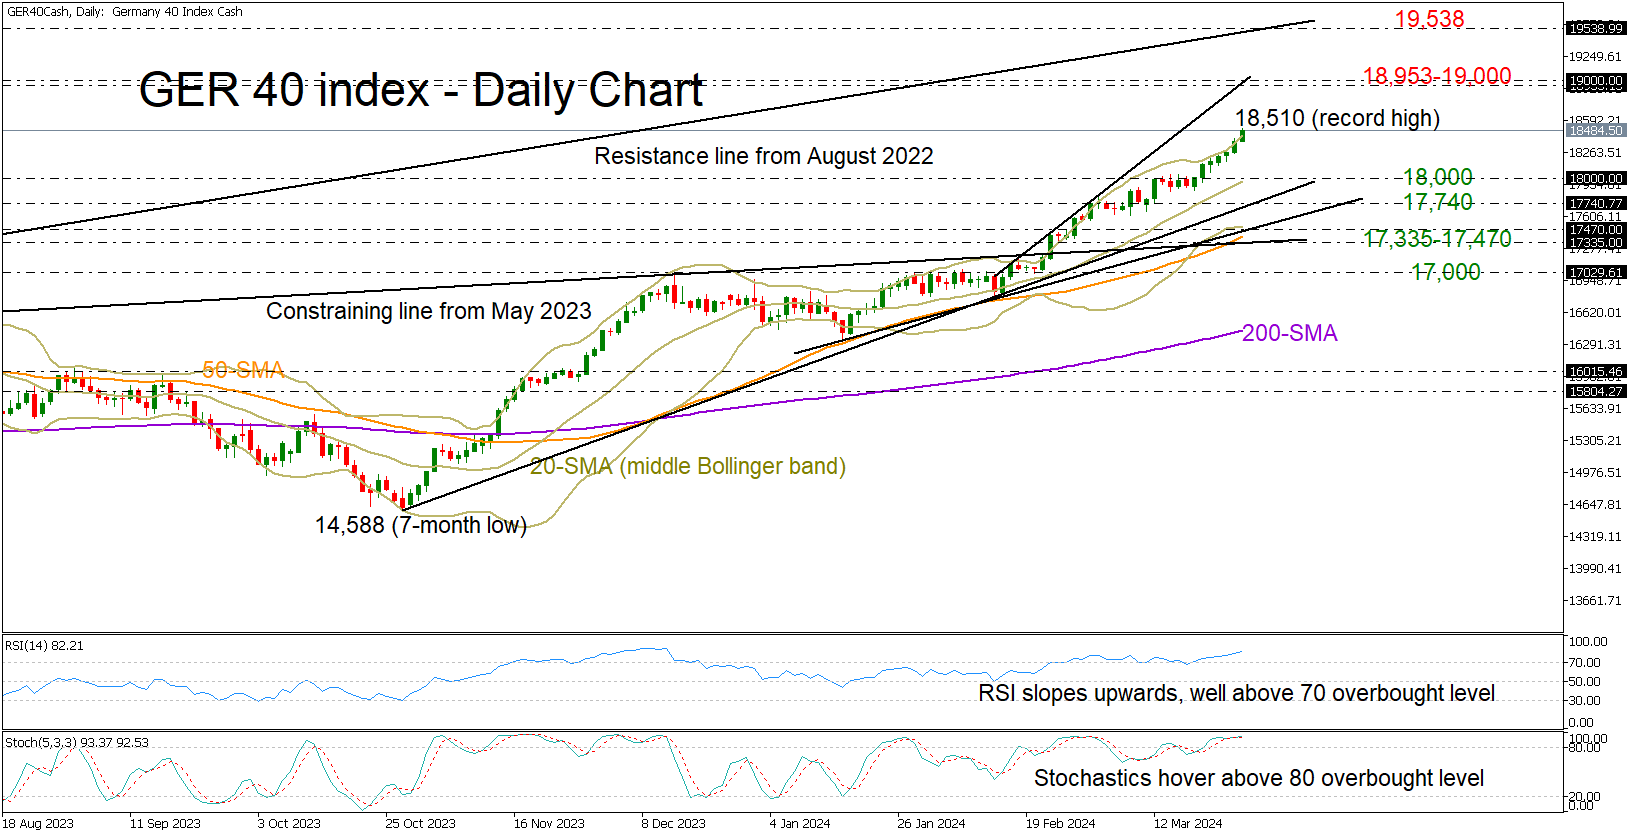
The German 40 index has been having an exceptional performance so far in 2024, gaining more than 10% to unlock an all-time high of 18,510 on Wednesday.
The ongoing positive trend has yet to show any cracks, but with the price marking its 10th consecutive green week near the upper Bollinger band and the momentum indicators pointing to overbought conditions, the bears could be around the corner.
If the rally continues, resistance could pop up within the 18,953-19,000 territory, where the ascending trendline which connects February’s and March’s highs is placed. Additional gains from there could touch the resistance trendline from August 2022.
Should downside pressures resurface, the 18,000 round mark and the 20-day simple moving average (SMA) could attempt to stop the bears ahead of the support trendline at 17,740. A correction lower could halt immediately within the 17,470-17,335 constraining area, where the 50-day SMA is placed. Yet, only a drop below the 17,000 number would neutralize the medium-term outlook.
The ascent in the German 40 index seems stable overall, but there is a possibility of profit-taking following the recent record highs.