Sample Category Title
Verbal Intervention Heighten as Yen Stumbles, Kiwi Falls on Bleak Economic Projections
Japanese Yen breached its recent low against the broadly strong Dollar in Asian session today, but the selloff halted just before reaching 152 mark. The momentum of Yen's decline appears to be cushioned by Japan's heightened verbal intervention. Finance Minister Shunichi Suzuki issued a stern warning about Yen's depreciation, warning of "decisive steps" to support the currency. This phrase was used back in Autumn 2022, marking the last instance of Japan's direct intervention in the currency market to curb Yen's slide.
BoJ Governor Kazuo Ueda, speaking to parliament, acknowledged the significant impact of currency fluctuations on the economy and pricing but maintained a cautious tone on monetary policy. His remarks lacked any hint of policy tightening plan, leaving the Yen without strong backing from policy adjustments. Ueda's only said that any future changes in monetary policy will hinge on the economic and price landscape at the time.
In the broader currency market, Swiss Franc stands out as this week's weakest performer, having already surpassed last week's lows against both Dollar and Euro. Yen is not far behind in its underperformance. Meanwhile, Dollar, despite being the third weakest for the week, shows potential for advancement amidst the current rebound. Australian Dollar leads as the strongest, followed by Euro and Sterling. New Zealand Dollar is mixed, but turned weaker in response to the government's grim economic forecast for the year.
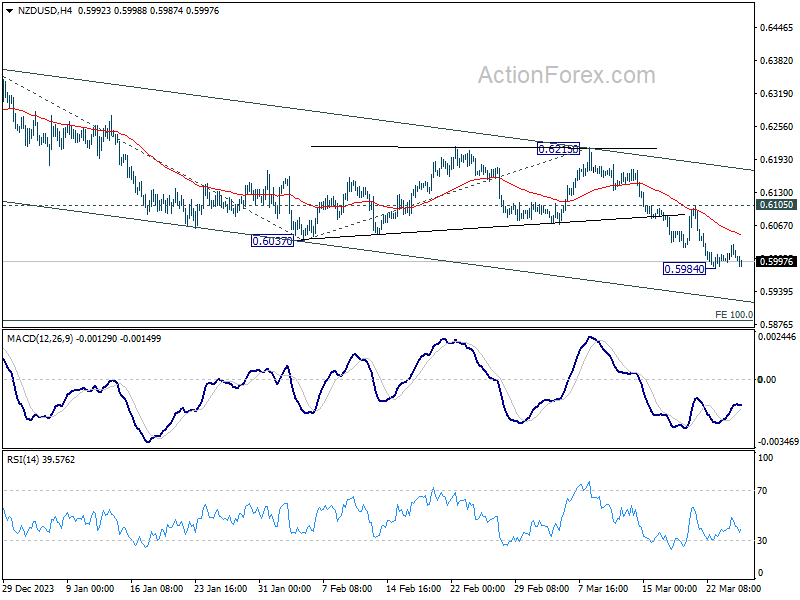
Technically, further decline is expected in NZD/USD as long as 55 4H EMA (now at 0.6048) holds. Break of 0.5894 temporary low will resume the fall from 0.6368. Next target is 100% projection of 0.6368 to 0.6037 from 0.6215 at 0.5884. Nevertheless, firm break of 55 4H EMA will bring stronger rebound back towards 0.6105 resistance.
In Asia, at the time of writing, Nikkei is up 1.08%. Hong Kong HSI is down -0.74%. China Shanghai SSE is down -0.52%. Singapore Strait Times is up 0.82%. Japan 10-year JGB yield is down -0.0056 at 0.733. Overnight, DOW fell -0.08%. S&P 500 fell -0.28%. NASDAQ fell -0.42%. 10-year yield fell -0.019 to 4.234.
NZ government drastically cuts 2024 growth forecast to 0.1%, lowers inflation outlook
New Zealand government has made significant revisions to its economic forecasts, projecting a notably subdued GDP growth of just 0.1% for this fiscal year, as revealed in its latest budget statement. Additionally, inflation outlook for both 2024 and 2025 was revised downwards.
The government said a "wide range of data" collected since December highlighted "further deterioration in the economic outlook." The expected slowdown in economic activity materialized "sooner than expected," while inflationary pressures have "eased more than expected."
Specifically, GDP growth projections for 2024 have been significantly lowered from prior forecast of 1.5% to 0.1%. However, there is a silver lining with GDP growth forecast for 2025 being adjusted upwards from 1.5% to 2.1%.
On the inflation front, CPI forecast for 2024 was lowered from 4.1% to 3.3%, and for 2025, forecast was revised down from 2.5% to 2.2%.
Australia's monthly CPI holds steady at 3.4% in Feb
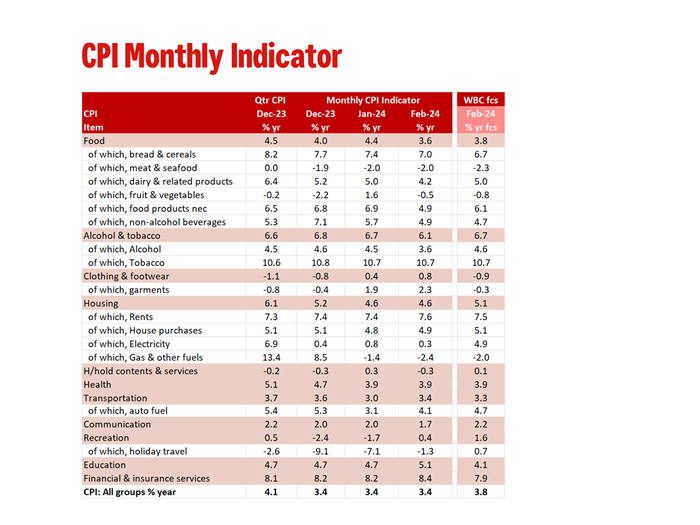
Australia monthly CPI was unchanged at 3.4% yoy in February. When stripping out volatile items and holiday travel, the CPI saw a slight deceleration, moving from 4.1% yoy to 3.8% yoy. However, a closer look at the core inflation measure, the annual trimmed mean CPI, reveals a slight uptick from 3.8% yoy to 3.9% yoy, suggesting underlying inflationary pressures remain persistent.
The detailed breakdown of inflation contributors highlights showed that housing costs had the most substantial rise at 4.6% yoy. Food and non-alcoholic beverages also experienced a notable increase at 3.6% yoy. Additionally, alcohol and tobacco products saw a sharp price escalation at 6.1% yoy, and insurance and financial services costs surged by 8.4% yoy, the latter being the highest among the recorded sectors.
BoJ's Tamura stresses gradual withdrawal of stimulus for steady policy normalization
BoJ board member Naoki Tamura said that Japan's moderate economy recovery path is expected to continue, positive cycle of wage increases leading to higher inflation rates.
"The risk of our medium- and long-term forecasts being derailed is likely small," he remarked in a speech today.
He underscored the importance of a deliberate and gradual approach to policy normalization, ensuring that the transition away from aggressive monetary support is managed with precision and foresight.
"How to manage monetary policy ahead is very important to ensure we deftly roll back our massive stimulus program, and move slowly but steadily toward policy normalization," he articulated.
Central to Tamura's vision is the restoration of interest rate flexibility, positioning BoJ to effectively modulate demand and influence price dynamics through rate adjustments.
"In my view, the central bank's ultimate goal is to bring interest rates back to levels where they can be pushed up or down to adjust demand, and influence price moves," he stated.
USD/JPY Daily Outlook
Daily Pivots: (S1) 151.13; (P) 151.35; (R1) 151.64; More...
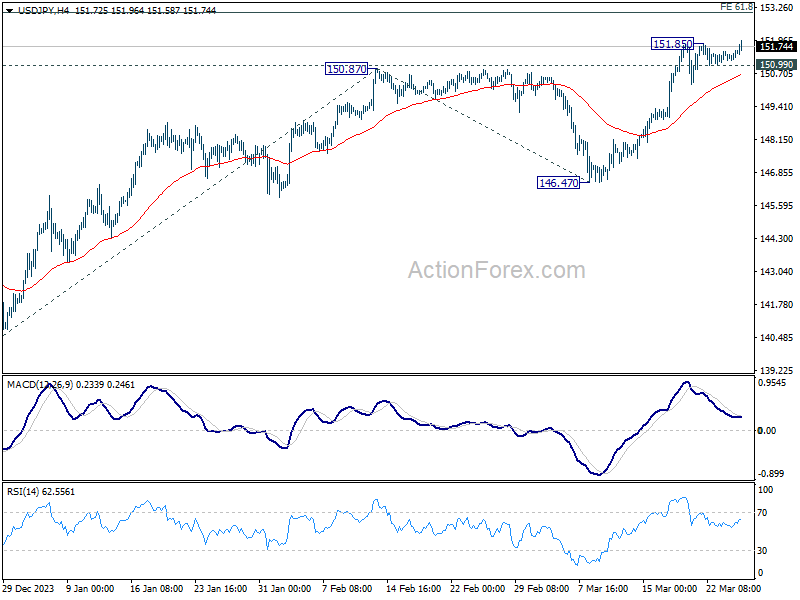
Intraday bias in USD/JPY is back on the upside with breach of 151.85 temporary top. Decisive break of 151.93 key resistance will confirm long term up trend resumption. Next near term target will be 61.8% projection of 140.25 to 150.87 from 146.47 at 153.03. However, firm break of 150.99 minor support will turn bias back to the downside for deeper pullback.
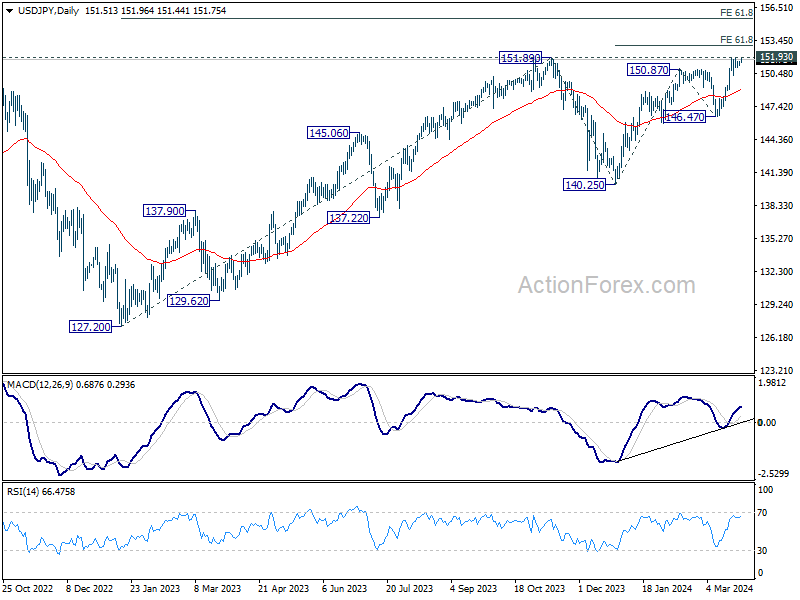
In the bigger picture, correction from 151.87 (2023) high could have completed at 140.25 already. Rise from 127.20 (2023 low), as part of the long term up trend, is probably ready to resume. Decisive break of 151.93 resistance (2022 high) will confirm this bullish case. Next medium term target will be 61.8% projection of 127.20 to 151.89 from 140.25 at 155.20. This will remain the favored case as long as 146.47 support holds, in case of another pullback.
Economic Indicators Update
| GMT | Ccy | Events | Actual | Forecast | Previous | Revised |
|---|---|---|---|---|---|---|
| 00:00 | AUD | Westpac Leading Index M/M Feb | 0.10% | -0.10% | ||
| 00:30 | AUD | Monthly CPI Y/Y Feb | 3.40% | 3.50% | 3.40% | |
| 09:00 | CHF | Credit Suisse Economic Expectations Mar | 10.2 | |||
| 10:00 | EUR | Eurozone Economic Sentiment Indicator Mar | 96.1 | 95.4 | ||
| 10:00 | EUR | Eurozone Industrial Confidence Mar | -9 | -9.5 | ||
| 10:00 | EUR | Eurozone Services Confidence Mar | 7.8 | 6 | ||
| 10:00 | EUR | Eurozone Consumer Confidence Mar F | -14.9 | -14.9 | ||
| 14:30 | USD | Crude Oil Inventories | -0.7M | -2.0M |
NZ First Impressions: Budget Policy Statement Review
The Government’s first Budget Policy Statement confirms that Budget 2024 will unveil a markedly weaker fiscal outlook and a further increase in the government’s borrowing requirement.
Today the new coalition Government released its first Budget Policy Statement (BPS). As expected, the BPS set out the Government’s priorities, an update on the economic outlook and its high-level fiscal goals. The BPS had virtually nothing to say about the operating spending allowances that it will work with in Budget 2024, but the capital allowance will be topped up much as expected.
The key points to note from the BPS are as follows:
- The Government remains committed to delivering “meaningful” personal tax relief in some form in Budget 2024, although as expected there were no new details regarding the quantum or timing of that relief. As tax cuts will be the centrepiece, we think that the detail is unlikely to be announced ahead of the release of the Budget on 30 May.
- The operating spending allowance will be less than $3.5bn in Budget 2024 (the Half-Year Economic and Fiscal Update (HYEFU) set the allowance at $3.5bn). Unusually, the Government declined to set out operating spending allowances for subsequent years, which will instead be revealed in Budget 2024. We suspect that these spending allowances will depend on how the fiscal bottom line is shaping up late in the forecast process.
- In Budget 2024 the Government will add up to $7bn to the Multi-Year Capital Allowance (MYCA) to fund new capital investment spending over the four-year Budget horizon. Not all this top-up will necessarily be funded within the four-year forecast horizon in Budget 2024. However, the top-up alone could lift the four-year government borrowing requirement by about $5bn compared with the HYEFU projection.
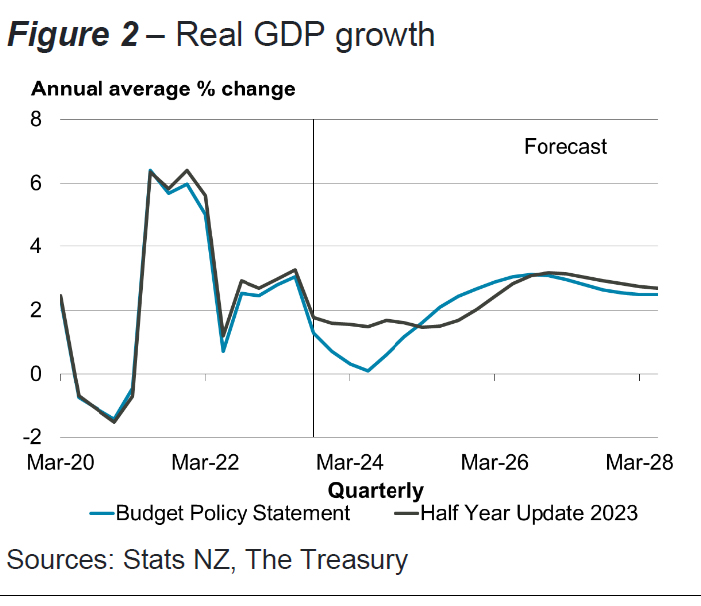
- As foreshadowed by the Minister, considering information received since the HYEFU, the Treasury has downgraded its view of the economic outlook. The BPS presents an updated forecast “scenario” based on data up until 15 March – so prior to the recent soft GDP outcome – that takes account of the expanded MYCA. The forecast takes no account of any policy changes that might be announced in the Budget.
- The Treasury now expects (annual average) real GDP growth of 0.1% in the 2023/24 fiscal year, down from 1.5% forecast in the HYEFU. Real growth is expected to pick up 2.1% in 2024/25 and 3.1% in 2025/26 – slightly firmer than expected in the HYEFU (and firmer than our own forecasts), but insufficient to offset the downward surprise in 2024/25. Moreover, growth beyond 2025/26 is forecast to be slightly slower than forecast in the HYEFU, reflecting a weaker assumed trend for productivity.
- In addition, the Treasury is now also forecasting a lower trajectory for inflation. With CPI inflation expected to be close to the RBNZ’s 2% midpoint by the middle of next year, the forecast for nominal GDP is significantly lower across the forecast horizon – indeed by a cumulative $42.8bn – implying a markedly smaller tax base.
- The weaker outlook for nominal GDP means that core Crown tax revenue in the current 2023/24 fiscal year is forecast to fall $1.2bn short of the HYEFU forecast – broadly in line with our own forecasts. The shortfall grows to $3.2bn by 2026/27 and to $4.2bn by 2027/28. The cumulative shortfall over the five years to 2027/28 is $13.9bn.
- Taken at face value, these revenue projections imply that the Government would not achieve an operating surplus in either 2026/27 or 2027/28 (OBEGAL surpluses of $0.1bn and $3.4bn were forecast for these years in the HYEFU).
- However, it is important to note that these revised tax revenue forecasts include neither the impact of the personal income tax cuts that the Government is seeking, nor as yet unknown potential new revenue measures. The outlook for OBEGAL will also depend on the size of the spending cuts and reprioritisations that the Government is able to achieve in Budget 2024, including those already announced in December’s “mini-Budget”, and any further changes to the Treasury’s underlying economic forecast. We expect that the Government will seek to forecast at least a small surplus in 2027/28 – a goal that the Minister of Finance has described as “achievable but not a given”. However, it remains to be seen whether this can be accomplished by Budget 2024.
- The government has set a long-term goal of reducing net core Crown debt (i.e., net debt excluding certain assets like the NZ Super Fund) to below 40% of GDP, compared with the forecast level of around 44% of GDP in 2023/24. Once there, the Government intends to maintain core net Crown debt in a range of 20-40% of GDP. Given the starting point, this debt target will be more binding than that pursued by the Government’s predecessor.
- The government has set a long-term goal of achieving an operating (OBEGAL) surplus that is sufficient to ensure consistency with the debt objective. In part it will do this by managing core Crown expenses down towards 30% of GDP from 33% at present.
In summary, today’s news confirms that the government borrowing programme will likely be raised significantly when Budget 2024 is released on 30 May. Given the extent of the downgrade in the tax forecasts, the size of that increase could be as much as $15bn across four years rather than the $7-10bn we surmised in our BPS Preview. However, much will depend upon decisions taken between now and the Budget, especially regarding the size and timing of tax cuts. Ahead of the Budget, amongst other things we will be keeping an eye on the Government’s monthly financial statements (released on 4 April and 7 May) to see how tax revenue is tracking compared to the revised forecasts in today’s BPS.
Australia February Monthly CPI Indicator First Impressions
Government rebates continue to hold down inflation while personal services inflation did pick up.
The Monthly CPI Indicator gained 3.4% in the year to February compared to 3.4%yr in both January and December.
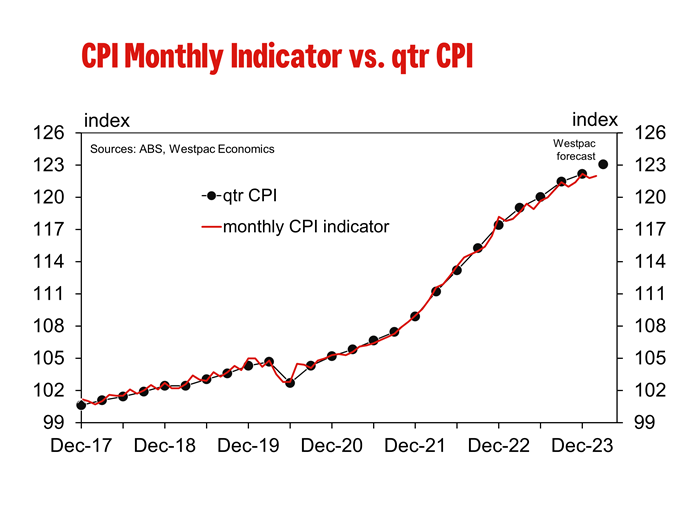
The February print was a softer than Westpac’s forecast of 3.8% and the market median forecast of 3.5%yr. Taken at face value, the February Monthly CPI Indicator suggests that if there are any risks to our current March quarter CPI forecast of 0.7%qtr, it is to the downside. However, the quarterly CPI is not a simple average of the Monthly CPI Indicator and history has taught us that a simple ‘face value’ estimate can be misleading.
Highlighting this are the core measures. The Trimmed Mean measure lifted to 3.9%yr from 3.8%yr while the services series jumped to 4.2%yr from 3.7%yr while goods prices continue to moderate down to 2.9%yr from 3.1%yr. All groups excluding volatile items and holiday travel did ease back from 4.0%yr to 3.9%yr, but this is still much higher than the headline pace of 3.4%yr.
As noted in our preview, the mid-month of each quarter provides us with an important update on household services and so February sets the tone for much of this group for the quarter. Overall, quarterly surveyed services came in stronger than expected exemplified by the 5.1%yr increase in education (forecast was 4.1%yr). This presents an upside risk to our current quarterly CPI forecast.
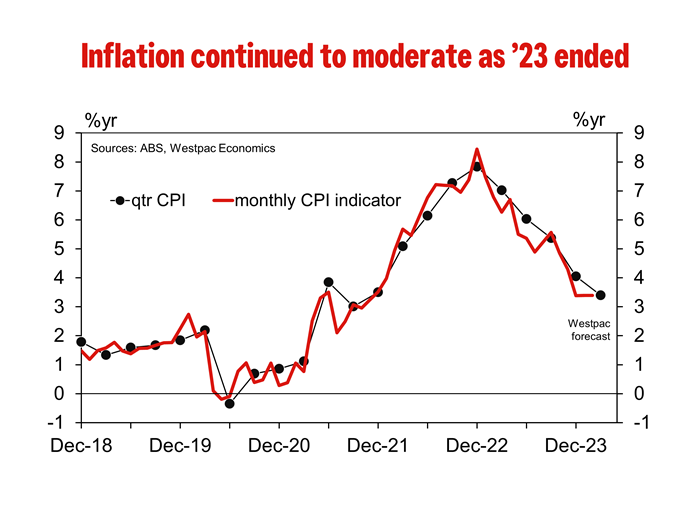
In the month of February, the Monthly CPI Indicator rose 0.2% compared to our forecast for 0.6% increase. The most significant difference to our forecast was electricity, and while this series is a monthly estimate, we have now seen a run of softer than expected electricity prices due to the ongoing impact of government rebates. February included a second round of energy rebates in Victoria. This does have a meaningful impact on our quarterly electricity forecast and presents a downside risk to our Q1 CPI forecast.
Weaker than expected electricity and holiday travel (both monthly series) are being offset by the stronger than expected services (which are quarterly surveys so now locked in for Q1). While we have more work to do on our quarterly forecast, at this stage we find the risk to our Q1 estimate of 0.7% is balanced.
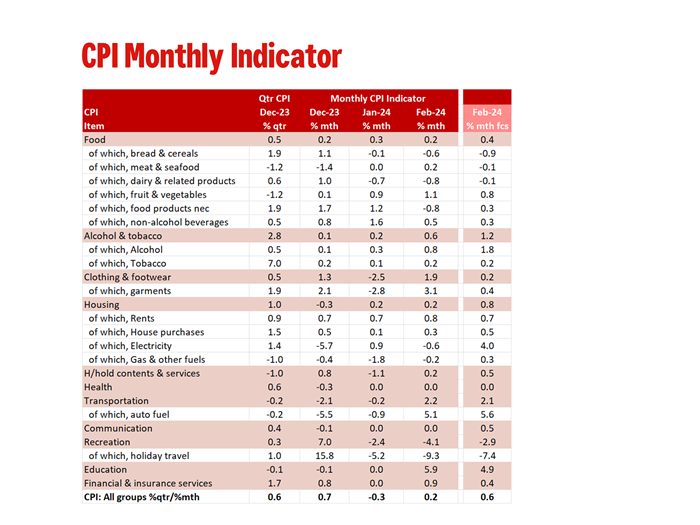
In more detail the difference to our monthly forecast was:
- Food was a touch softer at 0.2% compared to 0.4% forecast.
- Alcohol & tobacco was on the softer side, 0.6% vs. 1.2% forecast, due to a lower-than-expected alcohol price increase.
- Clothing & footwear was stronger at 1.9% vs. 0.2% forecast due to strong price gains for both male and female garments.
- Housing was where the largest discrepancy was, 0.2% vs. 0.8% forecast, due to rebates suppressing electricity prices. In the month the second round of Victoria rebates saw electricity prices fall –0.6% vs. +4.0% forecast. Rents were close to expectations (0.8% vs. 0.7% forecast) while dwellings came in softer lifting just 0.3% vs. 0.5% forecast. It is somewhat surprising we are still yet to see a meaningful lift in dwelling price inflation. Also of note, gas & other household fuels fell –0.2%
- Household contents & services were also on the softer side rising just 0.2% vs 0.5% forecast. However, while monthly non-durables were down –0.5% in the month, domestic & household services (which are surveyed quarterly and so are locked in for Q2) rose 0.9%.
- Recreation was also softer side (–4.1% vs. –2.9% forecast) driven by a 9.3% fall in holiday travel (which is a monthly series).
- An important household service is education, and it is survey only once a year in February. It lifted 5.9% vs 4.9% forecast and as noted earlier, this estimate is locked in for the quarterly estimate.
- Insurance also reported a solid rise of 3.7% which is locked in for Q2. This follows a solid 3.8% gain in the December quarter 2023.
Nikkei (NKD_F) Looking to End Impulsive Rally
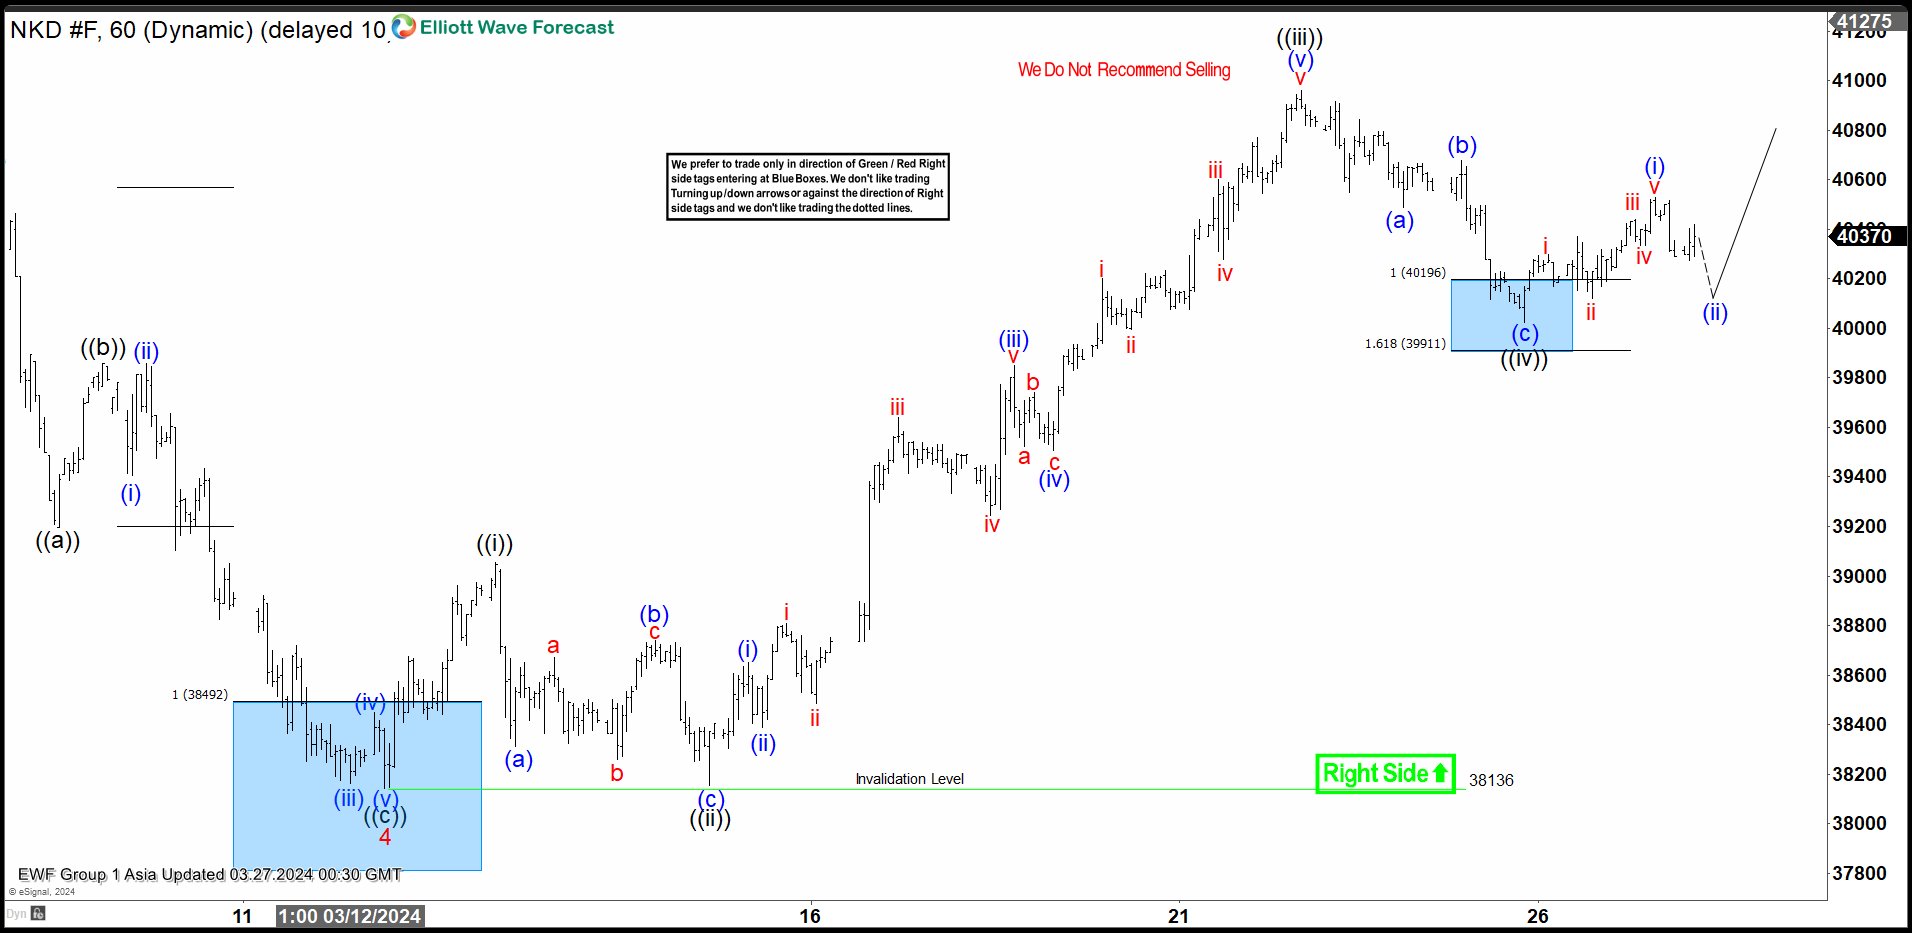
Short Term Elliott Wave view in Nikkei (NKD) suggests pullback to 38136 on 3.12.204 low ended wave 4. Index then turns higher in wave 5. The rally from 3.12.2024 low is in progress as a 5 waves impulse. Up from wave 4, wave ((i)) ended at 39055. Pullback in wave ((ii)) ended at 38155 as a zigzag. Down from wave ((i)), wave (a) ended at 38310, wave (b) ended at 38740 and wave (c) lower ended at 38155. Index then resumed higher in wave ((iii)).
Up from wave ((ii)), wave (i) ended at 38650 and wave (ii) pullback ended at 38390. Wave (iii) higher ended at 39850 and pullback in wave (iv) ended at 39505. Final leg wave (v) ended at 40960 which completed wave ((iii)). Down from there, wave ((iv)) unfolded as a zigzag Elliott Wave structure. Down from wave ((iii)), wave (a) ended at 40490 and wave (b) ended at 40680. Wave (c) lower ended at 40025 which completed wave ((iv)). Nikkei has resumed higher in wave ((v)). Up from wave ((iv)), wave (i) ended at 40530 and dips in wave (ii) ended at 40275. Near term, as far as pivot at 38136 low stays intact, expect Index to extend higher.
Nikkei (NKD_F) 60 Minutes Elliott Wave Chart
NKD_F Elliott Wave Video
https://www.youtube.com/watch?v=GJnoQffvS_I
NZ government drastically cuts 2024 growth forecast to 0.1%, lowers inflation outlook
New Zealand government has made significant revisions to its economic forecasts, projecting a notably subdued GDP growth of just 0.1% for this fiscal year, as revealed in its latest budget statement. Additionally, inflation outlook for both 2024 and 2025 was revised downwards.
The government said a "wide range of data" collected since December highlighted "further deterioration in the economic outlook." The expected slowdown in economic activity materialized "sooner than expected," while inflationary pressures have "eased more than expected."
Specifically, GDP growth projections for 2024 have been significantly lowered from prior forecast of 1.5% to 0.1%. However, there is a silver lining with GDP growth forecast for 2025 being adjusted upwards from 1.5% to 2.1%.
On the inflation front, CPI forecast for 2024 was lowered from 4.1% to 3.3%, and for 2025, forecast was revised down from 2.5% to 2.2%.
BoJ’s Tamura stresses gradual withdrawal of stimulus for steady policy normalization
BoJ board member Naoki Tamura said that Japan's moderate economy recovery path is expected to continue, positive cycle of wage increases leading to higher inflation rates.
"The risk of our medium- and long-term forecasts being derailed is likely small," he remarked in a speech today.
He underscored the importance of a deliberate and gradual approach to policy normalization, ensuring that the transition away from aggressive monetary support is managed with precision and foresight.
"How to manage monetary policy ahead is very important to ensure we deftly roll back our massive stimulus program, and move slowly but steadily toward policy normalization," he articulated.
Central to Tamura's vision is the restoration of interest rate flexibility, positioning BoJ to effectively modulate demand and influence price dynamics through rate adjustments.
"In my view, the central bank's ultimate goal is to bring interest rates back to levels where they can be pushed up or down to adjust demand, and influence price moves," he stated.
Gold Price Could Resume Rally Unless This Level Gives Way
Key Highlights
- Gold rallied above the $2,150 and $2,170 resistance levels.
- A key contracting triangle is forming with support at $2,160 on the 4-hour chart.
- EUR/USD struggled to continue higher above the 1.0865 resistance.
- Bitcoin price regained strength for a move above the $70,000 resistance.
Gold Price Technical Analysis
Gold prices started a fresh increase from the $2,020 support against the US Dollar. The bulls cleared the $2,120 resistance to start a strong rally.
The 4-hour chart of XAU/USD indicates that the price settled above the $2,150 level, the 100 Simple Moving Average (red, 4 hours), and the 200 Simple Moving Average (green, 4 hours).
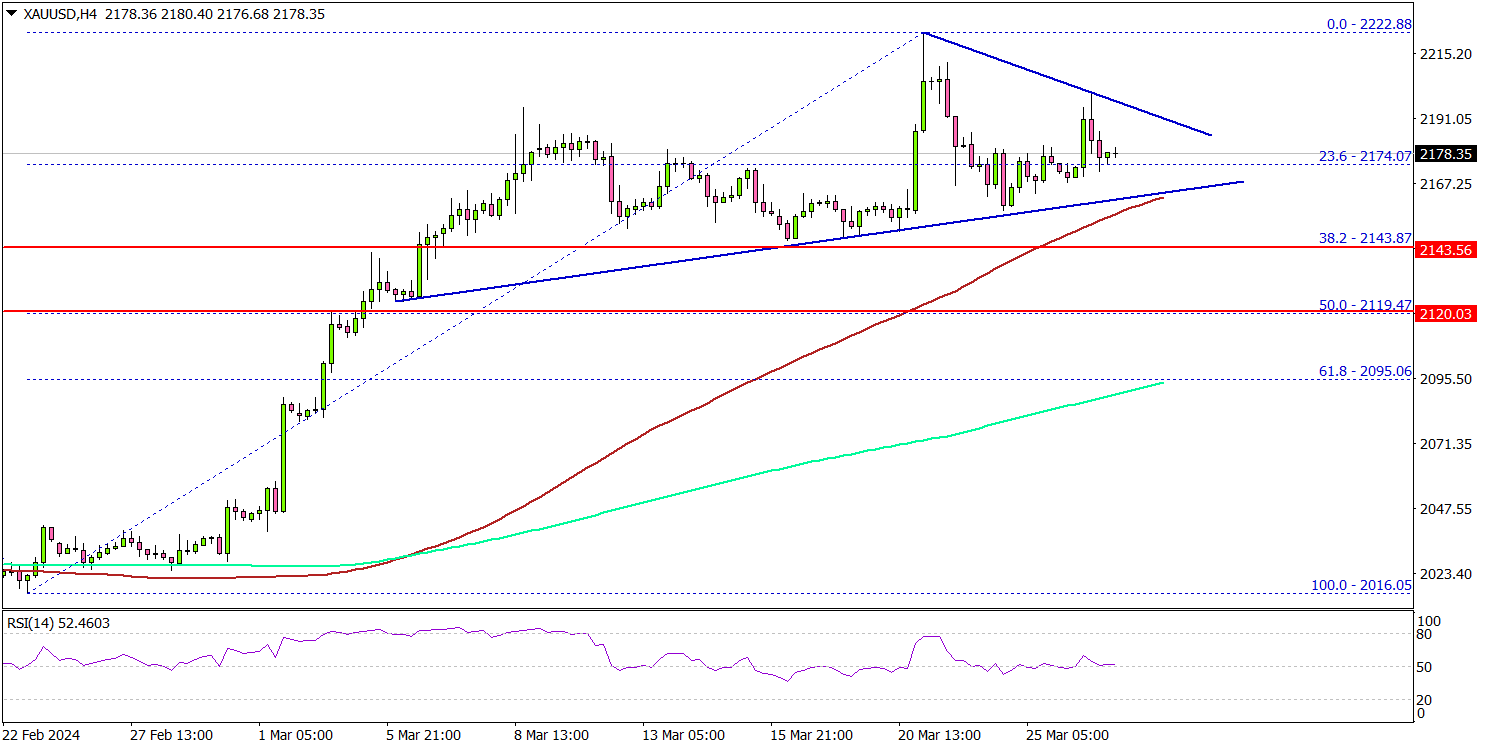
The bulls were able to pump the price above the $2,180 and $2,200 levels. Finally, the price traded close to the $2,225 level before the bears appeared. A high was formed at $2,222 and there was a minor downside correction.
There was a move below the $2,200 level. There was a spike below the 23.6% Fib retracement level of the upward move from the $2,016 swing low to the $2,222 high.
The first major support sits at $2,160. There is also a key contracting triangle forming with support at $2,160 on the same chart. Any more losses might call for a move toward the $2,142 level or the 50% Fib retracement level of the upward move from the $2,016 swing low to the $2,222 high.
On the upside, the price is facing resistance near the $2,190 level. The main resistance is now forming near $2,200, above which the price could accelerate higher toward $2,220.
Looking at Bitcoin, there was a strong upward move above the $70,000 zone but there are again signs of weakness.
Economic Releases to Watch Today
- Euro Zone Economic Sentiment Indicator for March 2024 – Forecast 96.3, versus 95.4 previous.
Australia’s monthly CPI holds steady at 3.4% in Feb
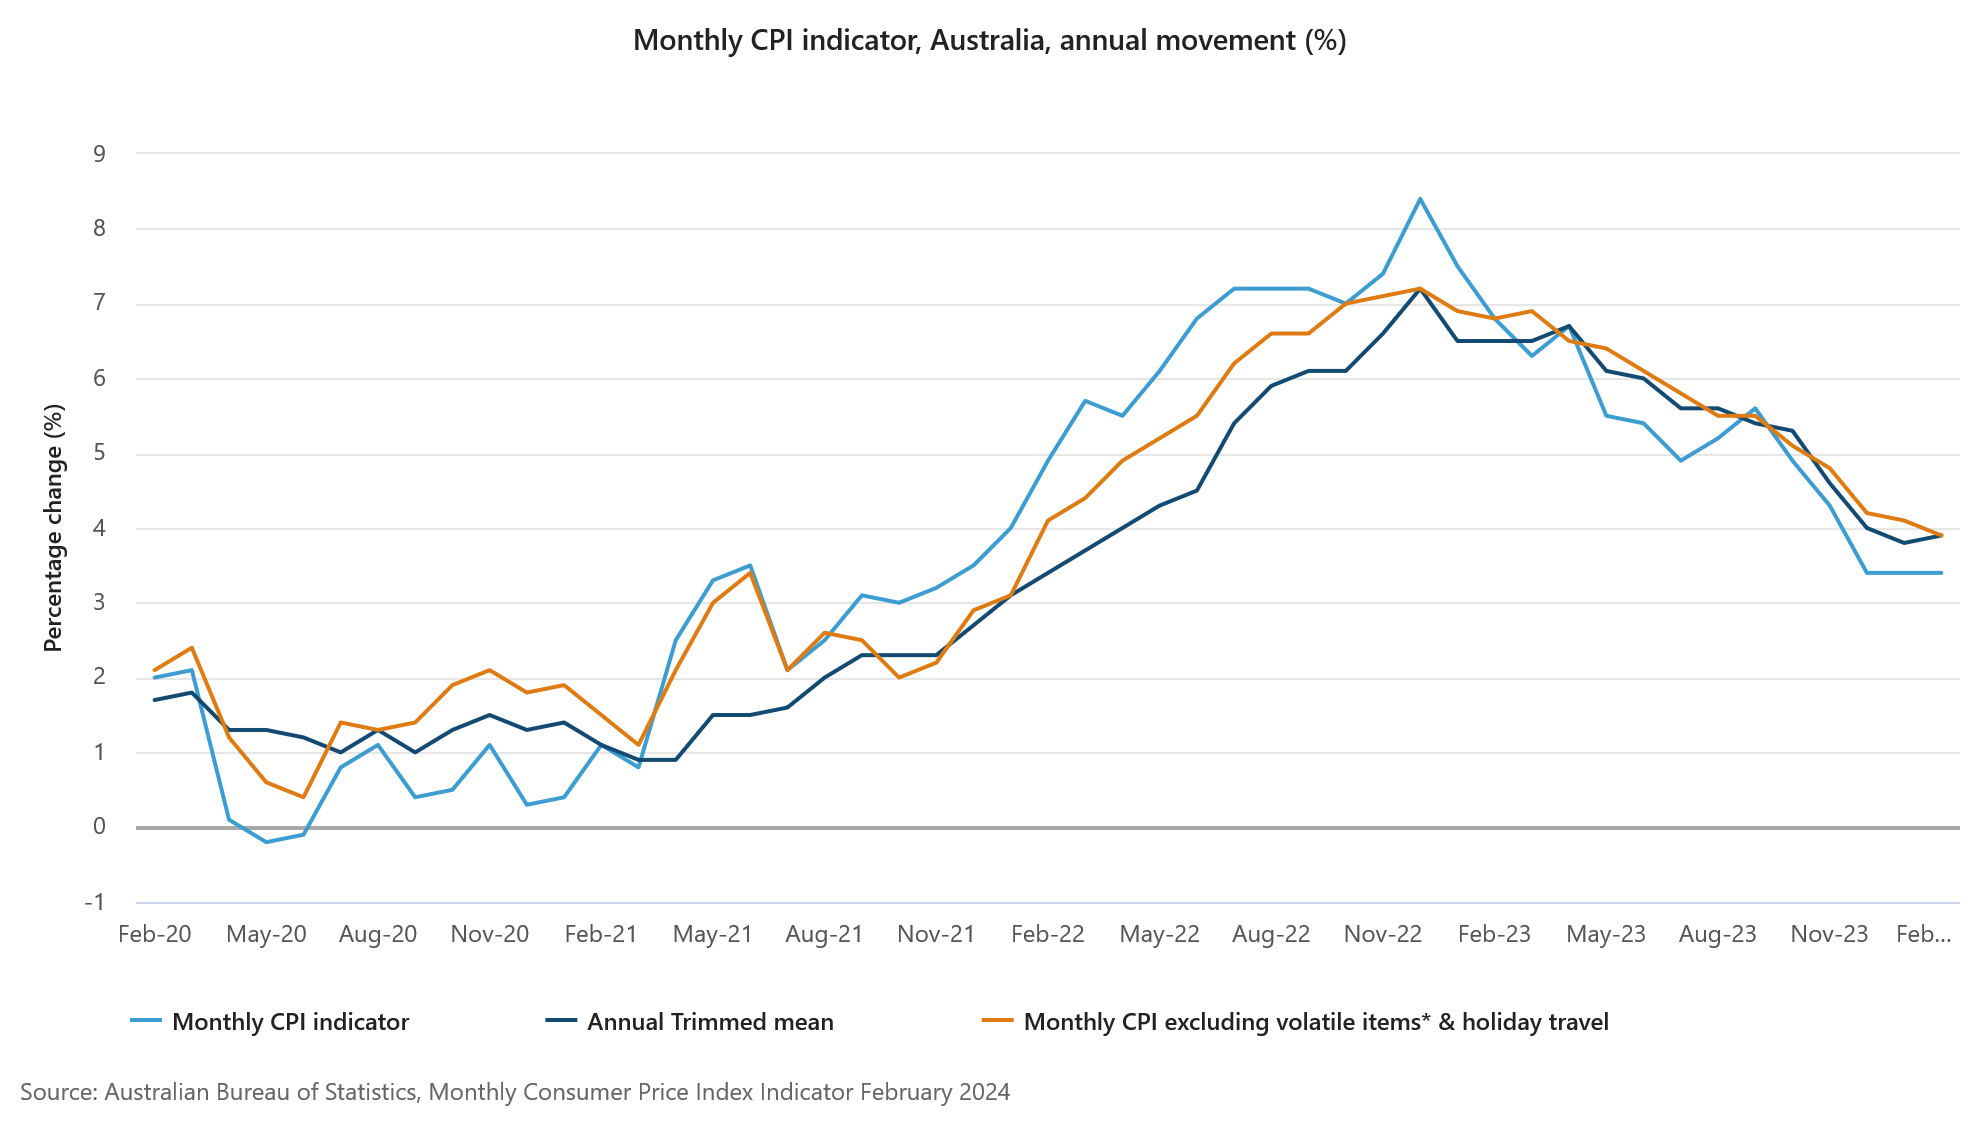
Australia monthly CPI was unchanged at 3.4% yoy in February. When stripping out volatile items and holiday travel, the CPI saw a slight deceleration, moving from 4.1% yoy to 3.8% yoy. However, a closer look at the core inflation measure, the annual trimmed mean CPI, reveals a slight uptick from 3.8% yoy to 3.9% yoy, suggesting underlying inflationary pressures remain persistent.
The detailed breakdown of inflation contributors highlights showed that housing costs had the most substantial rise at 4.6% yoy. Food and non-alcoholic beverages also experienced a notable increase at 3.6% yoy. Additionally, alcohol and tobacco products saw a sharp price escalation at 6.1% yoy, and insurance and financial services costs surged by 8.4% yoy, the latter being the highest among the recorded sectors.
Full Australia monthly CPI release here.
Oil: Russia-Ukraine Crisis Could Boost Oil Prices
Crude oil futures surged on Monday due to disruptions in Russian refining capacity caused by Ukrainian drone strikes and Moscow's decision to cut output to comply with OPEC+ targets. The West Texas Intermediate (WTI) contract for May settled at $81.95 a barrel, up $1.32, while the Brent contract for May settled at $86.57 a barrel, also up $1.32. Russia instructed companies to reduce oil production to fulfill its OPEC+ commitments, with voluntary cuts totaling 2.2 million barrels per day. A Ukrainian drone attack caused a fire at the Kuibyshev oil refinery in Samara, knocking out a major refining unit. According to British intelligence, Ukrainian strikes against Russian energy infrastructure have disrupted at least 10% of Russia's refining capacity, potentially leading to time-consuming and costly repairs.
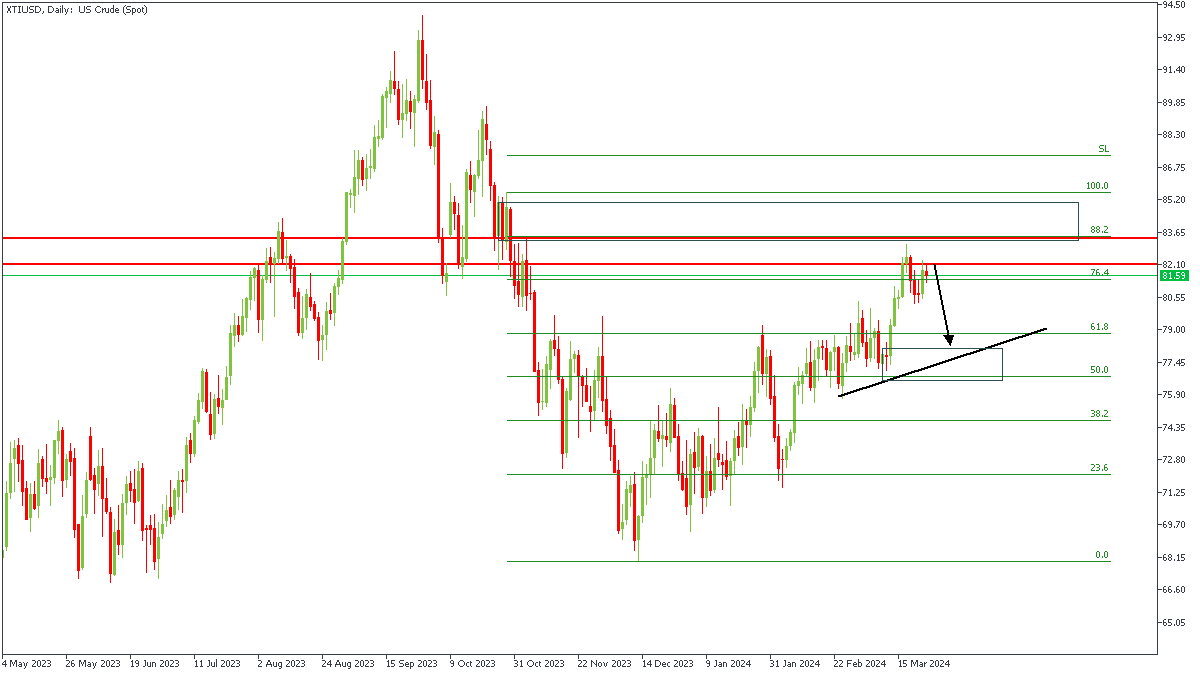
XTIUSD - D1 Timeframe
XTIUSD has made an initial reaction off the pivot zone on the daily timeframe, and may slide even further down. This sentiment is based off of the QMR pattern that I have spotted on the 1-hour timeframe, and the 88% Fibonacci retracement level. The primary target here could very well be the trendline support as shown on the chart.
Analyst’s Expectations:
- Direction: Bearish
- Target: $78.42
- Invalidation: $83.53
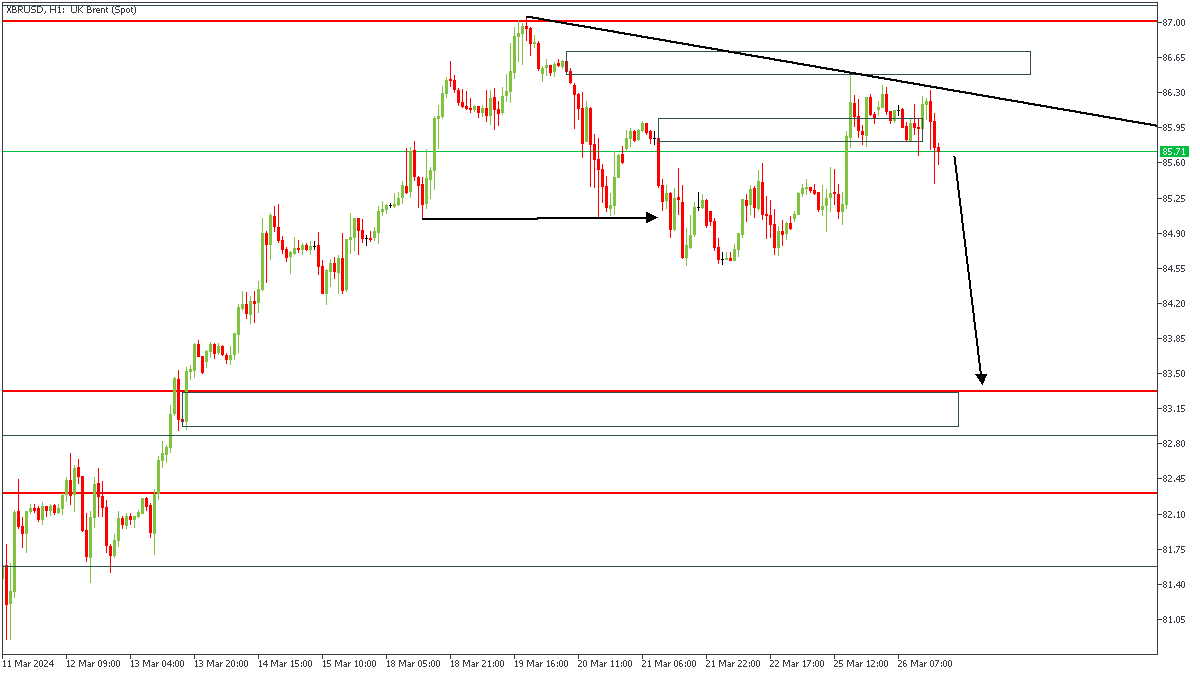
XBRUSD - H1 Timeframe
XBRUSD made a sharp reversal after hitting the pivot zone on the daily timeframe. Following this, price retested a trendline resistance after breaking below the previous lows, indicating the likely onset of a bearish trend. It is my belief that price would try to close below the most recent low, since failure to do so would imply a change in market sentiment. My final target, however, is the demand zone marked out towards the bottom of the chart.
Analyst’s Expectations:
- Direction: Bearish
- Target: $83.36
- Invalidation: $86.73
CONCLUSION
The trading of CFDs comes at a risk. Thus, to succeed, you have to manage risks properly. To avoid costly mistakes while you look to trade these opportunities, be sure to do your due diligence and manage your risk appropriately.
USDCHF Wave Analysis
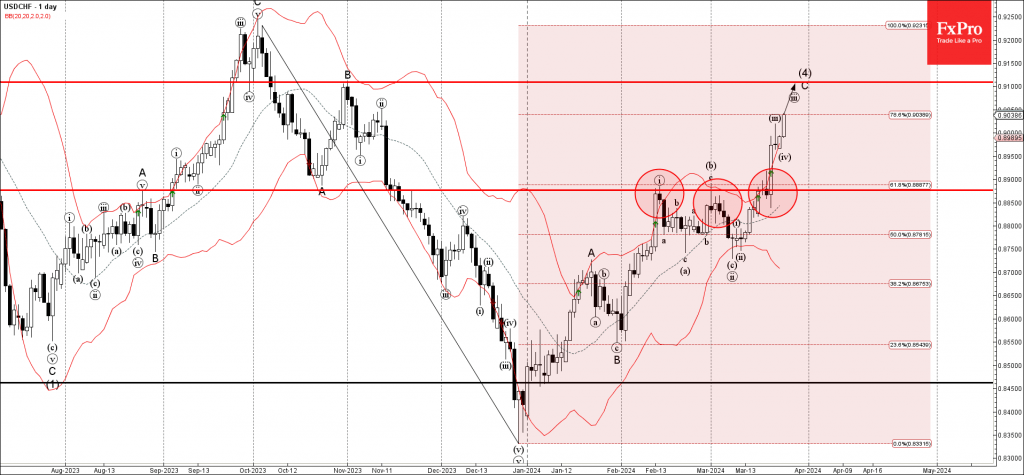
- USDCHF broke the resistance level 0.8875
- Likely to rise to resistance level 0.9100
USDCHF currency pair recently broke the resistance level 0.8875 (which has been reversing the price from February), intersecting with the 61.8% Fibonacci correction of the downward impulse from October.
The breakout of the resistance level 0.8875 accelerated the C-wave of the active intermediate ABC correction (4).
Given the strongly bearish Swiss France sentiment seen today, USDCHF currency pair can be expected to rise further to the next resistance level 0.9100 (target for the completion of the active impulse wave C).