Sample Category Title
CHF/JPY Technical: On the Brink of a Potential Major Bearish Breakdown (CHF Weakness)
- The surprise rate cut by SNB has reinforced the bearish momentum of CHF/JPY.
- CHF has weakened across the board against the G-10 currencies; it is the weakest against the EUR.
- Watch the 169.00 key short-term resistance on CHF/JPY with key support coming in at 166.55.
The CHF/JPY cross-pair has remained soft as it failed to surpass its 50-day moving average at around 170.00. The previous minor rally from the 11 Mar 2024 low of 167.08 was rejected at the 50-day moving average on 21 March 2024 and reversed sharply to the downside thereafter with a loss of -296 pips/-1.73% in the past three sessions as it printed an intraday low of 167.83 today, 26 March at this time of the writing.
Prior CHF strength has dissipated across the board
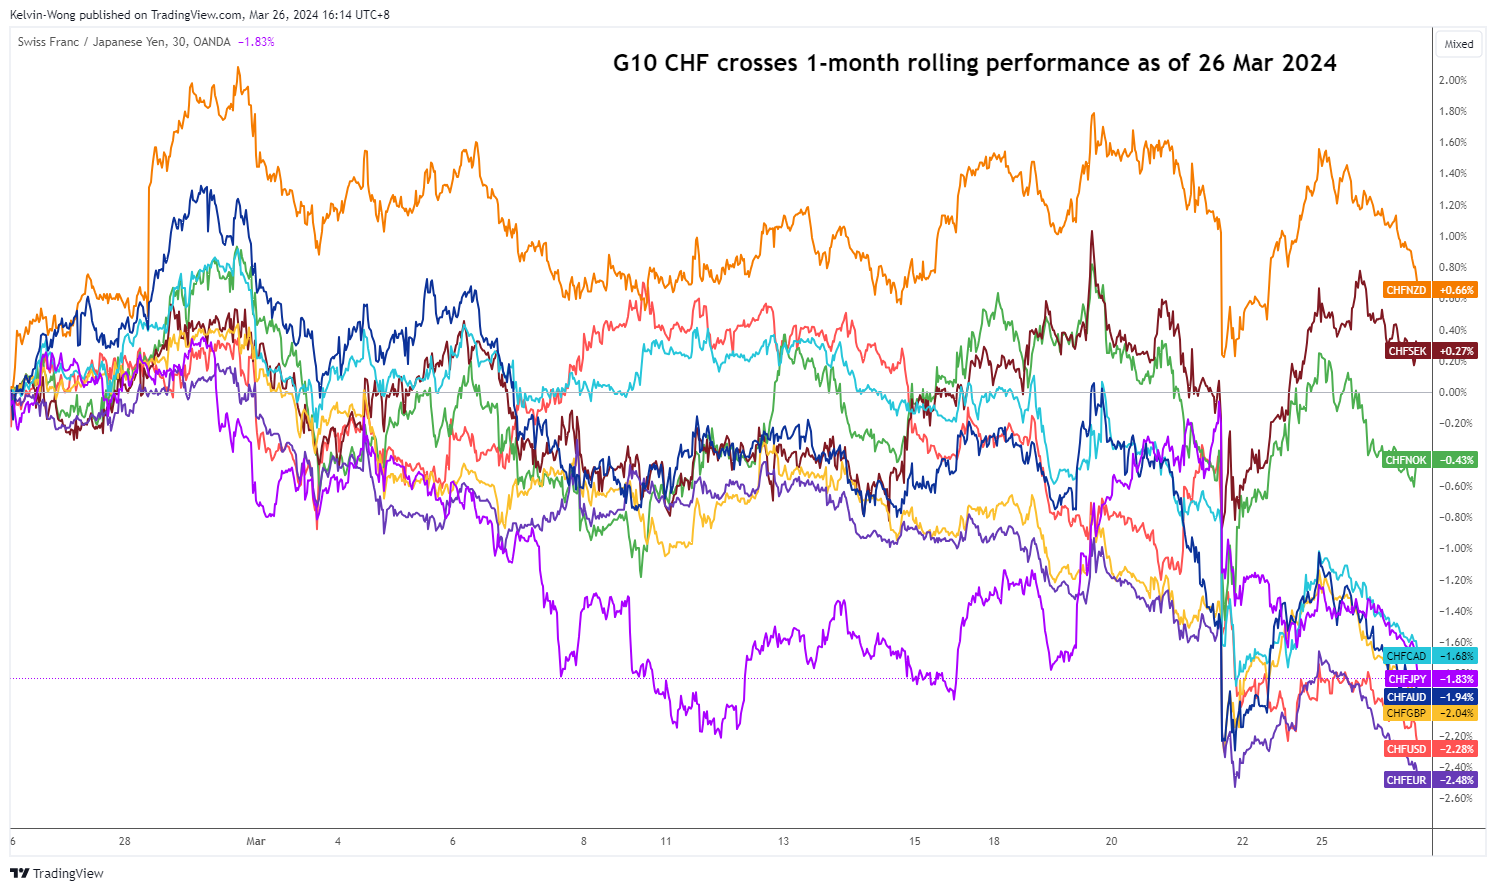
Fig 1: 1-month rolling performances of G-10 CHF crosses as of 26 Mar 2024 (Source: TradingView, click to enlarge chart)
This recent bout of sharp downside reversal of the CHF/JPY has been attributed more to the CHF side of the equation as the Swiss National Bank (SNB) surprised market participants last Thursday, 21 March with a rate cut of 25 basis points (bps) to 1.5% on its key policy rate, its first cut in nine years, and ahead of the US Federal Reserve, Bank of England (BoE), and European Central Bank (ECB).
One of the push factors for enacting an earlier rate cut by SNB is the persistent strength of the franc that could erode the competitiveness of Swiss goods and services which in turn put a dent on economic growth prospects in Switzerland.
The CHF has weakened across the board against other major G-10 currencies and not surprisingly, the CHF is the weakest against the EUR with a loss of -2.5% based on a one-month rolling performance basis with the CHF/JPY coming in fifth position in the pecking order of CHF’s weakness (see Fig 1).
CHF/JPY is looking vulnerable to a major bearish breakdown
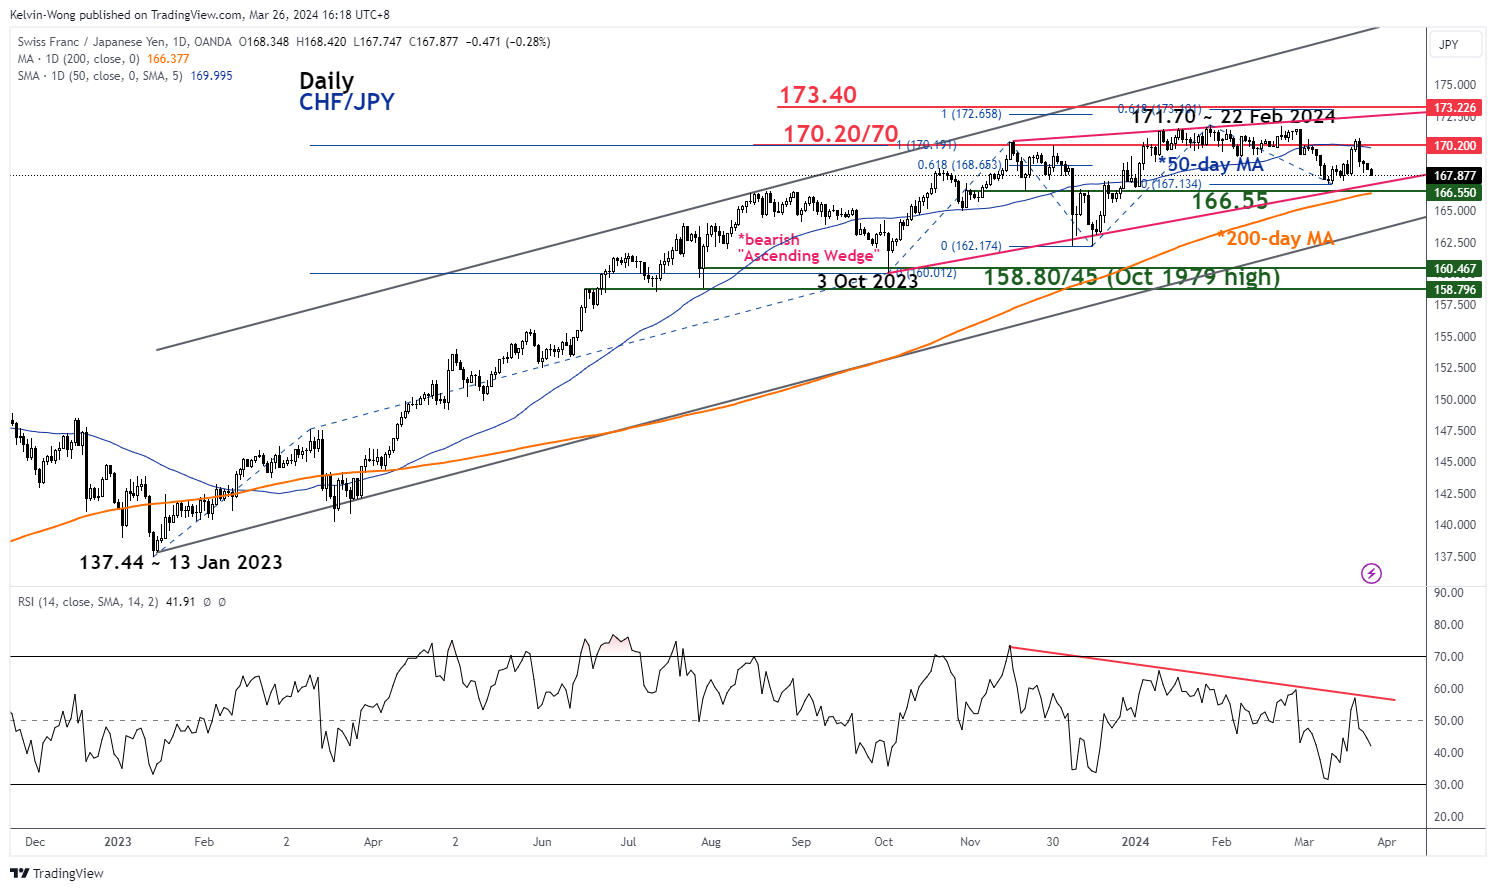
Fig 2: CHF/JPY major & medium-term trends as of 26 Mar 2024 (Source: TradingView, click to enlarge chart)
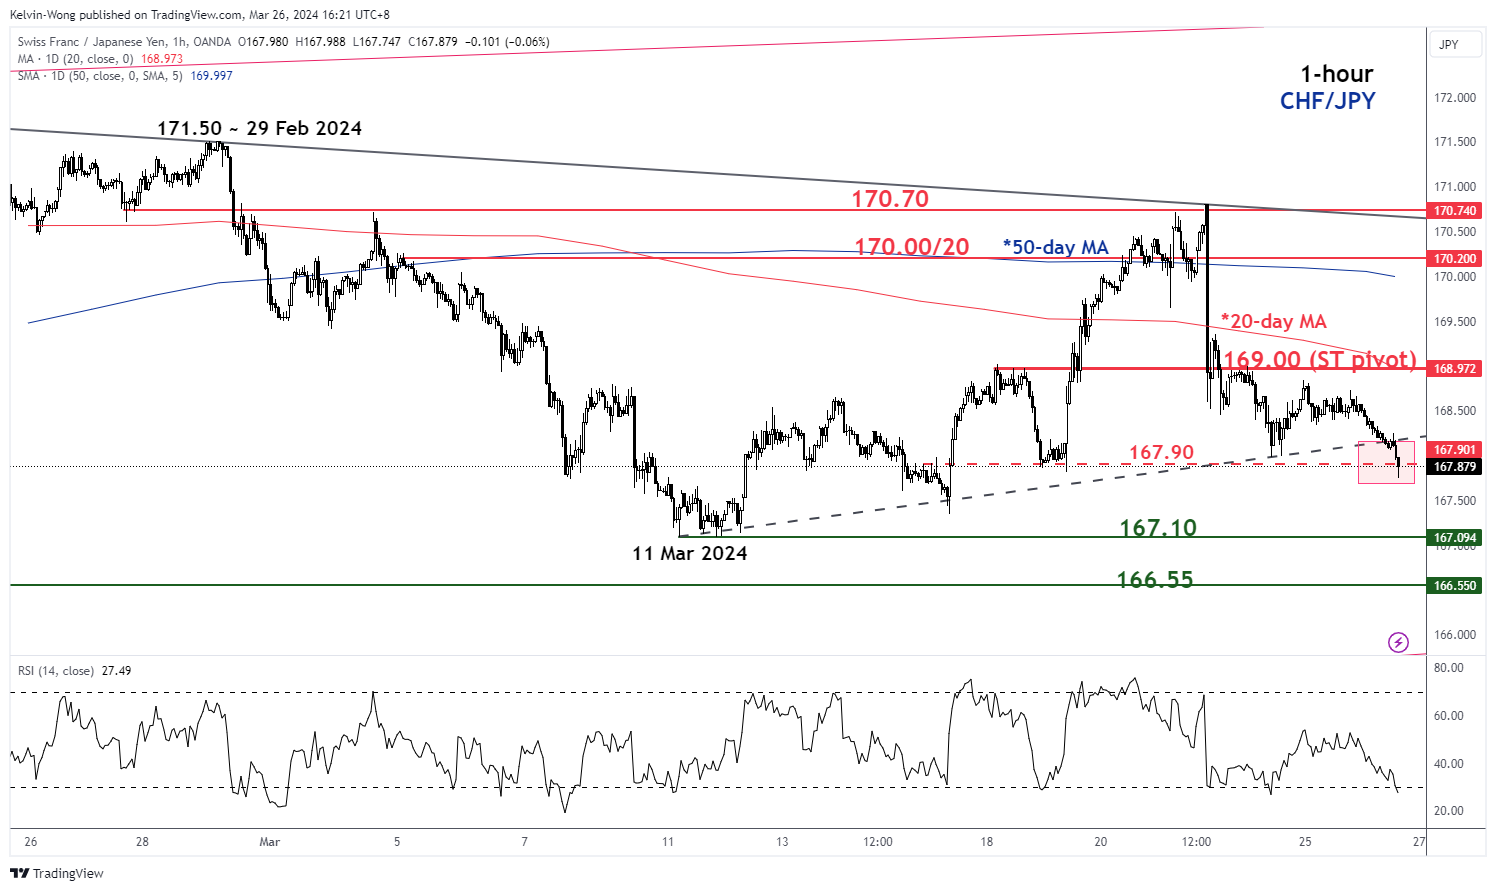
Fig 3: CHF/JPY short-term trend as of 26 Mar 2024 (Source: TradingView, click to enlarge chart)
In the lens of technical analysis, the major uptrend of CHF/JPY in place since the 13 January 2023 low of 137.44 has shown signs of bullish exhaustion. Firstly, it has traced out a bearish “Ascending Wedge” configuration from the 3 October 2023 low where such configuration/chart pattern typically appears at the end of a significant uptrend phase (see Fig 2).
Secondly, medium-term upside momentum has turned lacklustre as depicted by the observations seen in the daily RSI momentum indicator where it has flashed out a persistent bearish divergence condition since 10 January 2024.
Thirdly, the final straw came after the CHF/JPY broke below its 20-day moving on last Thursday, 21 March ex-post SNB.
In the short-term as depicted in its hourly chart, the latest price actions of the CHF/JPY have transformed into a minor downtrend phase after today’s bearish breakdown below its minor ascending trendline from the 11 March 2024 minor low.
If the 169.00 key short-term pivotal resistance (also the 20-day moving average) is not surpassed to the upside, the CHF/JPY may continue to display further weakness to expose the 167.10 near-term support and its key support at 166.55 (the 200-day moving average & lower boundary of the “Ascending Wedge”).
A daily close below 166.55 increases the odds of a major bearish breakdown scenario for the CHF/JPY that is likely to trigger the start of a potential major multi-month downtrend phase.
Conversely, a clearance above 169.00 negates the bearish tone for a choppy minor corrective rebound for the next intermediate resistances to come in at 170.00/20 and 170.70 (medium descending trendline from 22 February 2024 high).
GBPUSD Bounces Off 200-Day SMA
- GBPUSD finds support at uptrend line
- But short-term outlook remains neutral
- MACD and RSI are mixed
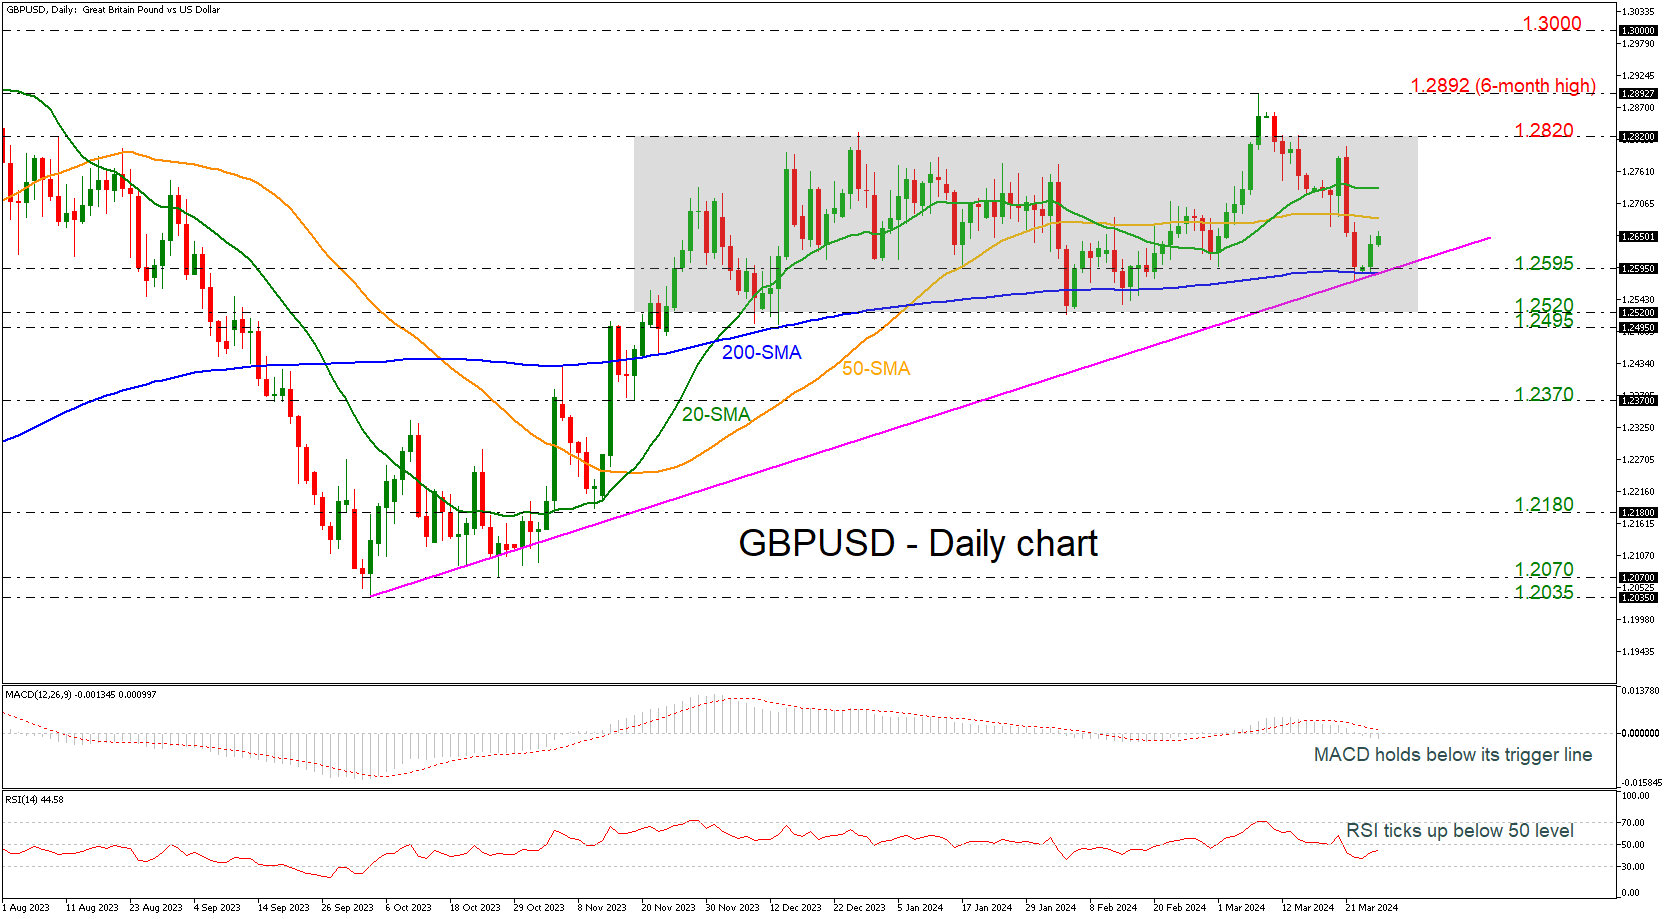
GBPUSD rebounded off the 200-day simple moving average (SMA), which coincides with the 1.2595 support level and the medium-term ascending trend line. The market has still been developing within a consolidation area since November 21, despite the break to the upside that it had on March 8, which seems to be a failed signal.
Technically, the MACD oscillator is moving beneath its trigger and zero lines; however, the RSI is pointing upwards in the bearish territory.
If the market continues to the upside, it could find immediate resistance at the 50-day SMA at 1.2680 ahead of the 20-day SMA at 1.2730. Surpassing these lines, the upper boundary of the channel may halt bullish actions at 1.2820.
On the flip side, a successful dive below the uptrend line and the 200-day SMA, then the market may switch to a bearish one, hitting the 1.2495-1.2520 support region. Even lower, the 1.2370 barricade could be the next level to look for.
In a nutshell, GBPUSD returns back to a neutral phase after the climb towards the six-month peak of 1.2892 and to endorse the bullish outlook again, traders need to wait for a climb beyond the aforementioned level.
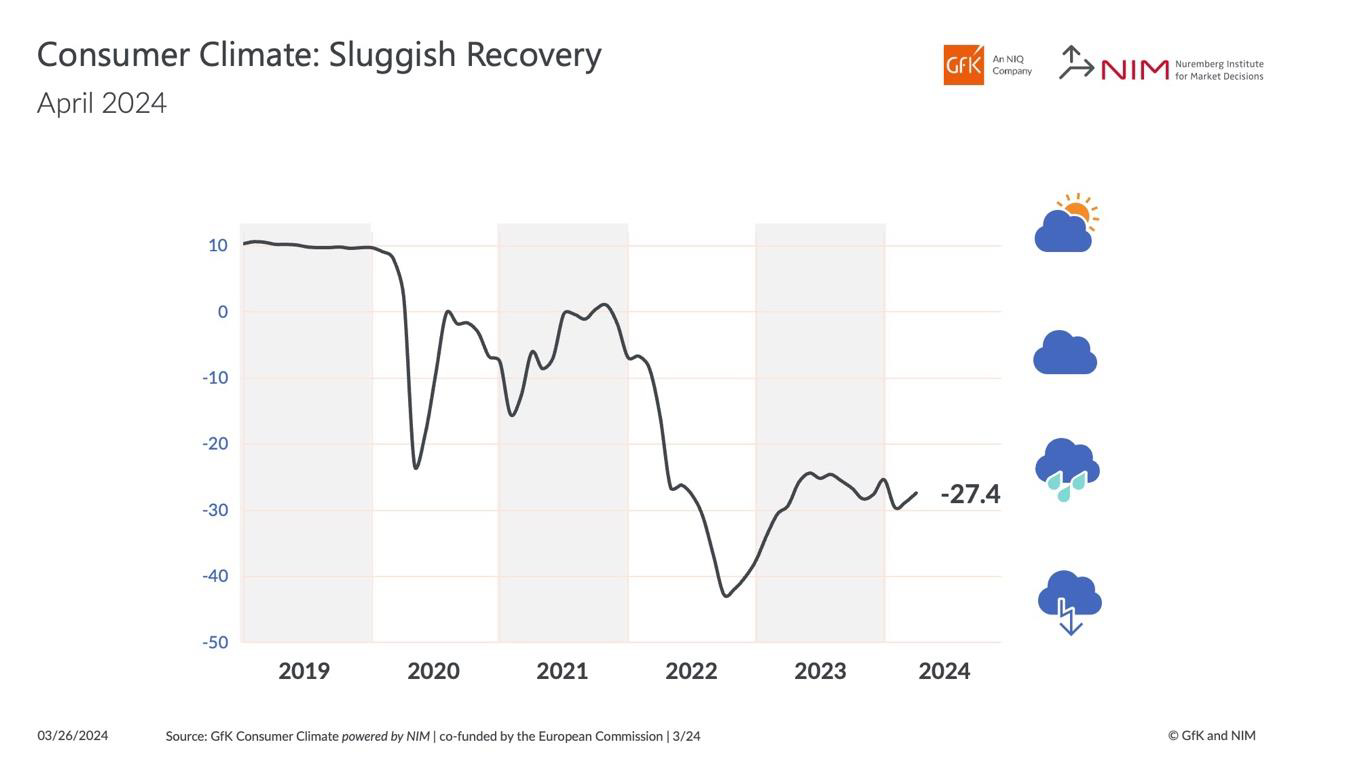
German GfK consumer sentiment edges up to -27.4, uncertainty overshadowing facts
In a modest uptick, Germany's GfK Consumer Sentiment Index for April has slightly improved to -27.4 from March's -28.8, marginally above expectation of -27.8. March's data revealed an improvement in economic expectations and income outlooks, with the former rising to -3.1 from -6.4 and the latter to -1.5 from -4.8. However, the willingness to make purchases marginally declined from -15.0 to -15.3, and the propensity to save saw a notable drop from 17.4 to 12.4.
Rolf Bürkl, consumer expert at NIM, characterized the recovery in consumer sentiment as "slow and very sluggish." He pointed to the fundamental pillars of real income growth and a stable job market as underpinning factors that could potentially catalyze a swift rebound in consumer sentiment.
However, the prevailing atmosphere of uncertainty and a discernible lack of future optimism among consumers is holding sentiment back. This sentiment, according to Bürkl, is stifled by the ongoing array of crises, manifesting in a pronounced reluctance to make purchases despite objectively favorable economic conditions.
"In a nutshell: The poor sentiment is overshadowing the facts," Bürkl noted.
Fed Speakers Covered Full Spectrum of Intra-FOMC Views
Markets
In a more or less synchronic, technically inspired move US, EMU and UK bond markets reversed most of Friday’s rally. Eco data were few and mostly second tier. Marginally softer-than-expected US new homes sales (-0,3% M/M) had little impact on trading. Fed speakers covered the full spectrum of intra-FOMC views. Fed’s Goolsbee supports the median view of three rate cuts, but wants to see more progress with especially housing inflation puzzling the outlook. Fed’s Cook also advocated a cautious approach as the disinflation process has become more uneven. Fed’s Bostic reiterated his view that, if the economy develops as expected, the Fed can be patient with only one rate cut penciled in for this year. US yields rebounded between 3.6 bps (2-y) and 5.7 bps (10-y). A $66bn 2-y US Note auction was solid. German yields rebounded between 5.8 bps (2-y) and 3.2 bps (30-y). Even so, markets still see > 80% chance of a first rate cut in June. ECB’s Lane in this respect said he’s confident that the wage normalization process is on track. ECB’s Panetta (BoI) sees inflation quickly cooling to 2%, allowing for a possible rate cut. The rebound in yields had no unequivocal impact on other markets. Equities showed a mixed picture (S&P 500 -0.31%, Eurostoxx + 0.27%). Oil remains well bid (Brent $86.8/b). The rise in yields didn’t help the dollar. DXY lost modest ground (close 104.22). EUR/USD rebounded to close at 1.0837. The rebound of the yen, even against a soft dollar remains limited despite high profile verbal interventions from Vice Fin Min Kanda. EUR/GBP was blocked in a tight intraday trading range (close little changed at 0.8575).
Asian equities this morning show no clear trend as investors take a cautious approach toward the end of the quarter. The PBOC again strengthened the fixing of the yuan, resulting in a further improvement of the off-shore yuan while the on-shore currency is trading marginally softer (USD/CNY 7.2194). Later today, the US Philly Fed Non-Manufacturing Survey, durable goods orders, house price data and consumer confidence (Conf. Board) will be published. Durable goods orders are notoriously volatile. Shipments are expected to ease after a strong reading last month. Higher than expected house prices might keep housing-related inflation in focus. US consumer confidence is expected to stabilize (107 from 106.7). We don’t expect today’s releases to be a ‘game-changer’. Bond market sentiment remains a bit diffuse after last week’s ‘mixed Fed guidance’. Yesterday’s rebound suggests that there is little room for markets to further position for an early/aggressive Fed easing cycle. If so, the downside in the dollar should stay well protected. Also keep an eye at the policy decision of the Hungarian central Bank (MNB). After the recent decline of the forint, the MNB will probably scale back the one-off February pace of a 100 bps cut. Most market participants expect 75 bps easing, but 50 bps might also be on the table.
News & Views
The US’ independent budgetary watchdog warned for a Liz Truss-style market shock if the government fails to address the matter of ballooning federal debt. Swagel, director of the CBO, referred to the gilt and pound collapse in September 2022 when former PM Truss announced sweeping tax cuts funded by more debt. It eventually led to her resignation after being in office for only 45 days. Swagel said the US was not there yet but risks are rising. His comments came a day after the CBO issued new longer-term economic projections, which showed debt levels rising to 166% of GDP in 2054. But in 5 years already, the US debt-to-GDP ratio would exceed the WWII high of 116%. The US is expected to run deficits of about 6% over the next 10 years before increasing further on higher net interest outlays. These forecasts are based on the scheduled expiry of Trump’s 2017 tax cuts in 2025. Some calculations estimate the cost at $5tn for making these permanent.
The French 2023 deficit turned out bigger than the government expected in a setback for president Macron’s ambition to address the country’s fiscal challenges. Official figures issued this morning showed the shortage expanding from 4.8% in 2022 to 5.5% last year. The Élysée had penciled in a marginal uptick to 4.9%. Growth in tax revenues slowed sharply amid economic stagnation while spending eased only slightly. Debt-to-GDP dropped from 111.9% at the end of 2022 to 110.6%.
Bitcoin Perfect Reaction Higher From Blue Box Area
In this technical blog, we will look at the past performance of the 1-hour Elliott Wave Charts of Bitcoin ticker symbol: $BTCUSD. We presented to members at the elliottwave-forecast. In which, the rally from the 11 September 2023 low is unfolding as an impulse structure. Showing a higher high sequence favored more upside extension to take place. Therefore, we advised members not to sell the crypto & buy the dips in 3, 7, or 11 swings at the blue box areas. We will explain the structure & forecast below:
Bitcoin 1-Hour Elliott Wave Chart From 3.18.2024
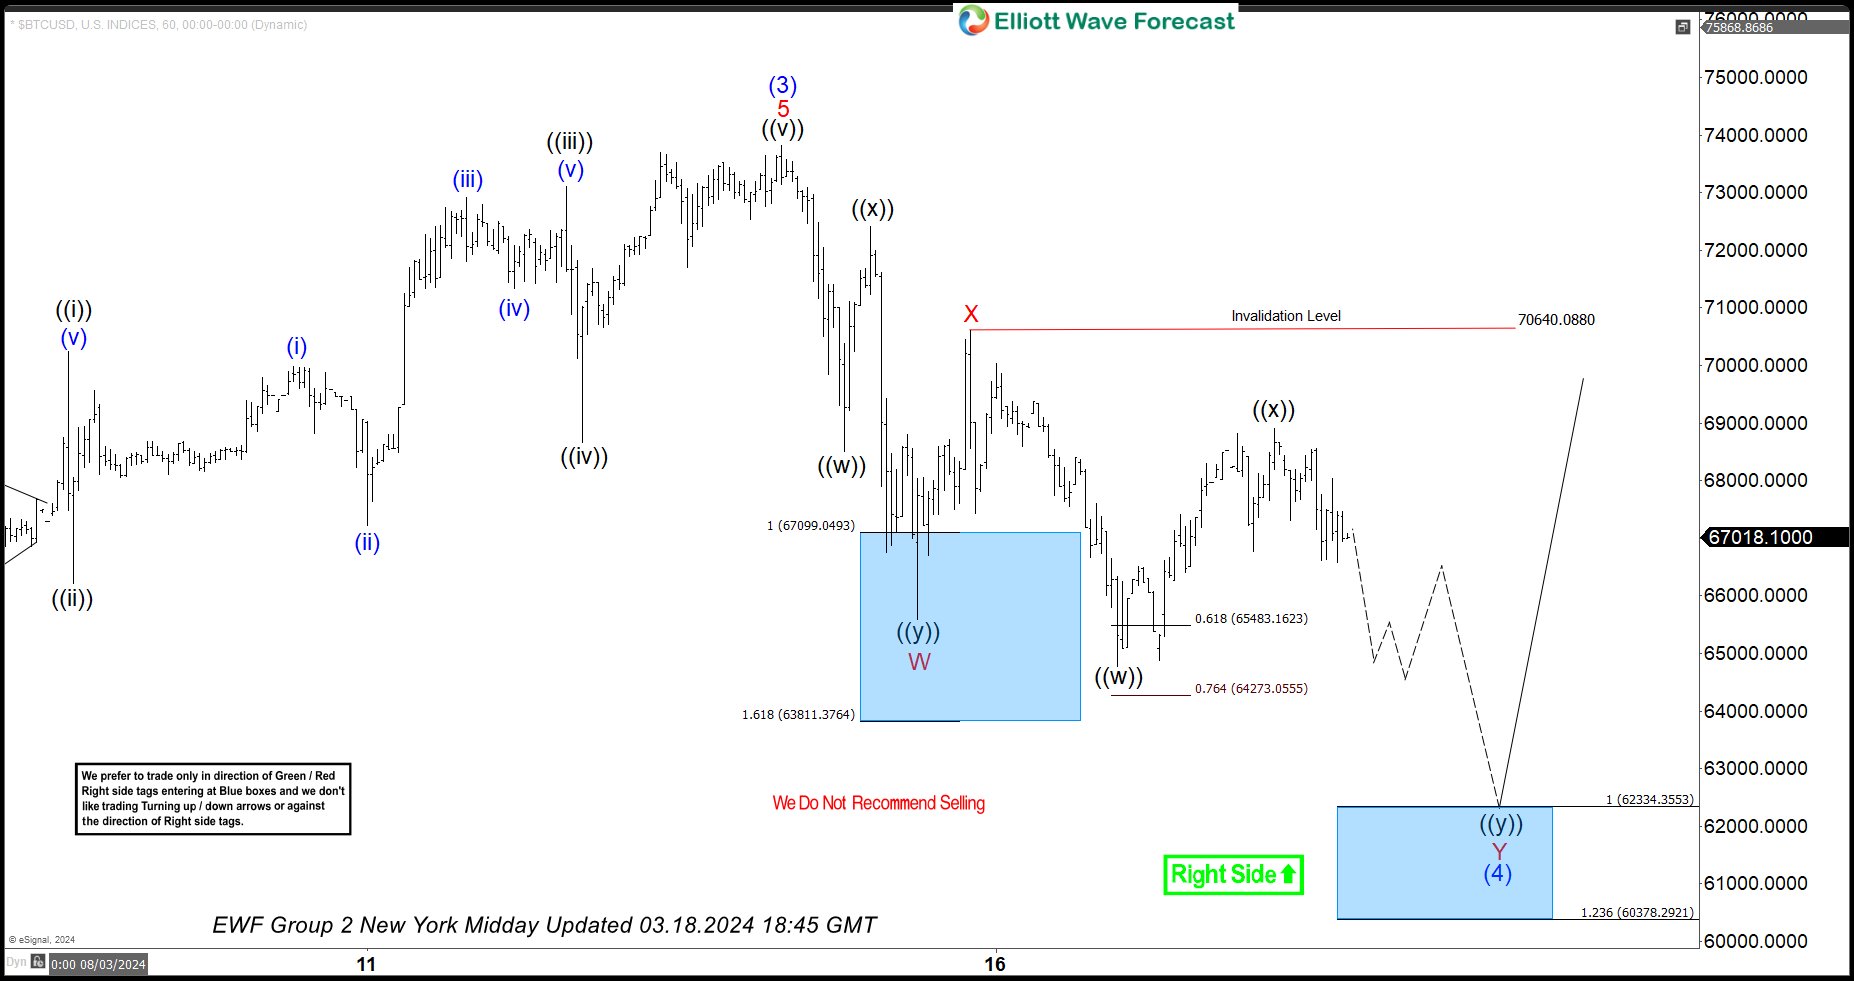
Here’s the 1-hour Elliott wave chart from the 3/18/2024 NY Midday update. In which, the short-term cycle from the 1/23/2024 low ended in wave (3) at $73814 high. Down from there, the BTCUSD made a pullback in wave (4) to correct that cycle. The internals of that pullback unfolded as Elliott wave double three structure where wave W ended at $65595 low. Wave X bounce ended at $70640 high and wave Y managed to reach the blue box area at $62334- $60378. From there, buyers were expected to appear looking for the next leg higher or for a 3 wave bounce minimum.
BTCUSD Latest 1-Hour Elliott Wave Chart From 3.26.2024
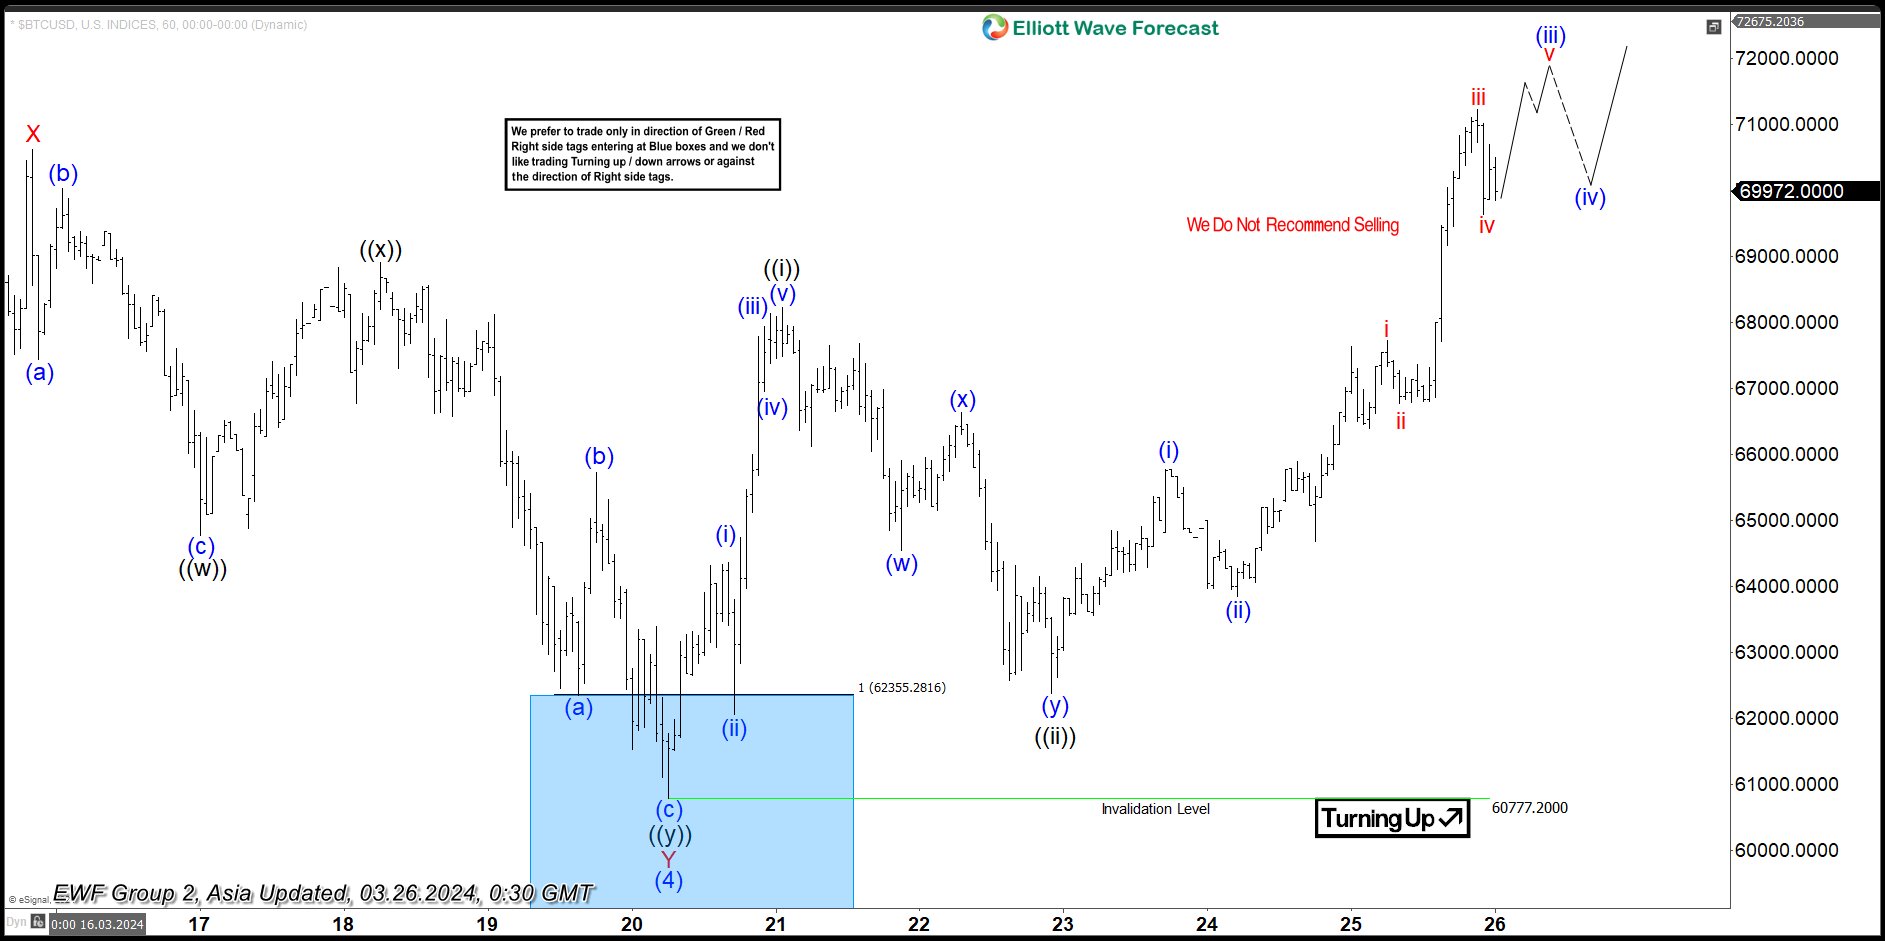
This is the latest 1-hour Elliott wave Chart from the 3/26/2024 Asia update. In which the Bitcoin is showing a reaction higher taking place, right after ending the double correction within the blue box area. Allowed members to create a risk-free position shortly after taking the long position at the blue box area. However, a break above $73814 high is still needed to confirm the next extension higher towards $73822- $76901 & avoid a double correction lower.
Gold (XAUUSD) Looking to Do Larger Degree Correction
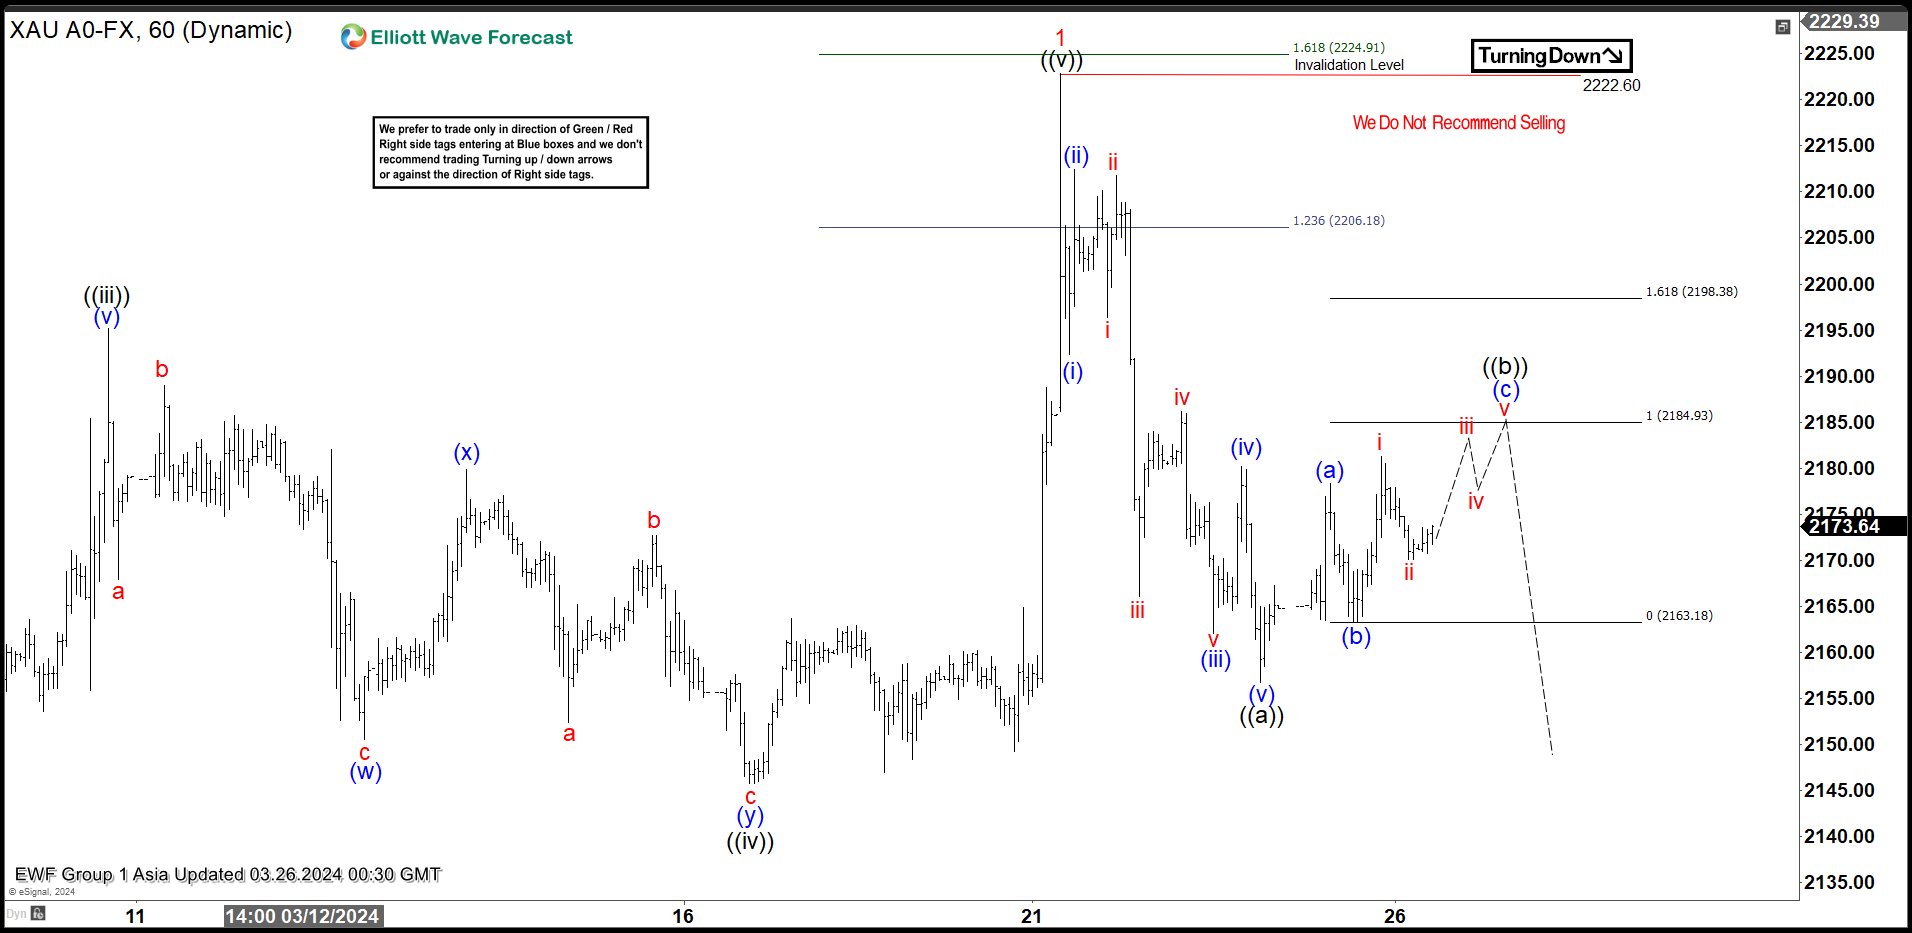
Short Term Elliott Wave view in Gold (XAUUSD) suggests that Gold ended the cycle from 12.13.2023 low. Rally from 12.13.2023 low unfolded as an impulse. Up from there, wave ((i)) ended at 2088.48 and dips in wave ((ii)) ended at 1984.37. The metal then resumed higher in wave ((iii)) towards 2195.15 as the 1 hour chart below shows. Pullback in wave ((iv)) unfolded as a double three Elliott Wave structure. Down from wave ((iii)), wave (w) ended at 2150.45 and wave (x) ended at 2179.81. Wave (y) lower ended at 2145.70 which completed wave ((iv)).
Final leg wave ((v)) ended at 2222.91 which completed wave 1 in higher degree. The metal is now in larger degree wave 2 pullback to correct cycle from 12.13.2023 low. The pullback unfolded as a zigzag Elliott Wave structure. Down from wave 1, wave (i) ended at 2192.3 and wave (ii) ended at 2212.45. Wave (iii) lower ended at 2162, wave (iv) ended at 2180.13, and wave (v) lower ended at 2156.7 which completed wave ((a)) in higher degree. Wave ((b)) unfolded as a zigzag structure. Up from wave ((a)), wave (a) ended at 2178.29 and wave (b) ended at 2163.2. Expect wave (c) of ((b)) to end at 2184.9 – 2198 before the metal turns lower. As far as pivot at 2222.92 high stays intact, expect rally to fail in 3, 7, 11 swing for further downside.
Gold (XAUUSD) 60 Minutes Elliott Wave Chart
XAUUSD Elliott Wave Video
https://www.youtube.com/watch?v=_AtRQ6a541A
FTSE 100 to Benefit from Improved Commodity Appetite
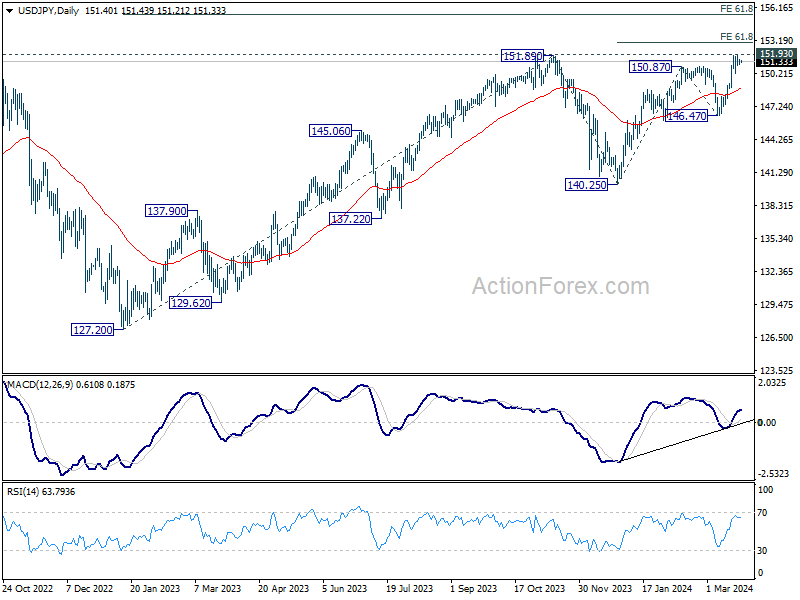
The week kicked off with a pause in the equity rally on both sides of the Atlantic Ocean. Nikkei index is mostly flat on Tuesday and the yen consolidates above 151 following yesterday’s threat from a Japanese official about a potential intervention to stop excessive bleeding in the yen. The Japanese will likely intervene if the USDJPY surpasses the 152 level.
Elsewhere, the dollar index gave back field yesterday as new homes sales unexpectedly fell in February. A $66bn US 2-year bond auction, on the other hand, saw a tepid demand, the yield settled near 4.50%. The 2-10 year of the US yield curve remains inverted for the longest stretch on record. But there is no recession in sight just yet; the US expected to print a 3% growth last quarter, down from near 5% printed a quarter before. The Federal Reserve’s (Fed) massive balance sheet and the huge government spending explain why the higher yields never slowed the US economy. Friday’s core PCE print – the Fed’s favourite gauge inflation – may print a 0.3% monthly rise and a stable 2.8% yearly rise. But at this point, I’ve come to conclude that nothing will derail the Fed cut expectations. And the fact that the Fed will, on top of it, slow the pace of its QT is soothing for risk sentiment. The S&P 500 opened the week slightly lower, we could see some profit taking before the long Easter weekend, market volatility remains low.
Apple’s AI battle
Apple is offered near $170 per share despite chatter that the company could team up with the Chinese Baidu – the Chinese equivalent of Google that’s also active in AI, in hope to boost its iPhone sales in China. Broadly speaking, Apple’s effort to catch up with the AI developments through partnerships is interesting. If the company nails the right partnerships and gets the right offer on their devices, investors could tolerate the lack of in-house AI developments. But the problem is that, when you rely on tools developed by others, you accept that competition could also get them. In the particular case of Apple, the Korean Samsung has already got its smartphones powered by Baidu, therefore it will be hard for
Apple to stand out with the same offering.
But zooming out of Apple, the next phase of the AI should be the extension of the benefits from the companies that power the AI tools – like semiconductors and data centers – to companies that implement the AI models and grow their business on it. Apple could fall in this second category, if it finds the right partnerships and the right strategy. For now, investors remain skeptical.
Improved commodity appetite to boost FTSE 100
A period of loosening policies will likely support the equity valuations beyond the Big Tech, back bond valuations, but also commodities. Rebound in Western manufacturing, Chinese stimulus and geopolitical risks should back copper, aluminum, gold and oil. Copper futures trade with a 20% discount from the pandemic peak on COMEX, while gold consolidates near $2170 per ounce, close to the ATH levels reached earlier this month. US crude on the other hand is back above the $82pb, as bulls eye a further advance to $85pb mark in the continuation of the actual positive trend. Trend and momentum indicators remain supportive of a further rise, and we are not yet close to overbought conditions. I also think that AI investors should enlarge their scope to energy necessary to fuel powerful AI computations. And the name of the controversial uranium is being pronounced timidly by some investors and analysts. The uranium futures have got a significant boost since the war in Ukraine started, and despite the efforts to shift toward alternative and clean energy sources, like wind and solar, none offers a sufficiently large scale to satisfy humanity’s increasing hunger for energy, except uranium.
If commodities perform well, the British FTSE 100 – heavy in energy and mining stocks – should also see a boost. The index rebounded more than 3% since last week, as some investors divest from the US and European stocks that trade near record to invest in British blue-chips that trade with around 50% discount to their Western peers. The FTSE 100 is relatively cheap, it offers an interesting exposure to commodities and the index could claim a fresh high, above the 8000p mark, if appetite for commodities continues to rise on the back of a softer outlook for global central banks and persistent geopolitical tensions.
Focus on US and Swedish Data Today
In focus today
From the US, durable goods orders are due for release for February and Conference Board will release its consumer confidence survey for March. Consumer confidence has improved gradually over the winter as slower inflation supports real incomes.
In Sweden we get producer and import price index for February and the Economic Tendency Survey from NIER. The latest survey showed a significant drop in companies' expected sales. It will be interesting to see if the decrease persists. This is especially important in relation to expected selling prices for the sticky service inflation that is still marginally higher than levels that are consistent with the inflation target of 2%.
The Hungarian central bank will announce its rate decision today. We expect a rate cut of 75bps from 9.00% to 8.25%.
Economic and market news
What happened yesterday
In the US, Fed's Cook (voter) said that the Fed needed to have a cautious approach to policy easing. Bostic (voter) again stated that he expects only one rate cut in 2024, which he also said on Friday.
In Japan, authorities in Japan are not holding their silence as they try to 'verbally manage' the weak currency, which likely has surprised them after the BoJ rate hike last week. USD/JPY has consolidated above 151. Masato Kanda from the Ministry of Finance said that he is clearly seeing speculative moves in the foreign exchange market and is prepared to act.
In Russia, the government has ordered companies to reduce oil output in the second quarter as previously indicated. Output is set to be cut by 471,000 barrels per day to ensure they meet the production target agreed upon in the OPEC+.
Russian President Putin acknowledged that the terrorist attack on a concert hall near Moscow last week was carried out by Islamic militants, but still signalled that he thinks Ukraine played a role in the attack.
The UN Security Council demanded an immediate ceasefire between Israel and Hamas in Gaza and the release of all hostages. The US abstained from voting, which allowed the UN resolution to be passed.
Equities: Global equities started the week lower with Europe and small caps being the bright spots. With very few macroeconomic headlines, it was not a surprise to see a quiet start to the week, which is shortened by holidays. There is discussion among investors if Fed will be able to deliver the cut suggested by the dot plots last week. Investors feel challenged not so much by the job market or demand-side, but rather the inflation outlook. The next big test will come later this week when the PCE numbers are due. In US yesterday Dow -0.4%, S&P 500 -0.3%, Nasdaq -0.3%, and Russell 2000 +0.1%. Asian markets are mostly higher this morning together with US futures while European futures are marginally lower.
FI: Global bond yields rose yesterday on the back of a string of more hawkish comments from various Federal Reserve members. There are few tap auctions in the EGB market today. Germany is tapping in two green bonds. One is the old 5Y OBL, but now a 1Y bond (OBL 04/25), while the other is the 10Y Green Bund (DBR 02/33). Netherlands is tapping up to EUR 2bn in the 5Y benchmark. The green premium in the 10Y German benchmark is very small, while it some 4-5bp in the short-dated bond and 1bp in the long.
FX: In a relatively quiet start to the week the most notable development in FX markets has been the stabilisation in the CNY amid the Chinese authorities adjusting the USD/CNY fixing lower for the second consecutive session. As argued in yesterday's edition this seemed an important near-term condition for USD weakness and EUR/USD did indeed move towards the 1.0850 mark in yesterday's session. The SEK has been among the underperformers ahead of the Riksbank meeting while both EUR/NOK and EUR/GBP were close-to-unchanged on the day in yesterday's session.
EUR/USD Daily Outlook
Daily Pivots: (S1) 1.0812; (P) 1.0827; (R1) 1.0852; More...
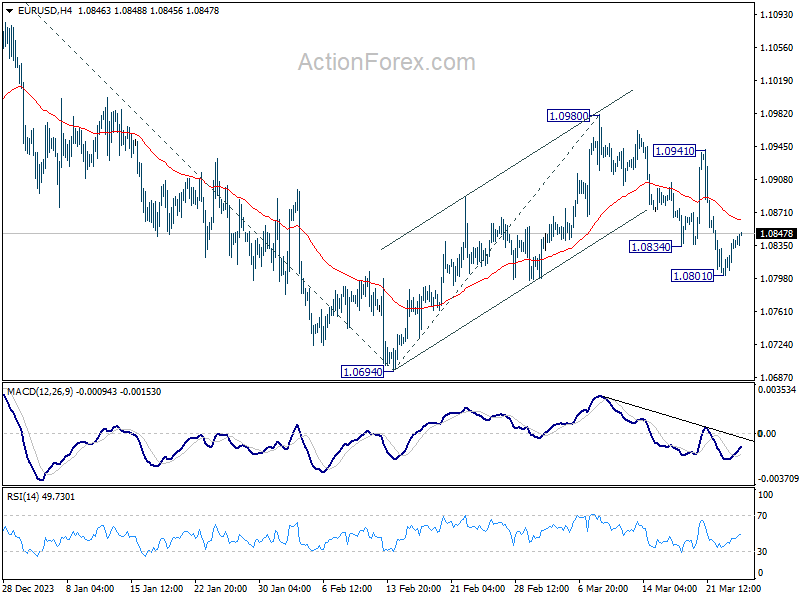
Intraday bias in EUR/USD remains neutral for consolidation s above 1.0801 temporary low. Risk will stay on the downside as long as 55 4H EMA (now at 1.0862) holds. Below 1.0801 will resume the fall from 1.0980 to retest 1.0694 first. Break there will resume the decline from 1.1138 and target 100% projection of 1.1138 to 1.0694 from 1.0980 at 1.0536.
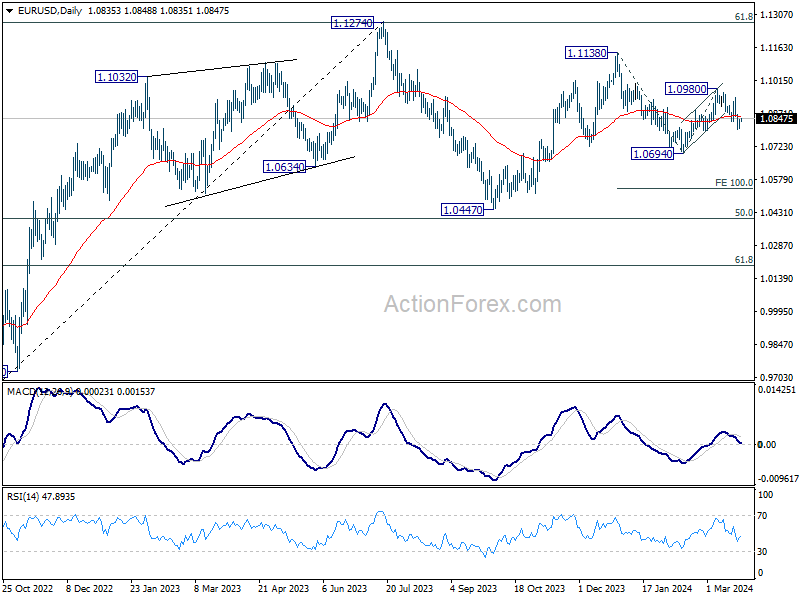
In the bigger picture, price actions from 1.1274 are viewed as a corrective pattern to rise from 0.9534 (2022 low). Rise from 1.0447 is seen as the second leg. While further rally could cannot be ruled out, upside should be limited by 1.1274 to bring the third leg of the pattern. Meanwhile, sustained break of 1.0694 support will argue that the third leg has already started for 1.0447 and possibly below.
USD/JPY Daily Outlook
Daily Pivots: (S1) 151.13; (P) 151.35; (R1) 151.64; More...
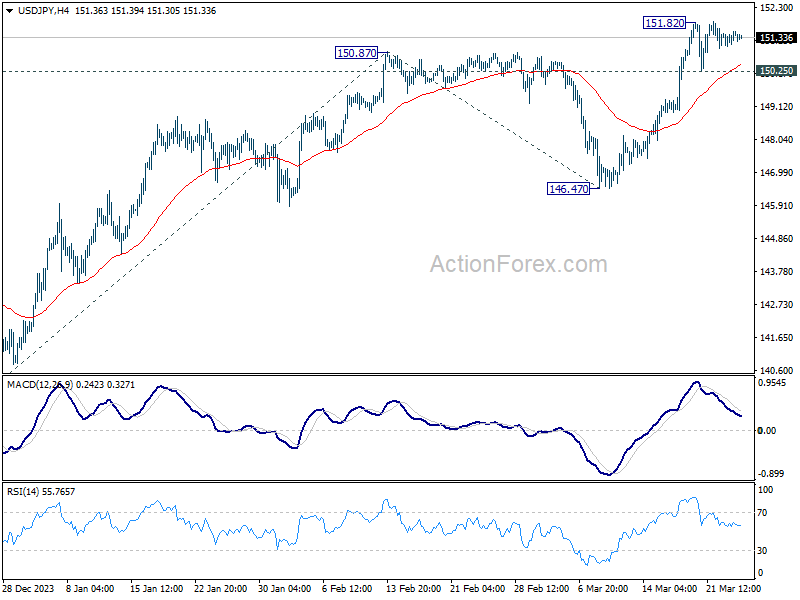
Intraday bias in USD/JPY remains neutral as consolidation from 151.82 is still extending. Further rally is expected as long as 150.25 support holds. On the upside, decisive break of 151.93 key resistance will confirm long term up trend resumption. Next near term target will be 61.8% projection of 140.25 to 150.87 from 146.47 at 153.03. However, firm break of 150.25 will turn bias back to the downside for deeper pullback.
In the bigger picture, correction from 151.87 (2023) high could have completed at 140.25 already. Rise from 127.20 (2023 low), as part of the long term up trend, is probably ready to resume. Decisive break of 151.93 resistance (2022 high) will confirm this bullish case. Next medium term target will be 61.8% projection of 127.20 to 151.89 from 140.25 at 155.20. This will remain the favored case as long as 146.47 support holds, in case of another pullback.