

Sample Category Title
Bitcoin breaks 72k, regulatory nod and ETF inflows propel
Bitcoin's bullish momentum has once again captured the market's attention as it makes new record high above 72k mark today. This surge follows the UK Financial Conduct Authority decision to greenlight the creation of cryptocurrency debt instruments on financial exchanges, albeit limited to professional investors.
In addition to regulatory developments, investment flows into ETFs continue to demonstrate strong market interest. Despite slight deceleration, the 10 largest US spot Bitcoin ETFs attracted almost USD 2B in capital for the week ending March 8, according to LSEG data. This continued influx of institutional money into Bitcoin products highlights the growing confidence and interest from investors seeking exposure to digital assets.
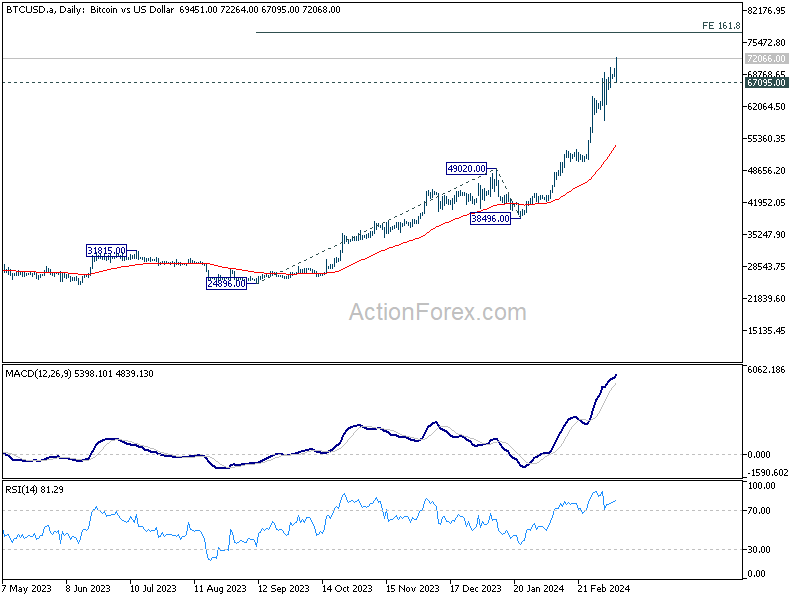
Technically, current rally in Bitcoin is expected to target 161.8% projection of 24896 to 49020 from 38496 at 77572 first. Firm break there will target 200% projection at 86798 next. Meanwhile, break of 67095 support will indicate short term topping and bring consolidations first, before staging another rise.
ECB’s Kazimir advocates for June rate cut, citing alive and kicking inflation risks
In a statement today, ECB Governing Council member Peter Kazimir highlighted his preference delivering the first rate cut in June. Emphasizing the persistent nature of upside inflation risks, Kazimir pointed to factors such as workers' pay, energy prices, fiscal policy, and the green transition as ongoing concerns that necessitate caution.
Kazimir's stance is clear: "Rushing isn't smart and beneficial," he remarked, underlining the jeopardy to ECB's credibility from a hasty policy adjustment.
According to him, "Only in June, with new forecast at hand, will the level of confidence reach the threshold."
Also, he advocates for a "smooth and steady cycle of policy easing," suggesting that the decision-making process should be grounded in comprehensive and up-to-date economic forecasts.
"Upside inflation risks are alive and kicking," he asserted, emphasizing the need for vigilance. "The current picture clearly favors staying calm for the coming weeks and delivering the first-rate cut in summer," he said. "The slowdown in inflation remains fragile — we can't take it for granted."
USD/JPY: Descends Further on Diverging Fed/BOJ Policy Outlook
USDJPY continues to trend lower as dollar was deflated by growing bets for Fed’s rate cut in coming months, while yen rallies on strong signals that the Bank of Japan could start raising interest rates this month, with scenario being boosted by solid Q4 GDP data, which show that economy remains resilient and likely avoided recession.
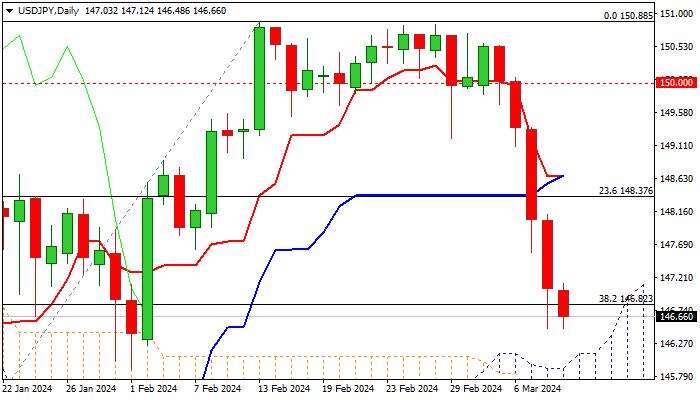
Technical picture on daily chart is improving as negative momentum is strengthening and converged daily Tenkan / Kijun-sen are about to create bear-cross.
Bears probe again through cracked Fibo support at 146.82 (38.2% of 140.25/150.88) and pressure next supports at 146.18/12 (200DMA / top of daily Ichimoku cloud and 145.89 (Feb 1 higher low), with break of these supports to further weaken near-term structure and expose next pivots at 145.56 (50% retracement) and 145.00 (daily cloud base).
Daily close below 146.82 Fibo level to verify bearish signal and keep bears fully in play.
Caution on oversold conditions on daily chart which may produce headwinds and slow bears.
Res: 147.12; 147.48; 147.75; 148.37.
Sup: 146.18; 146.12; 145.56; 145.00.
Japanese Yen Rally Continues as GDP Ticks Higher
The Japanese yen continues to make inroads against the US dollar. In Monday’s European session, USD/JPY is trading at 146.54, down 0.35%. The yen notched its fourth straight winning day on Friday and surged 2% last week.
Japan’s GDP revised upwards to 0.1%
Japan’s GDP for the fourth quarter was revised upwards to 0.1%, compared to -0.1% in the preliminary estimate and following a 0.8% decline in the third quarter. This was significant as the small gain in Q4 means that the economy narrowly avoided a recession, which is defined as two consecutive quarters of negative growth.
No recession is good news, but Japan’s economy is sputtering. The economy barely grew in Q4 and missed the market estimate of 0.3%. Domestic demand remains weak as nervous consumers are holding tight to the purse strings. Private consumption declined 0.3% in the fourth quarter, slightly weaker than the market estimate of 0.2%.
Will BoJ pivot at the March meeting?
All eyes are on the Bank of Japan meeting on March 18-19, with investors on the alert for signs that the central bank plans to phase out its ultra-loose monetary policy. Senior BoJ officials have made hints that changes are coming to the Bank’s ultra-loose monetary policy. The BoJ is unlikely to lift interest rates out of negative territory, but could show a shift in policy by ending its yield curve control policy. A rate hike, which would likely send the yen sharply higher, isn’t expected before June.
In the US, the February employment report was mixed. Nonfarm payrolls rose 275,000, easily beating the market estimate of 200,000 and the downwardly revised 229,000 in January. However, the unemployment rate surprised by climbing to 3.9% after holding at 3.7% for three straight months, which was also the market estimate. This was the highest unemployment rate in two years and points to softer labor market conditions. The rise in the unemployment rate has raised the odds of a rate cut in June by the Federal Reserve. Currently, the likelihood of a cut is 73%, compared to 64% just one week ago, according to the CME’s FedWatch tool.
USD/JPY Technical
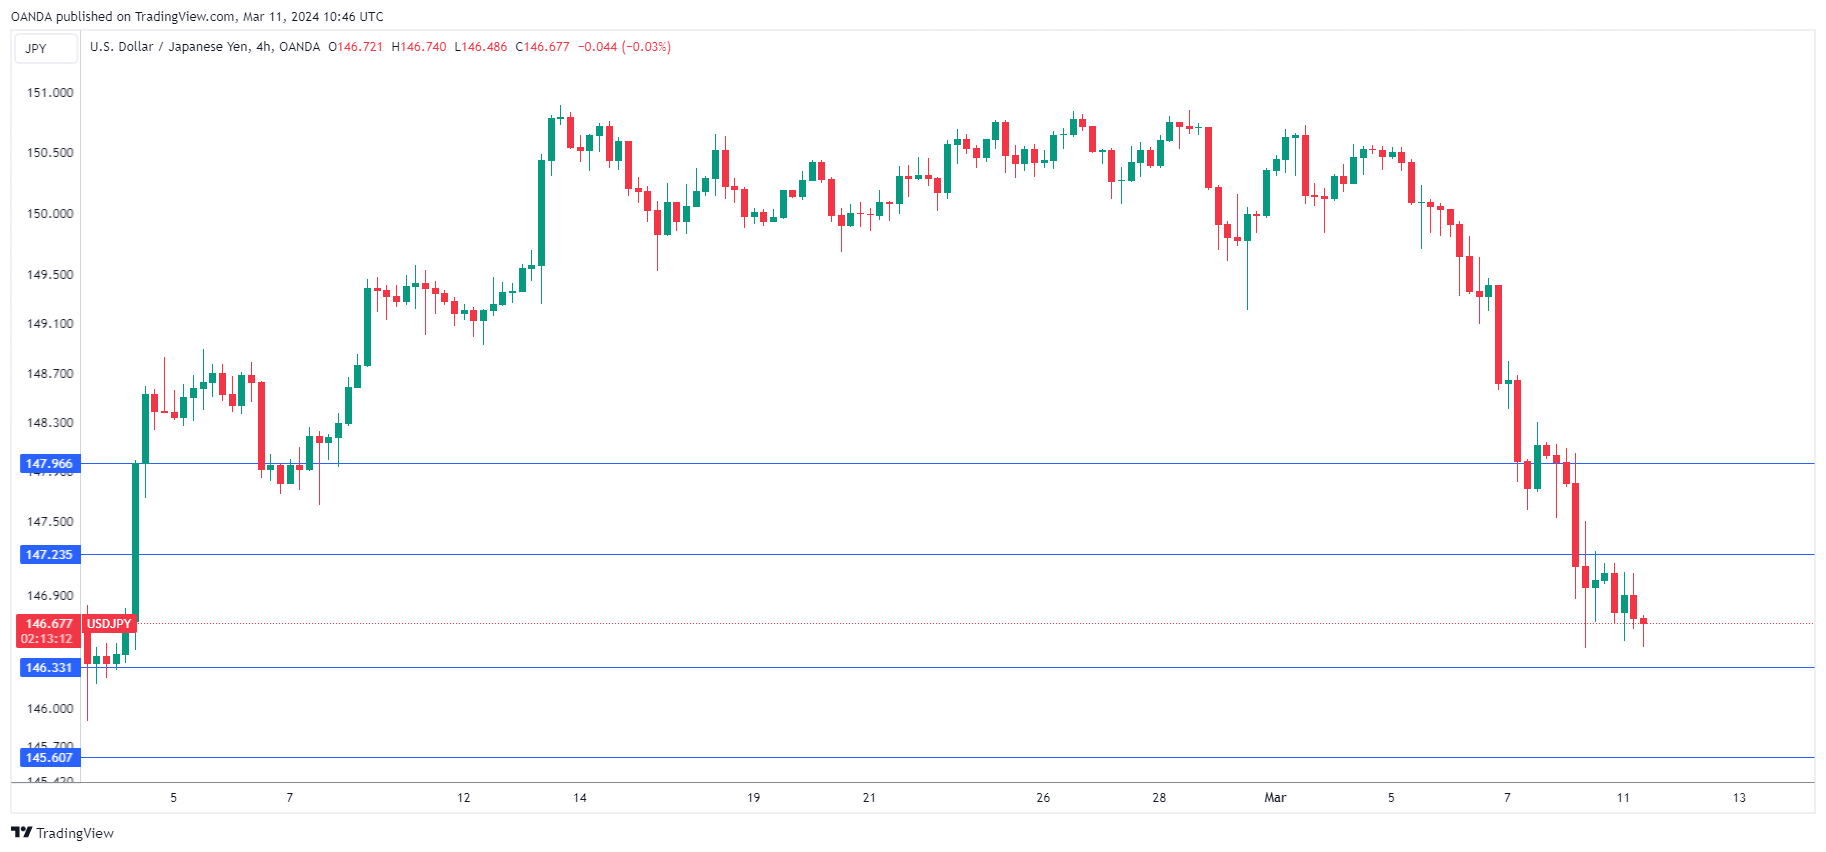
- There is resistance at 147.23 and 147.96
- 146.33 and 1.4560 are providing support
EUR/USD Hits 8-Week High
The euro is trading above USD 1.09, hitting its strongest point since mid-January on Friday, helped by news from both the US and Europe.
Friday's news showed that the US labor market is weakening:
→ The change in employment in the non-farm sector showed an increase in jobs = 275k for the month, although last month it was = +353k.
→ The unemployment rate rose to 3.9%, although it was 3.7% for 3 months.
News of a weakening labour market could put pressure on the Fed to ease monetary policy.
Meanwhile in Europe, the ECB kept borrowing costs at a record high, citing significant progress in containing inflation, and revised its inflation expectations downward, forecasting price growth of 2.3% in 2024, and 1.9% in 2025. And during a press conference last Thursday, ECB President Lagarde told reporters that policymakers had not discussed rate cuts at that meeting.
Thus, there is reason to believe that the Fed will start lowering rates earlier (it started raising them earlier than the ECB). And this assumption is shared by many market participants, judging by the bullish dynamics in the EUR/USD market.
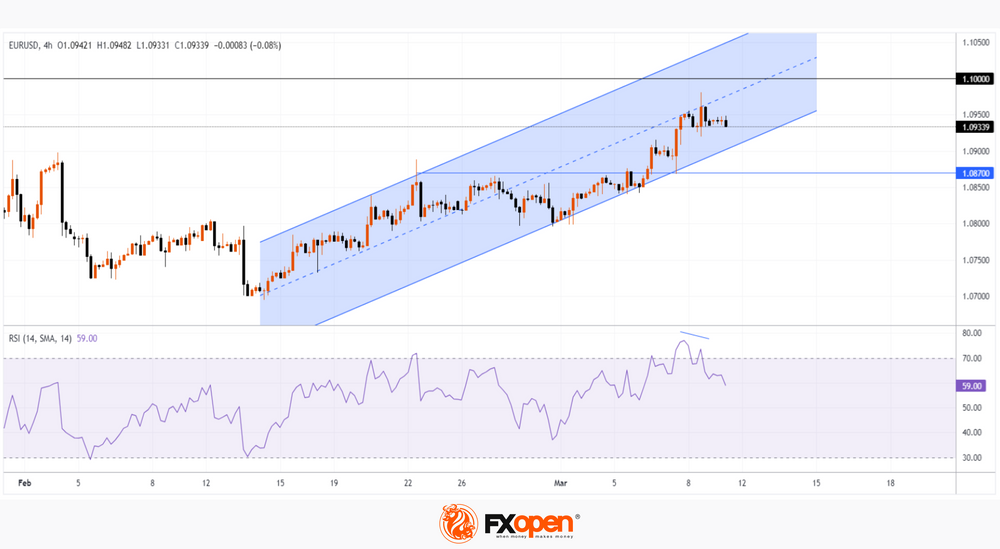
Today's chart shows:
→ the price of EUR/USD has been moving within an ascending channel (shown in blue) since mid-February. Moreover, it seems that the median line acts as resistance — Friday’s peak indicates this;
→ the price rose to the important psychological level of 1.1000 – it served as resistance in January;
→ the RSI indicator is in the overbought zone, forming a bearish divergence.
If there is some correction this week after an increase of more than 0.9% last week, then the price of EUR/USD may fall to its lower limit. Failure of the bulls to resume the uptrend from this line could mark the prospect of a decline in price towards the important support of 1.0870.
Trade over 50 forex markets 24 hours a day with FXOpen. Take advantage of low commissions, deep liquidity, and spreads from 0.0 pips. Open your FXOpen account now or learn more about trading forex with FXOpen.
This article represents the opinion of the Companies operating under the FXOpen brand only. It is not to be construed as an offer, solicitation, or recommendation with respect to products and services provided by the Companies operating under the FXOpen brand, nor is it to be considered financial advice.
Dow Futures (YM_F) : Buying The Dips At The Blue Box Area
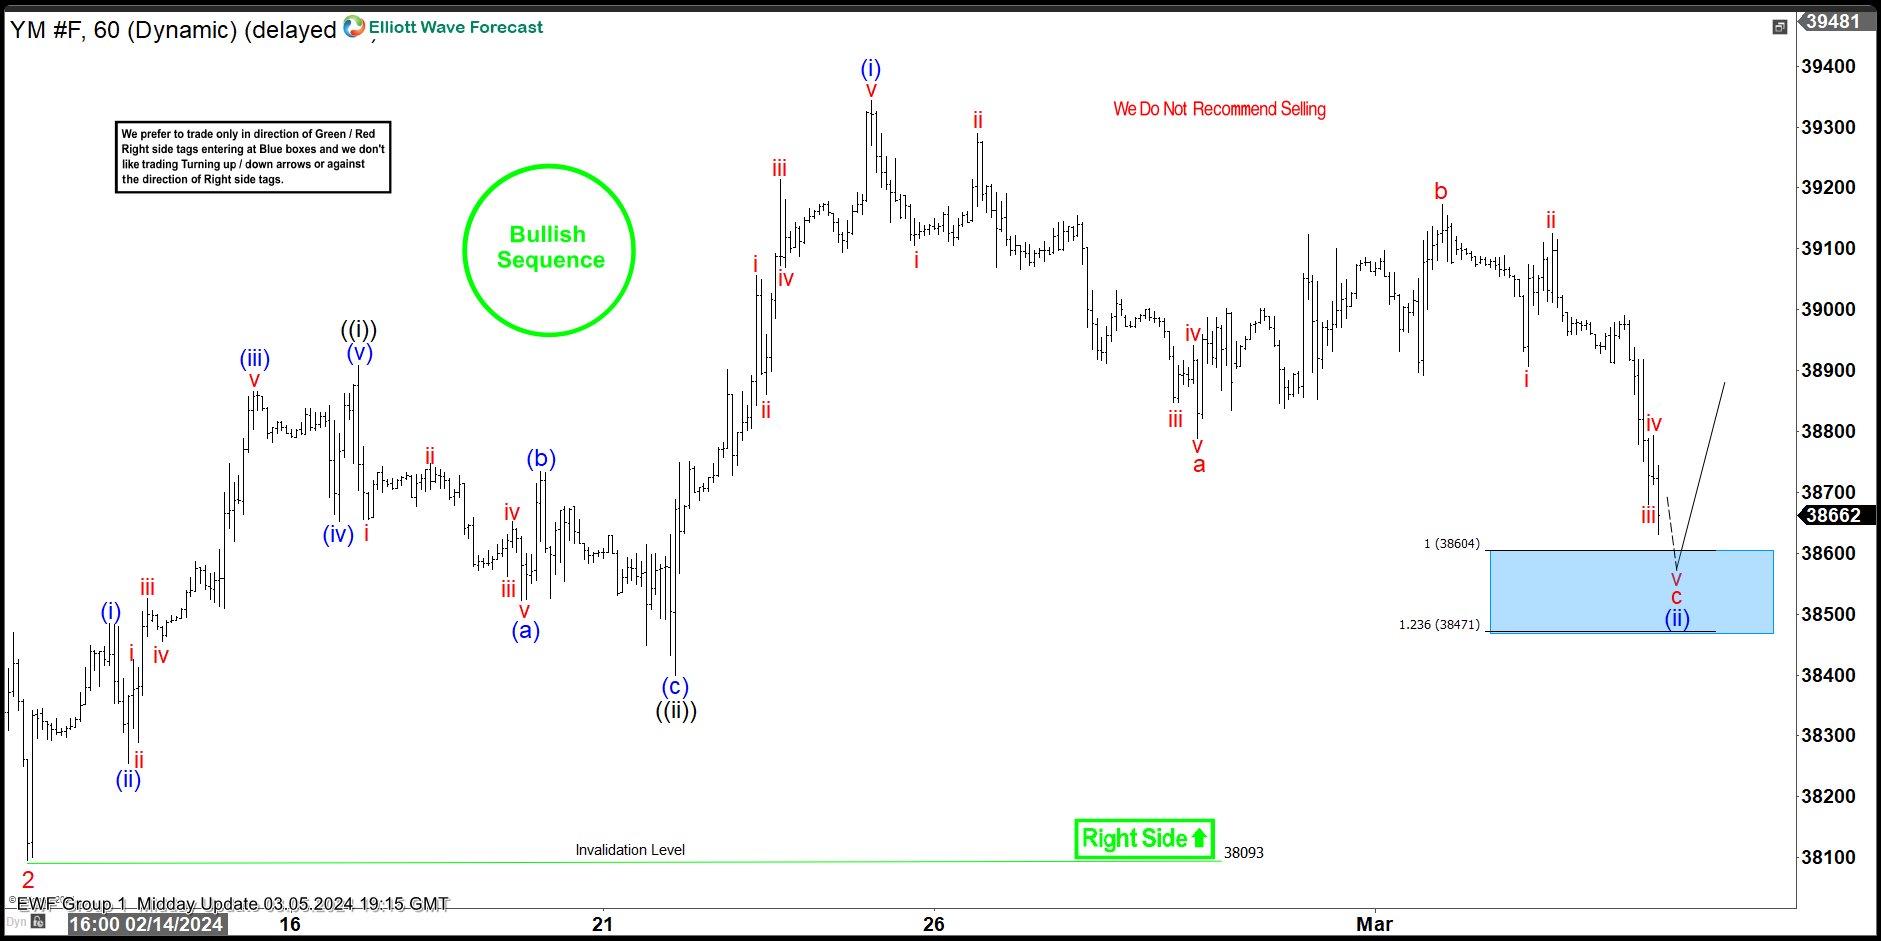
Hello fellow traders. In this technical article we’re going to take a look at the Elliott Wave charts charts of Dow Jones Futures published in members area of the website. As our members know YM_F has recently made pull back that has unfolded as Elliott Wave Zig Zag pattern. It made clear 3 waves down from the February 23rd peak and completed correction right at the Equal Legs zone ( Blue Box -Buying Area) . In further text we’re going to explain the Elliott Wave pattern and trading setup.
YM_F Elliott Wave 1 Hour Chart 03.05.2024
Dow Jones Futures is showing lower low structure from the peak. Correction has a b c labeling, when we can still be in c red leg. The price structure is incomplete at the moment, calling for a more downside in near term toward : 38604-38471 buying zone. We don’t recommend selling YM_F and prefer the long side from the marked Blue Box ( buying zone). Once Dow Jones reaches our buying area, it should ideally make either rally toward new highs or in 3 waves bounce alternatively. Once bounce reaches 50 Fibs against the b red high, we will make long position risk free ( put SL at BE) and take partial profits.
Official trading strategy on How to trade 3, 7, or 11 swing and equal leg is explained in details in Educational Video, available for members viewing inside the membership area.
Quick reminder on how to trade our charts :
Red bearish stamp+ blue box = Selling Setup
Green bullish stamp+ blue box = Buying Setup
Charts with Black stamps are not tradable. 🚫
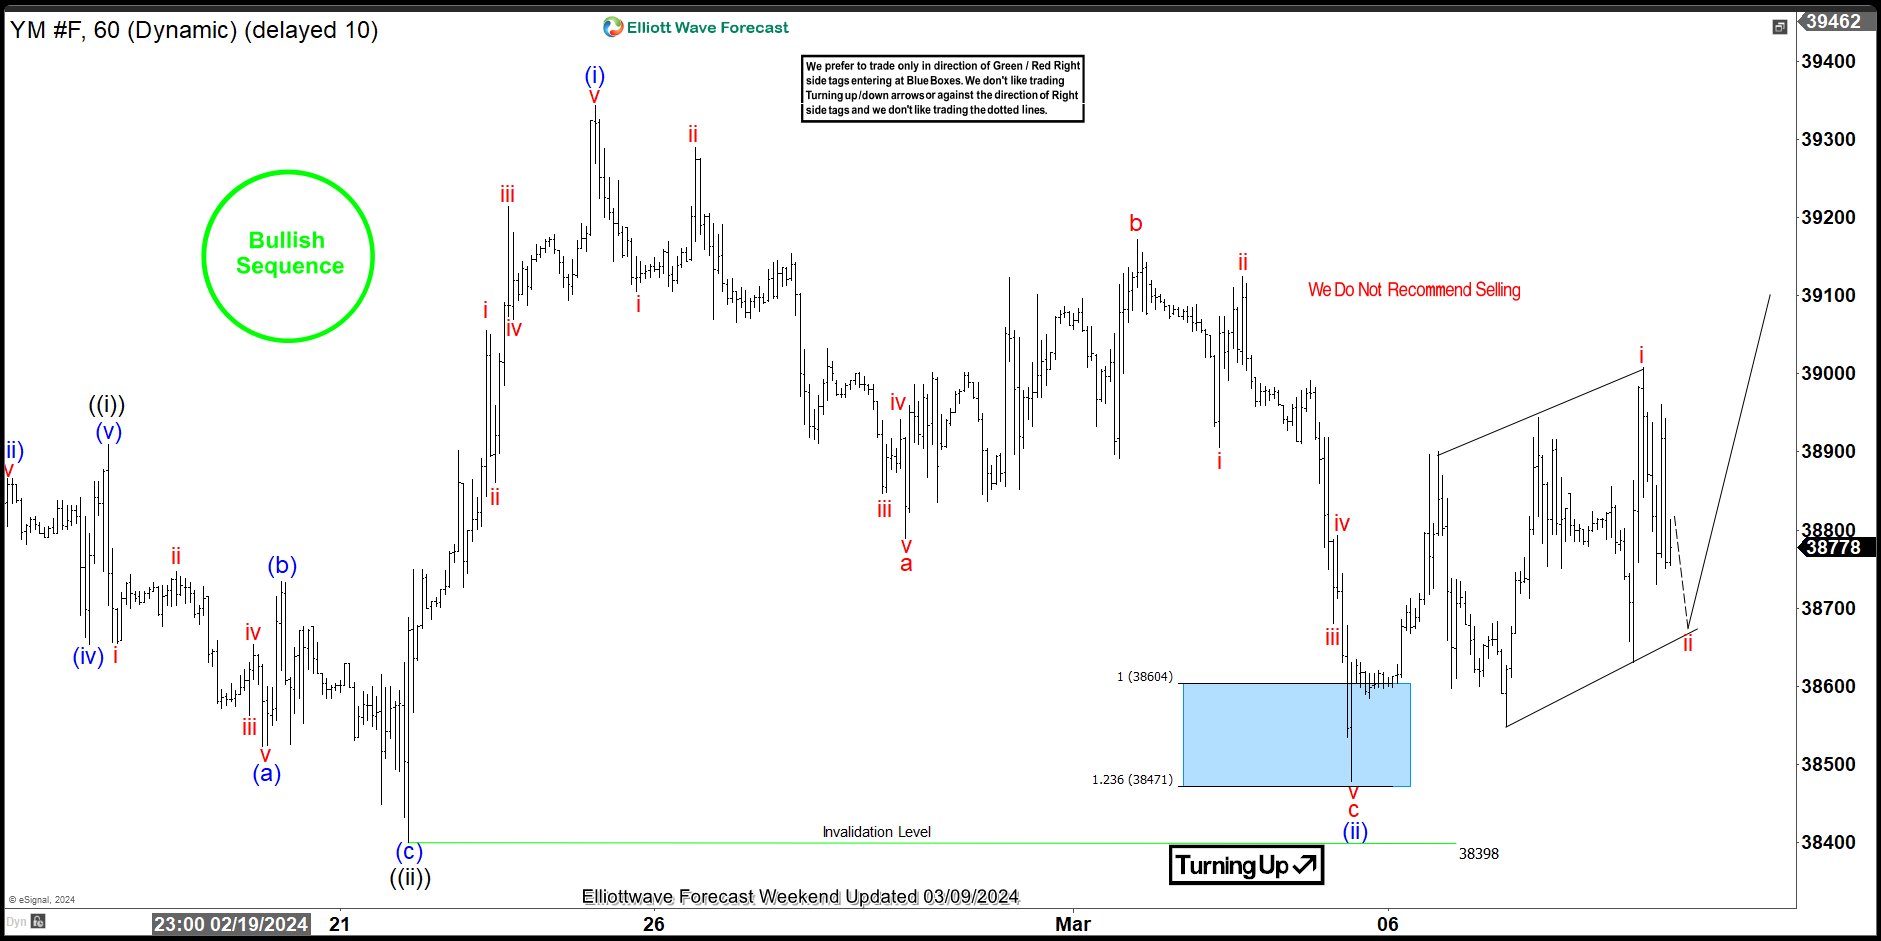
YM_F Elliott Wave 1 Hour Chart 03.09.2024
Dow Jones made extension toward our buying zone at : 38604 – 38471 as we expected. YM_F found buyers at the blue box and we are getting good reaction from there. Consequently, any long positions from the equal legs area should be risk free by now. As far as the price stays above 38473 low, we can see further strength in Dow Jones toward new highs ideally.
Bitcoin’s New Highs and BNB’s Revival
Market picture
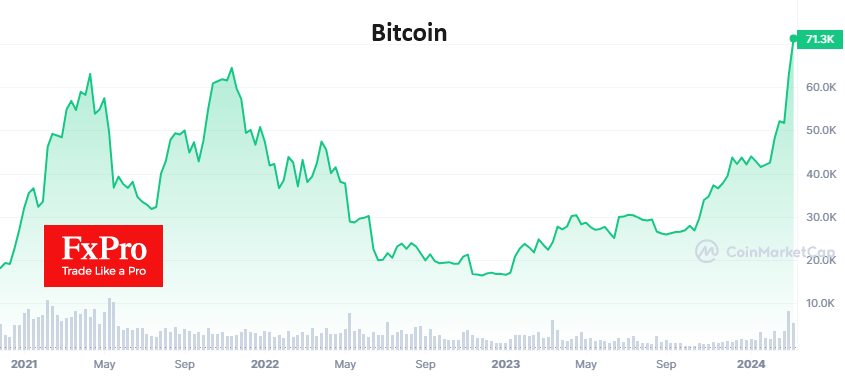
Bitcoin’s record highs support the accelerated recovery of the crypto market. Its capitalisation reached $2.69 trillion (+1.6% in 24 hours), 10% below the record high of $2.97 trillion in November 2021. Extreme greed remains the driver of the crypto market, but major coins are getting the main influx of money.
Bitcoin hit an all-time high of $71.5K early Monday afternoon, adding 2.5% in 24 hours. Ethereum is rising with the market, adding 1.4% in the same time frame and breaking the $4000 price.
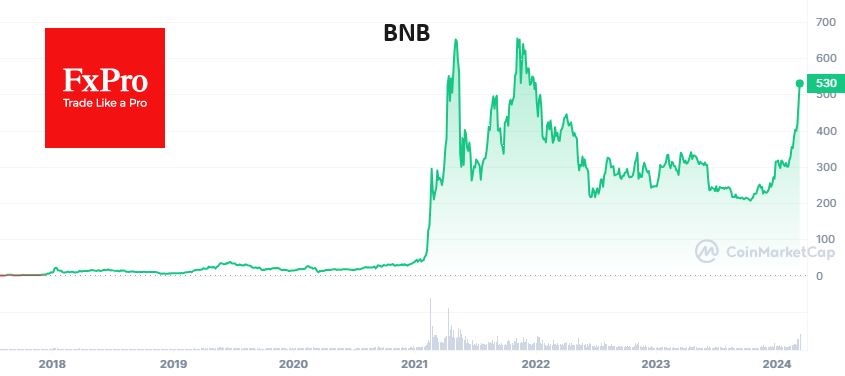
The surge in trading activity has helped to revitalise BNB, which is adding over 4% for the day. It has gained 25% in 7 days, twice that of Ethereum and three times ahead of Bitcoin during this interval. However, like Ether, it is about 15% away from the record highs of late 2021.
News background
BlackRock’s spot BTC-ETF iShares Bitcoin Trust (IBIT) managed to accumulate almost 200,000 bitcoins in two months, becoming one of the largest holders of BTC in the world and surpassing MicroStrategy, which has 193,000 BTC on its balance sheet.
According to The Block, investors have built up a substantial volume of open positions with an expiry price of $70K on Bitcoin call options redeemable on 29 March. Bets on BTC rising to $80K over the next three weeks have also increased.
According to Bloomberg data, bitcoin miners set a monthly record for energy consumption. They consumed a record 19.6 GW of electricity in February, up from 12.1 GW in the same period a year earlier. The rise in BTC has prompted mining companies to spend more than $1bn on new equipment over the year.
A US federal appeals court has resumed hearings on a lawsuit filed by a group of investors against Binance. The investors accuse the trading platform of violating US securities laws by selling unregistered tokens.
Billionaire Mark Cuban said he has always invested in Bitcoin because of its limited supply, which could be the driver of the first cryptocurrency’s bull rally. He believes demand for BTC will outstrip supply as more and more people buy bitcoin and fewer sell.
Gold Marches to Consecutive All-Time Highs
- Gold advances sharply after claiming 50-day SMA
- Generates consecutive record highs in recent sessions
- Momentum indicators flag overbought conditions
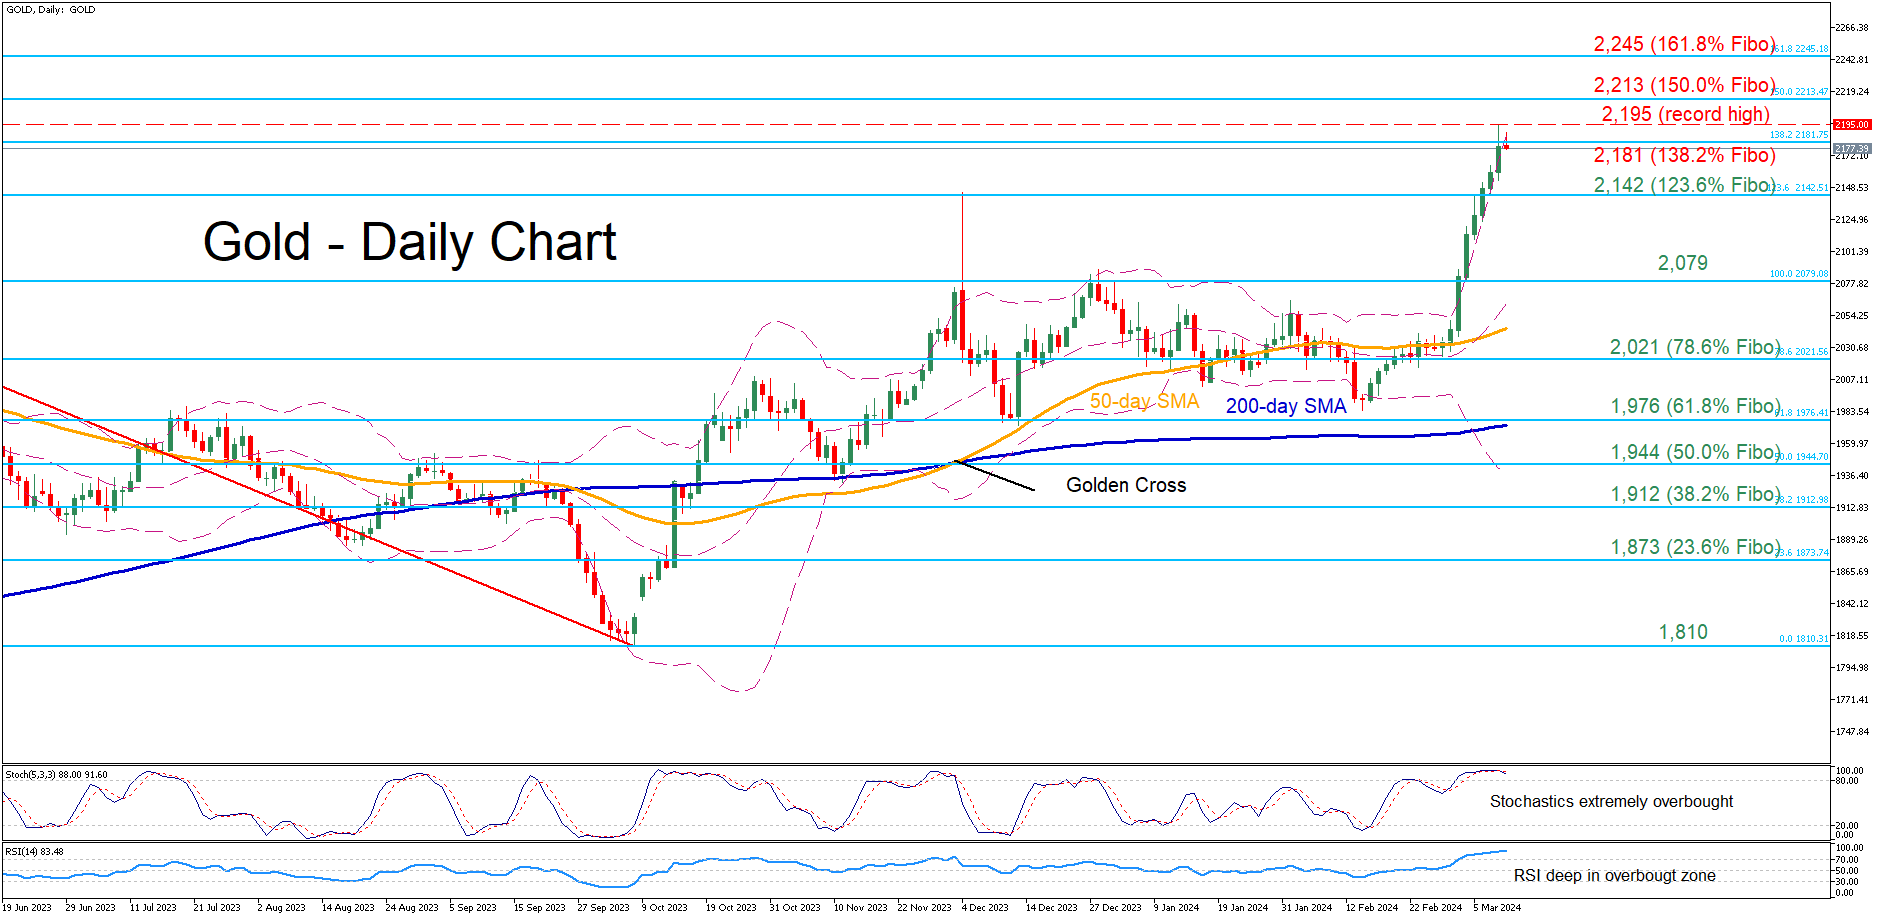
Gold has been in a steep uptrend following its profound break above the 50-day simple moving average (SMA), posting a barrage of fresh all-time highs in the past few sessions. However, traders should not rule out a pullback as the momentum indicators have been in their overbought zones for more than a week.
Should bullish pressures persist, bullion could initially claim 2,181, which is the 138.2% Fibonacci extension of the 2,079-1,810 downleg. Jumping above that region, the price may revisit its all-time high of 2,195. A violation of that zone could pave the way for the 150.0% Fibo of 2,213.
Alternatively, if gold experiences a mild correction, the 123.6% Fibo of 2,142 could act as the first line of defence. Further declines could then come to a halt at the previous resistance of 2,079, which held strong both in April and December 2023. Even lower, the 78.6% Fibo of 2,021 might provide downside protection.
In brief, gold has exploded in the short-term, surging to consecutive all-time highs amid heightened volatility. Nevertheless, there are emerging signs that the advance could be overdone as the short-term oscillators are deep in their overbought territories.
US 500 Cash Index in the Red Again
- US 500 index trades lower after recording a new all-time high
- The pace of the rally remains aggressive but euphoria dominates
- Bears continue to closely monitor the stochastic oscillator’s movements
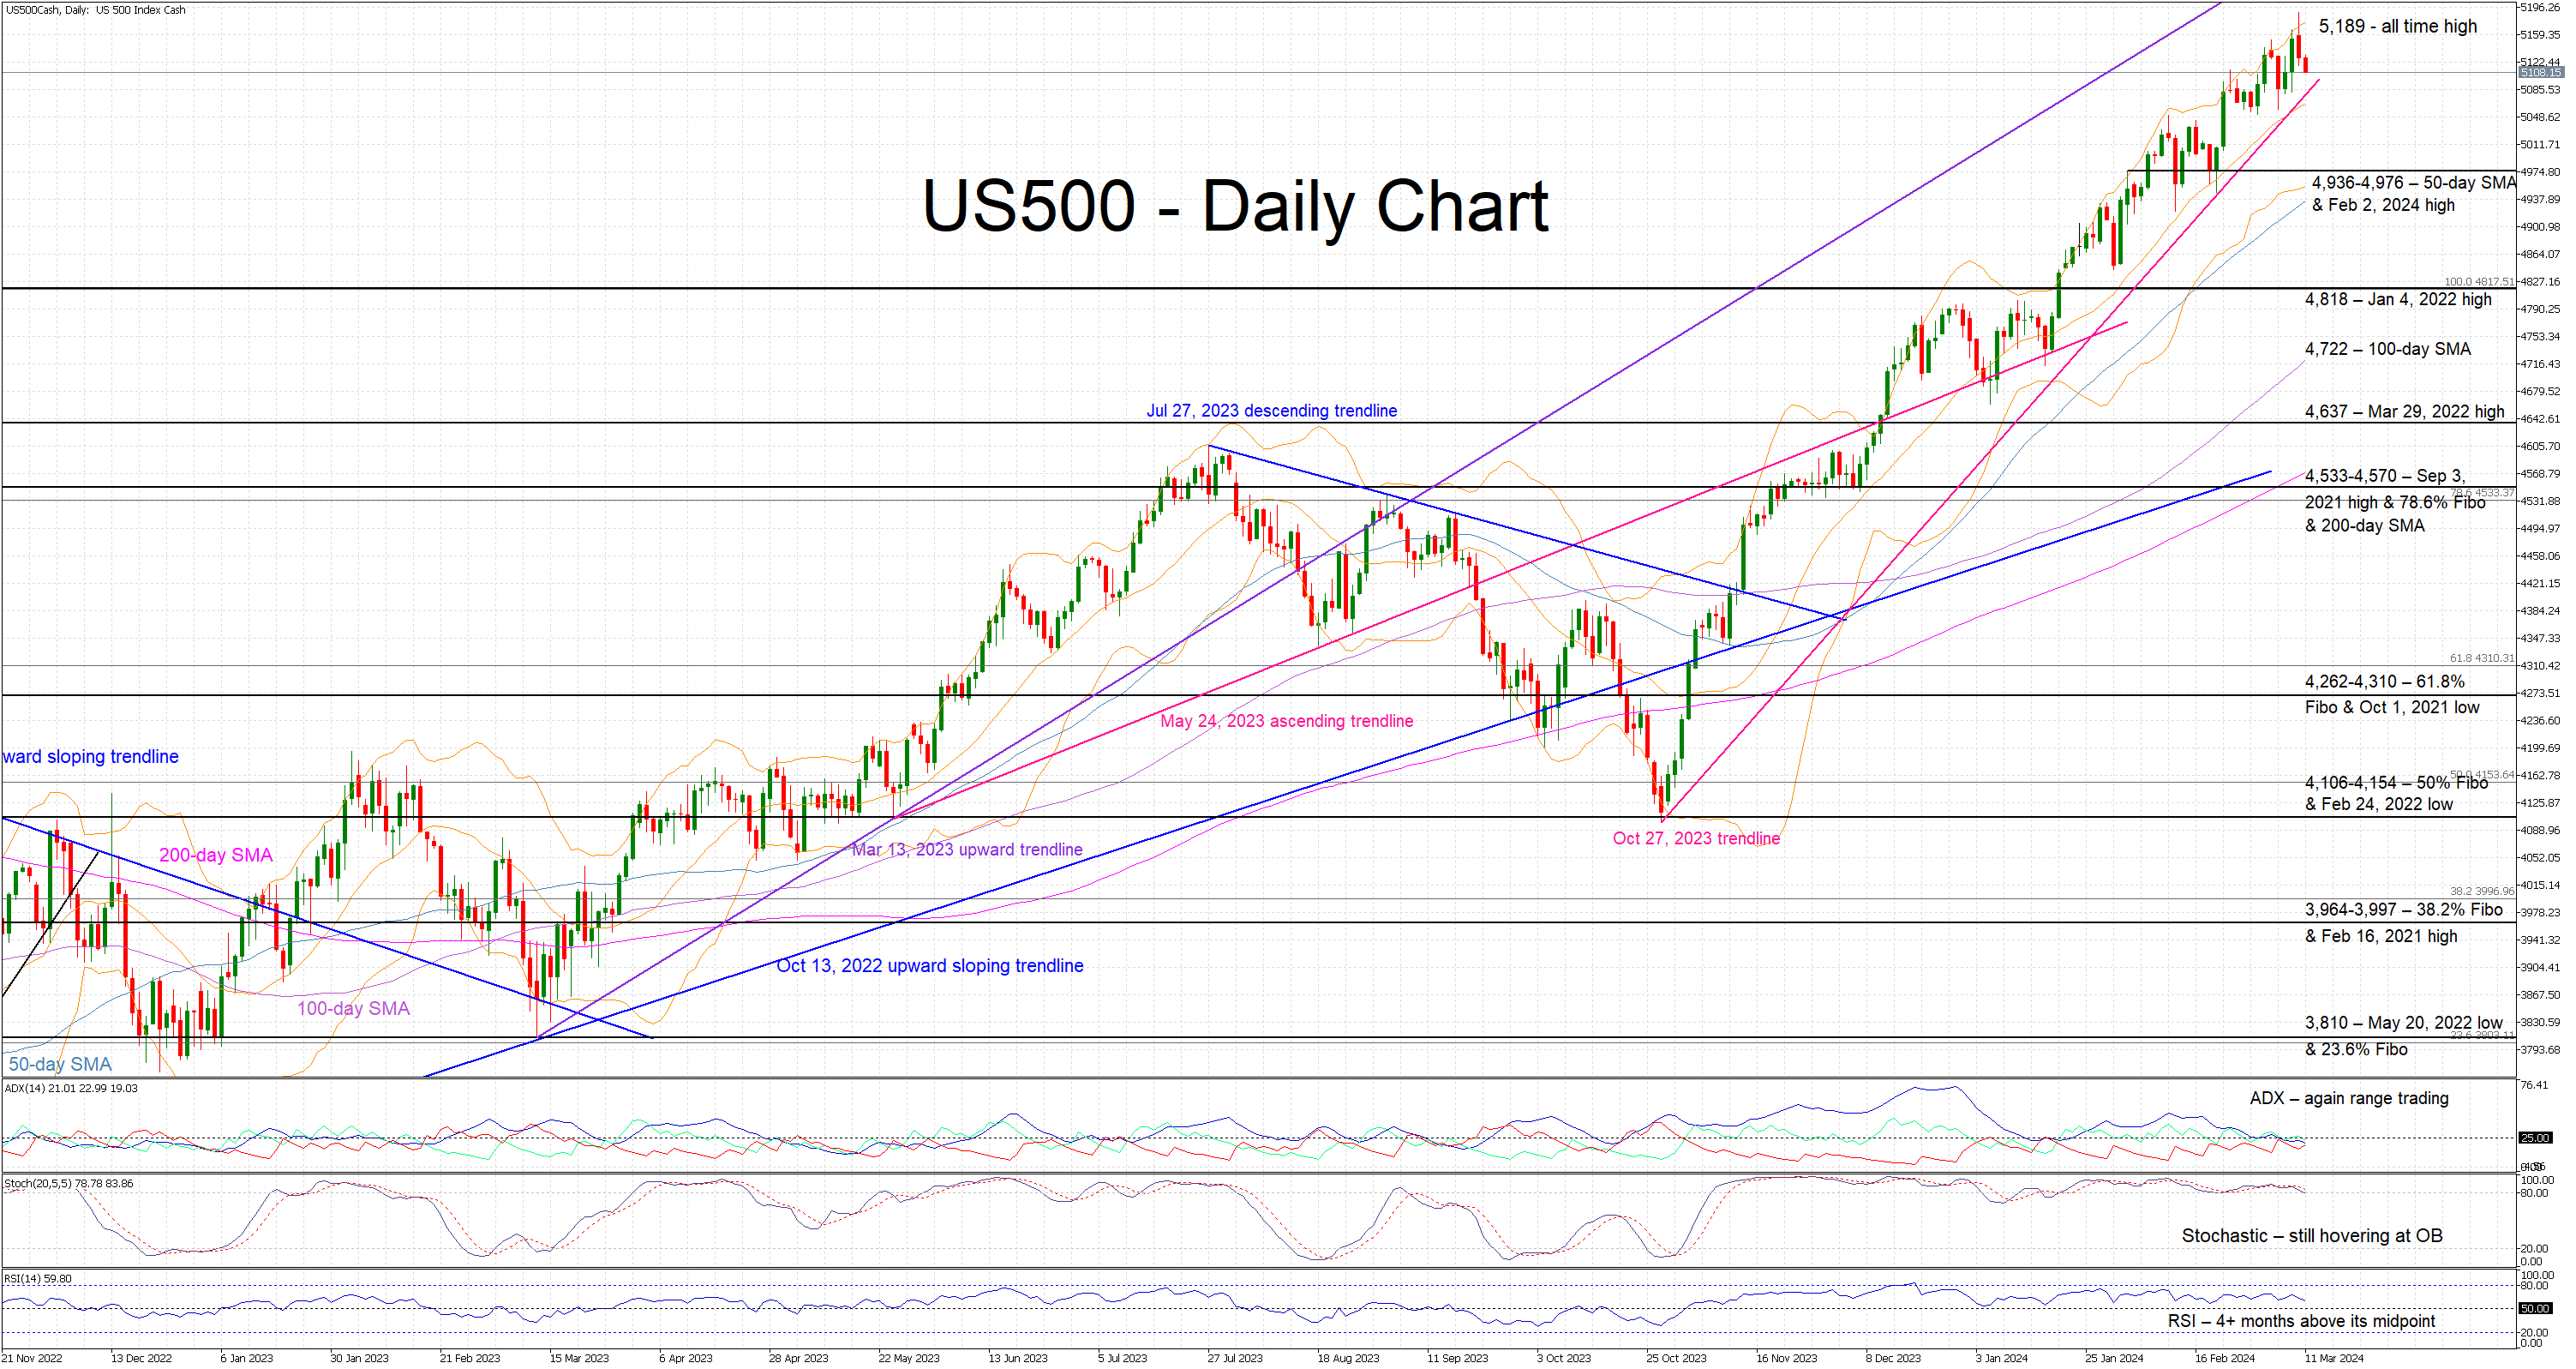
The US 500 cash index is edging lower again today after recording a new all-time high of 5,189 last week. Friday’s mixed US labour market data do not appear to have dented the market’s bullish appetite but some profit taking has clearly taken place. Having said that, the pace of the rally since the trough low at 4,100 remains aggressive as made evident by the October 27, 2023 ascending trendline being respected by the US 500 price action.
With the momentum indicators not sending strong bearish signals, the current bullish trend is assumed to be still in place. In more detail, the RSI is trading sideways, but it has completed four months of comfortably hovering above its 50-midpoint. More importantly, the stochastic oscillator is apparently trying to break below its overbought (OB) area. Should it finally manage to record this move, it would be seen as a strong bearish signal. In the meantime, the Average Directional Movement Index (ADX) is uninterested in the recent moves and remains in range-trading territory.
The bears are desperately trying to retake market control and to push the US 500 index below both the October 27, 2023 ascending trendline and the 5,000 threshold. If successful, they could then have a go at testing the support set by the 4,936-4,976 range, which is populated by the 50-day simple moving average (SMA) and the February 2, 2024 high. Even lower, the January 4, 2022 high at 4,818 could prove stronger to overcome than currently anticipated.
On the flip side, the bulls remain confident and might prepare for new record-high levels. They could first try to keep the US 500 index above the October 27, 2023 trendline and then push the index above 5,189, with the 5,200 level looking like the next easy target.
To conclude, with the US 500 index continuing its advance, the bears are anxiously waiting for a signal from the momentum indicators to, at least, stop the bulls from recording successive record highs.
More Whispers on BoJ Considering Scrapping Yield Curve Control
Markets
Vocal ECB members provided core bonds with some early momentum on Friday. Especially ECB Villeroy gave some support by suggesting that an April rate cut is still in play less than 24 hours after ECB Lagarde actually ruled that scenario out at the ECB’s presser. Fed Chair Powell earlier last week did more or less the same by bringing May back in to play when suggesting that the Fed is not far from being confident enough that inflation is sustainably heading to 2%. Core bonds spiked to intraday highs after February payrolls gave more evidence of a soft landing scenario, enabling the Fed to gradually start lowering rates. Net job growth beat consensus in February (275k vs 200k) but downward revisions to December and January figures (-167k) dwarfed the headline beat. The unemployment rate ticked up to 3.9%, the highest level since January 2022, with wage growth slowing to 0.1% M/M and 4.3% Y/Y. Moves higher didn’t last in the close, suggesting that the March correction higher could be up for a pause. Today’s light eco calendar effectively suggests some kind of truce going into tomorrow’s February US CPI inflation numbers, which together with Thursday’s retail sales are the final key input for the March 20 FOMC meeting.
The US dollar spiked lower on the payrolls, but similarly managed a return to opening levels (DXY 102.75; EUR/USD 1.0940). JPY outperformed after Reuters strengthened expectations that the BoJ at its March policy meeting will lift its policy rate out of negative territory. This morning, there are more BoJ whispers that the central bank is also considering scrapping its yield curve control policy altogether and replacing it by announcing it advance an indication on the amount of bonds it plans to purchase. Japan’s largest union federation on Friday announces results of its annual wage negotiations (shunto) in what is expected to make or break the BoJ’s normalization plans. USD/JPY this morning holds below 147, just above the YTD low (145.90). Sterling was better bid last Friday, perhaps by default as the currency didn’t have to worry about any dovish central bank comments. EUR/GBP closed at 0.8508, near the key 0.85 support zone. The area can be tested this week with the UK labour market report (tomorrow) and production data (Wednesday) on the agenda.
News & Views
The Portuguese center-right coalition Democratic Alliance (DA) narrowly won snap elections. The DA coalition likely secured 79 seats in Parliament. The Socialist Party of outgoing Prime Minister Costa is projected at 77 seats. The far-right Chega Party came out as third and quadrupled its seats to 48. DA leader Luis Montenegro earlier ruled out a coalition between AD and Chega, suggesting that Portugal might be heading for a minority government. Socialist party leader Pedro Nuno Santos, already indicated that his party won’t support DA in parliament.
Chinese CPI inflation rebounded to 0.7% Y/Y in February compared to a 0.8% Y/Y decline in prices in January. On a monthly basis, prices rose 1%. The rebound was more pronounced than the 0.3% Y/Y expected. However, it is far from sure that the up-tick in inflation will mean the end of the deflationary trend in the country. The move for an important part was driven by a deceleration in food price deflation, while seasonal demand related to the Lunar New Year also offers part of the explanation (e.g. a sharp rise in travel prices). However PPI producer prices still remain well in negative territory, easing from -2.5% Y/Y to -2.7% Y/Y.
Rating agency Fitch raised the Turkish long-term foreign currency rating to B+ from B with a positive outlook. The upgrade reflects increased confidence in the durability and the effectiveness of policies implemented since the pivot in June 2023, including greater-than-expected frontloading of monetary policy tightening and reducing macroeconomic and external vulnerabilities. Inflation expectations have eased and external liquidity risks moderated. The positive outlook reflects the expectations that the country’s policy should be consistent with a significant decline in inflation as well as a continued reduction in external vulnerabilities.