Sample Category Title
USD/JPY Daily Outlook
Daily Pivots: (S1) 146.33; (P) 147.23; (R1) 147.96; More...
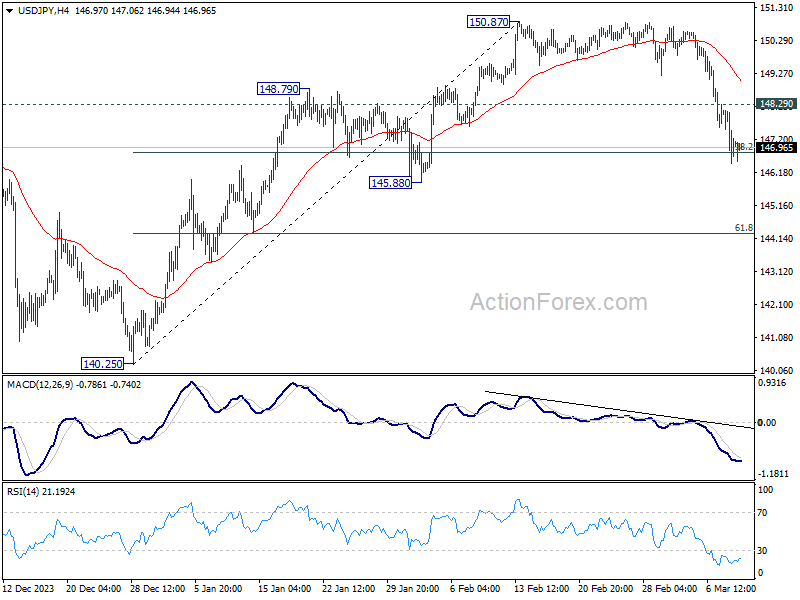
Intraday bias in USD/JPY stays on the downside at this point. Sustained break of 38.2% retracement of 140.25 to 150.87 at 146.81 will argue that fall from 150.87 is reversing the whole rally from 140.25. In this case, deeper decline would be seen to 61.8% retracement at 144.30 and below. Nevertheless, strong support from 146.81, followed by break of 148.29 minor resistance resistance, will argue that fall from 150.87 is merely a correction, which has completed already.
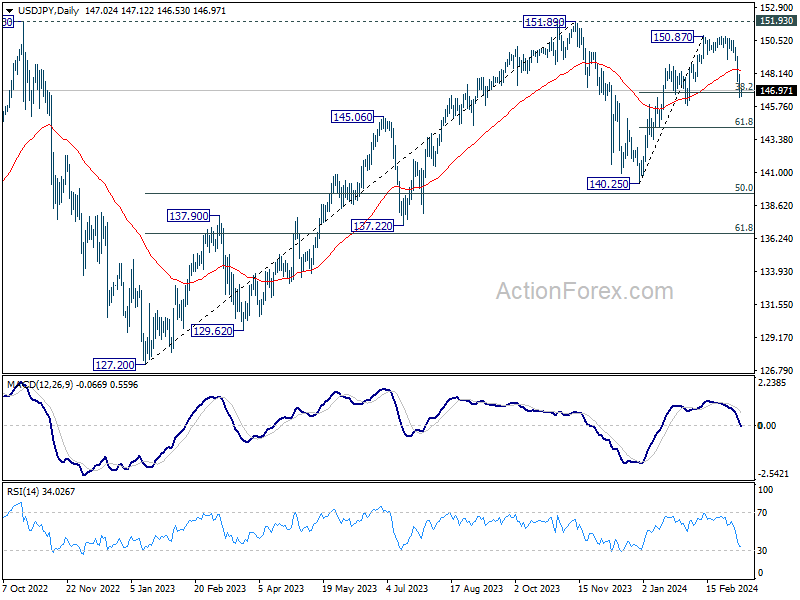
In the bigger picture, no change in the view that price action from 151.89 (2023 high) are correction to up trend from 127.20 (2023 low). The question is whether this correction has completed at 140.25, or extending with fall from 150.87 as the third leg. Sustained break of above mentioned 146.81 fibonacci level will favor the latter case. But even so, downside should be contained by 50% retracement of 127.20 to 151.89 at 139.54.
AUD/USD Daily Report
Daily Pivots: (S1) 0.6602; (P) 0.6635; (R1) 0.6657; More...
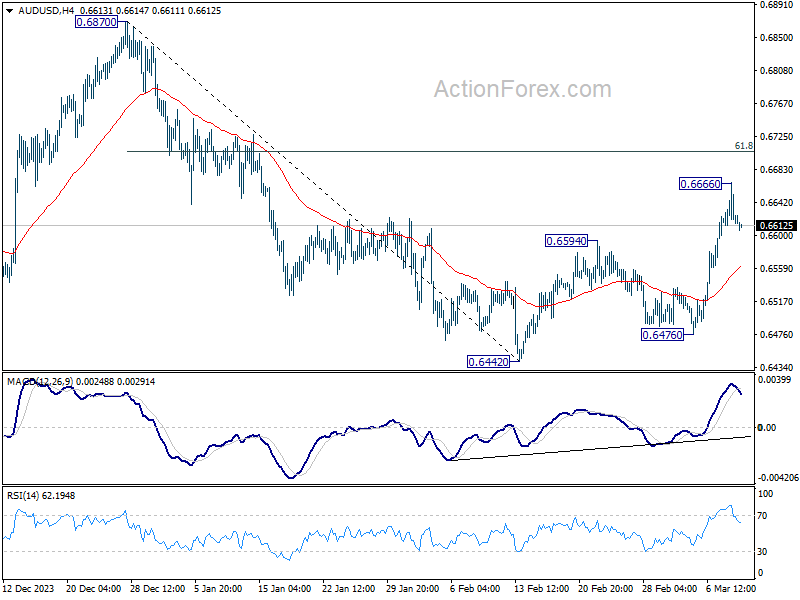
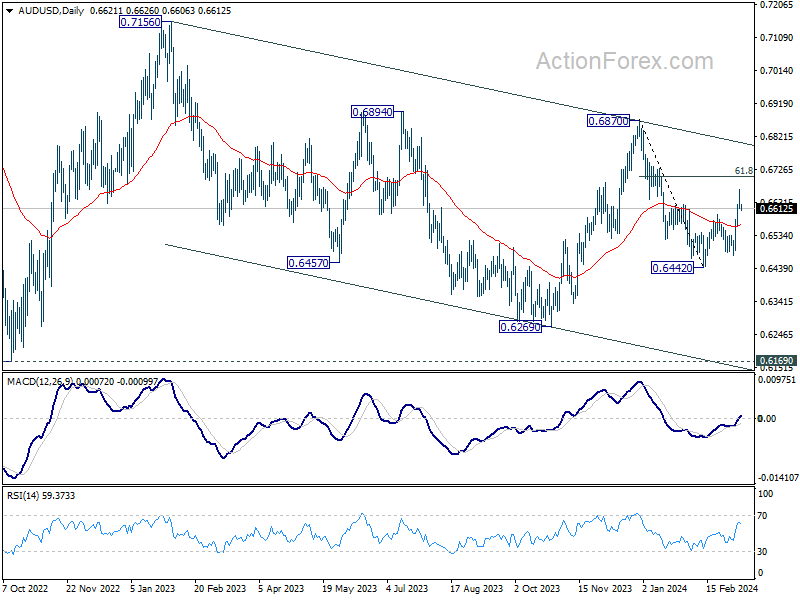
Intraday bias in AUD/USD is turned neutral first with current retreat. Another rise will be mildly in favor as long as 55 4H EMA (now at 0.6561) holds. Above 0.6666 will resume the rebound from 0.6442 to 61.8% retracement of 0.6877 to 0.6442 at 0.6707 next. Sustained trading above there will argue rise from 0.6442 is probably resuming whole rally from 0.6269. Nevertheless, sustained break of 55 4H EMA will revive near term bearishness and bring retest of 0.6442 low instead.
In the bigger picture, price actions from 0.6169 (2022 low) are seen as a medium term corrective pattern to the down trend from 0.8006 (2021 high). Fall from 0.7156 (2023 high) is seen as the second leg, which might still be in progress. Overall, sideway trading could continue in range of 0.6169/7156 for some more time. But as long as 0.7156 holds, an eventual downside breakout would be mildly in favor.
USD/CAD Daily Outlook
Daily Pivots: (S1) 1.3439; (P) 1.3469; (R1) 1.3517; More...
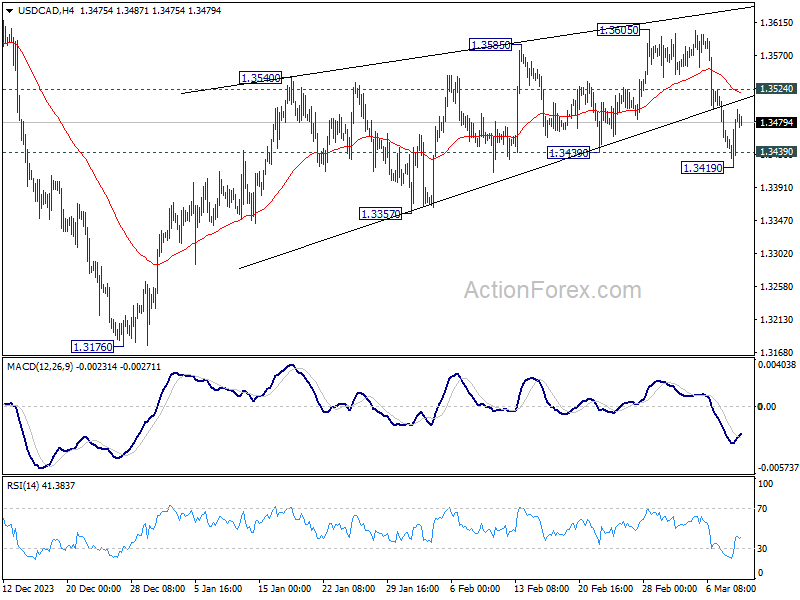
Intraday bias in USD/CAD remains neutral for the moment. On the downside, break of 1.3419 and sustained trading below 1.3439 support will argue that rebound from 1.3176 has completed as a corrective move to 1.3605. Near term outlook will be turned bearish for 1.3357 support first. On the upside, though, break of 1.3524 minor resistance will revive near term bullishness, and turn bias back to the upside for retesting 1.3605 resistance instead.
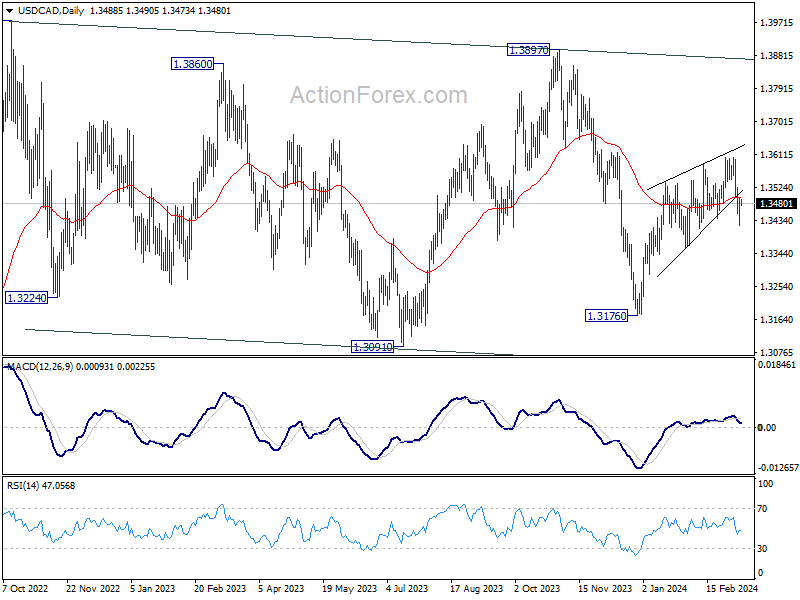
In the bigger picture, price actions from 1.3976 (2022 high) are viewed as a corrective pattern only. In case of another fall, strong support should emerge above 1.2947 resistance turned support to bring rebound. Overall, larger up trend from 1.2005 (2021 low) is still expected to resume through 1.3976 at a later stage.
Yen Strengthens on Recession Avoidance, Dollar and Sterling Await Data-Driven Clarity
Yen rises broadly in Asian session today, lifted by economic data indicating Japan's narrow escape from recession last year. This economic turnaround, while not directly influencing BoJ decision on interest rates decision next week, certainly does not obstruct the pathway for a hike. Yen's momentum, though currently modest, could amplify with anticipated positive developments from wage negotiations throughout the week, with prospect of another round of vigorous rally.
In contrast, the Australian Dollar, New Zealand Dollar, and Sterling are showing relative weakness, whereas Canadian Dollar, Euro, and Swiss Franc are having slight gains, and Dollar is mixed. The currency movements today seem more reflective of a consolidation phase, following last week's activities, rather than the formation of new trends.
With today's economic calendar appearing light, trading activity might lean towards the quieter side. However, expectations of volatility loom on the horizon, with significant data releases from the US and UK slated for later in the week.
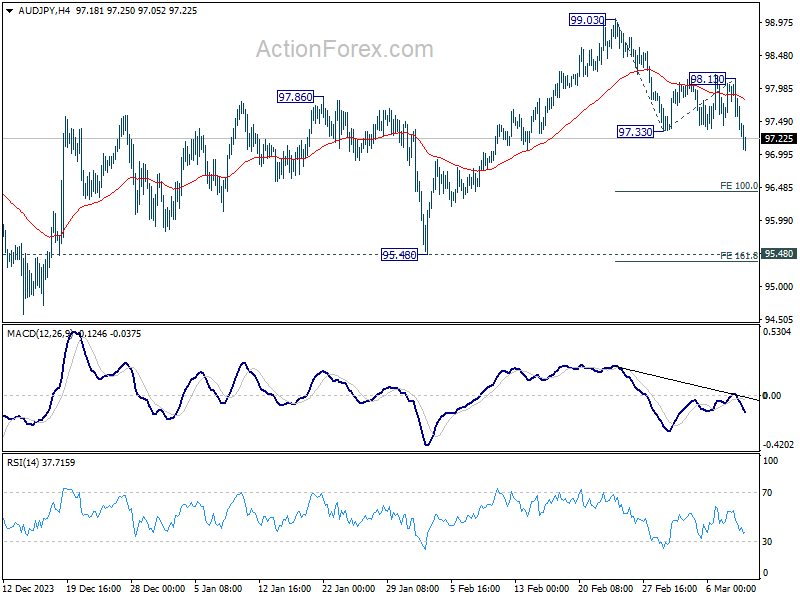
Technically, AUD/JPY's declined from 99.03 short term top resumed by breaking through 97.33 low late last week. Deeper fall is now expected as long as 98.13 resistance holds, to 100% projection of 99.03 to 97.33 from 98.13 first. Firm break there will pave the way to 161.8% projection at 95.37.
In Asia, at the time of writing, Nikkei is down sharply by -2.60%. Hong Kong HSI is up 1.43%. China Shanghai SSE is up 0.14%. Singapore Strait Times is down -0.12%. Japan 10-year JGB yield is up 0.0299 at 0.764.
Japan's Q4 GDP finalized at 0.1% qoq, a narrow escape from recession
Japan's economy has narrowly avoided a recession, as shown in the final GDP figures for Q4. The revised data indicates a modest growth of 0.1% qoq, a positive swing from the preliminary estimate of -0.1% qoq contraction. On annualized basis, GDP expanded by 0.4%, contrasting sharply with initial reports of -0.4% decline.
The main driver behind this upward revision was significant increase in capital expenditure, which surged by 2% qpq, deviating markedly from the initially estimated -0.1% qoq drop. However, private consumption, accounting for approximately 60% of Japan's economy, presented a less optimistic picture, declining by -0.3% qoq, a slight deterioration from the provisional figure of -0.2% qoq.
This latest economic data comes at a crucial time, but it does not seem to deter BoJ from considering an interest rate hike for the first time since 2007, scheduled for March 19. The anticipation builds around the annual Spring wage negotiations, which have so far shown strong momentum. Positive outcomes are also expected from the forthcoming results from Rengo, Japan's largest union group, on March 15.
China's CPI turned positive to 0.8% yoy amid Lunar New Year demands
In February, China's CPI marked its first annual increase after a six-month sequence of declines. CPI rose by 0.7% yoy, surpassing expectation of 0.3% yoy and marking a significant rebound from January's -0.8% yoy, the largest decrease in consumer prices since 2009. On a month-on-month basis, CPI acceleration was evident, jumping from a modest 0.3% mom to 1.0% om, well above the forecasted 0.7% mom.
This inflationary uptick, primarily driven by heightened demand during the Lunar New Year celebrations, underscores the seasonal influence on China's economic activities. Notably, food prices witnessed a considerable increase of 3.3% mom, a reflection of the festive period's impact.
Conversely, PPI had a contrary movement, declining by -2.7% yoy, indicating deeper deflationary pressures than the anticipated -2.5%.
EUR/GBP and GBP/CHF await UK data
Sterling would likely be on the move this week as key UK economic indicators, including GDP, employment, and wages data, are set to be released. These figures are eagerly watched, as any deviation from expectations could influence the market's anticipations for the upcoming inflation report and BoE's subsequent meeting next week.
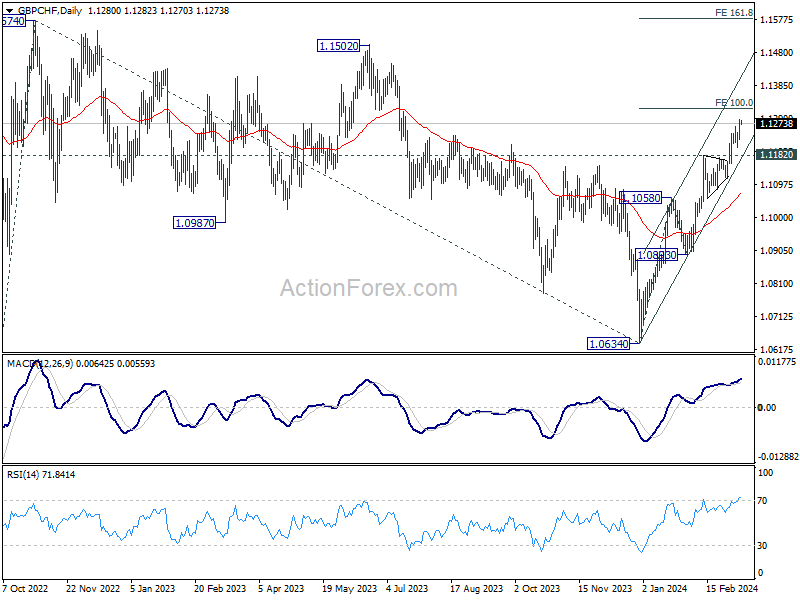
GBP/CHF's rally from 1.0634 continued last week and hit as high as 1.1287. Immediate focus is now on 100% projection of 100% projection of 1.0634 to 1.1058 from 1.0893 at 1.1317. Decisive break there would prompt upside acceleration towards 161.8% projection at 1.1579. While overbought condition, as seen in D RSI, might limit upside at 1.1317 on initial attempt, near term outlook will stay bullish as long as 1.1182 resistance turned support holds.
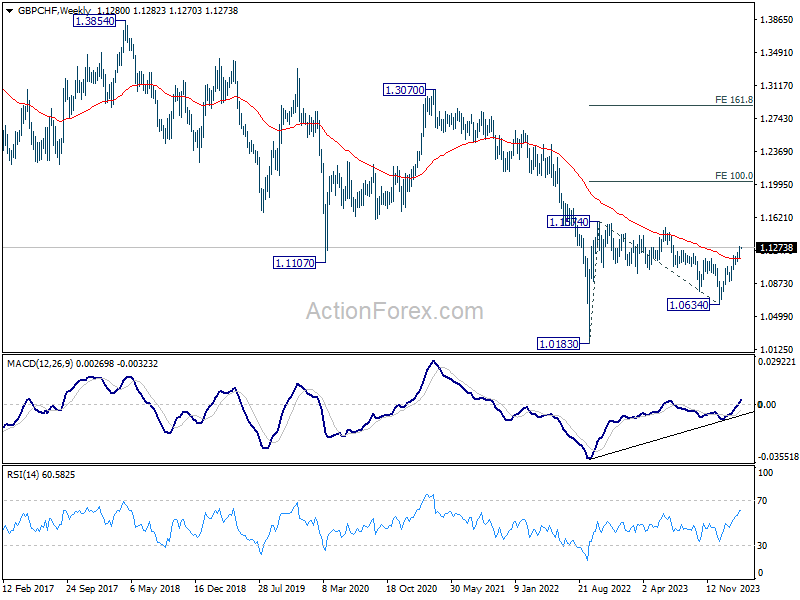
In the larger picture, the break of 55 E EMA is a medium term bullish sign. This also strengthen the case that correction from 1.1574 has completed at 1.0634 already. Rise from 1.0183 (2022 low) could be ready to resume. Retest of 1.1574 should be seen next, and firm break there will pave the way to 100% projection of 1.0183 to 1.1574 from 1.0634 at 1.2025 in the medium term.
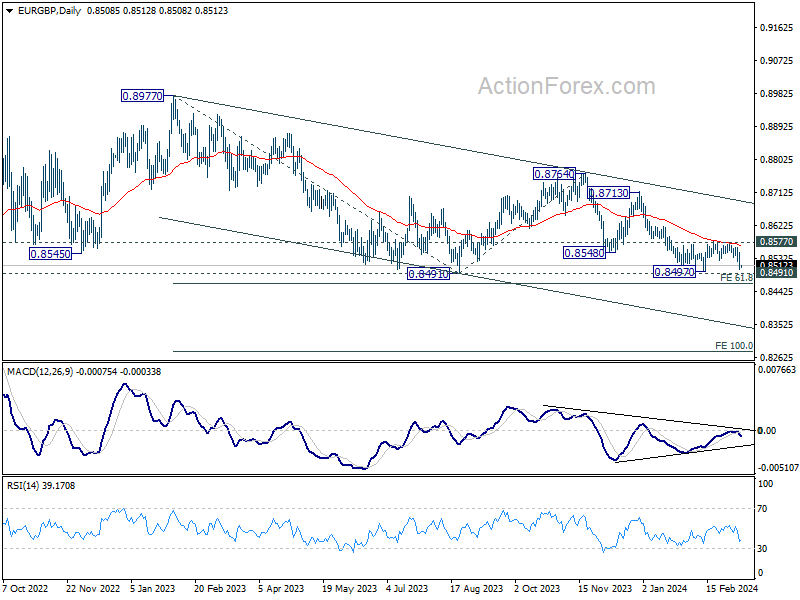
EUR/GBP's rejection by 55 D EMA is a near term bearish sign, which suggests that fall from 0.8764 is still in progress. Break of 0.8497 support will resume this decline to 61.8% projection of 0.8977 to 0.8491 from 0.8764 at 0.8464. Firm break there could trigger downside acceleration to 100% projection at 0.8278.
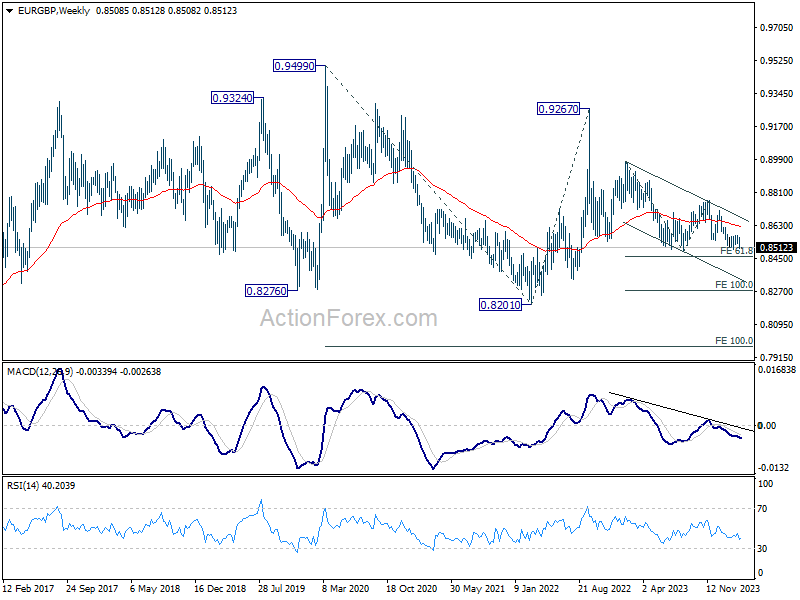
Any downside acceleration ahead would also strengthen the case that fall from 0.9267 is going to extend through 0.8201 (2022 low) in the medium term, as the third leg of the pattern from 0.9499 (2020 high).
US CPI to test Fed's rate cut timeline, UK GDP and wages growth crucial too
Spotlight turns to the US and the UK in this relatively light week, as both nations prepare to release crucial economic data.
In the US, all eyes are on the upcoming consumer inflation figures, positioned as the centerpiece. February's CPI is anticipated to show 0.4% mom increase, primarily driven by a surge in gasoline prices. This expected rise would keep the annual inflation rate steady at 3.1% yoy, signaling a pause in the disinflation progress again. Core CPI, stripping out volatile food and energy prices, is forecasted to climb by 0.3% mom, with the yoy rate decelerating from 3.9% to 3.7%.
Should these expectations hold true, they would underscore Fed Chair Jerome Powell's recent cautionary remarks, emphasizing the need for more data and confidence before contemplating rate reductions. Presently, futures markets assign roughly 75% probability to a June rate cut by Fed. A modest undershoot in CPI might not expedite this timeline to May, whereas a surprise on the upside could prompt a reassessment of the cut's timing.
Other notable data from the US include PPI, retail sales, and the University of Michigan consumer sentiment index.
Across the Atlantic, the UK is poised to unveil GDP and employment statistics for January. GDP growth is forecasted at 0.2% mom, signaling a move towards stabilization from last year's recessionary. This development would be greeted positively by BoE policymakers, allowing them a longer leash before reducing interest rates. Additionally, the wages growth data will offer insights into persistence of domestic inflationary pressures.
Amid diverging views among economists and even members of MPC regarding BoE's rate cut timeline, August emerges as the more likely month for commencing policy easing.
Here are some highlights for the week:
- Monday: Japan GDP final, machine tool orders;.
- Tuesday: Japan BSI manufacturing, PPI; Australia NAB business confidence; Germany CPI final; UK employment; US CPI.
- Wednesday: UK GDP, production, trade balance; Eurozone industrial production.
- Thursday: UK RICS house price balance; Swiss PPI; Canada manufacturing sales; US PPI, retail sales, jobless claims, business inventories.
- Friday: New Zealand BNZ manufacturing; Japan tertiary industry index; UK consumer inflation expectations; Canada housing starts; US Empire state manufacturing, import prices, industrial production, U of Michigan consumer sentiment.
USD/CAD Daily Outlook
Daily Pivots: (S1) 1.3439; (P) 1.3469; (R1) 1.3517; More...
Intraday bias in USD/CAD remains neutral for the moment. On the downside, break of 1.3419 and sustained trading below 1.3439 support will argue that rebound from 1.3176 has completed as a corrective move to 1.3605. Near term outlook will be turned bearish for 1.3357 support first. On the upside, though, break of 1.3524 minor resistance will revive near term bullishness, and turn bias back to the upside for retesting 1.3605 resistance instead.
In the bigger picture, price actions from 1.3976 (2022 high) are viewed as a corrective pattern only. In case of another fall, strong support should emerge above 1.2947 resistance turned support to bring rebound. Overall, larger up trend from 1.2005 (2021 low) is still expected to resume through 1.3976 at a later stage.
Economic Indicators Update
| GMT | Ccy | Events | Actual | Forecast | Previous | Revised |
|---|---|---|---|---|---|---|
| 23:50 | JPY | GDP Q/Q Q4 F | 0.10% | 0.30% | -0.10% | |
| 23:50 | JPY | GDP Deflator Y/Y Q4 F | 3.90% | 3.80% | 3.80% | |
| 23:50 | JPY | Money Supply M2+CD Y/Y Feb | 2.50% | 2.40% | 2.40% | |
| 06:00 | JPY | Machine Tool Orders Y/Y Feb P | -8.0% | -14.10% | -14.0% |
Technical Outlook and Review
DXY:
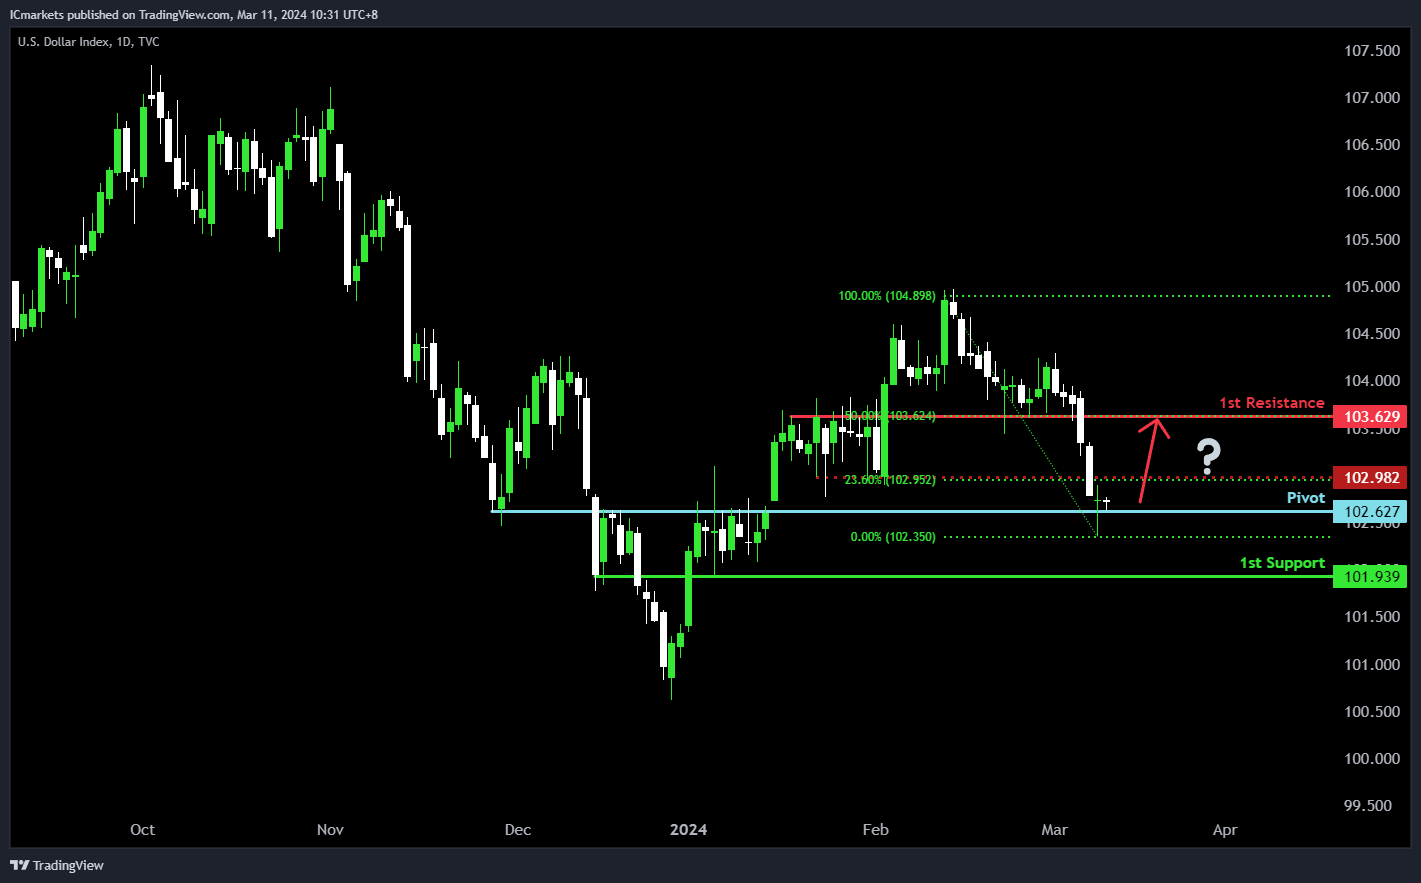
The DXY (Dollar Index) chart reflects bullish momentum, indicating a possible bullish rebound near the pivot level and subsequent movement towards the 1st resistance. The pivot at 102.62 acts as significant overlap support, suggesting potential buyer intervention for a bullish bounce. The 1st support at 101.93 reinforces this pattern.
On the resistance side, the 1st resistance at 103.62, along with the 50% Fibonacci Retracement, could impede upward movement due to increased selling pressure. Further resistance is seen at 102.98, supported by the 23.60% Fibonacci Retracement, potentially intensifying selling pressure in that zone.
EUR/USD:
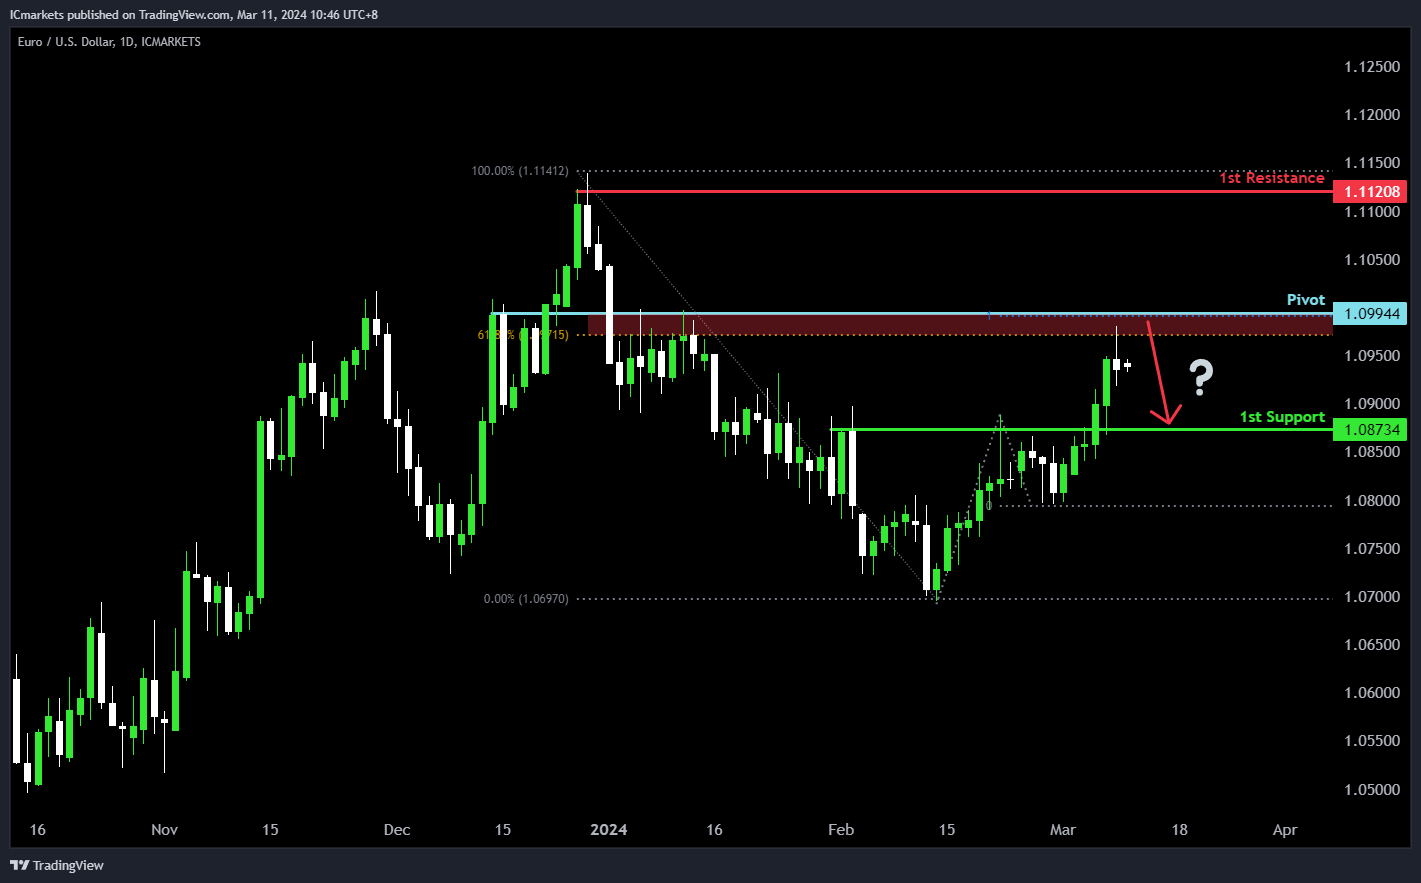
The EUR/USD chart indicates a bearish momentum, suggesting a potential bearish reaction near the pivot level, followed by a decline towards the 1st support.
The pivot at 1.0994 serves as a significant overlap support, coinciding with the 61.80% Fibonacci Retracement level. The 1st support at 1.0873 also provides additional reinforcement as an overlap support level,
On the resistance side, the 1st resistance at 1.1120 is identified as a swing high resistance, suggesting historical significance as a level where selling interest has intensified, potentially impeding further upward movement.
EUR/JPY:
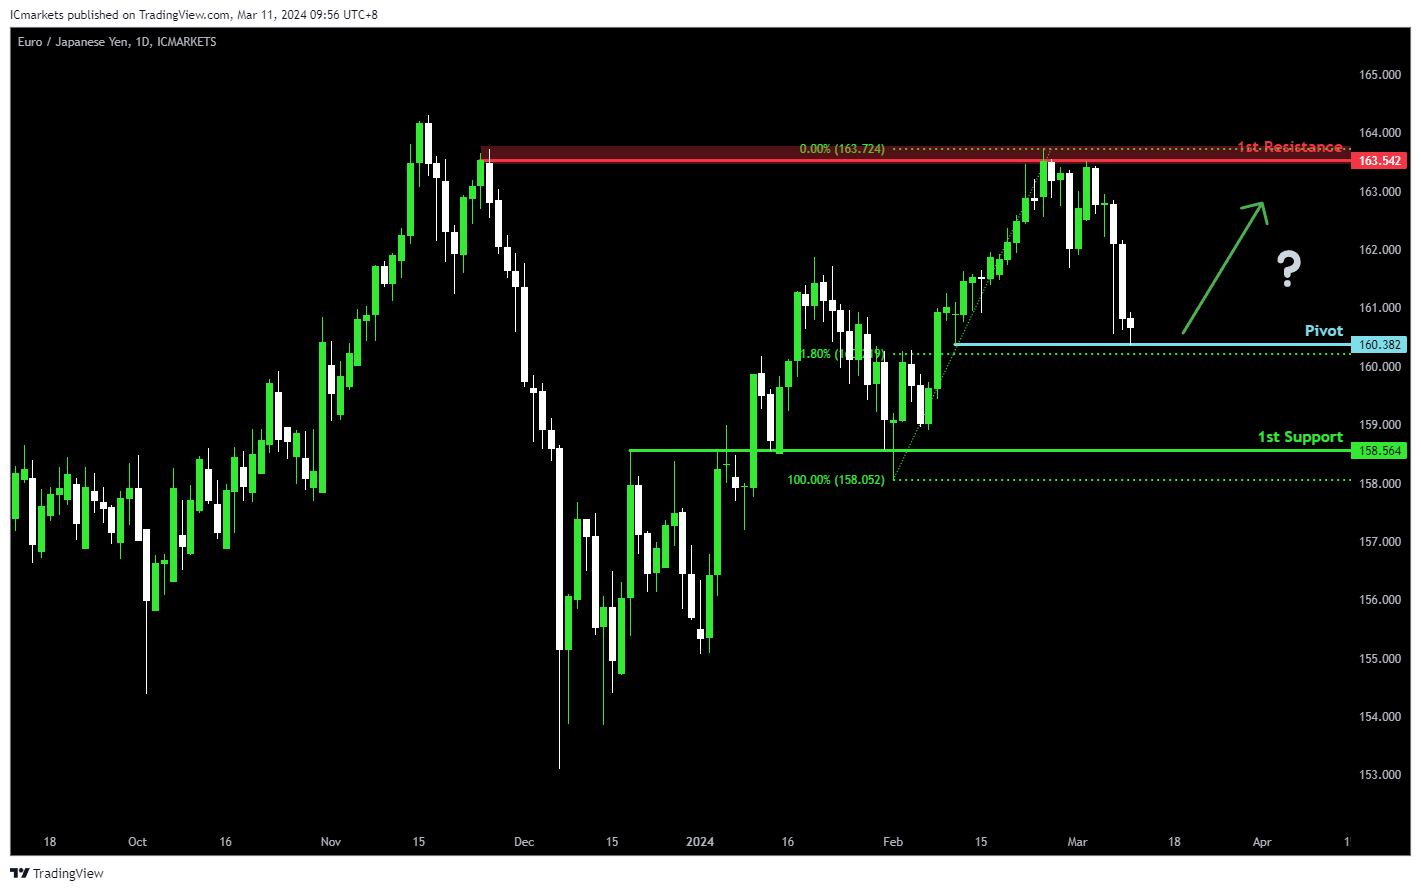
The EUR/JPY chart currently demonstrates bullish momentum, indicating a potential continuation of the upward trend. There are indications that price could potentially make a bullish bounce off the 1st support level and head towards the 1st resistance.
The Pivot level at 160.382 aligns with the 61.80% Fibonacci Retracement, suggesting a significant historical level where buying interest might emerge. Additionally, the 1st support at 158.564 is identified as an overlap support, further reinforcing its importance as a potential area of support.
On the resistance side, the 1st resistance level at 163.542 is characterized as a swing high resistance, indicating a historical barrier to upward movement.
EUR/GBP:
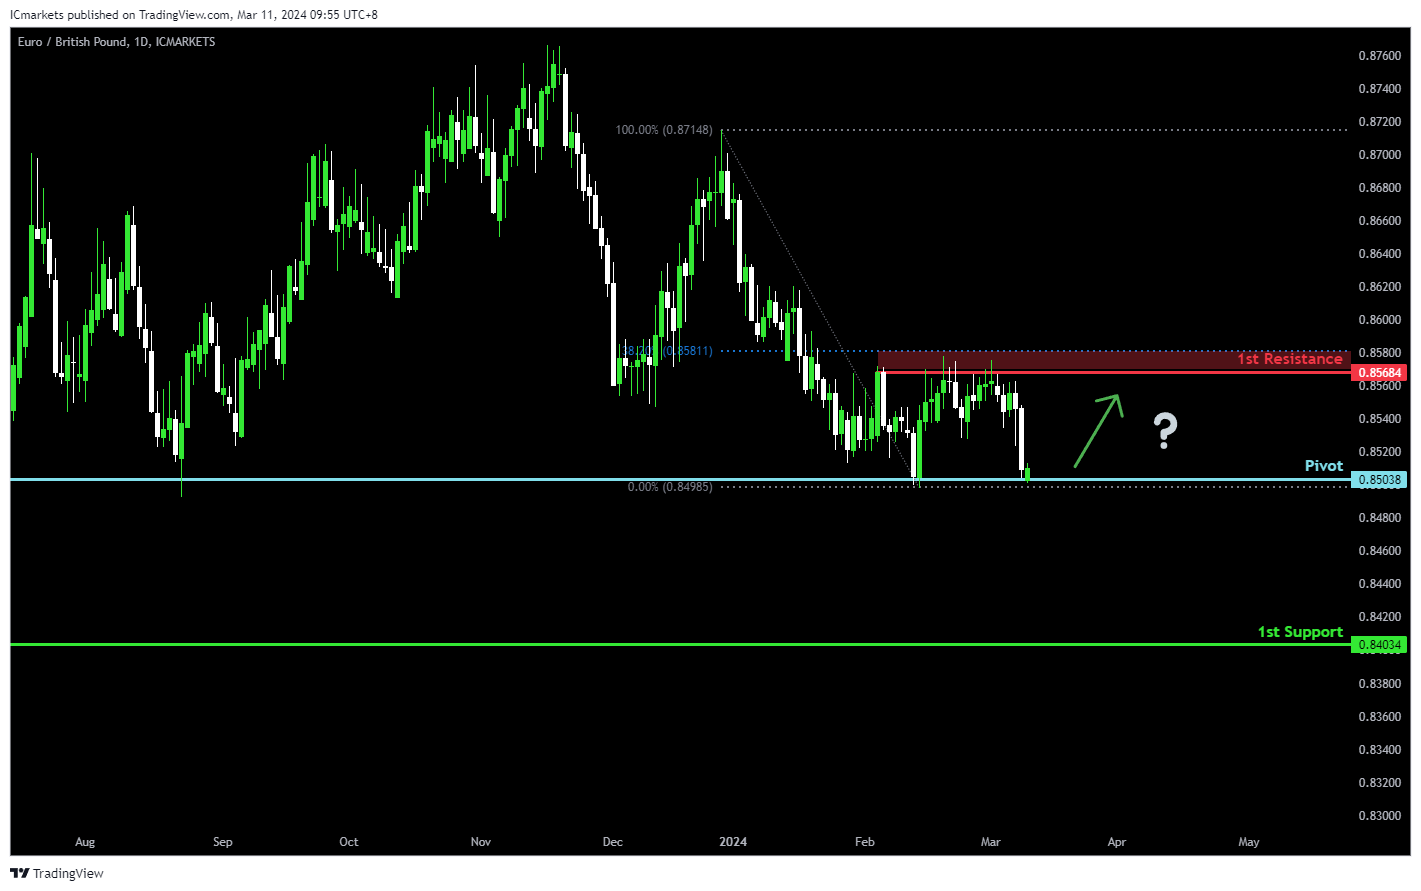
The EUR/GBP chart currently demonstrates bullish momentum, indicating a potential continuation of the upward trend. There are indications that price could potentially make a bullish bounce off the 1st support level and head towards the 1st resistance.
The Pivot level at 0.85038 serves as a swing low support, suggesting a significant historical level where buying interest could emerge. Additionally, the 1st support at 0.84034 is identified as a pullback support, further reinforcing its importance as a potential area of support.
On the resistance side, the 1st resistance level at 0.85684 is characterized as a swing high resistance, indicating a historical barrier to upward movement. Furthermore, the confluence with the 38.20% Fibonacci Retracement adds to its significance as a potential barrier to further bullish movement.
GBP/USD:
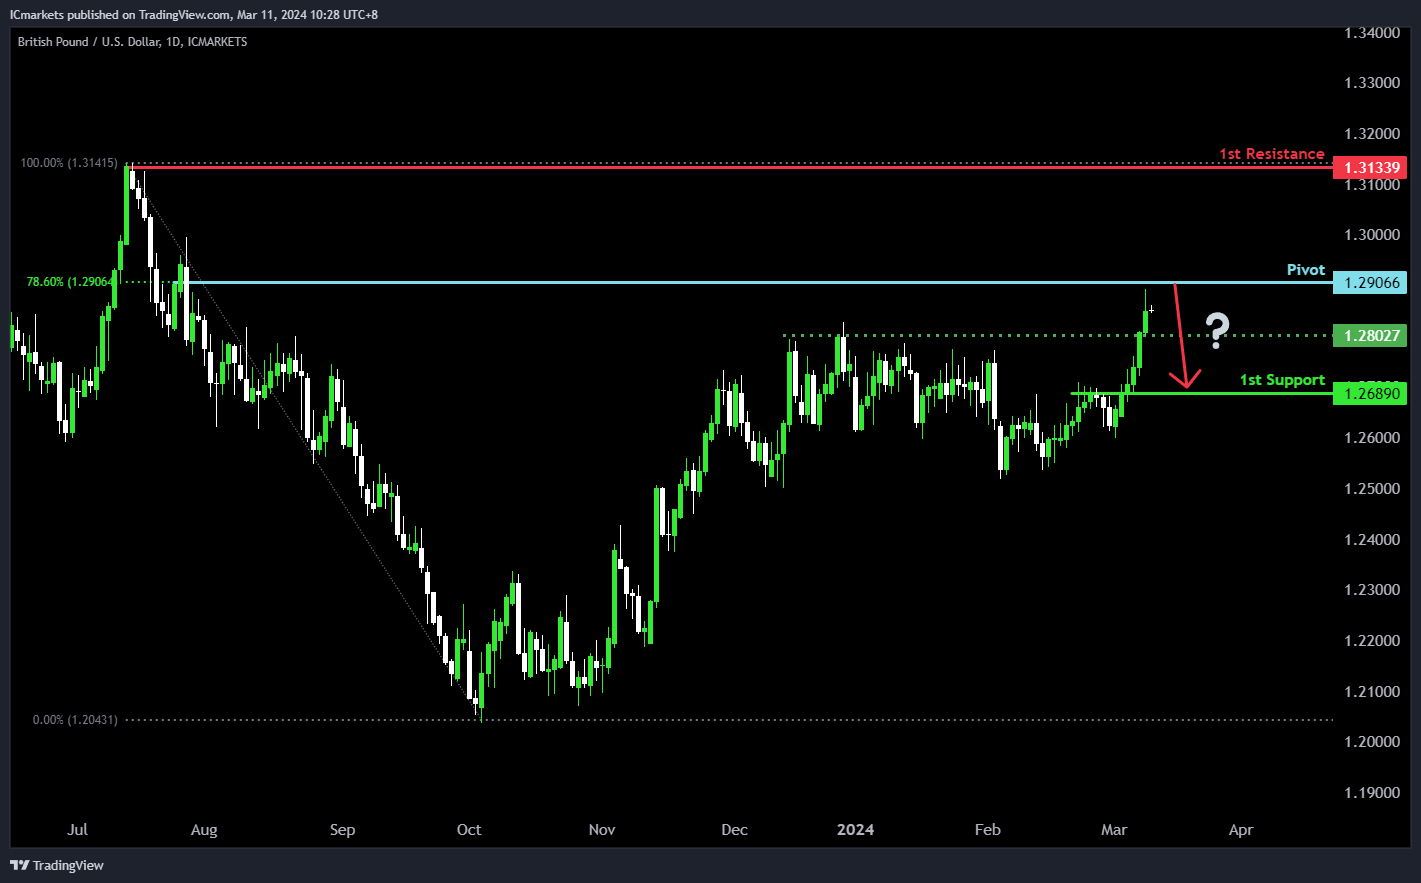
The GBP/USD chart reflects a bearish momentum, suggesting a possible bearish response around the pivot level, leading to a decline towards the 1st support.
The pivot at 1.2906 exhibits notable resistance, marked by a swing high and the 78.60% Fibonacci Retracement level, implying a potential area of selling pressure. Additionally, the 1st support at 1.2689 serves as an overlap support, indicating a historical level where buying interest has emerged, potentially offering a foothold for price support.
Conversely, the 1st resistance at 1.3233 presents a significant barrier, characterized by a swing high, likely attracting selling interest and impeding further upward movement.
GBP/JPY:
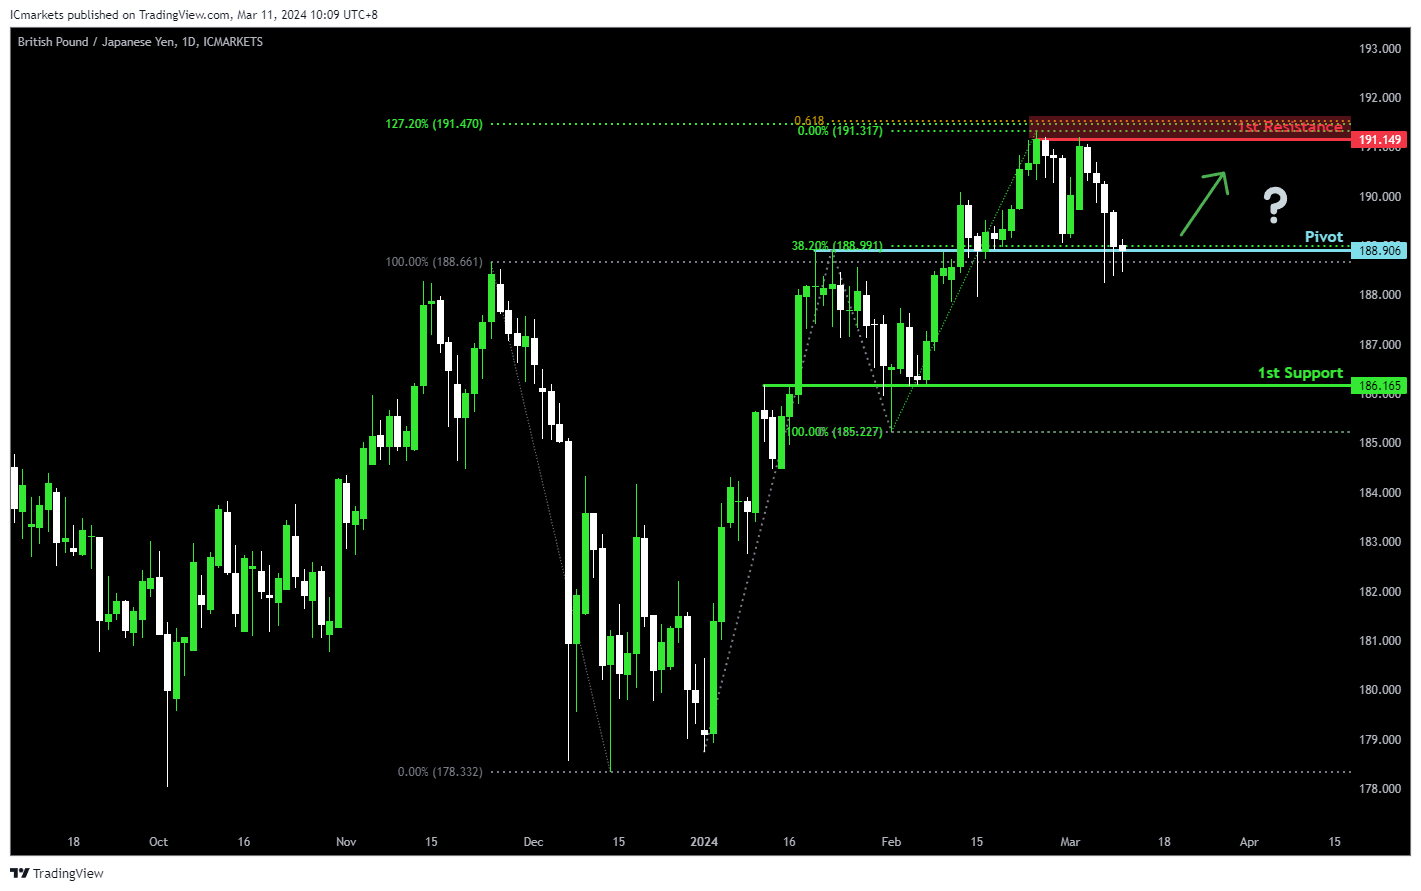
The GBP/JPY chart currently exhibits bullish momentum, suggesting a potential continuation of the upward trend. There are indications that price could potentially make a bullish bounce off the 1st support level and head towards the 1st resistance.
The Pivot level at 188.906 serves as a pullback support and coincides with the 38.20% Fibonacci Retracement level, indicating a significant historical level where buying interest may emerge. Additionally, the 1st support at 186.165 further reinforces the potential area of support.
On the resistance side, the 1st resistance level at 191.149 is identified as a swing high resistance, suggesting a historical barrier to upward movement. Furthermore, the confluence with the 61.80% Fibonacci Projection and the 127.20% Fibonacci Extension strengthens the significance of this resistance level.
USD/CHF:
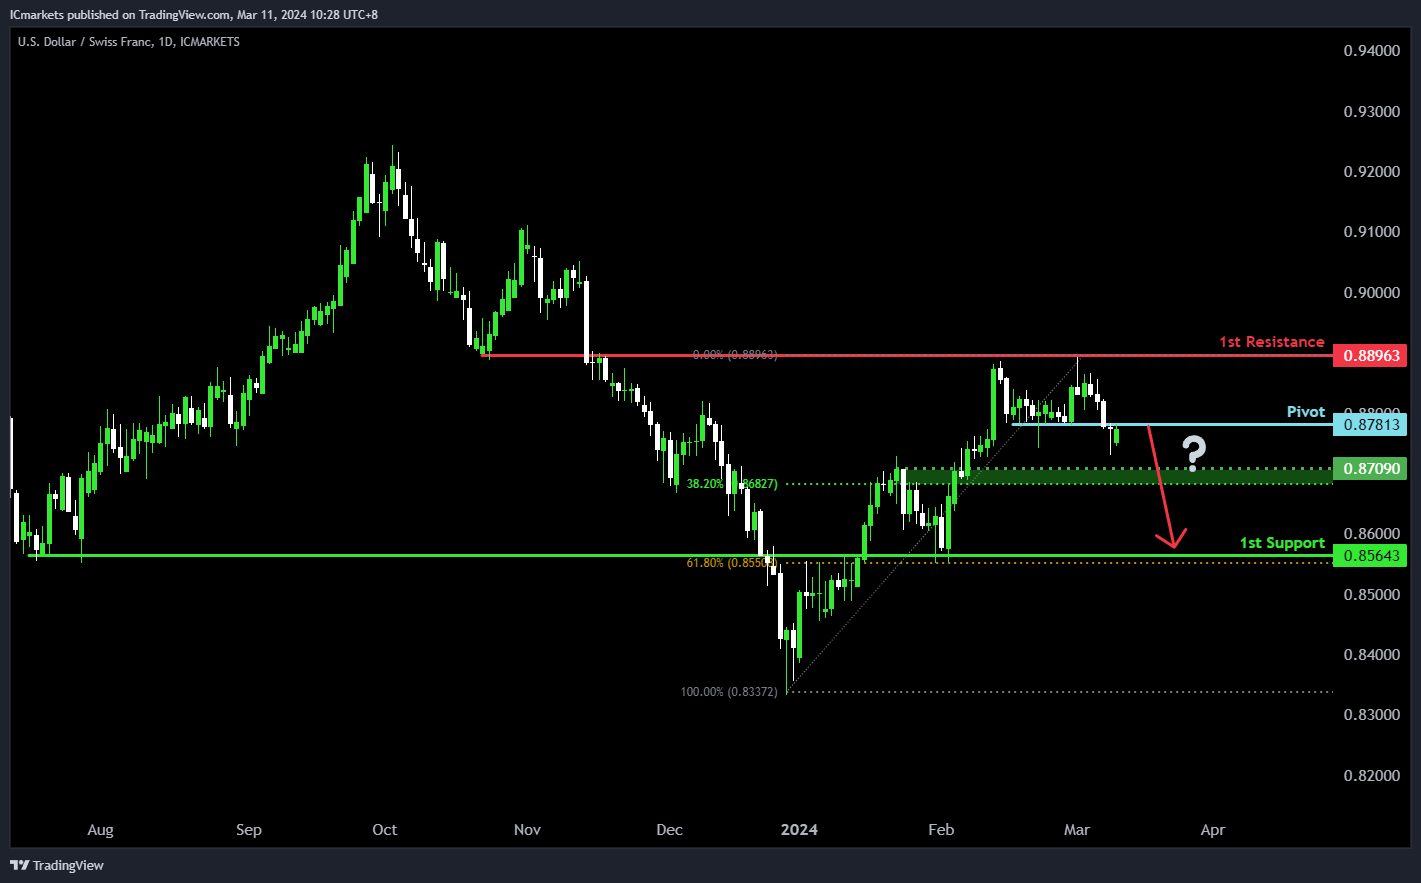
The USD/CHF chart indicates a bearish trend, suggesting a possible bearish response around the pivot level, leading to a decline towards the 1st support.
The pivot at 0.8781 acts as a significant level of pullback resistance, indicating potential selling pressure. Furthermore, the 1st support at 0.8564, coupled with the 61.80% Fibonacci Retracement, presents an overlap support, historically attracting buyers’ interest and potentially providing a level of price support.
Conversely, the 1st resistance at 0.8896 serves as an overlap resistance, marking a significant barrier where selling interest may intensify, hindering further upward movement in the price.
USD/JPY:
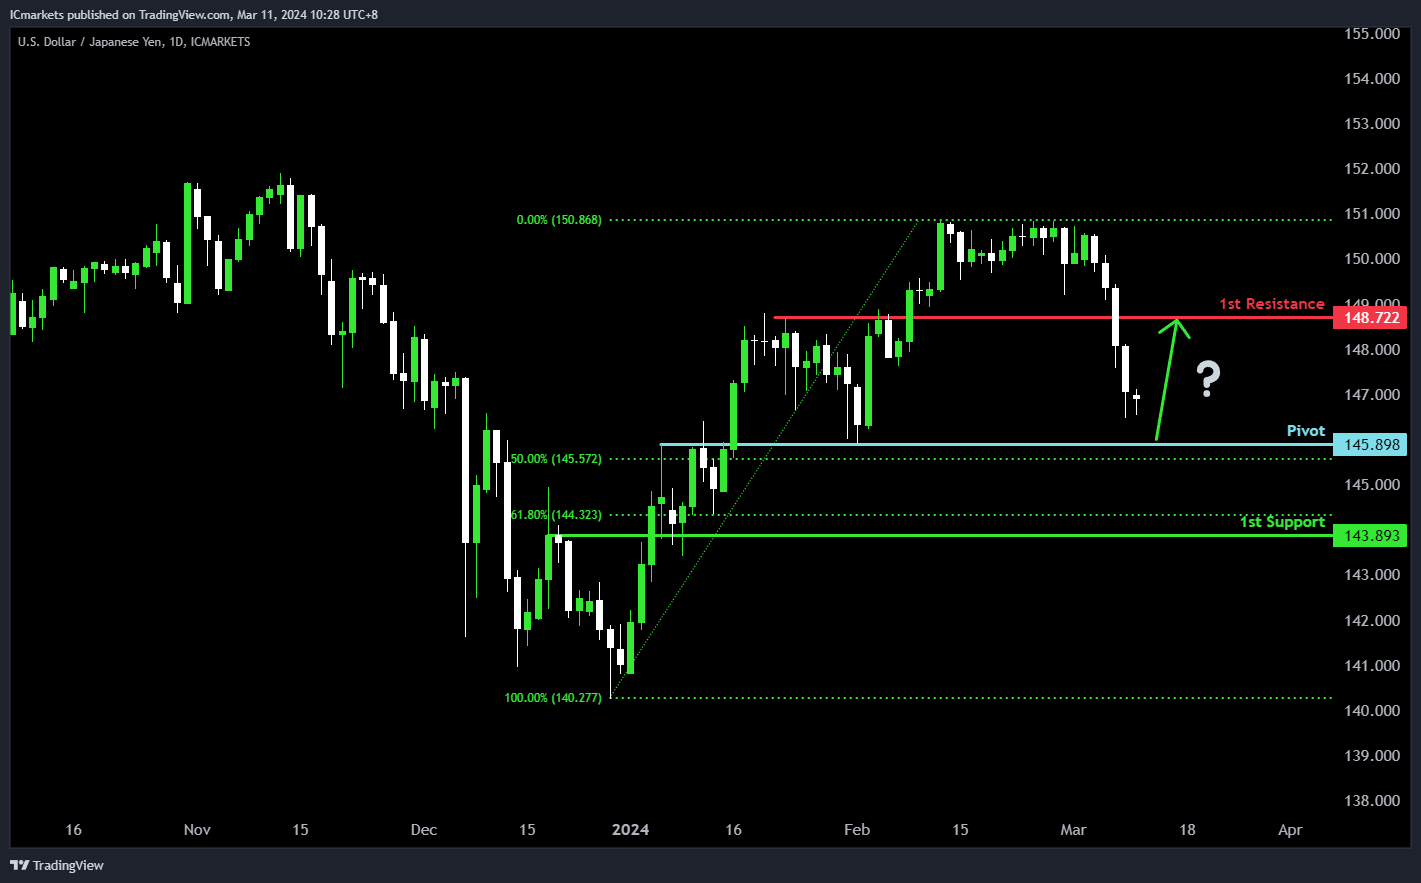
The USD/JPY chart indicates bullish momentum, suggesting a potential bullish bounce around the pivot level, leading towards the 1st resistance.
The pivot at 145.89 serves as a significant overlap support, coinciding with the 50% Fibonacci Retracement level, indicating a potential area where intervention may occur, supporting the price. Additionally, the 1st support at 143.89 is identified as another overlap support, reinforced by the 61.80% Fibonacci Retracement, suggesting a level where buying interest might emerge.
On the resistance side, the 1st resistance at 148.72 is recognized as a pullback resistance, indicating a historical barrier where selling pressure may increase, potentially limiting further upward movement in the price.
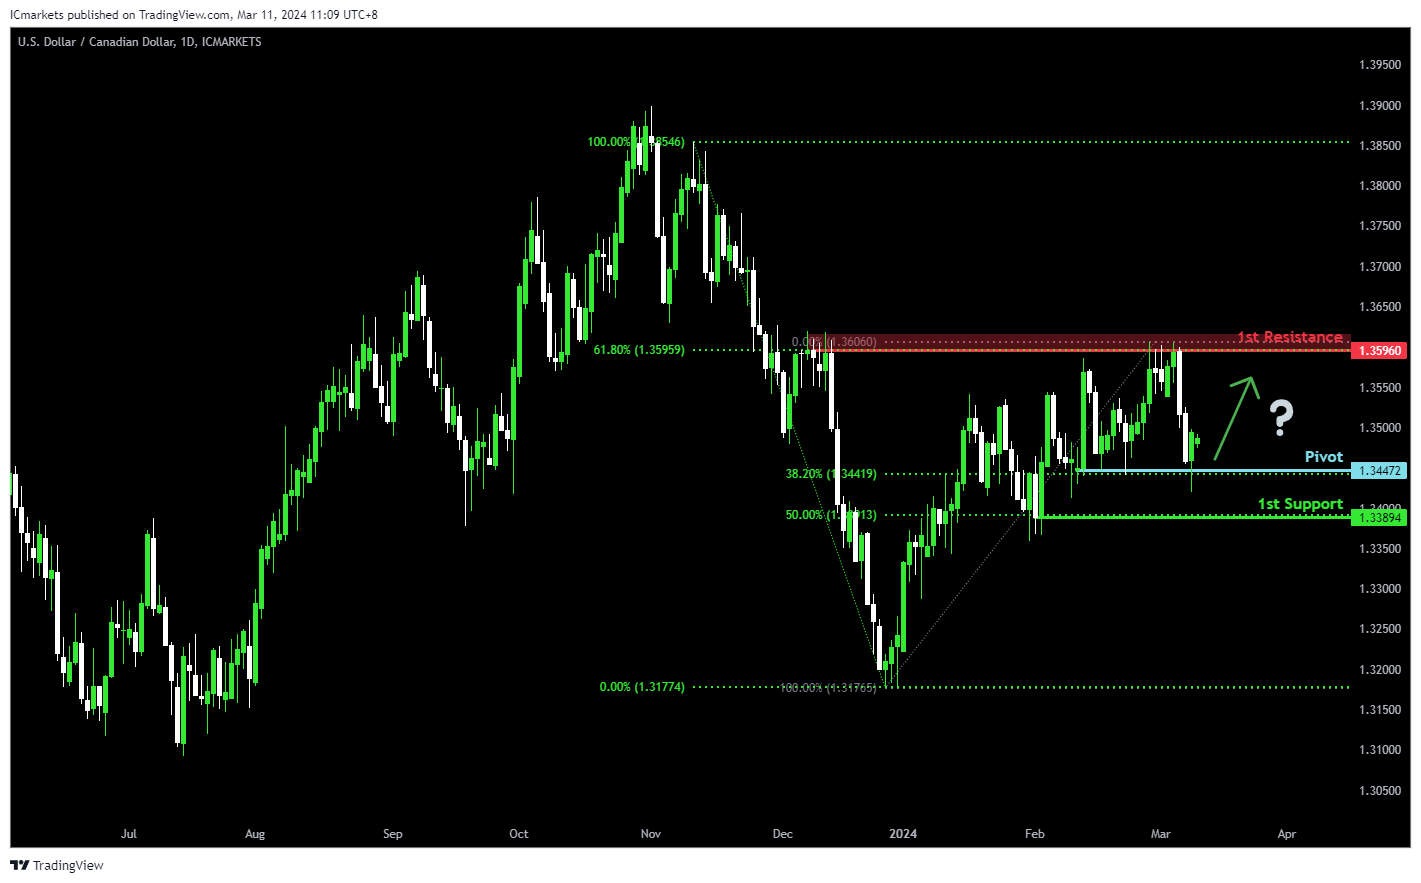
USD/CAD:
The USD/CAD chart currently exhibits an overall bearish momentum. However, there is a potential scenario for price to bounce off the pivot level and rise towards the 1st resistance.
The pivot level at 1.3447 is identified as a pullback support that aligns with the 38.20% Fibonacci Retracement level. Further below, the 1st support level at 1.3389 is also marked as a pullback support that aligns with the 50.00% Fibonacci Retracement level, reinforcing its significance as a key support level.
To the upside, the 1st resistance level at 1.3596 is identified as a pullback resistance that aligns with the 61.80% Fibonacci Retracement level, further highlighting its importance as a potential resistance zone.
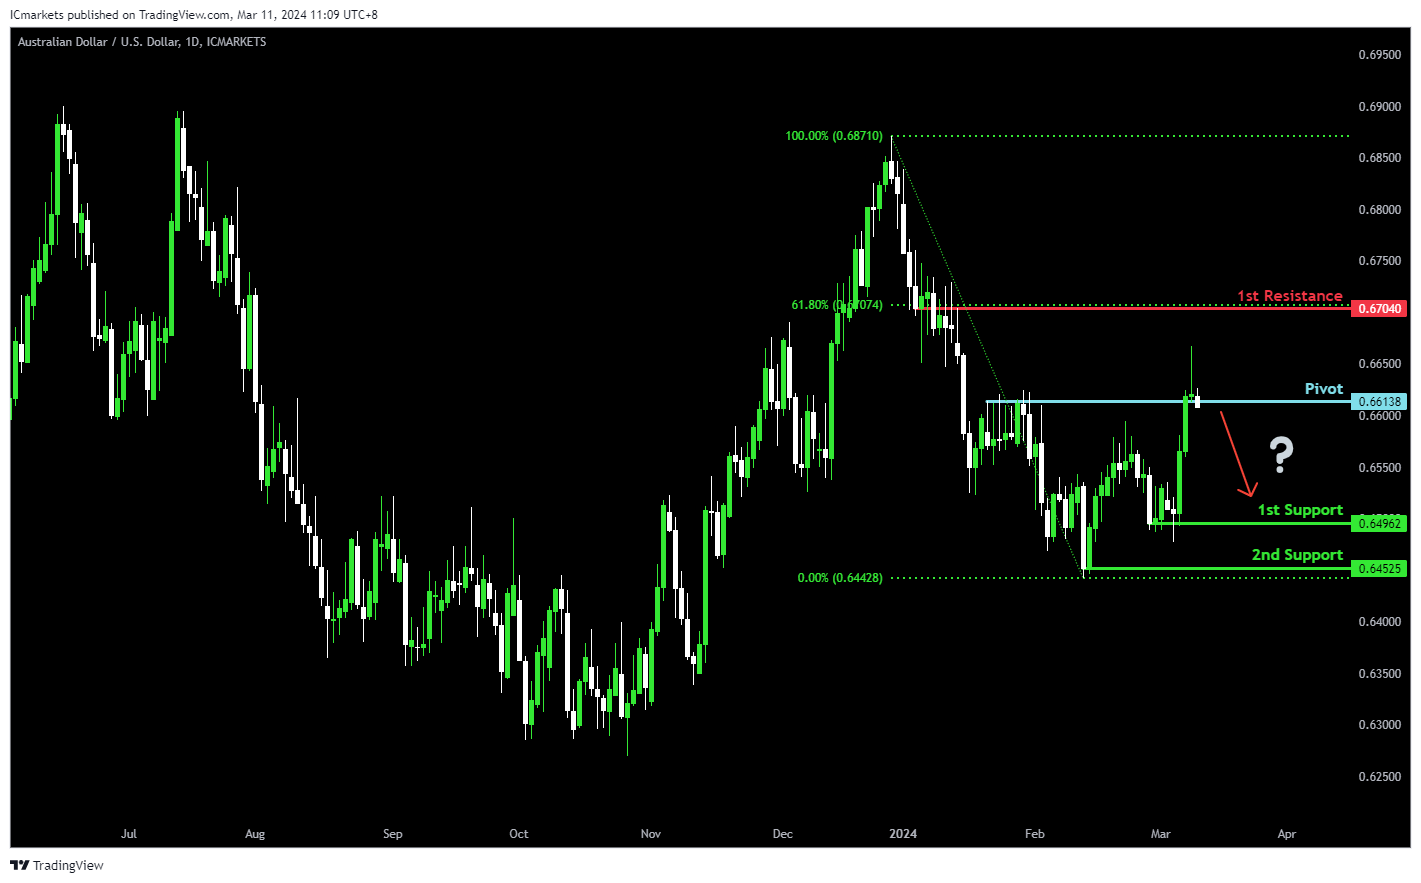
AUD/USD:
The AUD/USD chart currently demonstrates an overall bullish momentum. However, there is a potential scenario for price to reverse around the pivot level and drop towards the 1st support.
The pivot level at 0.6613 is identified as a pullback resistance where price could potentially reverse from to drop lower. The 1st support level at 0.6496 is marked as a pullback support while the 2nd support level at 0.6452 is also noted as a pullback support, reinforcing its significance as a key support level.
On the resistance side, the 1st resistance level at 0.6704 is identified as an overlap resistance that aligns with the 61.80% Fibonacci Retracement level, potentially limiting any further upward movement.
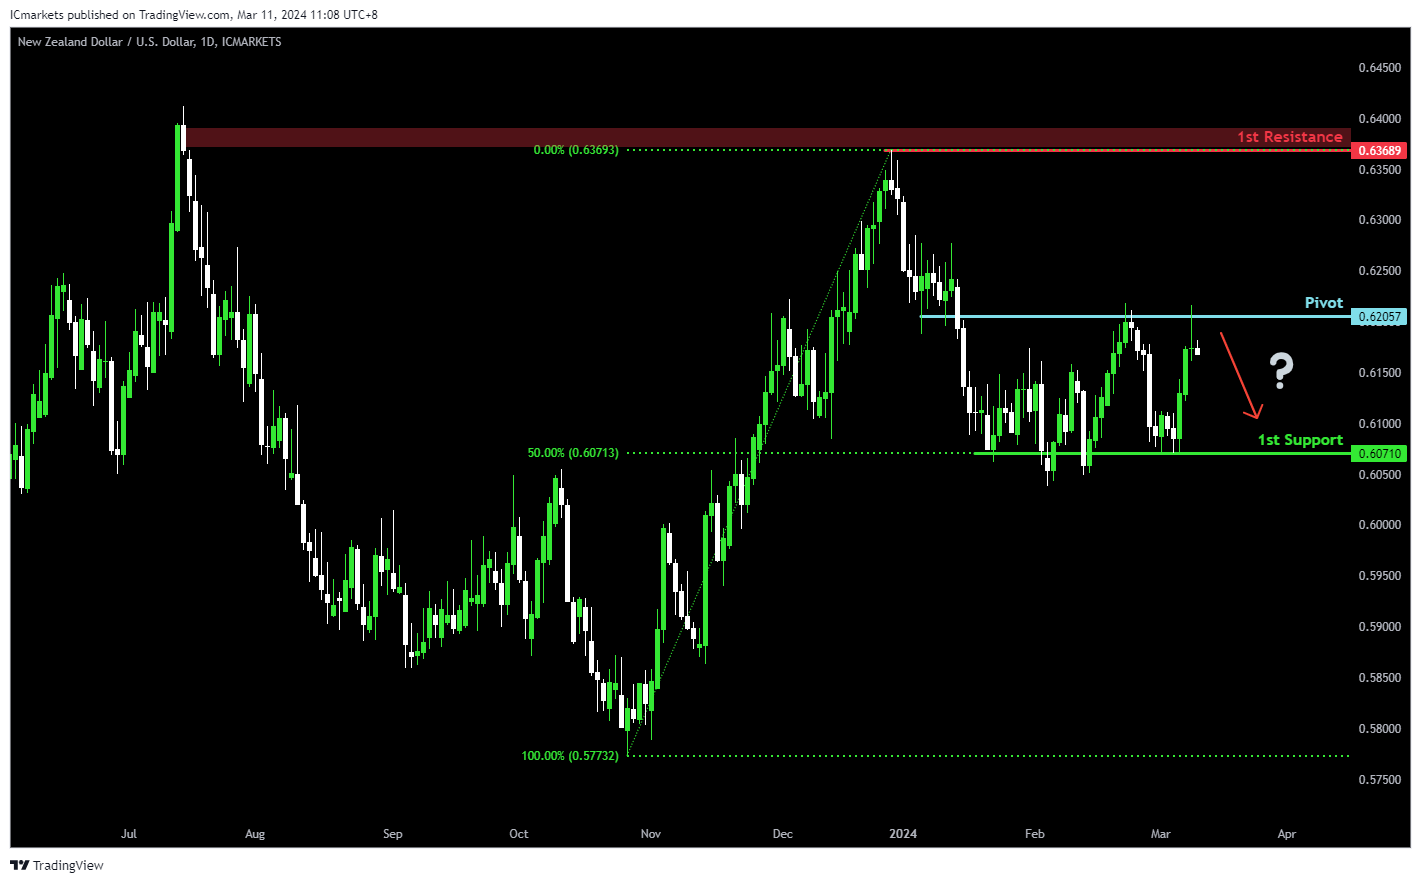
NZD/USD
The NZD/USD chart currently exhibits an overall bullish momentum. However, there is a potential scenario for price to reverse around the pivot level and drop towards the 1st support.
The pivot level at 0.6205 is identified as an overlap resistance where price could potentially reverse from to drop lower. The 1st support level at 0.6071 is marked as a pullback support that aligns with the 50.00% Fibonacci Retracement level, reinforcing its significance as a key support level.
On the resistance side, the 1st resistance level at 0.6368 is identified as a swing-high resistance, potentially limiting any further upward movement.
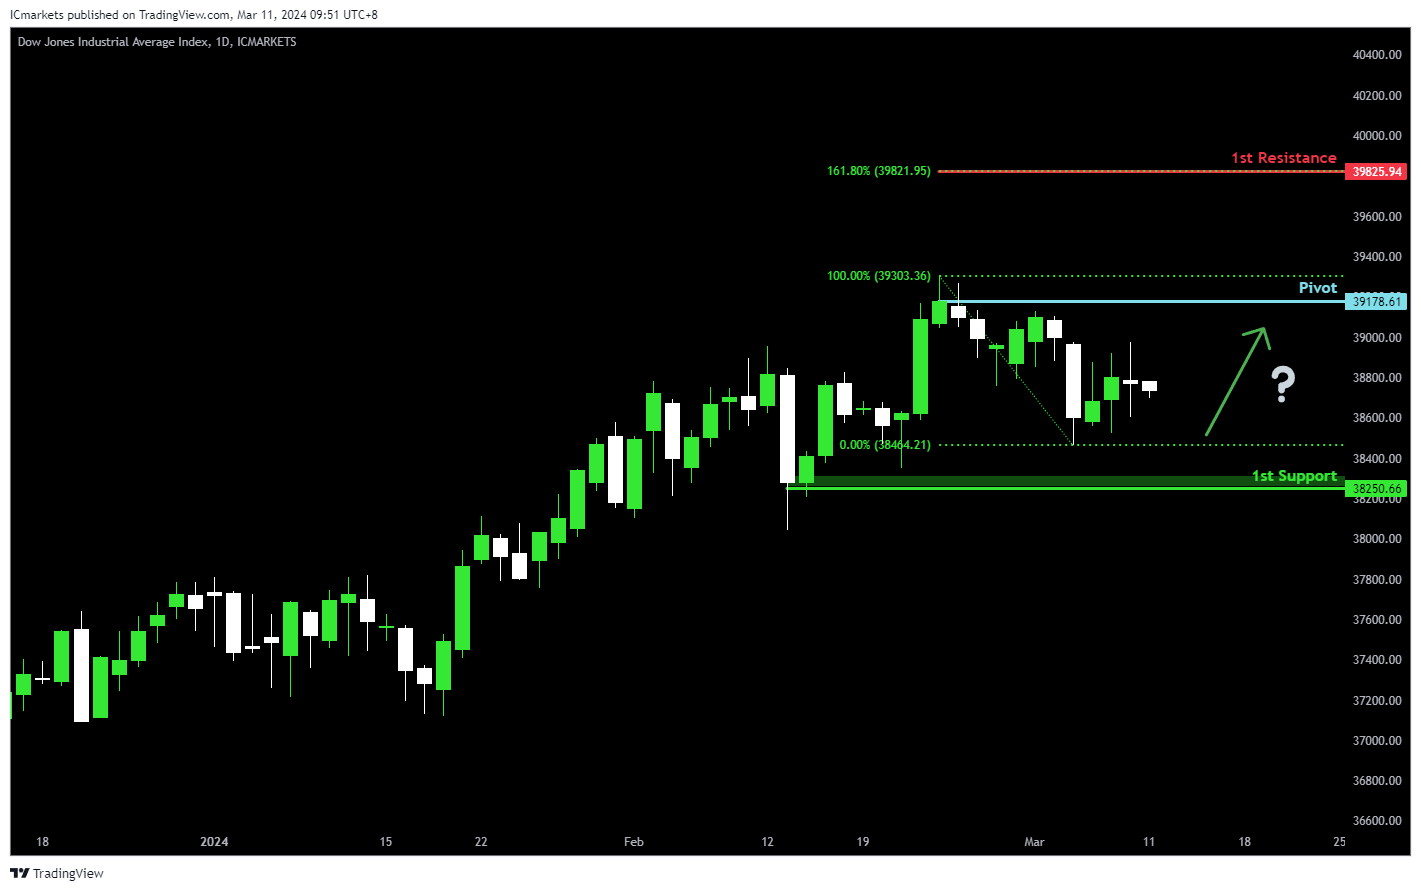
DJ30:
The DJ30 chart currently demonstrates bullish momentum, indicating a potential continuation of the upward trend. There are indications that price could potentially make a bullish continuation towards the 1st resistance level.
The Pivot level at 39178.61 is identified as a swing high resistance, suggesting a significant historical barrier to upward movement. Additionally, the 1st support at 38250.66 corresponds to a swing low support, indicating a potential area where buying interest might emerge.
On the resistance side, the 1st resistance level at 39825.94 aligns with the 161.80% Fibonacci Extension, further reinforcing its significance as a potential barrier to further bullish movement.
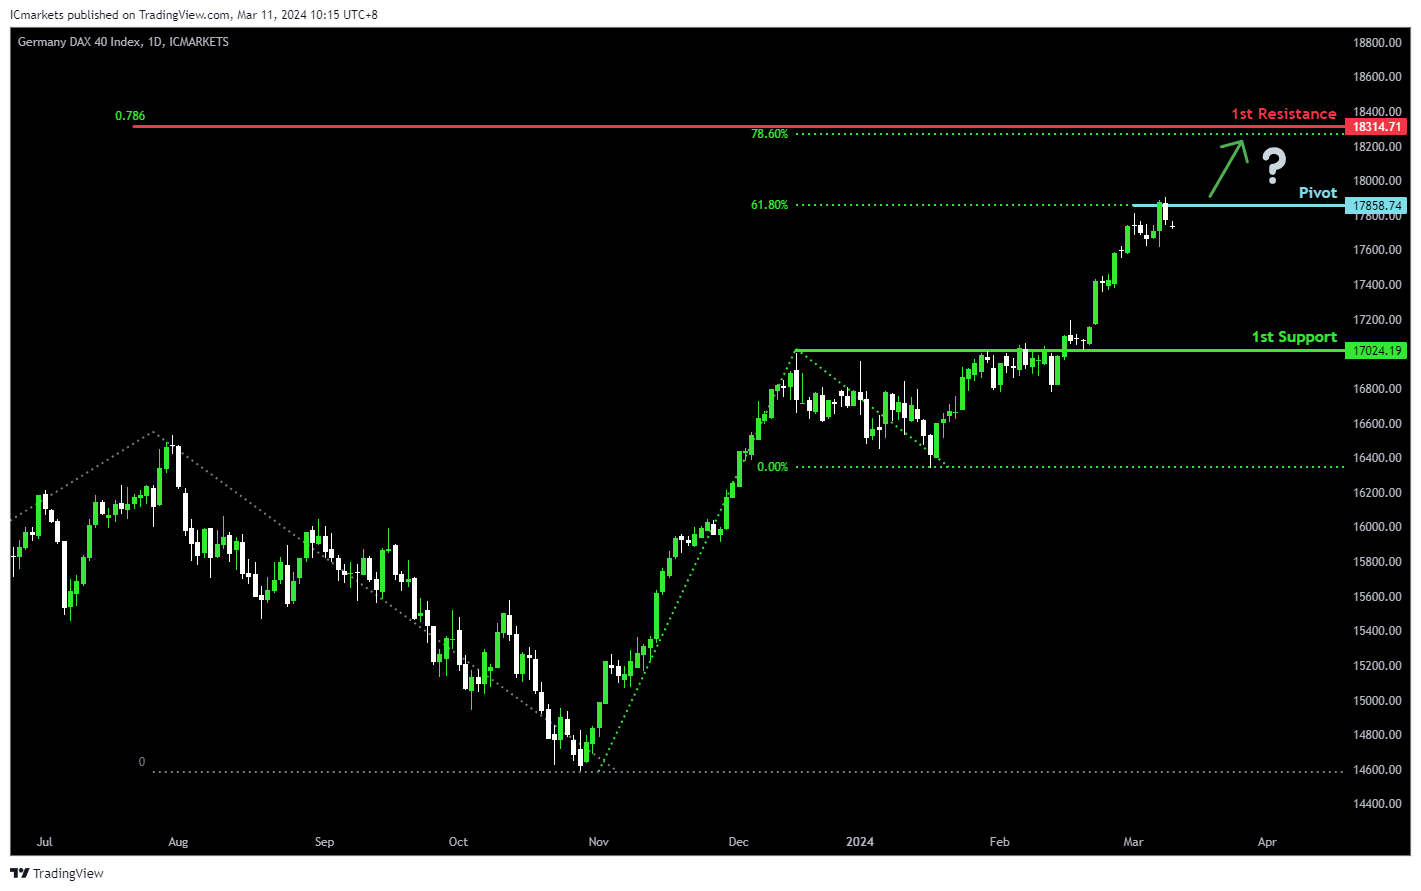
GER40:
The GER40 chart currently demonstrates bullish momentum, indicating a potential continuation of the upward trend. Several factors contribute to this momentum, suggesting a bullish movement towards the 1st resistance level.
The Pivot level at 17858.74 aligns with the 61.80% Fibonacci Retracement, indicating a significant historical level where buying interest could emerge. Additionally, the 1st support at 17024.19 corresponds to a pullback support, reinforcing its significance as a potential area of support.
On the resistance side, the 1st resistance level at 18314.71 is characterized by the confluence of the 78.60% Fibonacci Retracement and the 78.60% Fibonacci Projection, further reinforcing its significance as a potential barrier to further bullish movement.
US500:
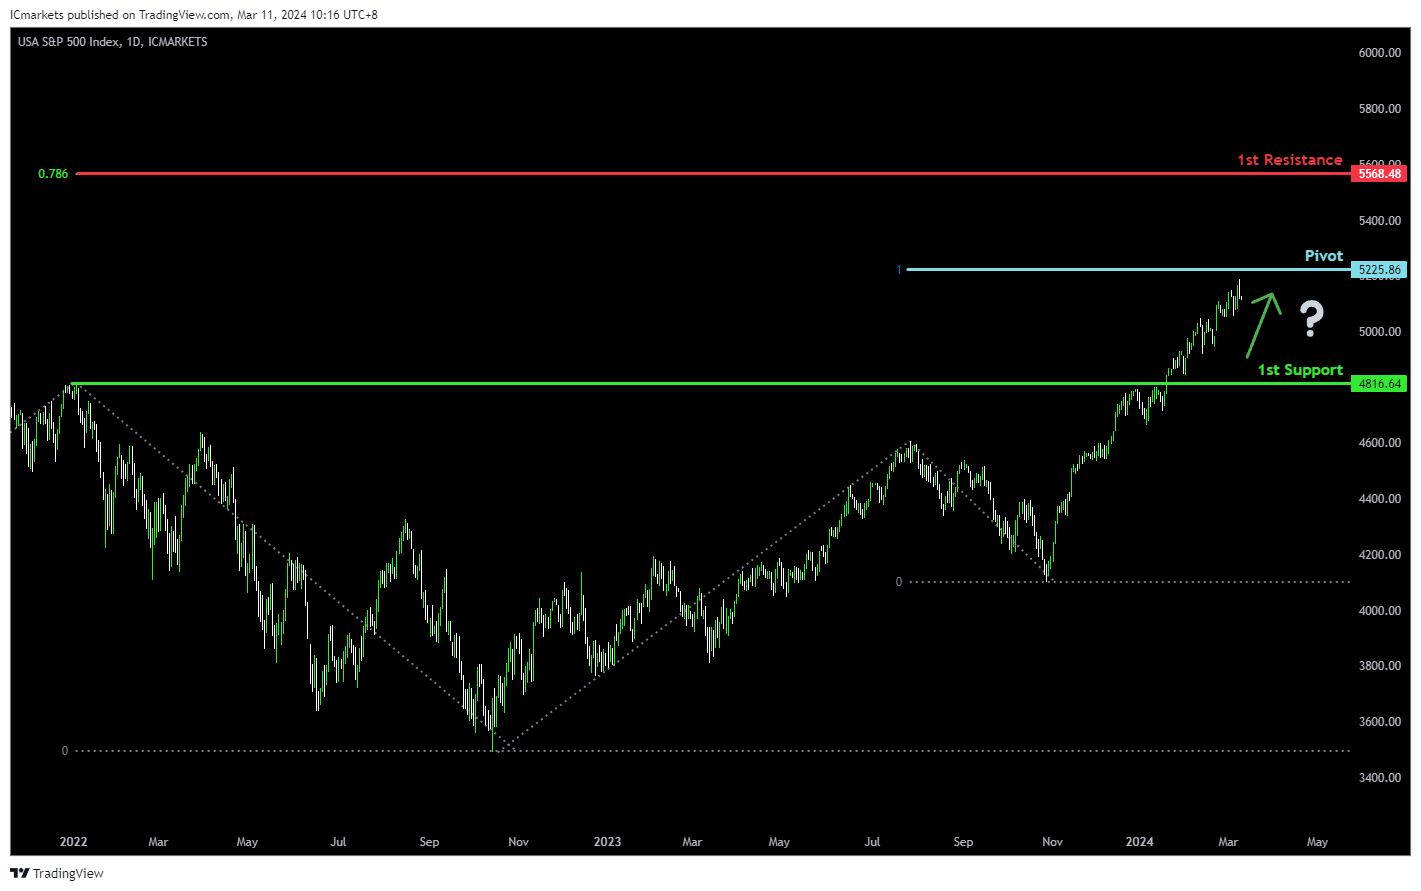
The US500 chart currently exhibits bullish momentum, indicating a potential continuation of the upward trend. The pivot level at 5225.86 aligns with the 100% Fibonacci Projection, suggesting a significant historical level where buying interest might emerge. Additionally, the 1st support at 4816.64 corresponds to a pullback support, reinforcing its significance as a potential area of demand.
On the resistance side, the 1st resistance level at 5668.48 is characterized by the 78.60% Fibonacci Projection, indicating a historical barrier to upward movement.
BTC/USD:
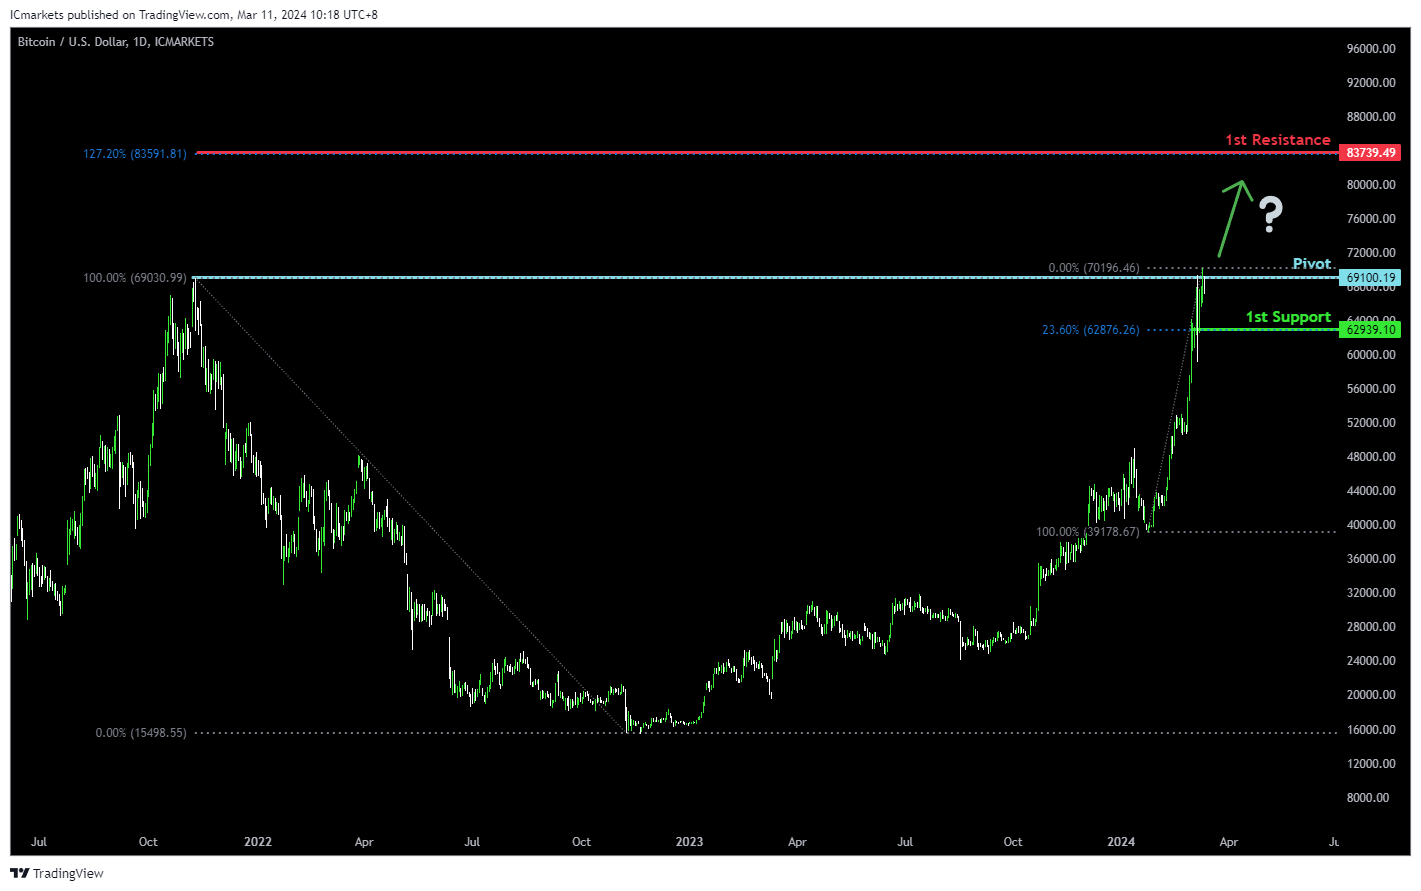
The BTC/USD chart currently demonstrates bullish momentum, suggesting a potential continuation of the upward trend. The pivot level at 69100.19 corresponds to a swing high resistance, indicating a significant historical barrier where selling pressure may emerge.
The 1st support level at 62939.10 aligns with an overlap support and coincides with the 23.60% Fibonacci Retracement level, highlighting its significance as a potential area of demand where buyers might enter the market.
On the resistance side, the 1st resistance level at 83739.49 is identified by the 127.20% Fibonacci Extension, suggesting a significant historical barrier to further upward movement.
ETH/USD:
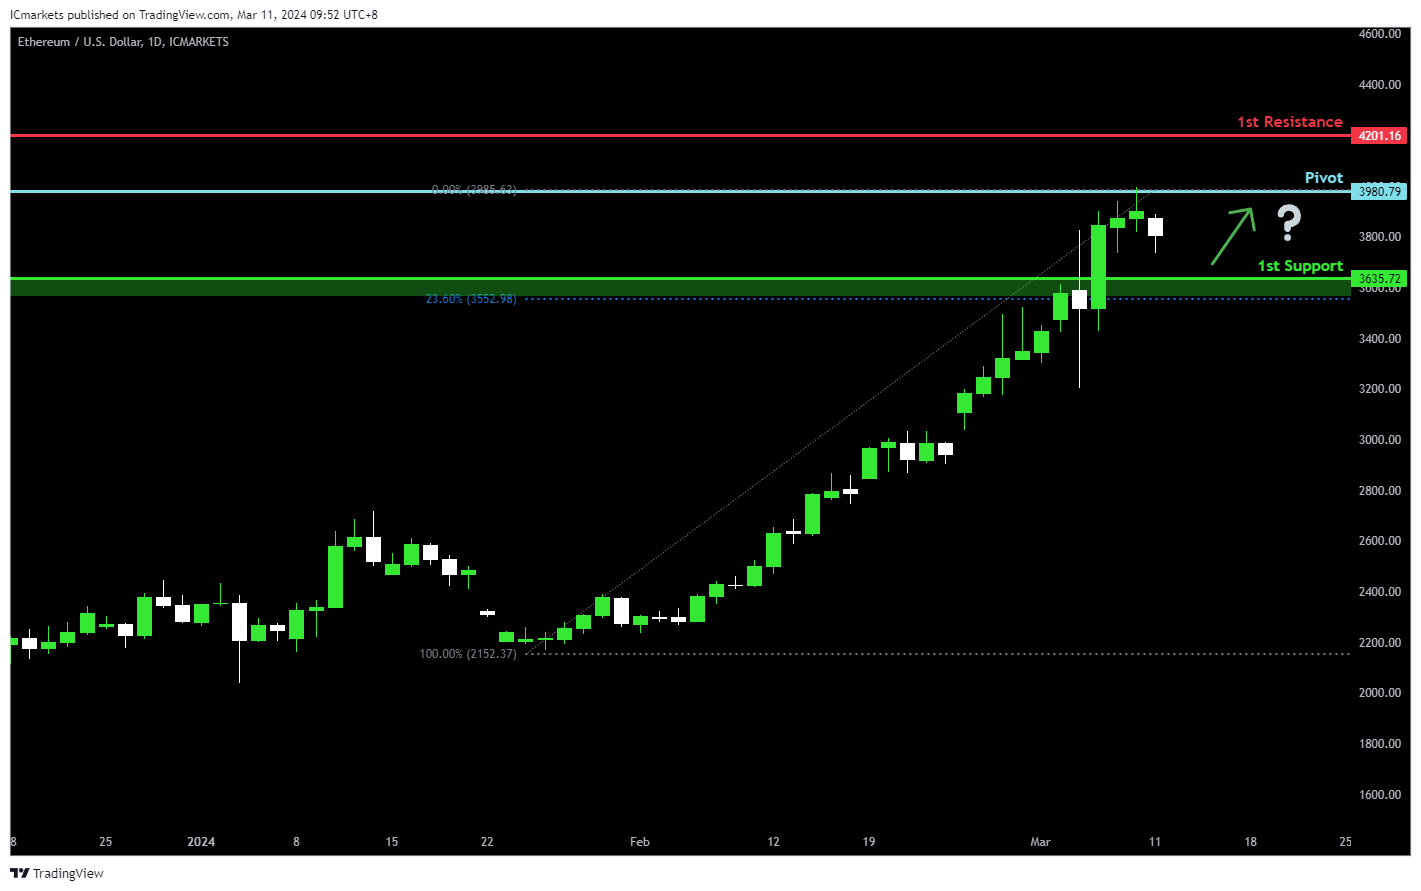
The ETH/USD chart currently exhibits bullish momentum, with several factors contributing to the upward movement. The pivot level at 3980.79 acts as an overlap support, indicating a significant historical level where buying interest could emerge.
The 1st support at 3635.72 aligns with a pullback support and coincides with the 23.60% Fibonacci Retracement level, reinforcing its significance as a potential area of demand where buyers might step in.
On the resistance side, the 1st resistance level at 4201.16 serves as a pullback resistance, suggesting a historical barrier to further upward movement.
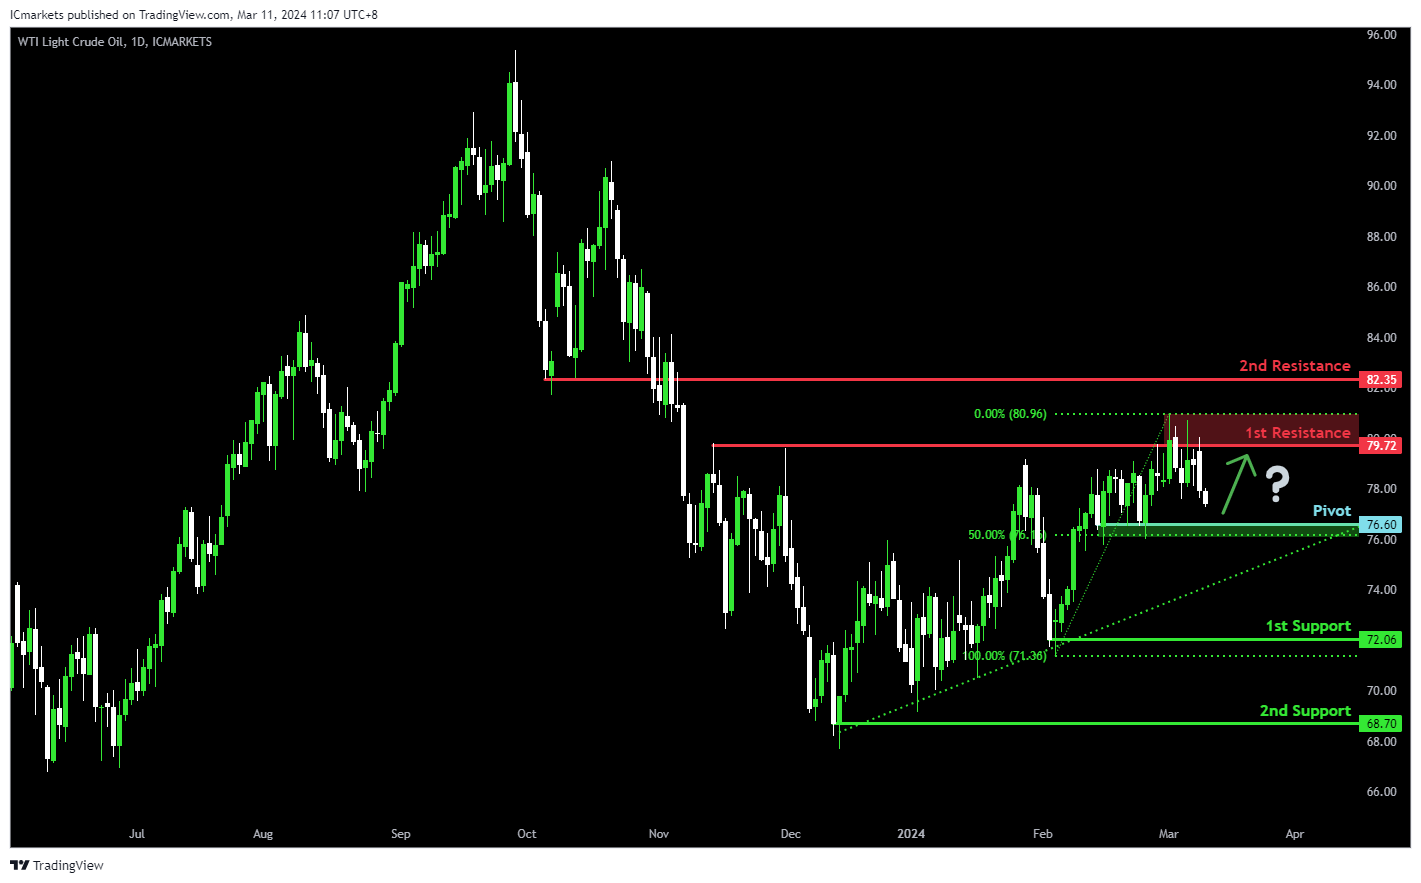
WTI/USD:
The WTI (West Texas Intermediate) chart currently demonstrates an overall bearish momentum. However, there is a potential scenario for price to bounce off the pivot level and rise towards the 1st resistance.
The pivot level at 76.60 is identified as a pullback support that aligns with the 50.00% Fibonacci Retracement level. Further below, the 1st support level at 72.06 is marked as a swing-low support while the 2nd support level at 64.70 is noted as a pullback support, reinforcing its significance as a key support level.
To the upside, the 1st resistance level at 79.72 is identified as a pullback resistance while the 2nd resistance level at 82.35 is noted as an overlap resistance, further reinforcing its significance as a potential barrier to further bullish movement.
XAU/USD (GOLD):
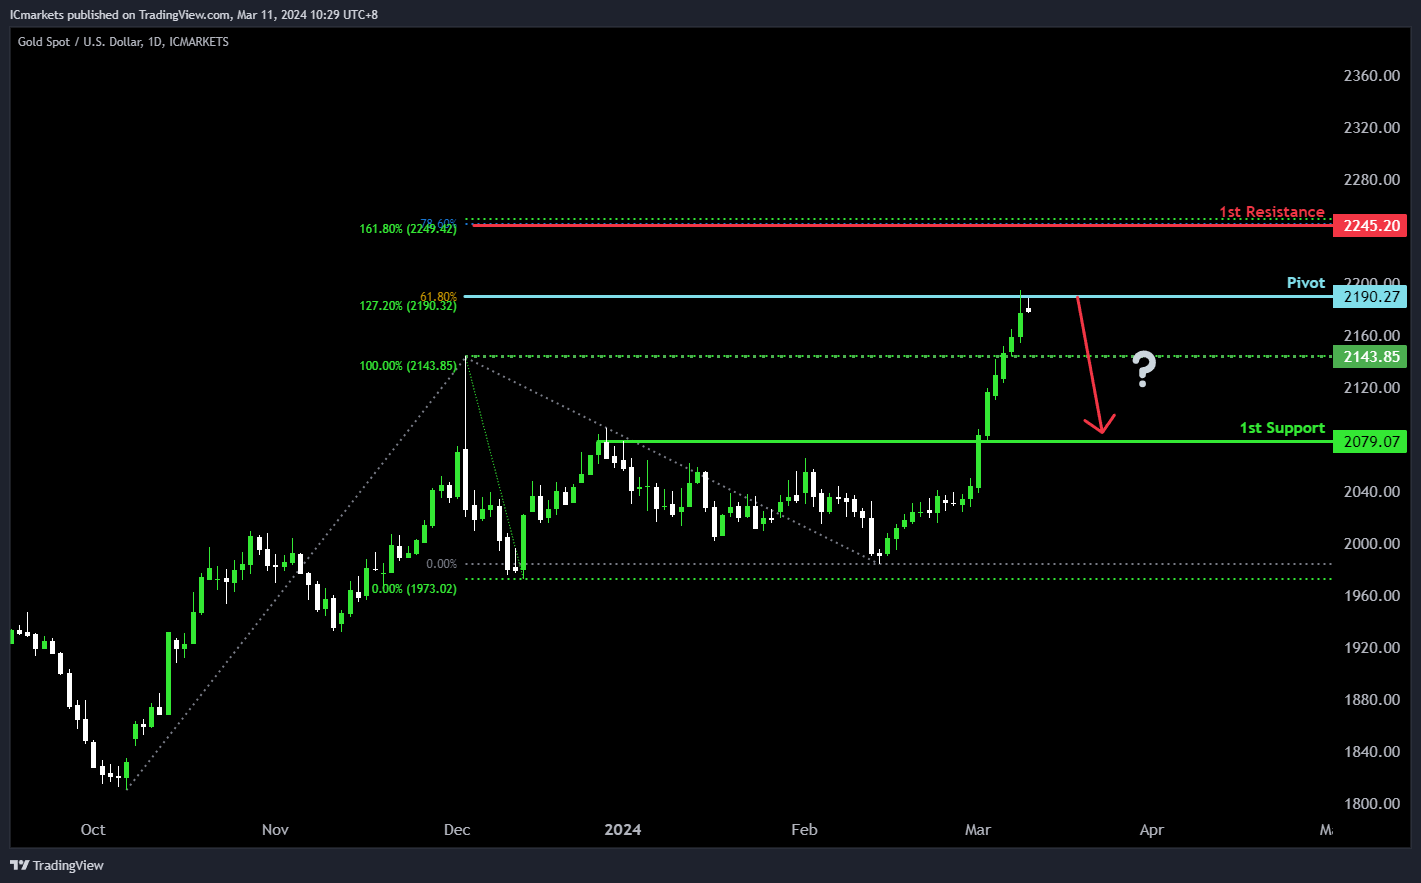
The XAUUSD chart indicates bearish momentum, potentially leading to a bearish reaction from the pivot towards the 1st support.
The pivot at 2190.27 presents significant swing high resistance, supported by the 127.20% Fibonacci Extension and the 61.80% Fibonacci Projection, suggesting a potential area of resistance where selling pressure could intensify.
The 1st support level at 2079.07 serves as pullback support, offering a potential area where buying interest might emerge, potentially halting the downward movement.
Conversely, the 1st resistance at 2245.20 presents a significant barrier, reinforced by the 161.80% Fibonacci Extension and the 78.60% Fibonacci Projection, indicating a strong resistance zone where selling pressure may increase, potentially limiting further upward movement in the price.
EUR/GBP and GBP/CHF await UK data
Sterling would likely be on the move this week as key UK economic indicators, including GDP, employment, and wages data, are set to be released. These figures are eagerly watched, as any deviation from expectations could influence the market's anticipations for the upcoming inflation report and BoE's subsequent meeting next week.
GBP/CHF's rally from 1.0634 continued last week and hit as high as 1.1287. Immediate focus is now on 100% projection of 100% projection of 1.0634 to 1.1058 from 1.0893 at 1.1317. Decisive break there would prompt upside acceleration towards 161.8% projection at 1.1579. While overbought condition, as seen in D RSI, might limit upside at 1.1317 on initial attempt, near term outlook will stay bullish as long as 1.1182 resistance turned support holds.
In the larger picture, the break of 55 E EMA is a medium term bullish sign. This also strengthen the case that correction from 1.1574 has completed at 1.0634 already. Rise from 1.0183 (2022 low) could be ready to resume. Retest of 1.1574 should be seen next, and firm break there will pave the way to 100% projection of 1.0183 to 1.1574 from 1.0634 at 1.2025 in the medium term.
EUR/GBP's rejection by 55 D EMA is a near term bearish sign, which suggests that fall from 0.8764 is still in progress. Break of 0.8497 support will resume this decline to 61.8% projection of 0.8977 to 0.8491 from 0.8764 at 0.8464. Firm break there could trigger downside acceleration to 100% projection at 0.8278.
Any downside acceleration ahead would also strengthen the case that fall from 0.9267 is going to extend through 0.8201 (2022 low) in the medium term, as the third leg of the pattern from 0.9499 (2020 high).
Japan’s Q4 GDP finalized at 0.1% qoq, a narrow escape from recession
Japan's economy has narrowly avoided a recession, as shown in the final GDP figures for Q4. The revised data indicates a modest growth of 0.1% qoq, a positive swing from the preliminary estimate of -0.1% qoq contraction. On annualized basis, GDP expanded by 0.4%, contrasting sharply with initial reports of -0.4% decline.
The main driver behind this upward revision was significant increase in capital expenditure, which surged by 2% qpq, deviating markedly from the initially estimated -0.1% qoq drop. However, private consumption, accounting for approximately 60% of Japan's economy, presented a less optimistic picture, declining by -0.3% qoq, a slight deterioration from the provisional figure of -0.2% qoq.
This latest economic data comes at a crucial time, but it does not seem to deter BoJ from considering an interest rate hike for the first time since 2007, scheduled for March 19. The anticipation builds around the annual Spring wage negotiations, which have so far shown strong momentum. Positive outcomes are also expected from the forthcoming results from Rengo, Japan's largest union group, on March 15.
China’s CPI turned positive to 0.8% yoy amid Lunar New Year demands
In February, China's CPI marked its first annual increase after a six-month sequence of declines. CPI rose by 0.7% yoy, surpassing expectation of 0.3% yoy and marking a significant rebound from January's -0.8% yoy, the largest decrease in consumer prices since 2009. On a month-on-month basis, CPI acceleration was evident, jumping from a modest 0.3% mom to 1.0% om, well above the forecasted 0.7% mom.
This inflationary uptick, primarily driven by heightened demand during the Lunar New Year celebrations, underscores the seasonal influence on China's economic activities. Notably, food prices witnessed a considerable increase of 3.3% mom, a reflection of the festive period's impact.
Conversely, PPI had a contrary movement, declining by -2.7% yoy, indicating deeper deflationary pressures than the anticipated -2.5%.
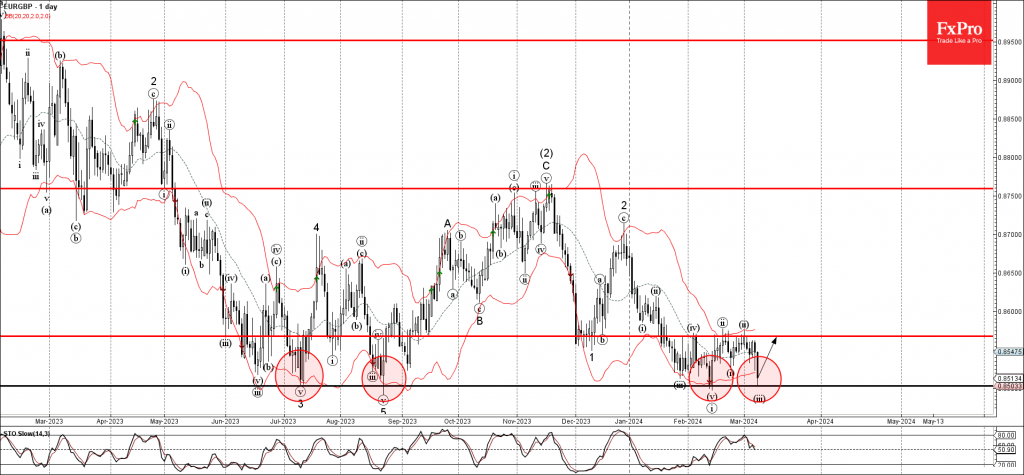
EURGBP Wave Analysis
- EURGBP reversed from multi-month support level 0,8500
- Likely to rise to resistance level 0.8565
EURGBP currency pair today reversed up from the major multi-month support level 0,8500 (which has been repeatedly reversing the pair from last July, as can be seen below).
The support level 0,8500 was further strengthened by the lower daily Bollinger Band.
Given the strength of the support level 0,8500 and the clear bullish divergence on the daily Stochastic indicator, EURGBP currency pair can be expected to rise further toward the next resistance level 0.8565, which stopped the earlier minor corrections iv, ii and ii.
Gold Wave Analysis
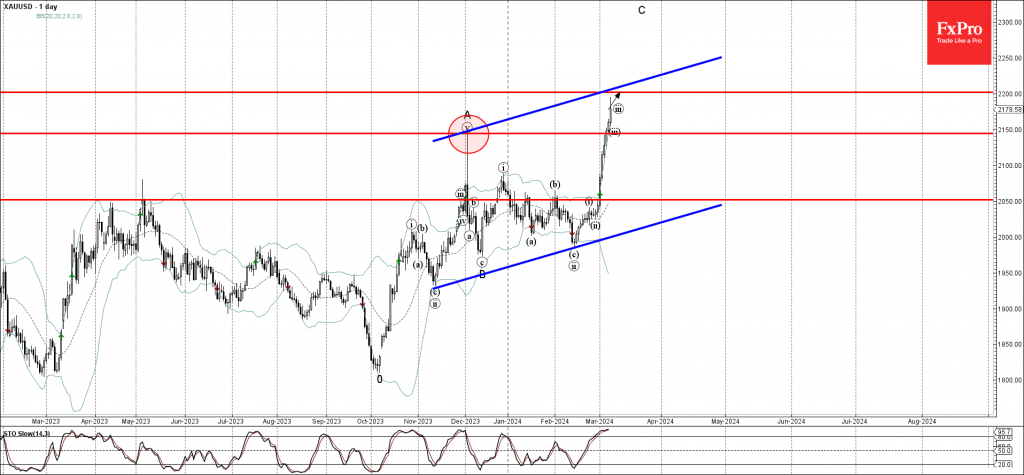
- Gold broke key resistance level 2150.00
- Likely to rise to resistance level 2200.00
Gold continues to rise strongly after breaking the key resistance level 2150.00 (which stopped wave A of the active ABC correction at the start of last December, as can be seen below).
The breakout of the resistance level 2150.00 accelerated the active short-term impulse waves iii and C.
Given the clear daily and the weekly uptrend, Gold can be expected to rise further toward the next resistance level 2200.00 (target price for the completion of the active impulse wave iii, coinciding with the daily up channel from last year).