

Sample Category Title
Ethereum (ETHUSD) : Buying The Dips At The Blue Box Area
Hello fellow traders. In this technical article we’re going to take a look at the Elliott Wave charts charts of ETHUSD published in members area of the website. As our members know Ethereum has given us 3 waves pull back recently that found buyers right at the Blue Box ( Buying Area). We have been favoring the long side due to impulsive bullish sequences the crypto is showing in the cycle from the October 2023 low. In further text we’re going to explain the short term Elliott Wave forecast and trading setup.
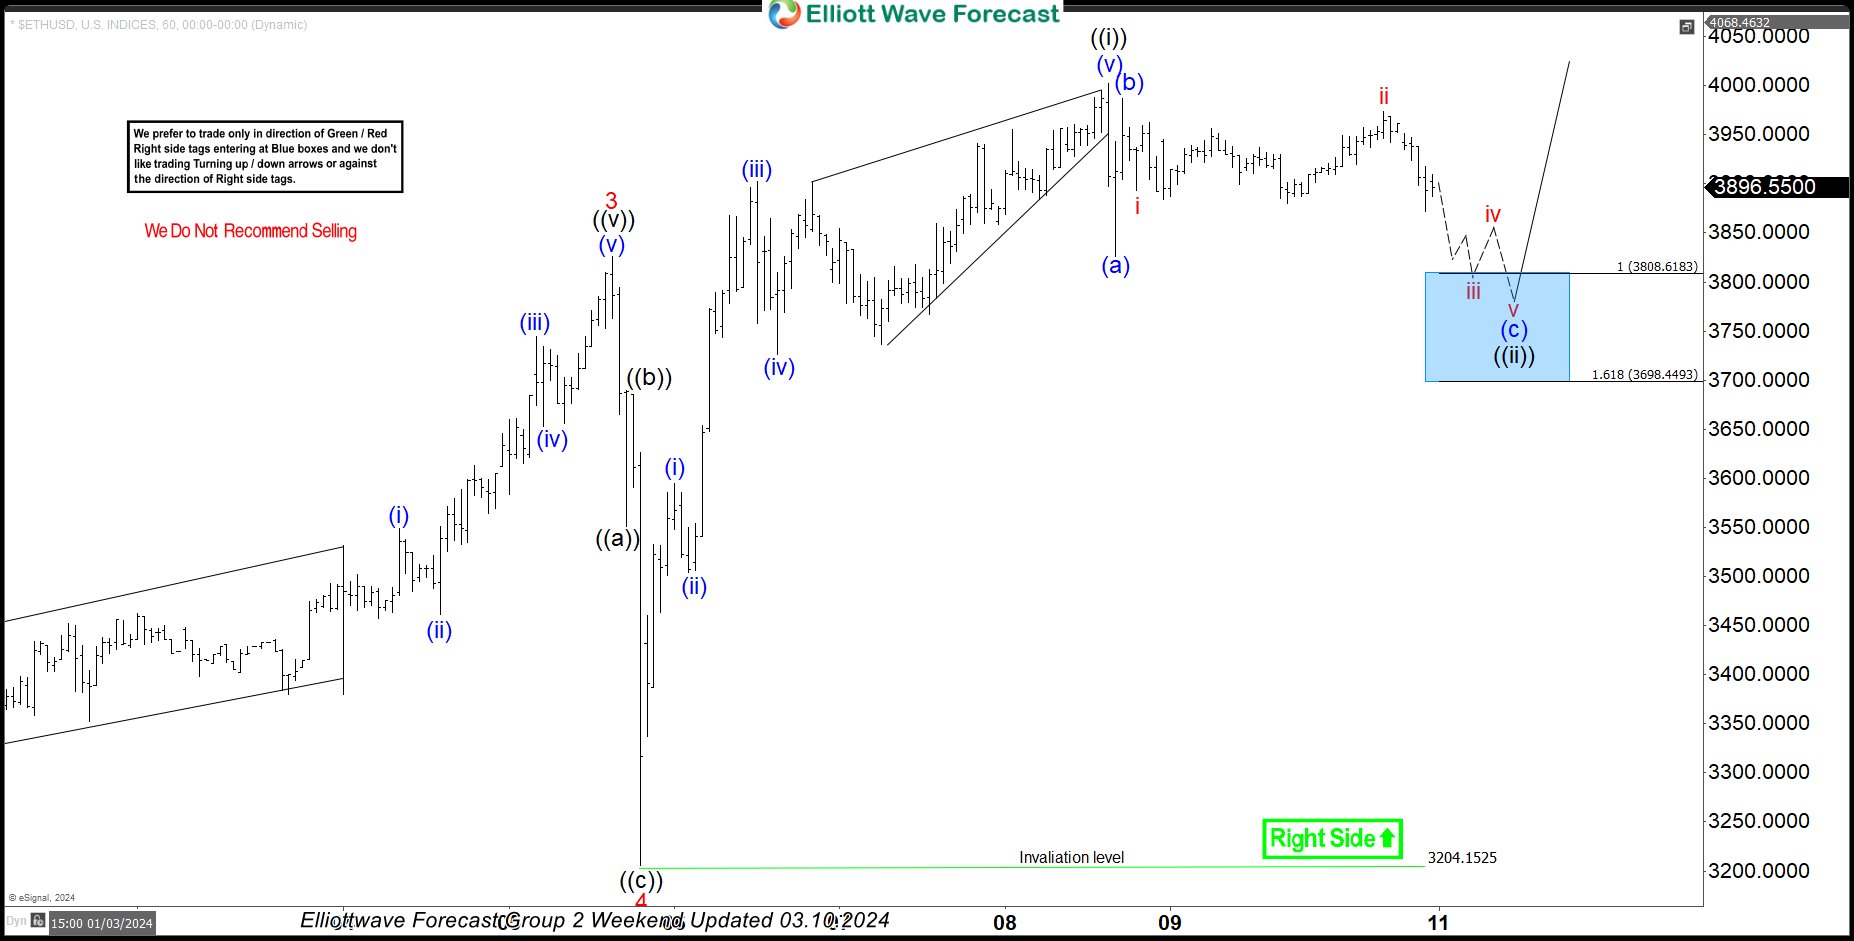
ETHUSD Elliott Wave 1 Hour Chart 03.10.2024
Current view suggests Ethereum ended short term cycle from the 3204.15 low as 5 waves rally -((i)) black. Currently the crypto is doing intraday pull back , wave ((ii)) black. We expect to see another leg down (c) of ((ii)) to complete the structure. We don’t recommend selling ETHUSD and prefer the long side from the marked Blue Box ( buying zone). Once Ethereum reaches our buying area, it should ideally make either rally toward new highs or in 3 waves bounce alternatively. When bounce reaches 50 Fibs against the (b) blue high, we will make long position risk free ( put SL at BE) and take partial profits.
Quick reminder on how to trade our charts :
Red bearish stamp+ blue box = Selling Setup
Green bullish stamp+ blue box = Buying Setup
Charts with Black stamps are not tradable. 🚫
Official trading strategy on How to trade 3, 7, or 11 swing and equal leg is explained in details in Educational Video, available for members viewing inside the membership area.
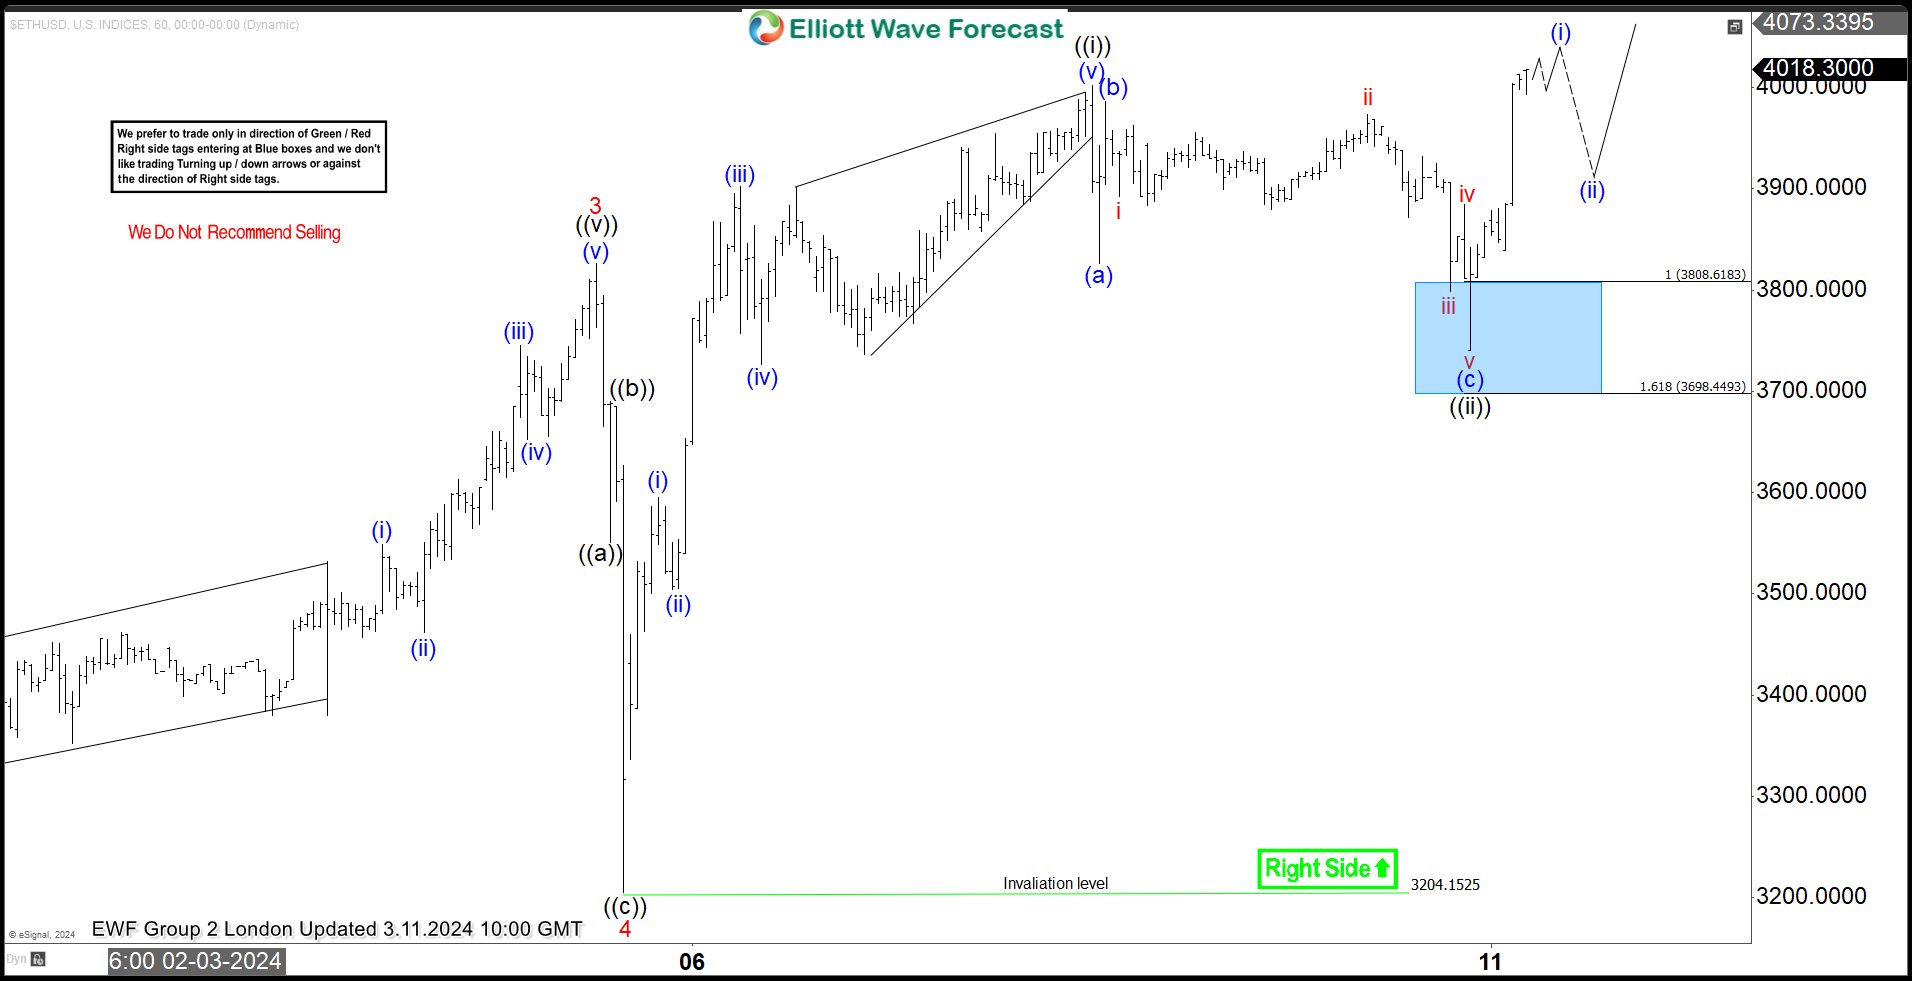
ETHUSD Elliott Wave 1 Hour Chart 03.11.2024
Ethereum found buyers right at the marked blue box as expected and we got good reaction from there. Pull back completed at 3733 low. Rally from that level looks impulsive. We expect ETHUSD to keep finding intraday buyers in 3,7,11 swings and we don’t recommend selling in any proposed pull back.
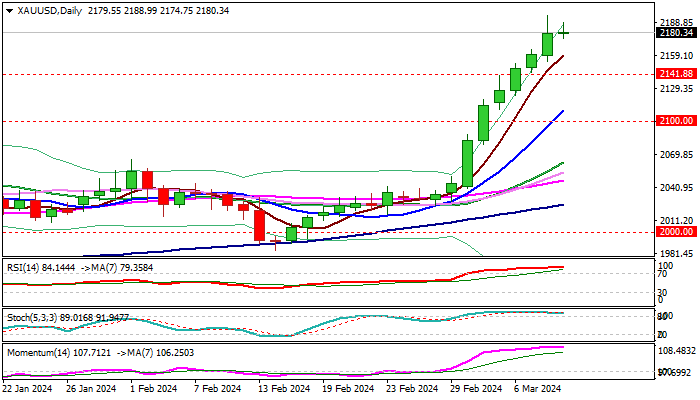
XAU/USD: Gold Consolidating After 4.6% Advance Last Week
Bulls are taking a breather and consolidating within a narrow range on Monday, just under new all-time high ($2195) and psychological $2200 barrier.
The yellow metal continues to shine (advanced 4.6% last week, in the biggest weekly gain since the second week of March 2023), lifted by growing expectations for Fed rate cut.
Strongly overbought conditions on daily chart suggest that traders may opt for partial profit taking, although relatively quiet trading on Monday, also indicates that markets await fresh signals from US inflation data, due on Tuesday.
Gold will likely rise further if February numbers confirm that inflation remains in a downward trajectory which will add to expectations for the first rate cut in June.
Conversely, higher than expected figures would raise worries about persisting price pressures and probably cool the expectations for the start of policy easing, as Fed Chief Powell said last week that the central bank’s policy decisions will directly depend on inflation data.
Initial support lays at $2174 (session low) followed by rising 5DMA ($2158), former top at $2141 and daily Kijun-sen/psychological ($2019/$2100 respectively).
Immediate resistances lay T $2200/06 (psychological / Fibo 138.2% projection), with sustained break of $2200 zone to expose targets at $2245 (161.8%) and $2270 (176.4% projection) in extension.
Res: 2195; 2200; 2206; 2245.
Sup: 2174; 2141; 2100; 2088.
EUR/USD Mid-Day Outlook
Daily Pivots: (S1) 1.0911; (P) 1.0946; (R1) 1.0974; More...
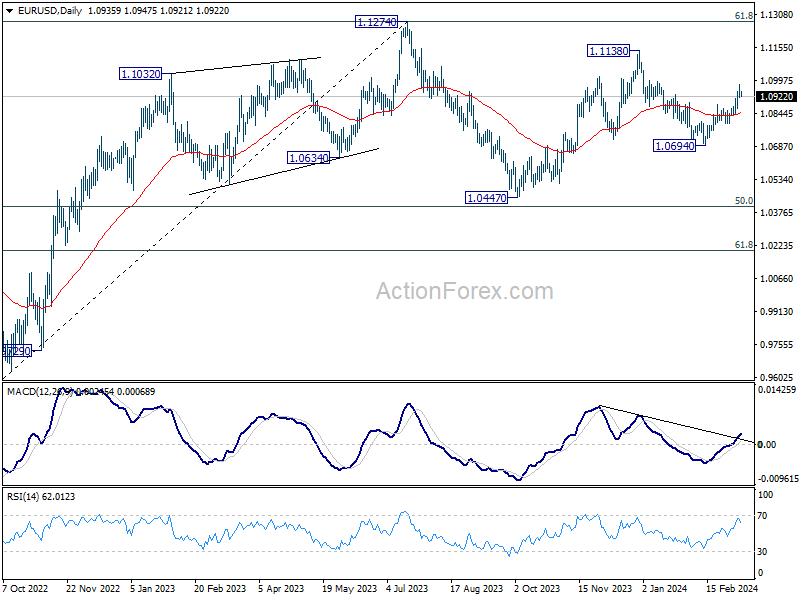
Intraday bias in EUR/USD is turned neutral with current retreat. Some consolidations would be seen below 1.0980 temporary top first. But further rise would remain in favor as long as 1.0797 support holds. Fall from 1.1138 could have completed at 1.0694, as a correction to rise from 1.0447. Above 1.0980 will resume the rise from 1.0694 to retest 1.1138 high.
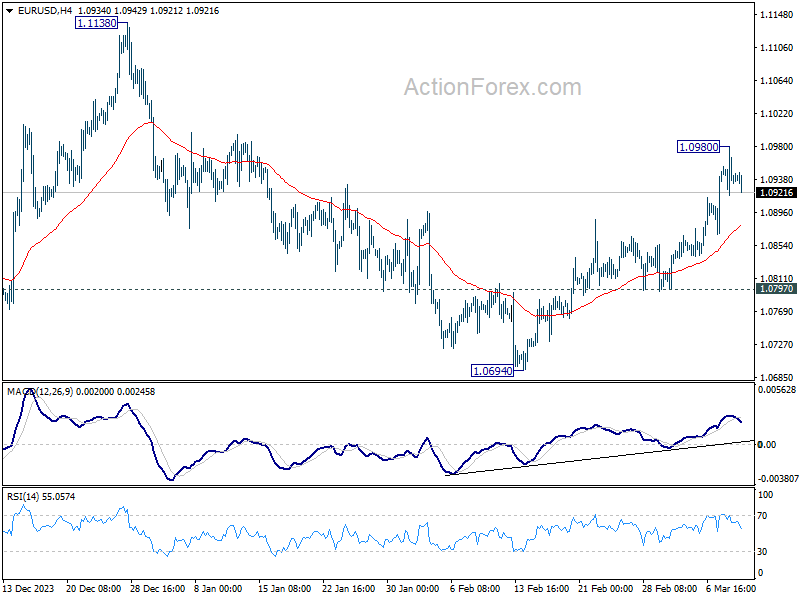
In the bigger picture, price actions from 1.1274 are viewed as a corrective pattern to rise from 0.9534 (2022 low). Rise from 1.0447 is seen as the second leg. While further rally could cannot be ruled out, upside should be limited by 1.1274 to bring the third leg of the pattern. Meanwhile, sustained break of 1.0694 support will argue that the third leg has already started for 1.0447 and possibly below.
GBP/USD Mid-Day Outlook
Daily Pivots: (S1) 1.2809; (P) 1.2852; (R1) 1.2902; More...
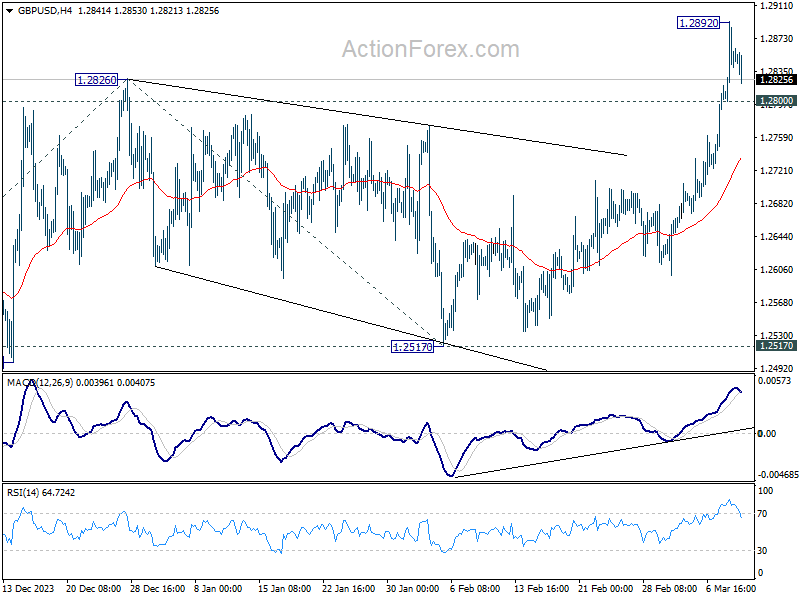
Intraday bias in GBP/USD is turned neutral first with current retreat. Some consolidations would be seen below 1.2892 temporary top first. But further rally will remain in favor as long as 55 4H EMA (now at 1.2735) holds. On the upside, above 1.2892 will resume larger rise from 1.2063 and target 61.8% projection of 1.2036 to 1.2826 from 1.2517 at 1.3005.
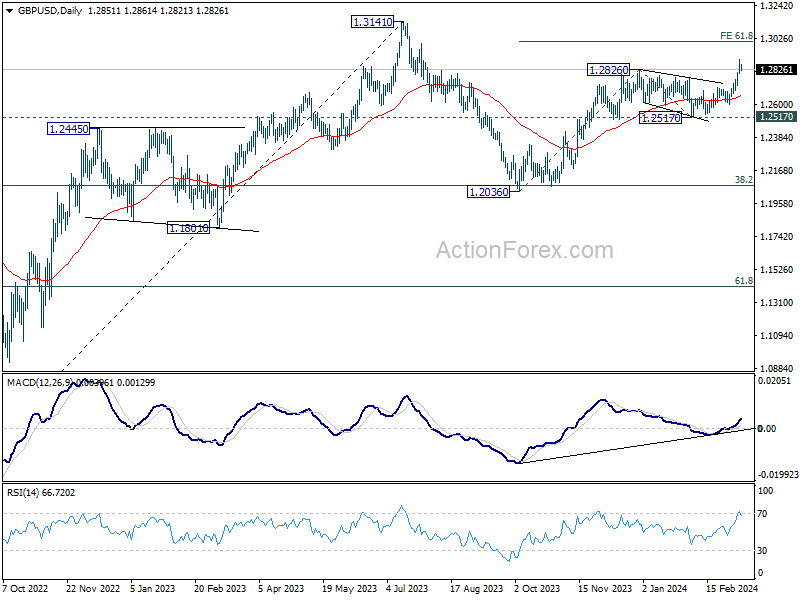
In the bigger picture, price actions from 1.3141 medium term top are seen as a corrective pattern to up trend from 1.0351 (2022 low). Rise from 1.2036 is seen as the second leg, which is still in progress. But upside should be limited by 1.3141 to bring the third leg of the pattern. Meanwhile, break of 1.2517 support will argue that the third leg has already started for 38.2% retracement of 1.0351 (2022 low) to 1.3141 at 1.2075 again.
USD/CHF Mid-Day Outlook
Daily Pivots: (S1) 0.8743; (P) 0.8764; (R1) 0.8797; More....
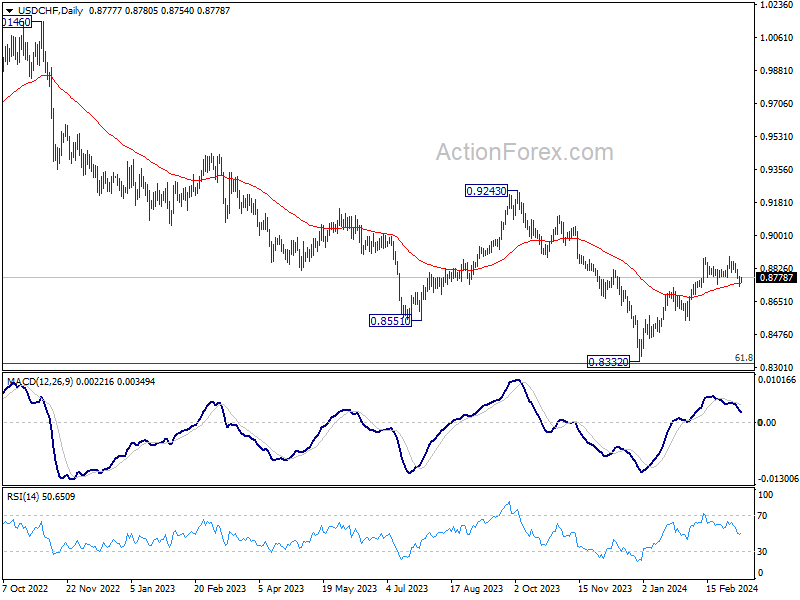
Range trading continues in USD/CHF and intraday bias stays neutral at this point. On the downside, sustained break of 0.8741 will argue that the whole rebound from 0.8332 might have completed, and bring deeper fall to 0.8550 support. Nevertheless, strong bounce from current level will retain near term bullishness. Further break of 0.8891 will resume the rise from 0.8332.
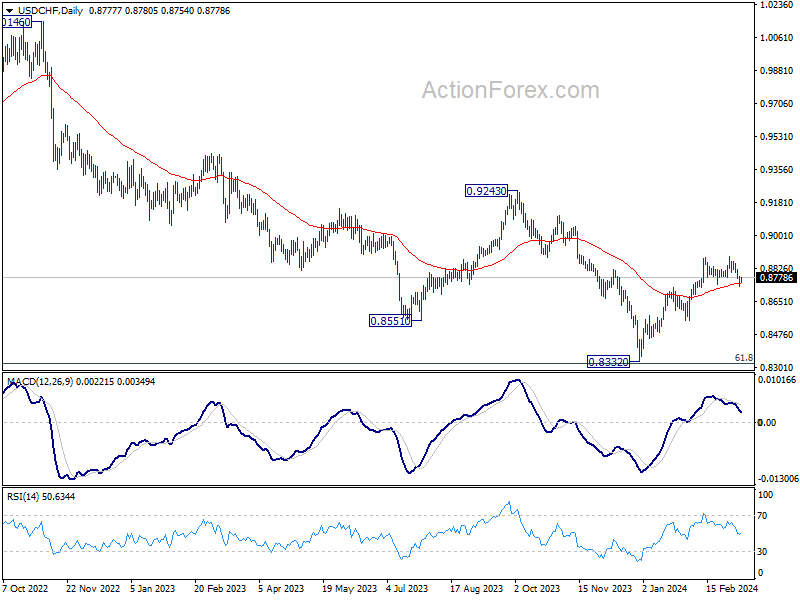
In the bigger picture, price actions from 0.8332 medium term bottom as seen as developing into a corrective pattern to the down trend from 1.0146 (2022 high). Further rise would be seen as long as 0.8555 support holds. But upside should be limited by 0.9243 resistance, at least on first attempt.
USD/JPY Mid-Day Outlook
Daily Pivots: (S1) 146.33; (P) 147.23; (R1) 147.96; More...
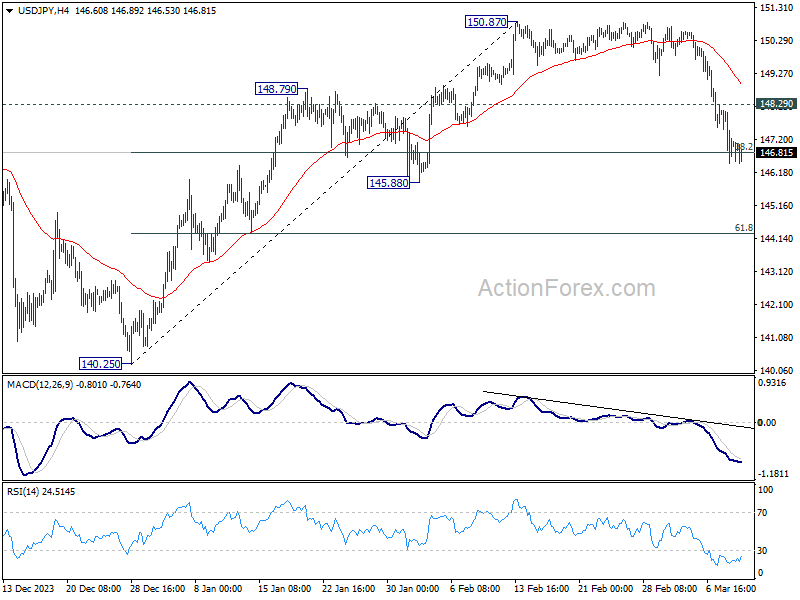
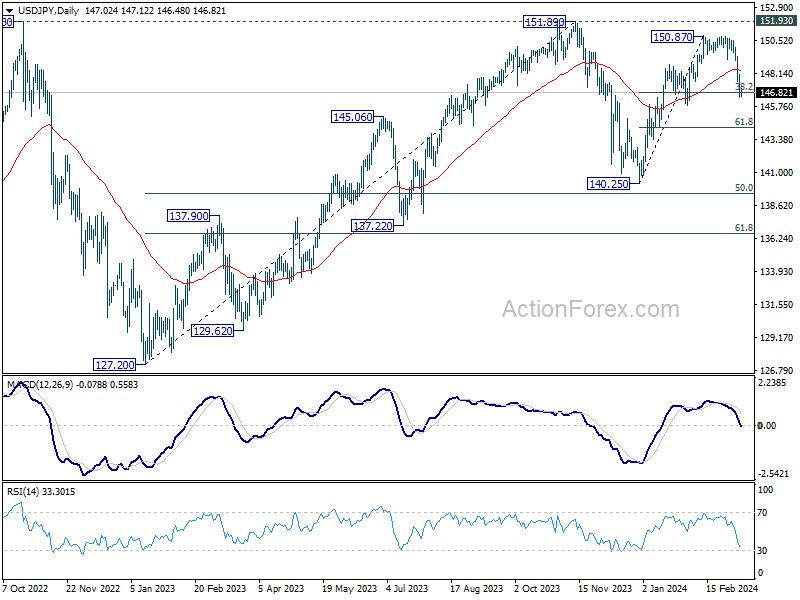
Intraday bias in USD/JPY remains on the downside and outlook is unchanged. Sustained break of 38.2% retracement of 140.25 to 150.87 at 146.81 will argue that fall from 150.87 is reversing the whole rally from 140.25. In this case, deeper decline would be seen to 61.8% retracement at 144.30 and below. Nevertheless, strong support from 146.81, followed by break of 148.29 minor resistance resistance, will argue that fall from 150.87 is merely a correction, which has completed already.
In the bigger picture, no change in the view that price action from 151.89 (2023 high) are correction to up trend from 127.20 (2023 low). The question is whether this correction has completed at 140.25, or extending with fall from 150.87 as the third leg. Sustained break of above mentioned 146.81 fibonacci level will favor the latter case. But even so, downside should be contained by 50% retracement of 127.20 to 151.89 at 139.54.
Yen Dominates Quiet Markets, Bitcoin Achieves Record High
Yen continues to stand out as the strongest currency in today's relatively subdued markets, supported by anticipations of an imminent rate hike by BoJ next week. Swiss Franc and US Dollar are trailing behind in strength, indicating a preference for safer assets. Conversely, Australian Dollar, New Zealand Dollar, and Sterling find themselves at the lower end of the performance spectrum, with Canadian Dollar also showing signs of weakness. This currency alignment hints at a cautious risk-off sentiment prevailing in the market, awaiting confirmation from developments in the US.
With no significant economic announcements scheduled for North America today and Fed ongoing blackout period, the forex market's direction seems to be at the mercy of overarching risk sentiments. However, the overall picture is set to become more dynamic tomorrow with a lineup of economic data releases. The agenda begins with Japan's PPI and Australia's NAB business confidence index during Asian session, followed by the spotlight shifting to UK's employment data and wages growth, and culminating with US CPI. Investors and traders are advised to maintain calm and secure their seatbelts in anticipation of market-moving data on Tuesday.
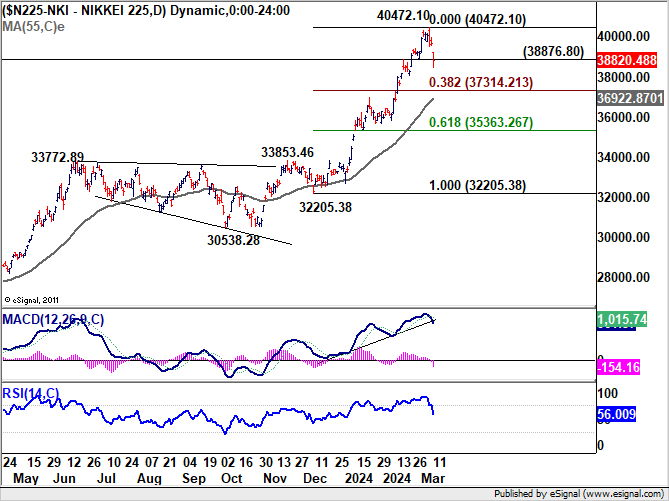
Technically, Nikkei's break of 38876.80 support today should confirm short term topping at 40472.10. Investors could be taking profits now in anticipation of next week's BoJ meeting. Deeper pull back is in favor to 38.2% retracement of 32205.38 to 40472.10 at 37314.21. But strong support should be seen around 55 D EMA (now at 36922.87) to bring rebound.
In Europe, at the time of writing, FTSE is down -0.37%. DAX is down -0.55%. CAC is down -0.19%. UK 10-year yield is down -0.0149 at 4.045. Germany 10-year yield is up 0.019 at 2.285. Earlier in Asia, Nikkei fell -2.19%. Hong Kong HSI rose 1.43%. China Shanghai SSE rose 0.74%. Singapore Strait Times fell -0.28%. Japan 10-year JGB yield rose 0.0325 to 0.767.
Bitcoin breaks 72k, regulatory nod and ETF inflows propel
Bitcoin's bullish momentum has once again captured the market's attention as it makes new record high above 72k mark today. This surge follows the UK Financial Conduct Authority decision to greenlight the creation of cryptocurrency debt instruments on financial exchanges, albeit limited to professional investors.
In addition to regulatory developments, investment flows into ETFs continue to demonstrate strong market interest. Despite slight deceleration, the 10 largest US spot Bitcoin ETFs attracted almost USD 2B in capital for the week ending March 8, according to LSEG data. This continued influx of institutional money into Bitcoin products highlights the growing confidence and interest from investors seeking exposure to digital assets.
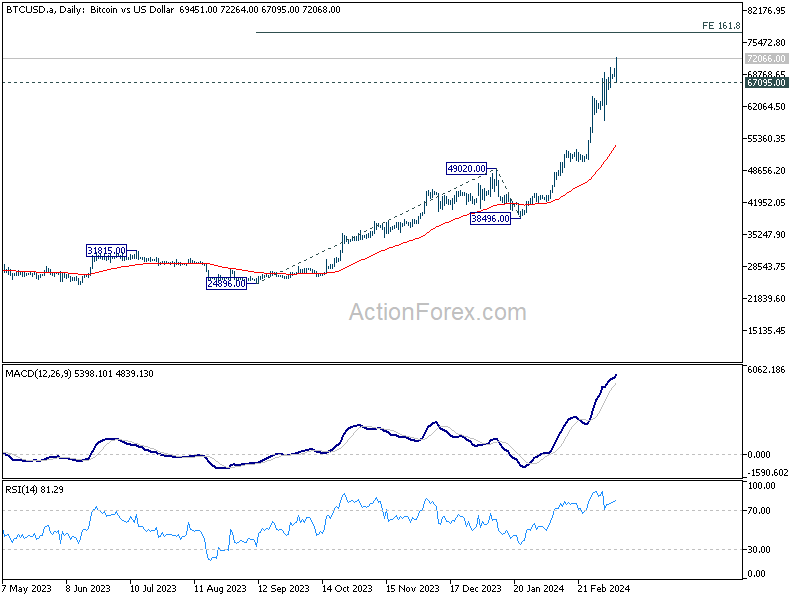
Technically, current rally in Bitcoin is expected to target 161.8% projection of 24896 to 49020 from 38496 at 77572 first. Firm break there will target 200% projection at 86798 next. Meanwhile, break of 67095 support will indicate short term topping and bring consolidations first, before staging another rise.
ECB's Kazimir advocates for June rate cut, citing alive and kicking inflation risks
ECB Governing Council member Peter Kazimir said today he favors June for the first rate cut because upside inflation risks are still "alive and kicking".
"Rushing isn't smart and beneficial," warning that a premature move would risk undermining the ECB's credibility.
"Only in June, with new forecast at hand, will the level of confidence reach the threshold," he said, adding that he favors "a smooth and steady cycle of policy easing."
"Upside inflation risks are alive and kicking," Kazimir said, listing factors including workers' pay, energy prices, fiscal policy and the green transition.
"The current picture clearly favors staying calm for the coming weeks and delivering the first-rate cut in summer," he said. "The slowdown in inflation remains fragile — we can't take it for granted."
Japan's Q4 GDP finalized at 0.1% qoq, a narrow escape from recession
Japan's economy has narrowly avoided a recession, as shown in the final GDP figures for Q4. The revised data indicates a modest growth of 0.1% qoq, a positive swing from the preliminary estimate of -0.1% qoq contraction. On annualized basis, GDP expanded by 0.4%, contrasting sharply with initial reports of -0.4% decline.
The main driver behind this upward revision was significant increase in capital expenditure, which surged by 2% qoq, deviating markedly from the initially estimated -0.1% qoq drop. However, private consumption, accounting for approximately 60% of Japan's economy, presented a less optimistic picture, declining by -0.3% qoq, a slight deterioration from the provisional figure of -0.2% qoq.
This latest economic data comes at a crucial time, but it does not seem to deter BoJ from considering an interest rate hike for the first time since 2007, scheduled for March 19. The anticipation builds around the annual Spring wage negotiations, which have so far shown strong momentum. Positive outcomes are also expected from the forthcoming results from Rengo, Japan's largest union group, on March 15.
USD/JPY Mid-Day Outlook
Daily Pivots: (S1) 146.33; (P) 147.23; (R1) 147.96; More...
Intraday bias in USD/JPY remains on the downside and outlook is unchanged. Sustained break of 38.2% retracement of 140.25 to 150.87 at 146.81 will argue that fall from 150.87 is reversing the whole rally from 140.25. In this case, deeper decline would be seen to 61.8% retracement at 144.30 and below. Nevertheless, strong support from 146.81, followed by break of 148.29 minor resistance resistance, will argue that fall from 150.87 is merely a correction, which has completed already.
In the bigger picture, no change in the view that price action from 151.89 (2023 high) are correction to up trend from 127.20 (2023 low). The question is whether this correction has completed at 140.25, or extending with fall from 150.87 as the third leg. Sustained break of above mentioned 146.81 fibonacci level will favor the latter case. But even so, downside should be contained by 50% retracement of 127.20 to 151.89 at 139.54.
Economic Indicators Update
| GMT | Ccy | Events | Actual | Forecast | Previous | Revised |
|---|---|---|---|---|---|---|
| 23:50 | JPY | GDP Q/Q Q4 F | 0.10% | 0.30% | -0.10% | |
| 23:50 | JPY | GDP Deflator Y/Y Q4 F | 3.90% | 3.80% | 3.80% | |
| 23:50 | JPY | Money Supply M2+CD Y/Y Feb | 2.50% | 2.40% | 2.40% | |
| 06:00 | JPY | Machine Tool Orders Y/Y Feb P | -8.0% | -14.10% | -14.0% |
Japanese Yen Surges to Monthly High as Economy Shows Signs of Growth
The Japanese yen strengthened against the US dollar on Monday, reaching a month-long peak following the release of statistics indicating Japan's return to economic growth in Q4 2023. This development effectively ends the previously declared technical recession.
Japan's GDP experienced a quarterly increase of 0.1% and an annual growth of 0.4%. These figures revise earlier estimates, suggesting 0.1% and 0.4% declines, respectively. In comparison, the Japanese economy contracted by 0.8% quarterly and 3.3% annually in Q3 2023.
The positive economic data have fuelled market speculation about a potential interest rate hike by the Bank of Japan, with some economists and traders anticipating such a move as soon as March.
Bank of Japan board member Junko Nakagawa recently commented on the visible prospects for achieving inflation targets and a positive wage cycle, further supporting the yen.
The Japanese currency is currently benefitting from the weakening US dollar and a drop in US government bond yields amid the Federal Reserve's dovish rhetoric.
Technical Analysis of USD/JPY
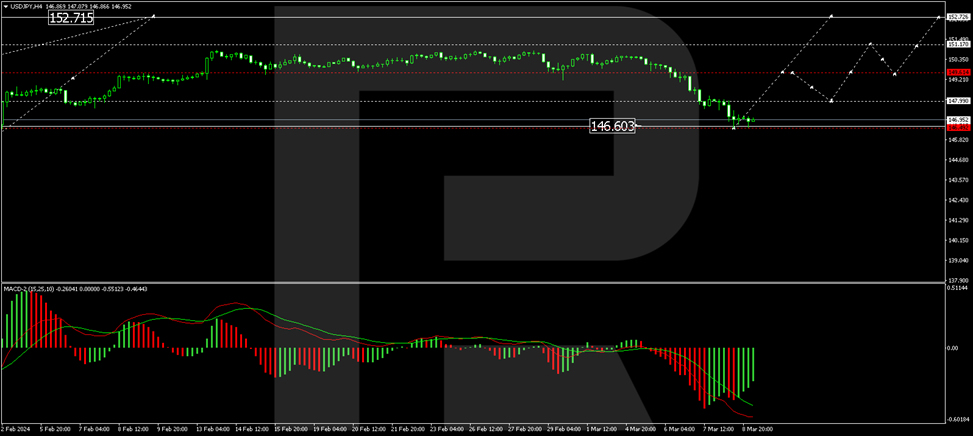
On the H4 USD/JPY chart, a correction wave to the 146.48 level has been completed (tested from above). The market is now forming a consolidation range above this level, expecting to break upwards and initiate the fifth growth wave towards 152.72. The MACD oscillator supports this scenario, with its signal line trading below zero at minimums and poised for growth.
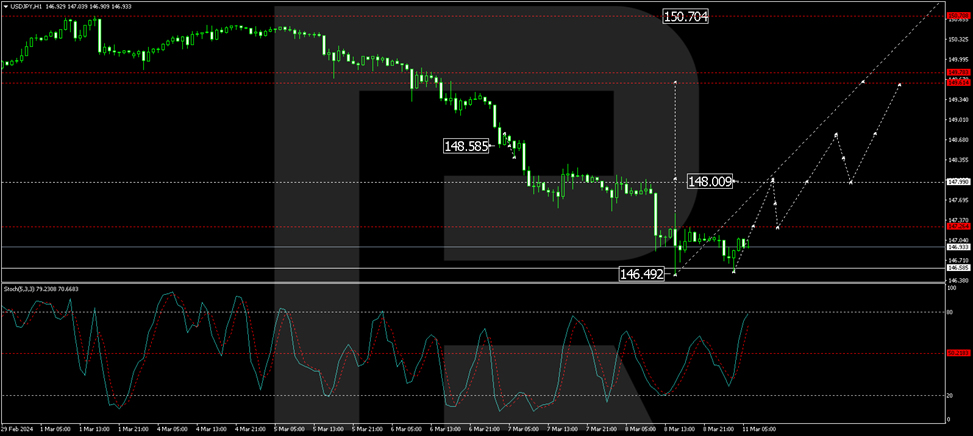
On the H1 USD/JPY chart, a correction wave to 146.48 has finished. A growth impulse to 147.26 and its correction to 146.55 have been executed, essentially setting the consolidation range boundaries. With an upward breakout, growth towards the 148.00 level is anticipated. This target is the first in the growth wave. The Stochastic oscillator confirms this scenario, with its signal line above the 50 mark and strictly heading towards 80.
Bitcoin breaks 72k, regulatory nod and ETF inflows propel
Bitcoin's bullish momentum has once again captured the market's attention as it makes new record high above 72k mark today. This surge follows the UK Financial Conduct Authority decision to greenlight the creation of cryptocurrency debt instruments on financial exchanges, albeit limited to professional investors.
In addition to regulatory developments, investment flows into ETFs continue to demonstrate strong market interest. Despite slight deceleration, the 10 largest US spot Bitcoin ETFs attracted almost USD 2B in capital for the week ending March 8, according to LSEG data. This continued influx of institutional money into Bitcoin products highlights the growing confidence and interest from investors seeking exposure to digital assets.
Technically, current rally in Bitcoin is expected to target 161.8% projection of 24896 to 49020 from 38496 at 77572 first. Firm break there will target 200% projection at 86798 next. Meanwhile, break of 67095 support will indicate short term topping and bring consolidations first, before staging another rise.
ECB’s Kazimir advocates for June rate cut, citing alive and kicking inflation risks
In a statement today, ECB Governing Council member Peter Kazimir highlighted his preference delivering the first rate cut in June. Emphasizing the persistent nature of upside inflation risks, Kazimir pointed to factors such as workers' pay, energy prices, fiscal policy, and the green transition as ongoing concerns that necessitate caution.
Kazimir's stance is clear: "Rushing isn't smart and beneficial," he remarked, underlining the jeopardy to ECB's credibility from a hasty policy adjustment.
According to him, "Only in June, with new forecast at hand, will the level of confidence reach the threshold."
Also, he advocates for a "smooth and steady cycle of policy easing," suggesting that the decision-making process should be grounded in comprehensive and up-to-date economic forecasts.
"Upside inflation risks are alive and kicking," he asserted, emphasizing the need for vigilance. "The current picture clearly favors staying calm for the coming weeks and delivering the first-rate cut in summer," he said. "The slowdown in inflation remains fragile — we can't take it for granted."