

Sample Category Title
GBP/USD Eyes Bailey, Jobs Report
The British pound is showing limited movement at the start of the week. In Monday’s North American session, GBP/USD is trading at 1.2610, down 0.15%.
Bank of England Governor Andrew Bailey will speak at a public event later today and the markets will be listening carefully, looking for hints about the BoE’s future rate path. The BOE kept rates unchanged at 5.25% for a fifth straight time at the meeting on January 31, as expected. The MPC vote was a surprise, however, with a three-way split. This indicates a divergence of views among MPC members as to the future rate path.
Inflation is running at a 3.9% clip, well above the 2% target and maintaining rates in restrictive territory should push inflation lower. At the same time, elevated interest rates could tip the weak UK economy into a recession, and weary home owners are looking for relief from high mortgage payments.
After Bailey’s remarks, market attention will focus on Tuesday’s employment report. The labour market has been cooling but remains in good shape and strong wage growth continues to drive inflation, which is a major headache for the BoE.
The economy is projected to have added 73,000 jobs in the three months to December, compared to 108,000 in the three months to November. Unemployment is expected to creep up to 4.0%, up from 3.9%, while average earnings including bonuses is projected to ease to 5.6%, down from 6.5%.
The Federal Reserve may have signaled that rate cuts are coming, but it has remained hawkish and continues to push back against market expectations of a rate cut. In December, Fed rate odds for a March cut were above 70%, but the odds have been shaved down to just 15%, as the US economy remains surprisingly strong and Fed members have dampened hopes of a March cut. We’ll hear later today from Richmond Fed President Thomas Barkin. Last week, Barkin said that he wants to be sure that inflation is clearly headed to 2% before he supports lowering rates.
USD/JPY Mid-Day Outlook
Daily Pivots: (S1) 149.01; (P) 149.29; (R1) 149.56; More...
Intraday bias in USD/JPY is turned neutral as retreat from 149.57 is extending. Some consolidations could be seen but further rally is expected as long as 147.62 support holds. Above 149.57 will resume the rise from 140.25 to retest 151.89/93 key resistance zone. Decisive break there will confirm resumption of larger up trend.
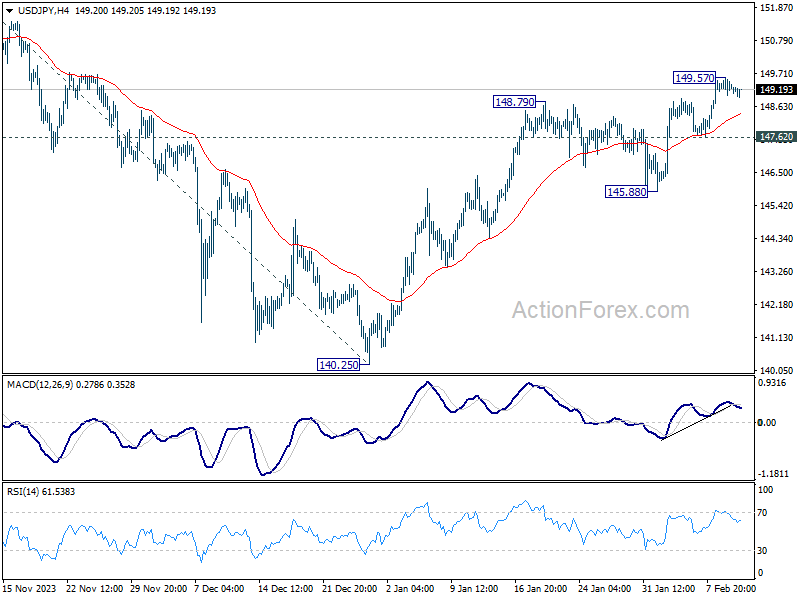
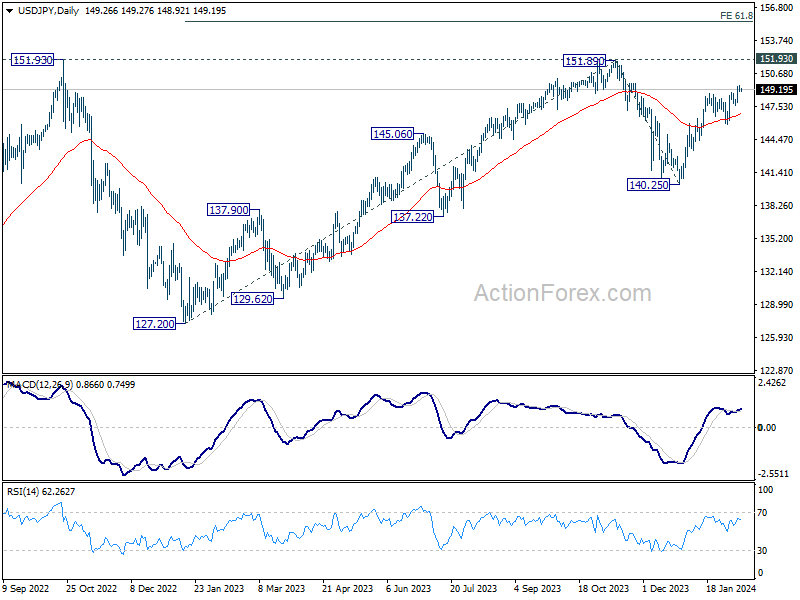
In the bigger picture, fall from 151.89 is seen as a correction to the rally from 127.20, which might have completed at 140.25 already. Firm break of 151.89/93 resistance zone will confirm up trend resumption, and next target will be 61.8% projection of 127.20 to 151.89 from 140.25 at 155.50. This will now remain the favored case as long as 140.25 support holds.
Yen Regaining Ground, GBP/AUD Staying Bullish Despite Loss of Momentum
Japanese Yen stages a broad recovery today, buoyed by notable retreat in European benchmark yields. Meanwhile, Dollar is softening against Yen, yet holding its ground across other major currencies. New Zealand Dollar emerges as the day's underperformer, yet its losses remain contained within Friday's range against all counterparts. Sterling and Euro follow closely as the next underperformers.
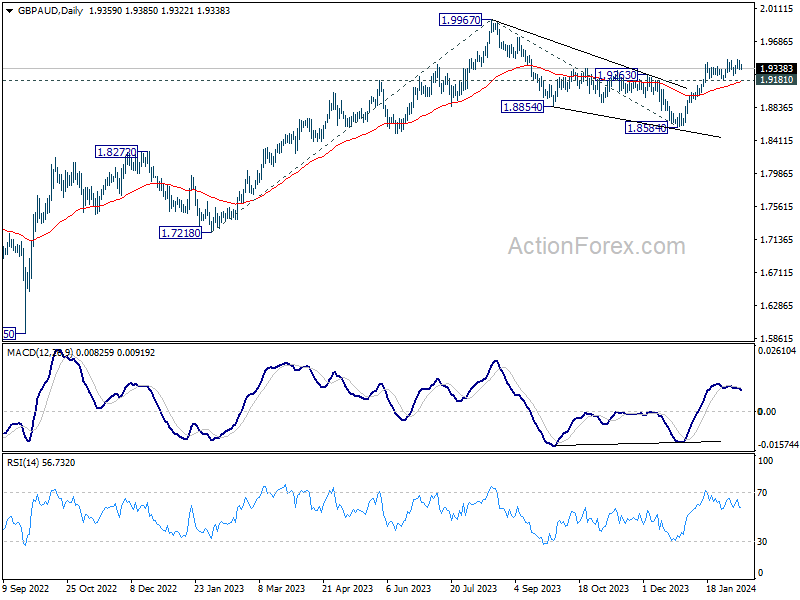
One currency pair to closely monitor this week is GBP/AUD, as the market braces for significant economic releases from both UK and Australia. UK's GDP and inflation data, coupled with Australian employment figures, are poised to potentially sway the direction of GBP/AUD.
Technically, rebound from 1.8584 has been losing momentum since mid January, as seen in D MACD. But near term outlook will stay bullish as long as 1.9181 support holds. Rise from 1.8584 is tentatively seen as resuming the long term up trend through 1.9967 high. However, firm break of 1.9181 will dampen this view and extend the correction from 1.9967 with another falling leg.
In Europe, at the time of writing, FTSE is down -0.08%. DAX is up 0.37%. CAC is up 0.42%. UK 10-year yield is down -0.032 at 4.055. Germany 10-year yield is down -0.034 at 2.351.
Copper stabilizes after selloff on supply concern, no clear bounce yet
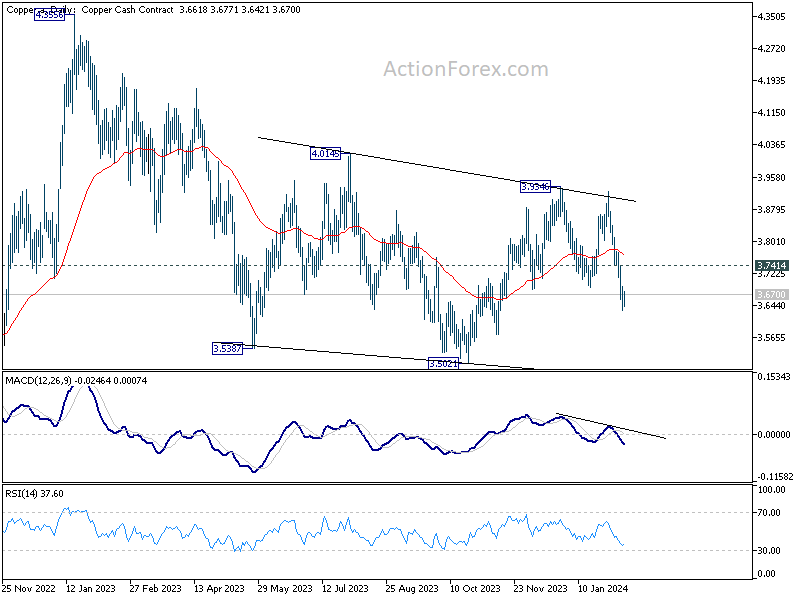
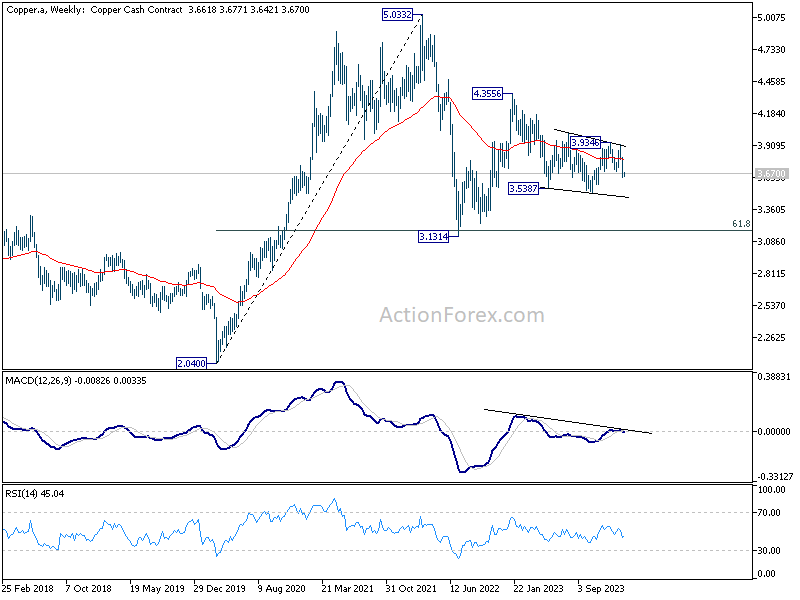
Copper trades steadily in range today, showing no immediate signs of a rebound. Near term selloff intensified following last week's announcement by KoBold Metals, a venture with backing from notable figures including Bill Gates, about the discovery of a substantial copper deposit in Zambia. This revelation has the potential to significantly augment global copper supplies in the years ahead, casting a shadow over the commodity's near-term price outlook.
Technically, near term outlook will stay bearish as long as 3.7414 resistance holds. Deeper decline would be seen to 3.5021 support. Firm break there will pave the way to retest 2022 low at 3.1314. This bearish development, if realized could drag AUD/USD further towards 2022 low at 0.6169.
RBNZ's Orr stands firm on restrictive policy to combat persistent inflation
RBNZ Governor Adrian Orr, in a parliamentary committee appearance today, articulated a firm stance on maintaining restrictive monetary policy to tackle the country's higher-than-desired inflation rate.
Currently sitting at 4.7%, New Zealand's inflation remains "too high" and overshoots RBNZ's target band of 1% to 3%
"That's why we've retained a restrictive monetary policy stance with the official cash rate at 5.5%, and we'll be back at the end of this month again with our updated views on the wisdom of that stance."
Deputy Governor Christian Hawkesby provided additional insights, noting the resilience of New Zealand's financial system and the capacity of consumers to absorb higher interest rates.
"The vast majority of households have continued to manage the debt and service their mortgages, although some are struggling and falling behind," Hawkesby added.
USD/JPY Mid-Day Outlook
Daily Pivots: (S1) 149.01; (P) 149.29; (R1) 149.56; More...
Intraday bias in USD/JPY is turned neutral as retreat from 149.57 is extending. Some consolidations could be seen but further rally is expected as long as 147.62 support holds. Above 149.57 will resume the rise from 140.25 to retest 151.89/93 key resistance zone. Decisive break there will confirm resumption of larger up trend.
In the bigger picture, fall from 151.89 is seen as a correction to the rally from 127.20, which might have completed at 140.25 already. Firm break of 151.89/93 resistance zone will confirm up trend resumption, and next target will be 61.8% projection of 127.20 to 151.89 from 140.25 at 155.50. This will now remain the favored case as long as 140.25 support holds.
Economic Indicators Update
| GMT | Ccy | Events | Actual | Forecast | Previous | Revised |
|---|---|---|---|---|---|---|
| 10:00 | EUR | EU Economic Forecasts |
Copper stabilizes after selloff on supply concern, no clear bounce yet
Copper trades steadily in range today, showing no immediate signs of a rebound. Near term selloff intensified following last week's announcement by KoBold Metals, a venture with backing from notable figures including Bill Gates, about the discovery of a substantial copper deposit in Zambia. This revelation has the potential to significantly augment global copper supplies in the years ahead, casting a shadow over the commodity's near-term price outlook.
Technically, near term outlook will stay bearish as long as 3.7414 resistance holds. Deeper decline would be seen to 3.5021 support. Firm break there will pave the way to retest 2022 low at 3.1314. This bearish development, if realized could drag AUD/USD further towards 2022 low at 0.6169.
NZD/USD Dips Despite Hawkish RBNZ
- RBA’s Orr says high rates still needed
- New Zealand releases inflation Expectations on Tuesday
The New Zealand dollar is lower on Monday. In the European session, NZD/USD is trading at 0.6127, down 0.35%. The New Zealand dollar ended the week on a high note, gaining 0.86% against the US dollar on Friday.
RBNZ’s Orr says restrictive policy must continue
Reserve Bank of New Zealand Governor Orr told a parliamentary committee on Monday that inflation was still too high and the RBNZ would need to maintain its restrictive monetary stance.
Orr’s comments signaled a pushback against rate cut expectations, as the markets had priced in a cut as early as May. Orr said that the current inflation rate of 4.7% was still too high and the RBNZ was focused on lowering it to around 2%.
The RBNZ last raised rates in April 2023 and although the central bank hasn’t acknowledged that the rate-tightening cycle is over, the markets have assumed as much and have looked ahead to rate cuts. However, last week’s employment report was stronger than expected, with job growth rebounding 0.4% in the fourth quarter compared to -0.2% in the third quarter. This has dampened market expectations of a rate cut in May, as strong data reduces pressure on the central bank to lower rates.
The RBNZ’s steep rate-tightening cycle, which has raised the benchmark rate to 5.5%, has significantly lowered inflation but there is more work to be done. Orr & Co. wouldn’t mind maintaining rates in restrictive territory in order to continue pushing inflation lower.
We’ll get a look at New Zealand inflation expectations for the first quarter on Tuesday, which could move the New Zealand dollar. In the fourth quarter, inflation expectations eased to 2.76%, down from 2.83%, which was its lowest level in two years.
WTI Oil: Oil Price Dips on Easing Concerns About Middle East Supply
WTI oil edged lower in early Monday, following calmer tones regarding possible end of Israeli strikes on southern Gaza, which eased fears about supply disruptions from the Middle East.
Fresh easing started to develop a reversal pattern on daily chart after the recent four-day recovery rally was capped by 200DMA / daily cloud top ($77.45) and Friday’s Doji candle with longer upper shadow signaled indecision and rising downside pressure.
Overbought stochastic and south-heading 14-d momentum (although still in the positive territory) contribute to signals, but more work to the downside is required to verify signal.
Fresh bears pressure initial support at $75.88 (Fibo 23.6% of $71.40/$77.26 upleg / Friday’s low), with break here to weaken near-term structure for attack at lower pivot at $75.00 zone (Fibo 38.2% / converged 10/20DMA’s).
Falling 100DMA ($77.93) is approaching 200DMA and about to form a bear-cross, which would add to downside risk.
Alternative scenario requires lift through 200 and 100DMA’s to ease bearish pressure, while break above $79.27 (former high of Jan 29) and psychological $80 barrier to signal bullish continuation.
Res: 77.45; 77.93; 78.13; 79.27.
Sup: 75.88; 75.00; 74.33; 73.64.
GBP/USD: Limited Recovery Warns of Prolonged Sideways Mode
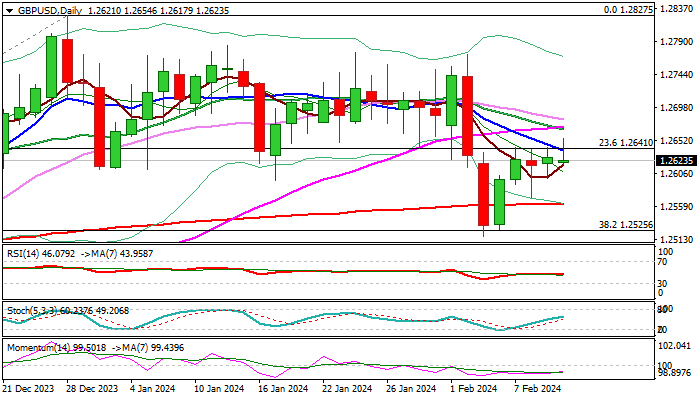
Cable ticked higher and hit new highest since Feb 2 in early Monday but was so far unable to sustain gains, keeping the price within congestion which extends into fourth straight day.
A double Doji (Fri/Thu) signal indecision as daily studies are mixed and keep near-term price action between 200DMA (1.2564) and falling 10DMA (1.2638).
Break of either side to generate initial direction signal, although more work at the upside will be required. Breach of sideways-moving and converged daily Tenkan-Kijun-sen (1.2645/51 respectively) to revive bulls, with lift and close above daily cloud top (1.2691) to confirm continuation of recovery leg from 1.2518 (Feb 5 low).
Conversely, break below 200DMA support to weaken near-term structure for renewed attack at 1.2525 pivot (Fibo 38.2% of 1.2037/1.2827 rally), violation of which to open way for deeper correction.
Res: 1.2651; 1.2670; 1.2691; 1.2755.
Sup: 1.2599; 1.2566; 1.2525; 1.2481.
EUR/USD: Recovery Likely to Stall Under the Base of Thick Daily Cloud
Recovery leg from 1.0723 double bottom (Feb 5/6) started to face increased headwinds on approach to daily Tenkan-sen (1.0810), with the base of thick daily cloud (spanned between 1.0828 and 1.0969) laying just above and adding pressure.
Initial signals of recovery stall are developing on daily chart as technical studies remain bearish (daily Tenkan / Kijun-sen are in bearish setup / 14-d momentum indicator remains in negative territory and 20/200 DMA death-cross is forming) suggesting selling upticks under cloud base for fresh attempt at 1.0712 Fibo support (61.8% of 1.0448/1.1139 ascend), violation of which to spark deeper drop towards 1.0600 zone.
Daily Kijun-sen (1.0860) marks an upper pivot, break of which to neutralize shorts.
Res: 1.0810; 1.0828; 1.0860; 1.0881.
Sup: 1.0741; 1.0723; 1.0712; 1.0660.

Bitcoin Pushes Cryptos Upwards
Market picture
The crypto market reached a capitalisation of $1.82 trillion in the early hours of trading on Monday. By the early European session, it had corrected to $1.8 trillion, but this is still more than 10% above the levels of a week earlier.
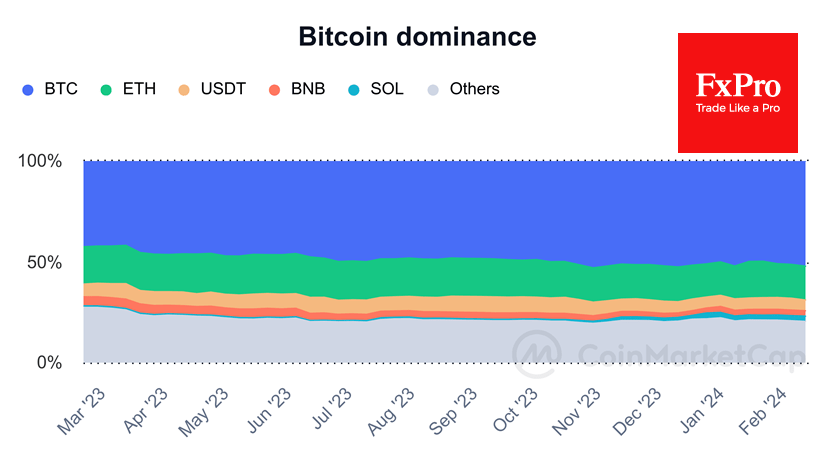
Bitcoin remains the most crucial growth driver, adding 12% in 7 days against about 8% for Ethereum, Solana, and Cardano – important drivers of the current cycle. Bitcoin now accounts for 52.6% of the entire crypto market, adding more than ten percentage points over the year and 1.5p. p. over the month.
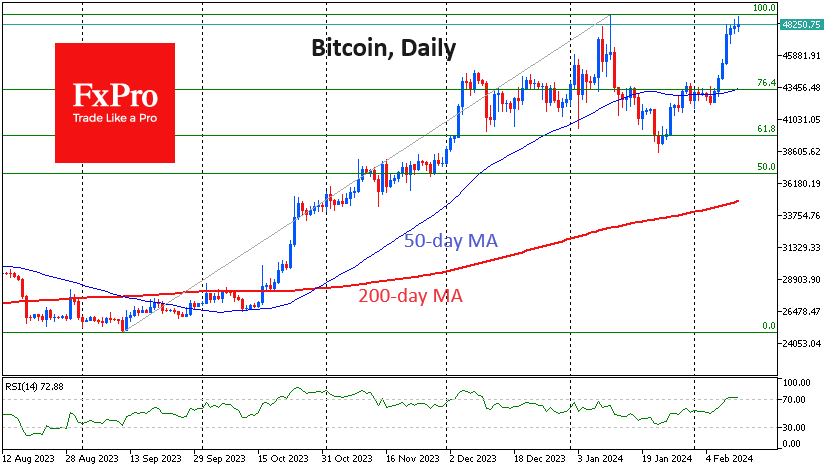
Bitcoin posted its seventh consecutive day of gains, but the strengthening slowed over the weekend. It also coincided with a move above 70 on the RSI on the daily timeframes, which could increase players’ appetite for short-term profit-taking. Caution is also building as we approach the January peak. Bulls have clearly become more cautious, closing the week at the highest since December 2021.
News background
According to The Block, a month after launch, assets in the top nine spot bitcoin-ETFs exceeded 200,000 BTC ($9.5bn). The new bitcoin ETFs climbed to second place in the ranking of commodity exchange-traded funds in the US by assets, becoming a more popular investment vehicle than silver ETFs.
At the same time, the assets of Grayscale’s GBTC fund have declined by 25% since 11 January, and in terms of trading volume, it has lost the lead to BlackRock’s bitcoin ETF.
BlackRock, one of the largest investment companies in the US, plans to add more bitcoins to its investment portfolio. BlackRock now has 82,515 BTC on its balance sheet, worth about $4 billion. Interest in Bitcoin among investors remains high, according to the investment company’s management.
Bankrupt cryptocurrency lender Genesis Global Trading has settled a lawsuit filed against it by the New York State Attorney General. Genesis will submit a plan of liquidation on 14 February.
The New York Attorney General’s office has expanded its lawsuit against Digital Currency Group. The amount of fraud was three times the original estimate, exceeding $3bn.
According to a study by the Coinbase exchange, US residents could save at least $74 million (or $600 per household) in 2022 if they used cryptocurrencies rather than credit cards for payments. That includes businesses that paid $126 billion to process credit card transactions.
Nikkei 225 Index Price Sets 34-year High
The price of the Nikkei 225 index is fixed above the level of 37,000 points. The last time this happened was after the index reached its all-time high in 1989.
The bullish behavior of the Japanese stock market has the following reasons:
→ Strong corporate reporting. In particular, SoftBank shares rose 11% due to increased sales of its subsidiary Arm, which develops chips for the development of artificial intelligence.
→ Dovish view of the Bank of Japan's monetary policy. Thus, Bank of Japan Vice Governor Shinichi Uchida said that the central bank will not aggressively tighten its monetary policy even if it ultimately decides to end negative interest rates.
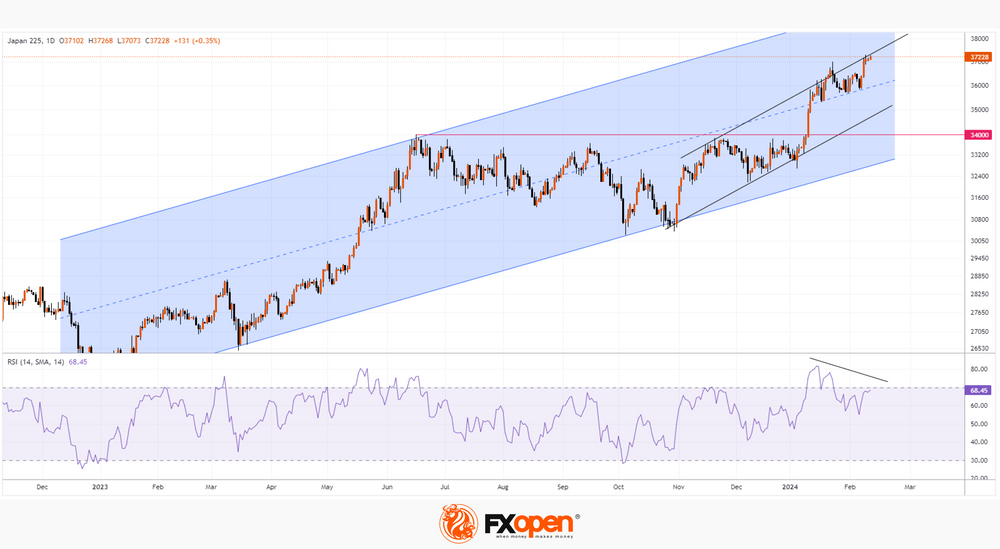
The Nikkei 225 index chart shows that:
→ the price moves within a large-scale ascending channel (shown in blue), which covers the entire year 2023;
→ in 2024, the price rises within the channel shown in black;
→ the 34,000 level was broken with an acceleration in the rally on January 10 - evidence that the bulls held a landslide victory here — so the area above 34,000 could serve as an area of support;
→ the median line of the blue channel and the lower border of the black channel can also serve as support for the price of the Nikkei 225 index in the event of a correction.
And a correction is very likely, given that the RSI indicator indicates a bearish divergence (a sign of depleted demand forces) — perhaps investors are busy taking profits after the price of the Nikkei 225 index has risen by more than 12% since the beginning of 2024.
Trade global index CFDs with zero commission and tight spreads. Open your FXOpen account now or learn more about trading index CFDs with FXOpen.
This article represents the opinion of the Companies operating under the FXOpen brand only. It is not to be construed as an offer, solicitation, or recommendation with respect to products and services provided by the Companies operating under the FXOpen brand, nor is it to be considered financial advice.