Sample Category Title
USD/JPY Daily Outlook
Daily Pivots: (S1) 149.03; (P) 149.25; (R1) 149.58; More...
Intraday bias in USD/JPY stays neutral and more consolidations could still be seen. But further further rally is expected as long as 147.62 support holds. Above 149.57 will resume the rise from 140.25 to retest 151.89/93 key resistance zone. Decisive break there will confirm resumption of larger up trend.
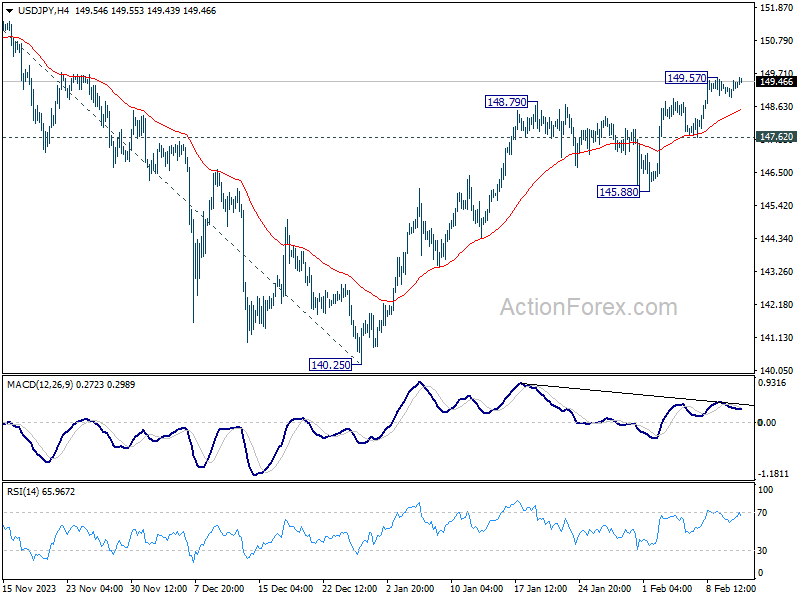
In the bigger picture, fall from 151.89 is seen as a correction to the rally from 127.20, which might have completed at 140.25 already. Firm break of 151.89/93 resistance zone will confirm up trend resumption, and next target will be 61.8% projection of 127.20 to 151.89 from 140.25 at 155.50. This will now remain the favored case as long as 140.25 support holds.
CHFJPY Perfectly Reacting Higher From Blue Box Area
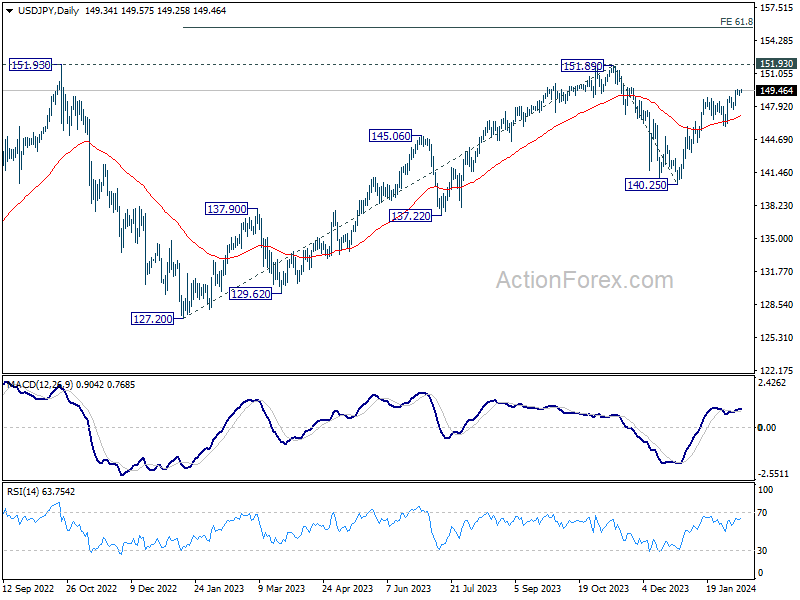
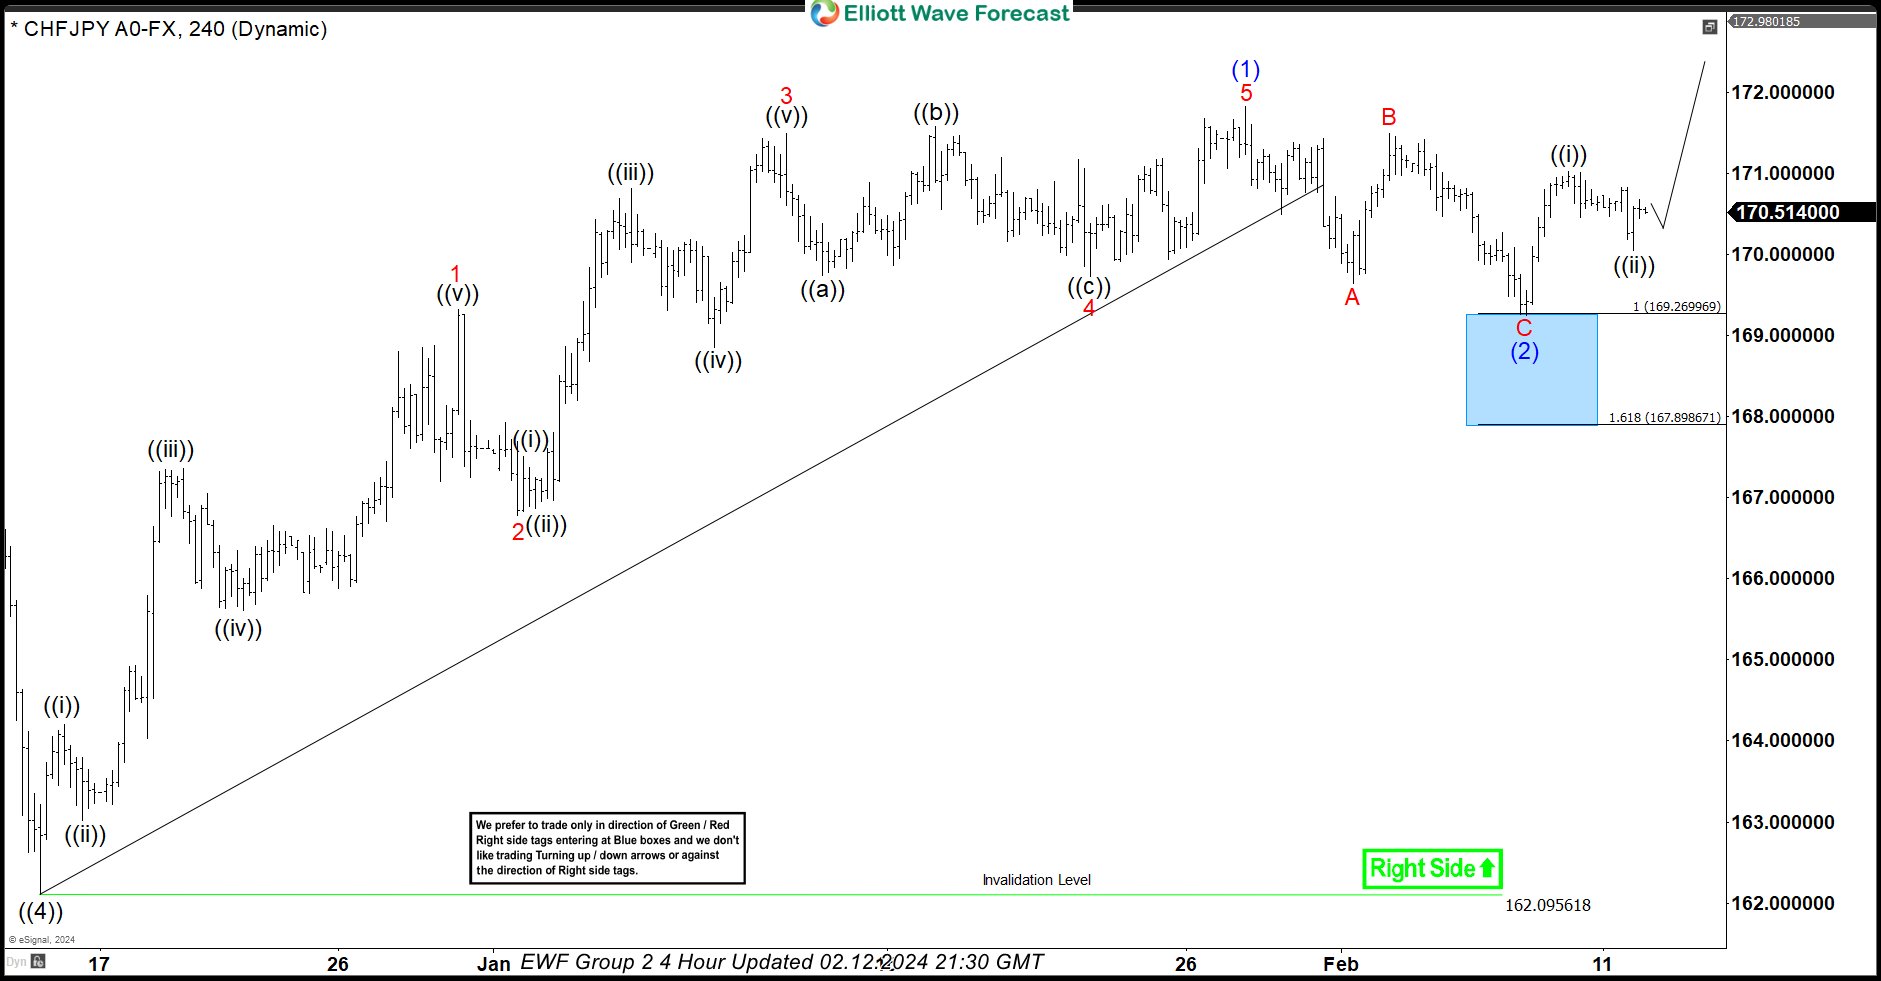
In this technical blog, we will look at the past performance of the 4-hour Elliott Wave Charts of CHFJPY. In which, the rally from 14 December 2023 low unfolded as an impulse sequence and called for an extension higher to take place. Therefore, we knew that the structure in CHFJPY should remain supported & extend higher. So, we advised members not to sell the pair & buy the dips in 3, 7, or 11 swings at the blue box areas. We will explain the structure & forecast below:
CHFJPY 4-Hour Elliott Wave Chart From 2.06.2024
Here’s the 4-hour Elliott wave Chart from the 2/06/2024 update. In which, the rally to 171.82 high-ended wave (1) & made a pullback in wave (2). The internals of that pullback unfolded as Elliott wave zigzag correction where wave A ended in 3 swings at 169.64 low. Then a bounce to 171.48 high-ended wave B & started the next leg lower in wave C towards 169.26- 167.89 blue box area. From there, buyers were expected to appear looking for new highs ideally or for a 3-wave bounce minimum.
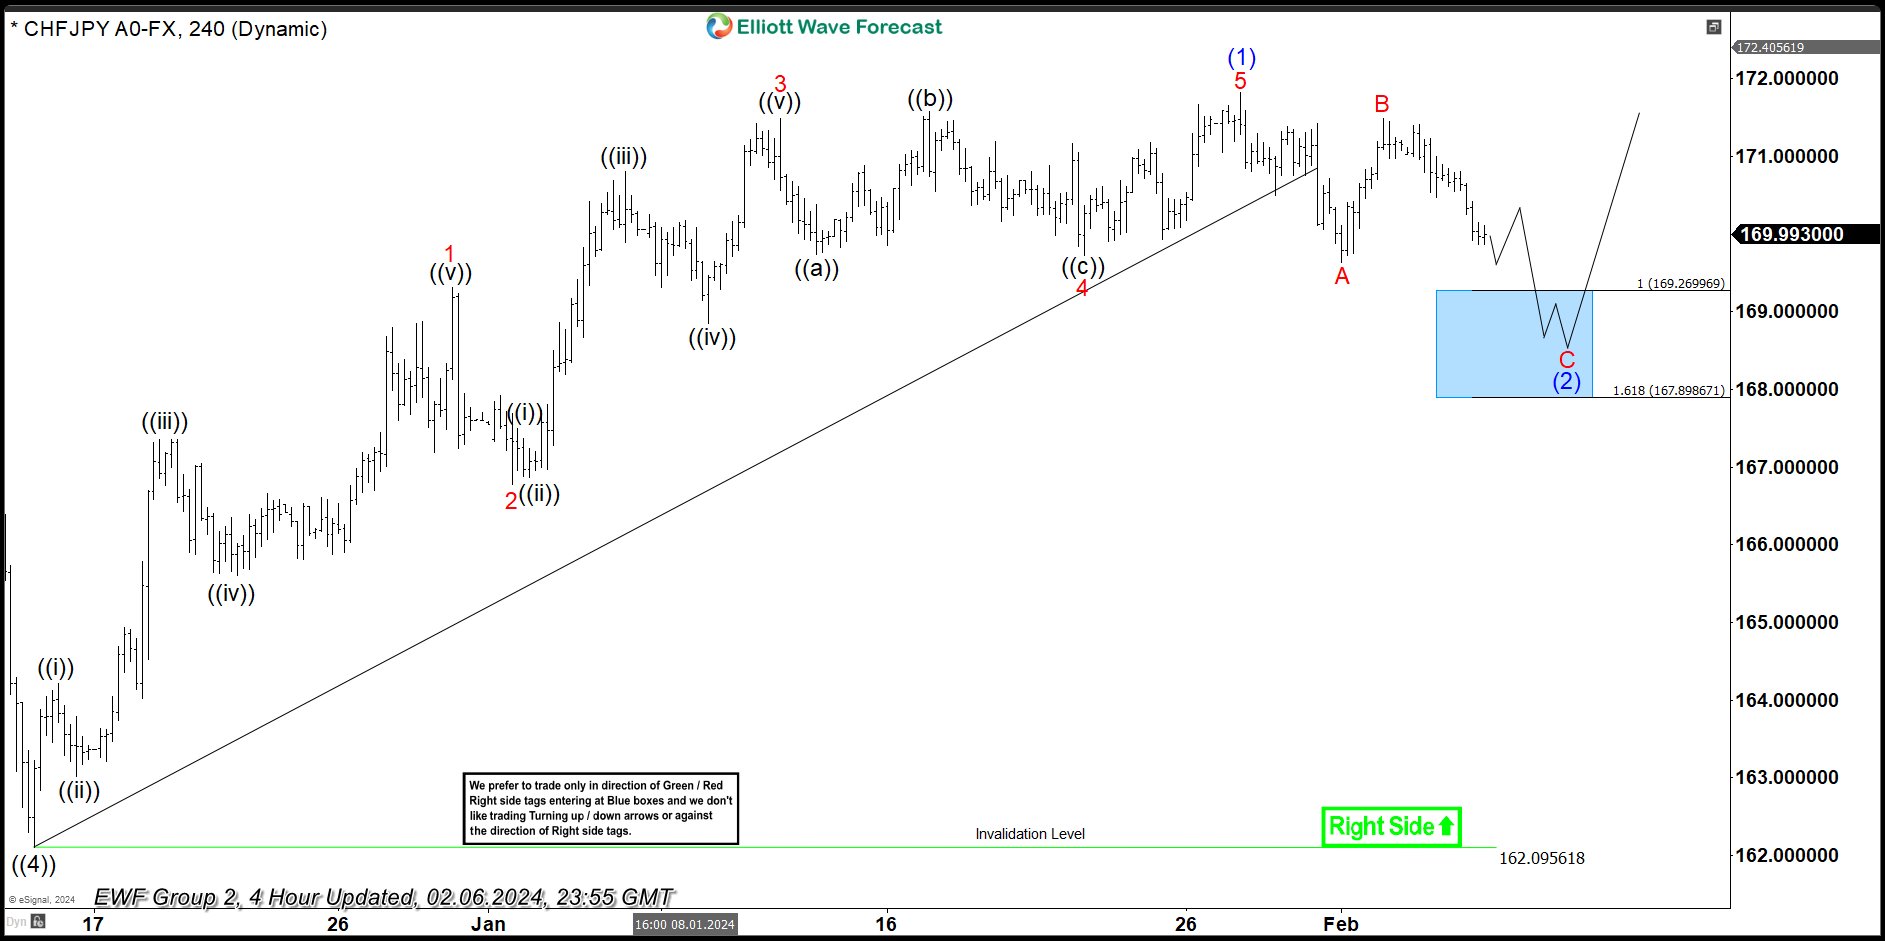
CHFJPY Latest 4-Hour Elliott Wave Chart From 2.12.2024
This is the latest 4-hour Elliott wave Chart from the 2/12/2024 update. In which the pair is showing a reaction higher taking place, right after ending the correction within the blue box area. Allowed members to create a risk-free position shortly after taking the long position at the blue box area. However, a break above 171.82 high is still needed to confirm the next extension higher & avoid further correction lower.
USD/CHF Daily Outlook
Daily Pivots: (S1) 0.8732; (P) 0.8752; (R1) 0.8778; More....
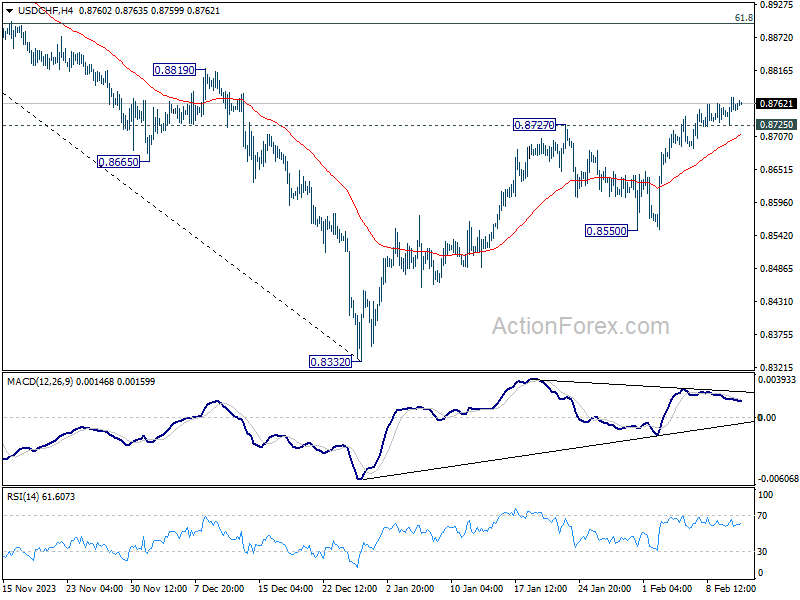
Intraday bias in USD/CHF remains on the upside despite loss of momentum as seen in 4H MACD. Current rise from 0.8332 should target 61.8% retracement of 0.9243 to 0.8332 at 0.8995. On the downside, below 0.8725 minor support will turn intraday bias neutral first. But near term outlook will stay cautiously bullish as long as 0.8550 support holds.
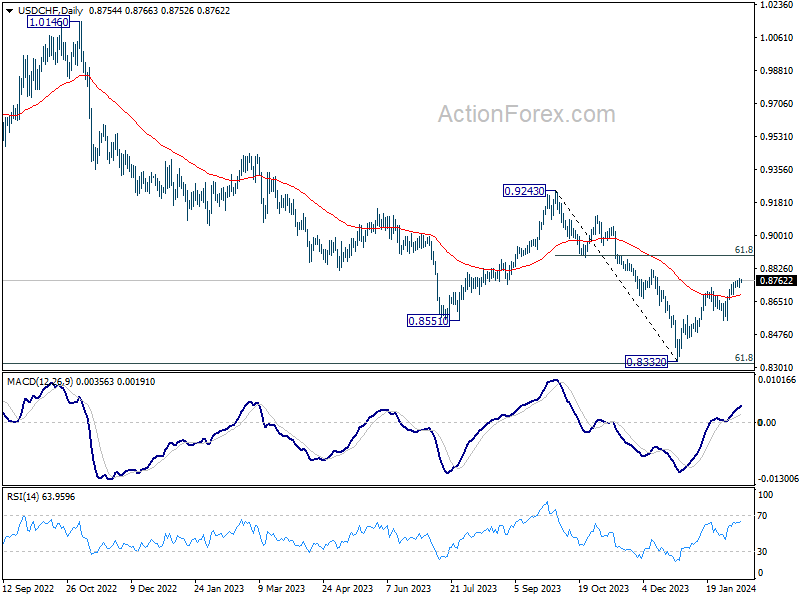
In the bigger picture, sustained trading above 55 D EMA (now at 0.8687) will solidify the case of medium term bottoming at 0.8332, just ahead of 0.8317 long term fibonacci support, on bullish convergence condition in W MACD. Further rise should be seen to 0.9243 resistance, even as a correction to the larger down trend from 1.0146 (2022 high).
A Packed Day With UK Employment, Swiss CPI, German ZEW, and US CPI
New Zealand Dollar falls notably during Asian session, triggered by the latest survey from the RBNZ, which revealed a further easing in inflation expectations. The implications of these findings have prompted traders to pare back the bets on the likelihood of more monetary tightening imminent meeting February. Australian Dollar is also dragged down by the Kiwi and trades as the second weakest for the moment.
Meanwhile, Japanese Yen finds itself on the losing end as well, contributing to the extended rally in Nikkei, which soared to a new 34-year high, breaking past the 37,000 psychological level.
On the contrary, Dollar stands out as the day's strongest performer for now, with the financial markets on edge for the upcoming US CPI data release. Analysts are forecasting deceleration in headline CPI from 3.4% to 2.9% in January, alongside minor decrease in core CPI from 3.9% to 3.8%.
It should be emphasized that the broadening of disinflation from goods to services sectors remains a critical consideration for Fed. The pace and timing of rate rate cuts hinge on this data. Presently, Fed fund futures indicate a 57% likelihood of a rate cut by May, with the probability exceeding 90% by June.
Elsewhere in the currency markets, Euro is currently the second strongest while Swiss Franc and Sterling are mixed. UK employment and wages down will be a key focus in European session. But Swiss CPI and Germany ZEW economic sentiment could also be market moving.
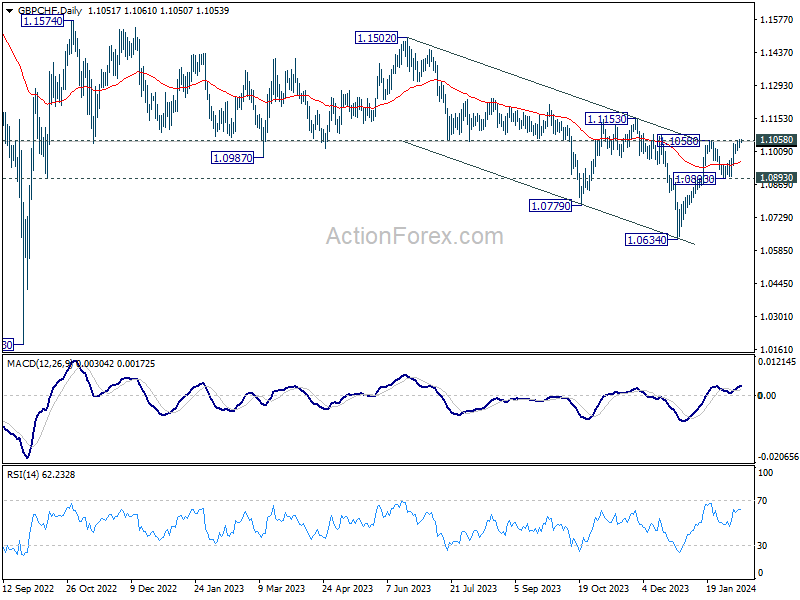
A pair garnering particular interest is GBP/CHF, which is currently pressing 1.1058 resistance level. Decisive break there will resume the whole rebound from 1.0634. More importantly, that would strength the case that whole corrective down trend from 1.1574 ha completed. Further rally would be seen to 1.1153 resistance for confirmation. At the same time, break of 0.8512 support in EUR/GBP will also solidify Sterling's overall momentum, as least against its European peers.
In Europe, at the time of writing, Nikkei is up 2.88%. Japan 10-year JGB yield is up 0.0042 at 0.729. Singapore Strait Times is down -0.14%. Hong Kong and China are still on holiday. Overnight, DOW rose 0.33%. S&P 500 fell -0.09%. NASDAQ fell -0.30%. 10-year yield fell -0.015 to 4.172.
RBA's Kohler points to slightly faster than expected inflation decline
Marion Kohler, RBA's Head of Economic Analysis, noted in a speech that inflation is "still high" but acknowledged a welcome trend: it's decreasing "at a slightly faster rate" than what RBA had forecasted three months prior.
Looking ahead, RBA's expectation is for inflation to settle back into its 2-3% target range by 2025 and reach the midpoint by the following year. However, Kohler underscored the "substantial uncertainty" surrounding these long-term predictions.
A notable aspect of Australia's inflation dynamics, as Kohler pointed out, is the "divergence in the path of core goods and services price inflation."
The primary driver behind the recent dip in inflation rates is the decrease in goods price inflation, whereas services price inflation remains "high and broadly based." This sector's inflation is predicted to "only gradually" diminish as a more equitable demand-supply relationship is established and domestic cost pressures begin to ease.
Kohler also touched on labor costs, particularly significant in the labor-intensive services sector, as a crucial factor influencing the pricing strategies of businesses. RBA believes wage growth is "around its peak" and anticipates a gradual reduction in line with improvements in the labor market. Signs of "easing wage pressures" are already evident in specific industries, notably within business services.
Australia NAB business conditions down to 6, price pressures easing
Australia NAB Business Confidence improved slightly form 0 to 1 in January. Despite this marginal improvement, Business Conditions dropped from 8 to 6, with notable decreases in trading conditions from 11 to 8, profitability conditions from 7 to 5, and employment conditions also falling from 7 to 5.
In terms of cost pressures, labour cost growth remained steady at 2.0% in quarterly equivalent terms, while purchase cost growth saw a slight increase to 1.8% from 1.7%. Product price growth experienced a pickup, moving to 1.2% in quarterly terms from 0.9%, reflecting a broader trend of easing price pressures. Specifically, retail price growth rose to 0.9% from 0.5%, and the growth rate for recreation & personal services prices increased to 1.2% from 0.9%.
NAB Chief Economist Alan Oster commented on the findings, stating, " Capacity utilisation remains high, despite the slowing in growth over the second half of 2023, and price pressures are easing, with hopes they settle well below where they are now."
Australian Westpac consumer sentiment hits 20-Month high, but still pessimistic
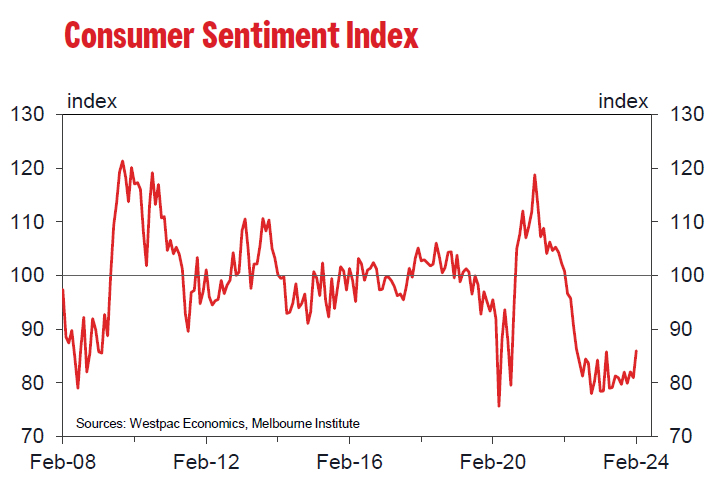
Australia Westpac Consumer Sentiment Index surged by 6.2% mom to 86 in February, marking the highest level since June 2022. This increase also represents the largest monthly gain since April of the previous year, which conincided with a period when RBA temporarily halted its tightening cycle.
According to Westpac, the surge in consumer sentiment was notably propelled by improved sentiment towards major purchases, which climbed 11.3% to 86.8, and more optimistic outlook for the economy over the next year, rising 8.8% to 88.9—the highest since May 2022. Additionally, five-year economic outlook rose 4.4% to 93.
The cooling inflation and more favorable perspective on interest rates are believed to be the primary factors behind this uplift. However, despite the recent gains, consumer mood remains in the pessimistic territory.
A notable "sharp turnaround" in sentiment was observed following RBA's decision in February to maintain the cash rate steady, with sentiment dropping from 94.1 to just 80 post-meeting. While the decision to keep rates unchanged aligned with general expectations, the decline in sentiment suggests consumers were anticipating a "clearer indication" that interest rates might begin to decrease.
Looking forward, Westpac anticipates the RBA will maintain the current interest rate in March, contingent on inflation continuing to align with expectations.
RBNZ survey reveals easing inflation expectations, NZD dips
According to RBNZ's latest Survey of Expectations, one-year inflation expectation fell by 38 basis points from 3.60% to 3.22%, marking its lowest point since September 2021. The survey also indicates a growing consensus, with more than half of respondents expecting that CPI inflation will fall back to RBNZ's target range of 1-3% by the end of 2024
Furthermore, the survey pointed to a decrease in inflation expectations over the longer term, with two-year-ahead predictions dropping from 2.76% to 2.50%, and expectations for five and ten years ahead also seeing decline to 2.25% (from 2.43%) and 2.16% (from 2.28%), respectively.
In terms of interest rates, survey participants anticipate OCR to average at 5.46% by the end of March, with projected decrease to 4.74% by the end of the year. The OCR currently stands at 5.50%.
The publication of the survey's results led to a discernible decline in the NZD, as market participants began to reevaluate the likelihood of another RBNZ rate hikes.
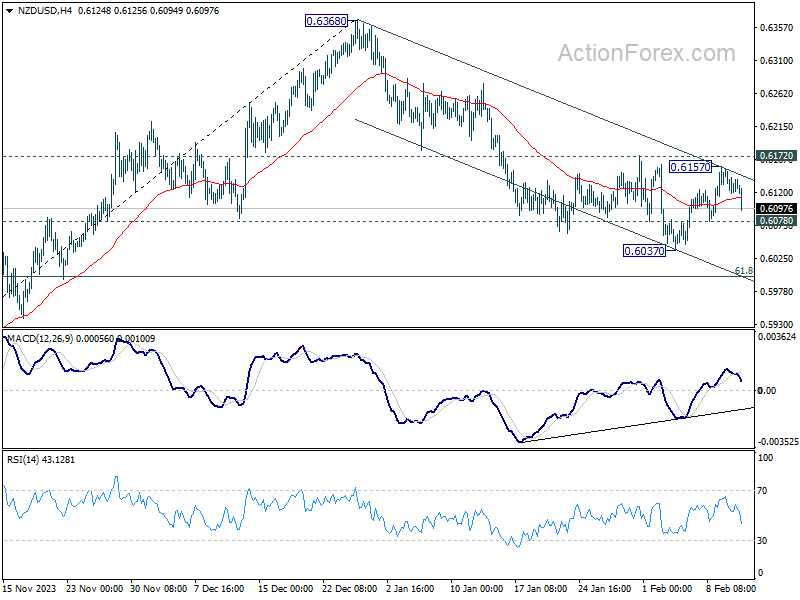
Technically, with 0.6172 resistance intact, recovery from 0.6037 is seen as a correction to the fall from 0.6368 only. Break of 0.6078 minor support will argue that this decline is ready to resume through 0.6037.
ECB's Cipollone: No further economic slack necessary
In a speech overnight, ECB Executive Board member Piero Cipollone suggested that additional tightening of monetary policy may not be necessary to rein in inflation. His remarks hint at a potentially less restrictive approach going forward, should inflationary pressures continue to subside.
Cipollone emphasized that the current economic conditions, "with demand still weak and inflation expectations anchored", arguing against the need for monetary policy to "generate further slack to keep inflation in check". This perspective underlines a significant shift from aggressive tightening to a more measured stance, possibly preparing the ground for a more accommodative monetary policy in the near future.
Unwinding of supply shocks offers room for demand to pick up "without fuelling inflation". Additionally, the downturn in energy prices could allow for "some wage catch-up, especially if profits normalize."
However, Cipollone also stressed the importance of a balanced approach to policy-making, pointing out that the path to the ECB's inflation target would depend on a complex interplay of economic factors. Consequently, he advocated for a "data-driven" approach to future monetary-policy decisions.
Looking ahead
UK employment, Swiss CPI and German ZEW economic sentiment will be released in European session. Later in the day, US CPI will tak center stage.
USD/CHF Daily Outlook
Daily Pivots: (S1) 0.8732; (P) 0.8752; (R1) 0.8778; More....
Intraday bias in USD/CHF remains on the upside despite loss of momentum as seen in 4H MACD. Current rise from 0.8332 should target 61.8% retracement of 0.9243 to 0.8332 at 0.8995. On the downside, below 0.8725 minor support will turn intraday bias neutral first. But near term outlook will stay cautiously bullish as long as 0.8550 support holds.
In the bigger picture, sustained trading above 55 D EMA (now at 0.8687) will solidify the case of medium term bottoming at 0.8332, just ahead of 0.8317 long term fibonacci support, on bullish convergence condition in W MACD. Further rise should be seen to 0.9243 resistance, even as a correction to the larger down trend from 1.0146 (2022 high).
Economic Indicators Update
| GMT | Ccy | Events | Actual | Forecast | Previous | Revised |
|---|---|---|---|---|---|---|
| 23:30 | AUD | Westpac Consumer Confidence Feb | 6.20% | -1.30% | ||
| 23:50 | JPY | PPI Y/Y Jan | 0.20% | 0.10% | 0.00% | 0.20% |
| 00:30 | AUD | NAB Business Confidence Jan | 1 | -1 | ||
| 00:30 | AUD | NAB Business Conditions Jan | 6 | 7 | ||
| 02:00 | NZD | RBNZ Inflation Expectations Q1 | 2.50% | 2.76% | ||
| 06:00 | JPY | Machine Tool Orders Y/Y Jan | -9.90% | |||
| 07:00 | GBP | Claimant Count Change Jan | 15.2K | 11.7K | ||
| 07:00 | GBP | Unemployment rate Dec | 4.00% | 4.20% | ||
| 07:00 | GBP | Average Earnings Including Bonus 3M/Y Dec | 5.70% | 6.50% | ||
| 07:00 | GBP | Average Earnings Excluding Bonus 3M/Y Dec | 6.00% | 6.60% | ||
| 07:30 | CHF | CPI M/M Jan | 0.60% | 0% | ||
| 07:30 | CHF | CPI Y/Y Jan | 1.60% | 1.70% | ||
| 10:00 | EUR | Germany ZEW Economic Sentiment Feb | 17.5 | 15.2 | ||
| 10:00 | EUR | Germany ZEW Current Situation Feb | -79 | -77.3 | ||
| 10:00 | EUR | Eurozone ZEW Economic Sentiment Feb | 20.1 | 22.7 | ||
| 11:00 | USD | NFIB Business Optimism Index Jan | 91.1 | 91.9 | ||
| 13:30 | USD | CPI M/M Jan | 0.20% | 0.30% | ||
| 13:30 | USD | CPI Y/Y Jan | 2.90% | 3.40% | ||
| 13:30 | USD | CPI Core M/M Jan | 0.30% | 0.30% | ||
| 13:30 | USD | CPI Core Y/Y Jan | 3.80% | 3.90% |
GBPJPY Looking to Extend Higher in Impulsive Structure
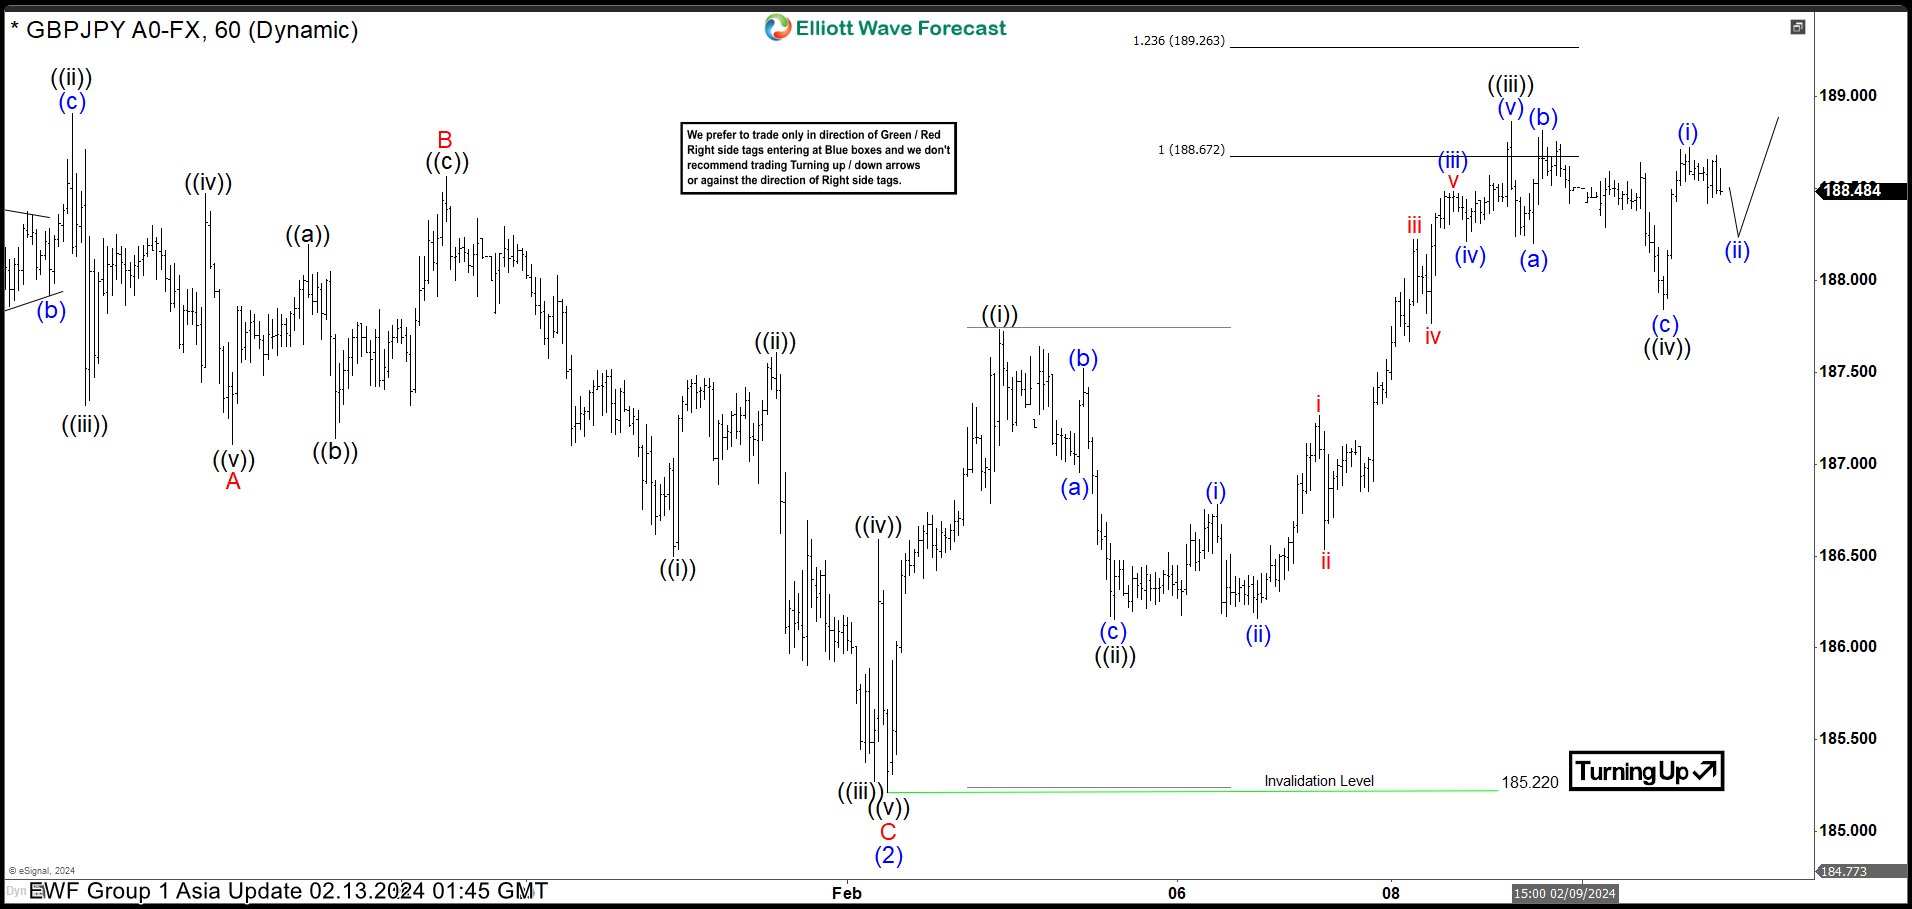
Cycle from 12.14.2023 low is in progress as a 5 waves impulse Elliott Wave structure. Up from 12.14.2023 low, wave (1) ended at 188.93 and pullback in wave (2) ended at 18522. Internal subdivision of wave (2) unfolded as a zigzag structure. Down from wave (1), wave A ended at 187.1, wave B ended at 188.56, and wave C lower ended at 185.22 which completed wave (2). Pair then rallied higher in wave (3). Up from wave (2), wave ((i)) ended at 187.73 and pullback in wave ((ii)) ended at 186.15.
Pair resumes higher from wave ((ii)). Up from there, wave (i) ended at 186.78 and wave (ii) ended at 186.16. Wave (iii) higher ended at 188.48, wave (iv) ended at 188.21 and wave (v) ended at 188.86 which completed wave ((iii)). Pullback in wave ((iv)) ended at 187.84. Pair has resumed higher in wave ((v)). Near term, as far as pivot at 185.22 low stays intact, expect dips to find support in 3, 7, or 11 swing for further upside.
GBPJPY 1 Hour Elliott Wave Chart
GBPJPY Elliott Wave Video
https://www.youtube.com/watch?v=fe469CFThqY
RBNZ survey reveals easing inflation expectations, NZD dips
According to RBNZ's latest Survey of Expectations, one-year inflation expectation fell by 38 basis points from 3.60% to 3.22%, marking its lowest point since September 2021. The survey also indicates a growing consensus, with more than half of respondents expecting that CPI inflation will fall back to RBNZ's target range of 1-3% by the end of 2024
Furthermore, the survey pointed to a decrease in inflation expectations over the longer term, with two-year-ahead predictions dropping from 2.76% to 2.50%, and expectations for five and ten years ahead also seeing decline to 2.25% (from 2.43%) and 2.16% (from 2.28%), respectively.
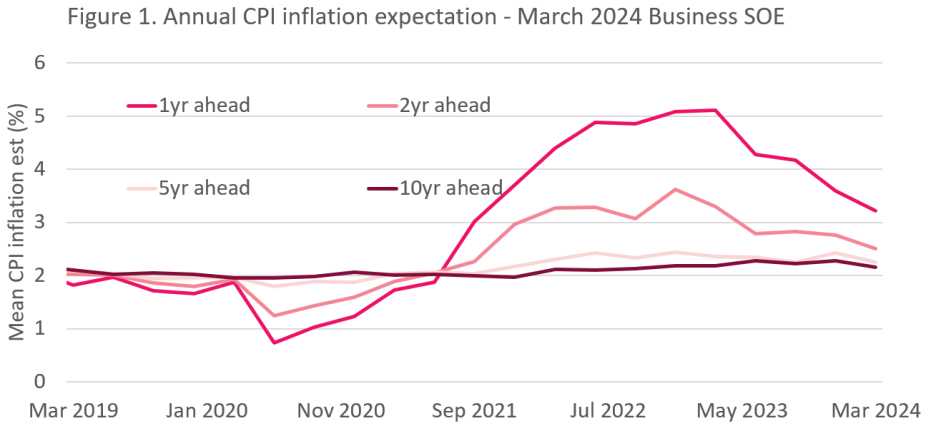
In terms of interest rates, survey participants anticipate OCR to average at 5.46% by the end of March, with projected decrease to 4.74% by the end of the year. The OCR currently stands at 5.50%.
The publication of the survey's results led to a discernible decline in the NZD, as market participants began to reevaluate the likelihood of another RBNZ rate hikes.
Technically, with 0.6172 resistance intact, recovery from 0.6037 is seen as a correction to the fall from 0.6368 only. Break of 0.6078 minor support will argue that this decline is ready to resume through 0.6037.
What Next for the RBNZ?
- We continue to think the OCR will remain at 5.5% at the February Monetary Policy Statement.
- Resilience in domestic inflation pressures and the labour market will be of concern to the RBNZ.
- But very weak economic momentum, lower headline inflation and a flatter housing market of late are important mitigants.
- We see another hawkish Statement that even might bring forward potential tightening and continues to lean heavily against expectations of policy easing this year.
- Data on inflation, the labour and housing markets, together with the details of the Budget, will be important in making the case for further tightening, if required.
- We don't see scope for interest rate cuts in 2024.
Where the RBNZ was in November.
Expectations have fluctuated wildly in New Zealand since the RBNZ November Monetary Policy Statement. Back then the RBNZ surprised almost all with the threat of further tightening in 2024 if inflation pressures didn't recede fast enough. Central to their thesis was concern that:
- domestic inflation pressures were only slowly subsiding;
- the labour market was taking longer to adjust than expected;
- the housing market was showing signs of resurgence driven by strong net migration;
- migration was putting a floor under growth at the time when policy was trying to increase excess capacity;
- growth was in aggregate stronger than consistent with inflation pressures easing quick enough. The Governor indicated the revised forecast had the minimum sized recession consistent with bringing inflation into line;
- a reinvigorated focus on returning inflation to the middle of the target range by H2 2025 whereas earlier the sense had been that anything inside the 1-3% range might be close enough;
- a concern that fiscal policy might not do enough to assist the disinflation process.
The outcome was a threat of higher rates in Q3 2024 should the outlook not evolve according to plan. There was very limited scope for any further delay in the disinflationary process or any resilience in the economy or labour market.
Having said that, the November Statement did not focus on a potential tightening as soon as its February meeting. The RBNZ's forecasts implied the potential for action in the September quarter of 2024. Some market participants and commentators concluded that the less imminent timeframe for interest rate increases meant that the RBNZ's rhetoric was likely an empty threat designed to manage easing expectations. We didn't believe that then and don't believe it now.
But we saw a hurdle for the data to jump over to get to the view we held back in November that a February tightening would occur. We expected ongoing resilience in growth, migration, the labour market and especially the housing market. We anticipated that inflation would remain sticky and only slowly fall. We didn't see inflation getting back inside the 1-3% range until 2025. Hence even after a further 25bp tightening, we thought it would be 2025 before easing could begin and from there it would be a slow cycle down to a higher terminal rate (3.5%) than was seen pre-Covid.
Implicit in our view was that the RBNZ preferred a strategy of "longer" versus "higher" for the interest rate cycle. Hence, we had moved away from the view we held in mid 2023 that a 6% OCR would be required to break the back of inflation in the face of a historically strong migration cycle. We still think that would have been a superior strategy as it would have allowed for earlier easing than what we face now. But that's a choice for the RBNZ to make.
Key developments since November 2023.
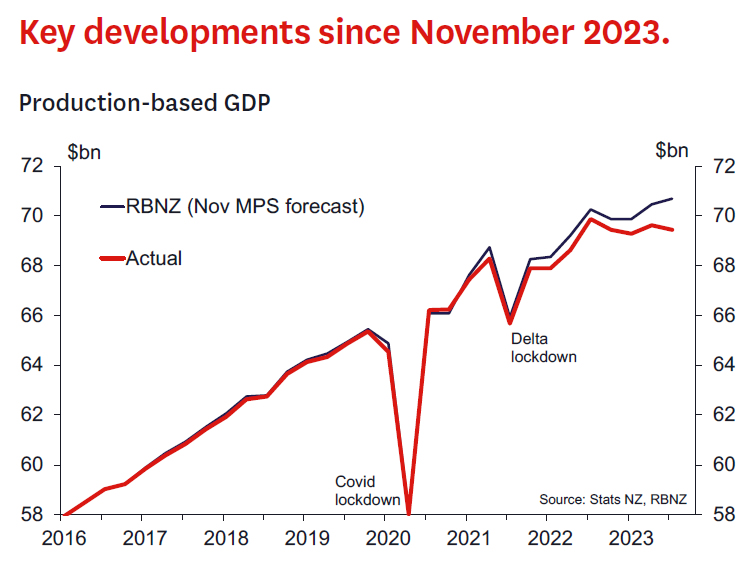
Since November last year we revised down our expectations for the OCR and moved to the view that the peak OCR would be 5.5%. The key factor driving that change was a significant reassessment of the momentum of the economy. GDP was significantly revised down when it was released in December and growth in Q3 itself was weaker than even our below consensus view at the time. We concluded that with an economy contracting at 0.6% yoy and a real probability that 2023 was a year bookended by recessions that there was clear evidence that the 5.5% OCR was providing sufficient pressure on core inflation even despite our concerns that inflation would only slowly fall. Even though some components of demand such as private consumption were as expected in the September quarter, in light of revisions, momentum over the past year was nonetheless much weaker than the RBNZ had expected.
Markets were also especially moved by the weakening in traded goods prices, airfares and food prices shown in the new monthly selected price indices. We were less impressed as these were always going to fall in the near term - whether now or in a quarter or two was of little consequence for the appropriate policy rate today. Certainly, it was helpful for expectations management that these factors drove the headline rate down a bit faster than expected. But the key information in those releases was (and will continue to be) those slow moving components such as rents which continued to be strong beyond what might normally be expected for inflation to stably return to the target range.
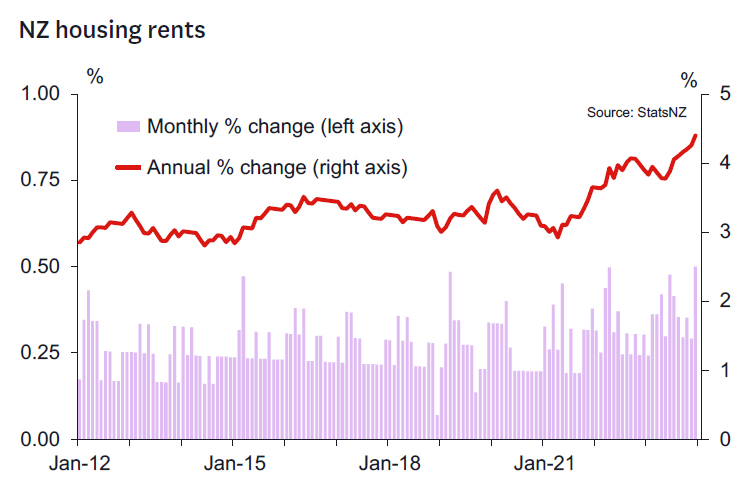
Hence, we were very sceptical when markets swung to expecting rate cuts as early as May 2024. We could see a case for an earlier easing in August if things went very well, but the core view was that the OCR would need to stay at 5.5% in 2024 to lean against sticky inflation, strong migration and the RBNZ's strategy of going "longer" as opposed to "higher".
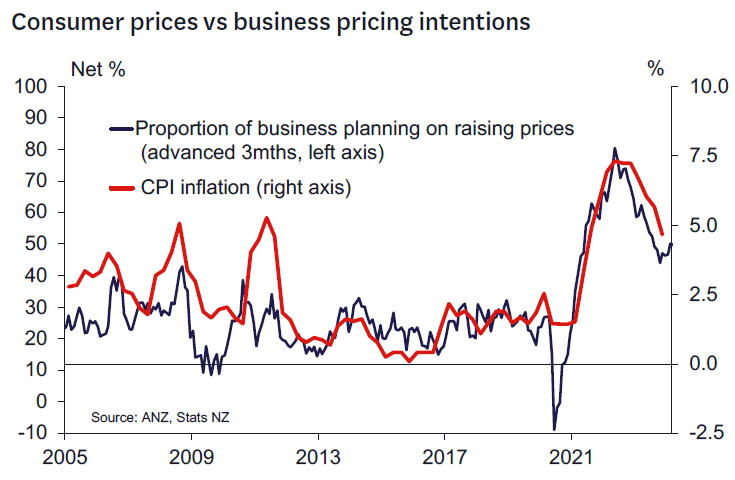
And as it turns out things have not gone very well. When the December quarter CPI was released in late January, those key domestic inflation components were revealed to be markedly stronger than forecast. Last week's Q4 2023 labour market data revealed that the labour market has remained relatively resilient. Both core inflation and the labour market are adjusting, but at a slow rate. Business confidence indicators suggest optimism in the business sector and pricing intentions indicators might suggest a risk of inflation getting stuck at too high levels. Together, these observations are consistent with the idea that an OCR of 5.5% is tight, but perhaps not extremely tight. Hence, it's going to take time to get inflation back in its box.
However, it is not all bad. One thing in favour of an optimistic view that inflation will adjust is that the housing market has not yet kicked on from the green shoots seen up to September 2023. This is important as a key element of the slow disinflation thesis is that strong population growth coming from net migration would see housing recover and aid a recovery in consumption and investment earlier than needed to ensure inflation durably returned to target.
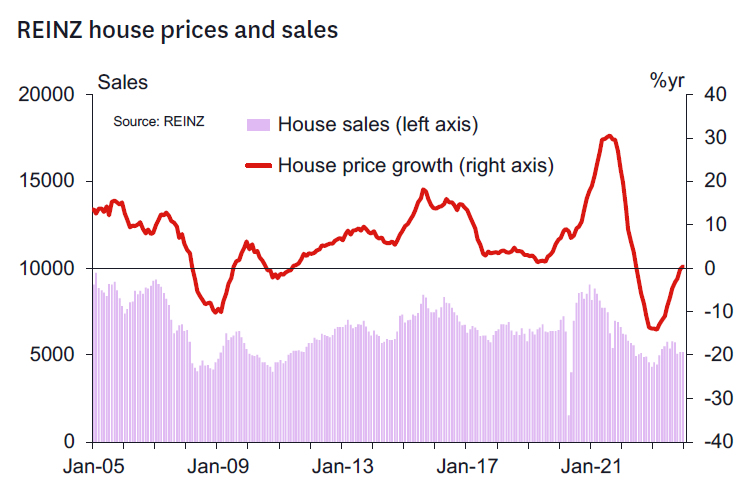
We think the jury is still out with respect to the performance of the housing market and still see strong signs that housing will have a decent year. The new government's investor tax policies, population growth, rents and a likely weakening in construction this year all tell us prices should rise. But it may be that interest rates are high enough to keep them in check - we need to see more data to decide.
What to expect from the RBNZ now?
So where are we now? While some commentators and markets have quickly jumped ship from "team easing" to "team tightening," we still find ourselves somewhere in the middle. We think the "longer" strategy can still work but the time is shortening to continue giving the data the benefit of the doubt.
We are perhaps even slightly more confident that the recent drop in headline inflation will allow for a return to the target range before 2025. But we think progress will be slower beyond that without a significant near term easing in the labour market. If this economy keeps adding jobs at the current interest rate, then a higher rate may well be required.
Monetary policy also needs mates and more supportive fiscal policy. The Government has indicated a policy of fiscal restraint and consolidation. It will be important the Government backs its rhetoric with action as current Treasury projections seem consistent with ongoing fiscal deficits and an avalanche of bonds. Just reducing spending and cutting taxes likely won't cut it.
We also don't think the RBNZ is ready to abruptly change strategy from longer to higher. We think the RBNZ want to encourage monetary conditions to fully reflect their view that the OCR will remain at the current level for longer as opposed to the fanciful ideas of near-term easing being pushed by markets as late as 2 weeks ago.
We think the RBNZ will be on edge. The RBNZ will likely threaten further tightening and may ultimately deliver action this year should inflation pressures not recede fast enough. The RBNZ's new mandate allows little scope for further waiting and hoping. Action in the next 6 months will determine inflation outcomes in the second half of 2025.
But we do think the RBNZ has time to let the data talk. Economic momentum is very weak, and the possibility of a rapid labour market adjustment remains real as firms react to the weakness in demand seen in the last six months of last year. And we don't know what the Government is going to do with fiscal policy.
Hence, we see another hawkish Statement later this month, that could potentially threaten policy tightening sooner than indicated in November. We see that as consistent with continuing with the "longer" strategy while managing the risks that the current OCR might not deliver sufficient disinflation. A sudden switch in strategy to one of higher interest rates seems dangerous this late in the cycle. And in the context of likely developments in interest rates in other advanced economies over the second half of this year, a further hike in domestic interest rates would inevitably put upward pressure on the exchange rate – at least in the near term.
We recognise that such late cycle tightenings have happened before (for example immediately before the Global Financial Crisis and during the Asian Financial Crisis). While this could happen again, we think the RBNZ will be more cautious than that right now given that global central banks look set to head into their easing cycles later this year. And it's important to remember that the RBNZ has been pleasantly surprised with the decline in headline CPI inflation recently.
We don't think the RBNZ will panic just yet. But forget about easings in 2024 - it just isn't happening based on what we see now. And we might be back to tightening should conditions prove necessary. Maybe the RBNZ will give us a clue this week in speeches if there's a change in strategy coming. Let's see.
Technical Outlook and Review
DXY:
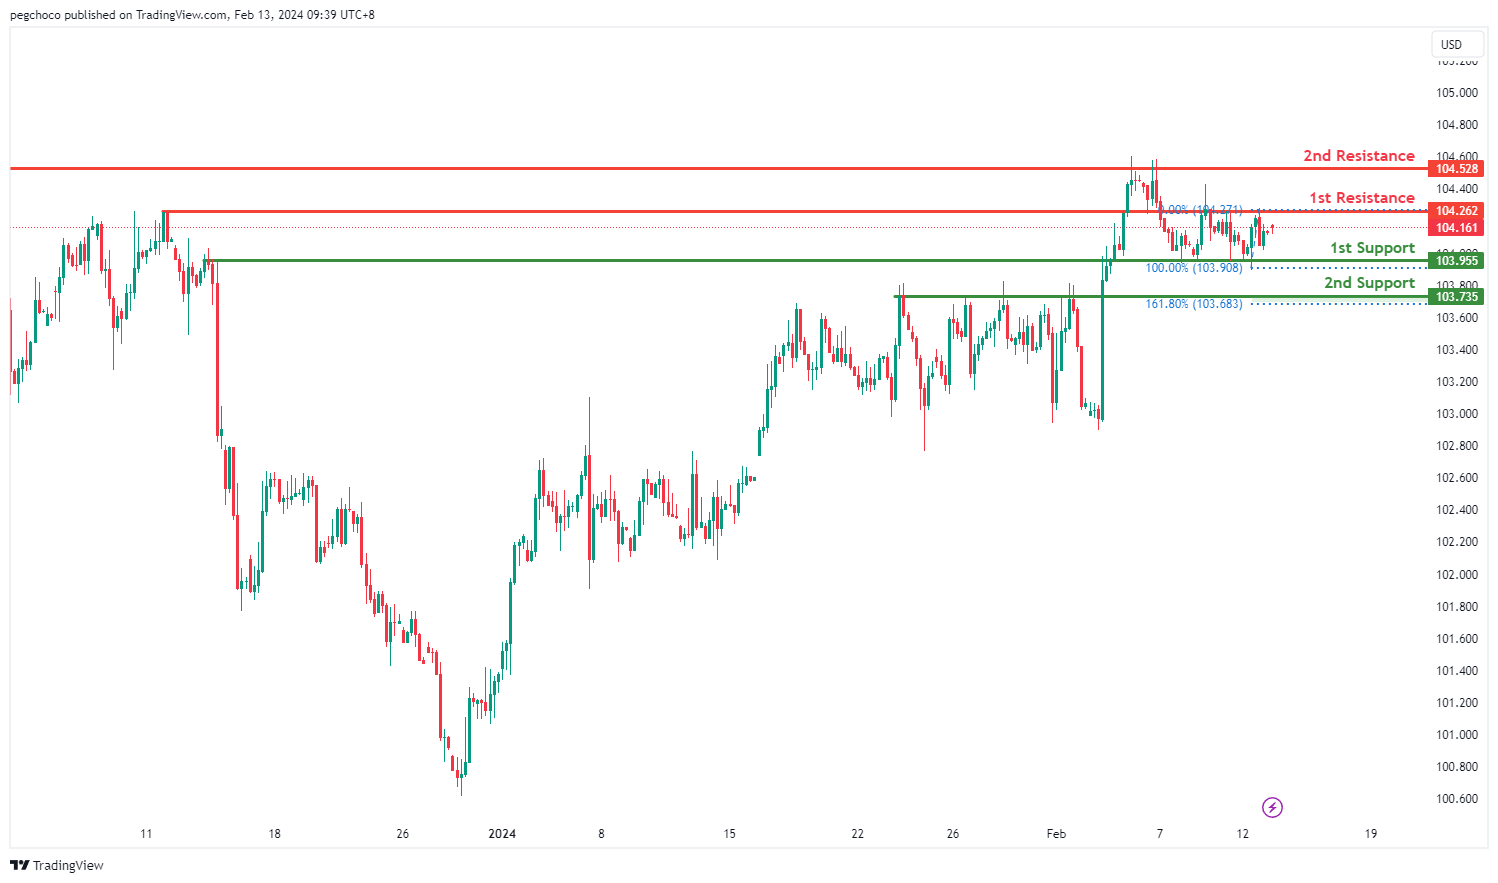
The DXY chart currently reflects a neutral momentum, suggesting a lack of clear direction in the market. There’s a possibility of price fluctuating between the 1st resistance and 1st support levels.
The 1st support level at 103.95 is identified as an overlap support, indicating its historical significance as a level where buying interest has emerged.
Similarly, the 2nd support at 103.73 is characterized as a pullback support, further reinforcing its potential role as a level where buyers may step in.
On the resistance side, the 1st resistance level at 104.26 is categorized as an overlap resistance, suggesting its historical significance as a level where selling pressure has been observed.
Likewise, the 2nd resistance at 104.52 is identified as another overlap resistance, adding to its importance as a potential barrier for further upside movement.
EUR/USD:
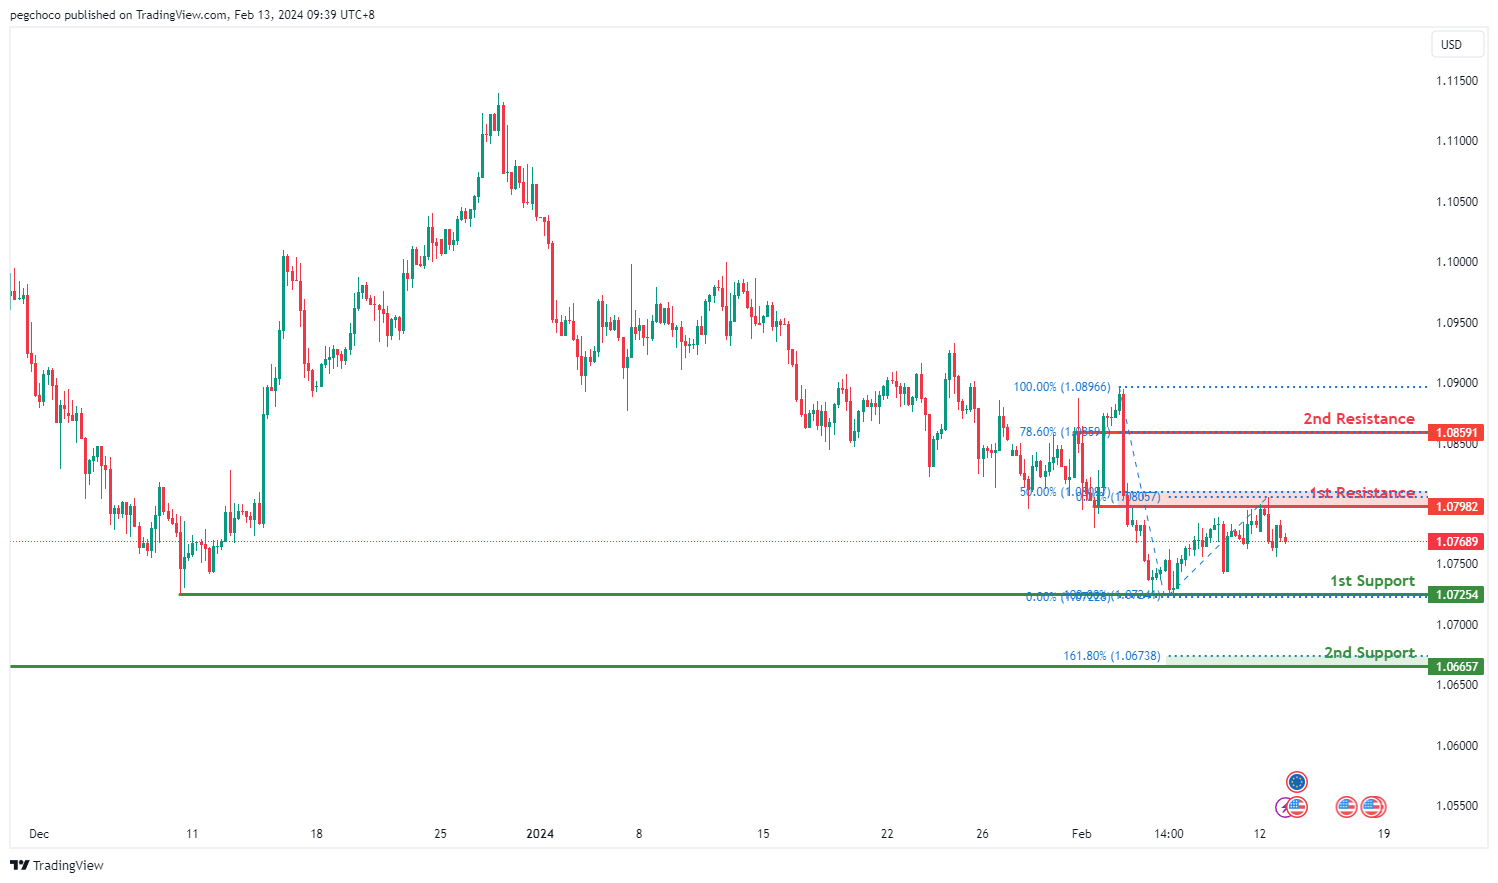
The EUR/USD chart currently exhibits a bearish overall momentum, indicating a downward trend. There’s a possibility that the price could continue this bearish movement towards the 1st support level.
The 1st support level at 1.0725 is considered a multi-swing low support, suggesting its historical significance as a strong level where buying interest has previously emerged.
Additionally, the 2nd support at 1.0665 is identified as an overlap support, further reinforcing its potential role as a significant level of support. The presence of the 161.80% Fibonacci Extension adds to its strength as a potential support zone.
On the resistance side, the 1st resistance level at 1.0798 is categorized as an overlap resistance, indicating its historical significance as a point of potential resistance where selling pressure has been observed.
Similarly, the 2nd resistance at 1.0859 is identified as a pullback resistance, with the presence of the 78.60% Fibonacci Retracement, further emphasizing its importance as a potential barrier for further upside movement.
EUR/JPY:
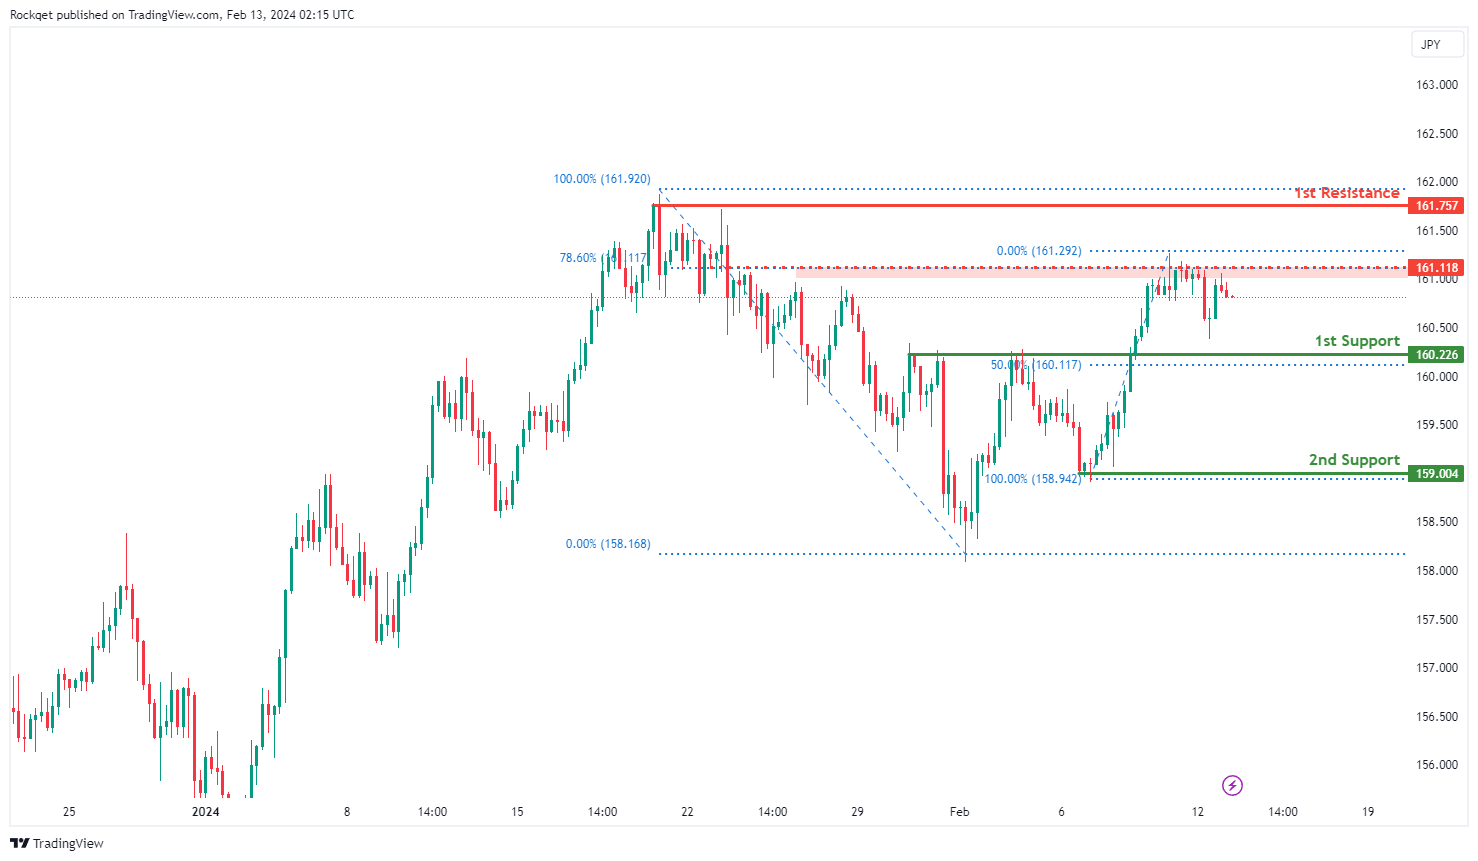
The EUR/JPY chart currently demonstrates a bearish momentum, indicating a prevailing downward trend. Several factors contribute to this bearish sentiment, supporting the potential for a continued downward movement in the price.
The 1st support level at 160.226 is significant as it represents a pullback support, suggesting a historical level where buying interest has previously emerged. Additionally, this level aligns with the 50% Fibonacci Retracement, adding to its significance. Furthermore, the 2nd support at 159.004 is identified as a swing low support, providing additional reinforcement to the potential support zone.
On the resistance side, the 1st resistance at 161.757 is highlighted as a significant level where selling pressure may intensify, as it coincides with a swing high resistance. Moreover, the intermediate resistance at 161.118 is recognized, aligning with an overlap resistance and the 78.60% Fibonacci Projection, further reinforcing its potential as a barrier to further upward movement.
EUR/GBP:
The EUR/GBP chart currently exhibits a neutral momentum, indicating a lack of clear direction in the market. Given this neutrality, the price could potentially fluctuate between the 1st resistance and 1st support levels, with no strong bias towards either direction.
The 1st support level at 0.85170 is considered significant as it represents a multi-swing low support, suggesting a historical level where buying interest has previously emerged. Additionally, the 2nd support at 0.84957 is identified as an overlap support, further strengthening the potential support zone.
On the resistance side, the 1st resistance at 0.85492 is highlighted as a significant level where selling pressure may intensify, as it coincides with a pullback resistance and the 61.80% Fibonacci Retracement. Moreover, the 2nd resistance at 0.85710 is recognized as an overlap resistance, adding to its significance as a barrier to further upward movement.

GBP/USD:
The GBP/USD chart currently demonstrates a bearish overall momentum, suggesting a downward trend. There’s a potential for further bearish movement towards the 1st support level.
The 1st support at 1.2581 is identified as an overlap support, indicating its historical significance as a level where buying interest has previously emerged. Additionally, the 2nd support at 1.2518 is characterized as a swing low support, further reinforcing its potential as a significant level of support.
On the resistance side, the 1st resistance level at 1.2564 is categorized as an overlap resistance, suggesting its historical significance as a point of potential resistance. Furthermore, the 2nd resistance at 1.2720 is identified as a pullback resistance, with the presence of the 78.60% Fibonacci Retracement, highlighting its importance as a potential barrier for further upside movement.
An intermediate support level at 1.2609 is also noted, considered a multi-swing low support, indicating another potential area where buying interest may emerge amidst the bearish momentum.

GBP/JPY:
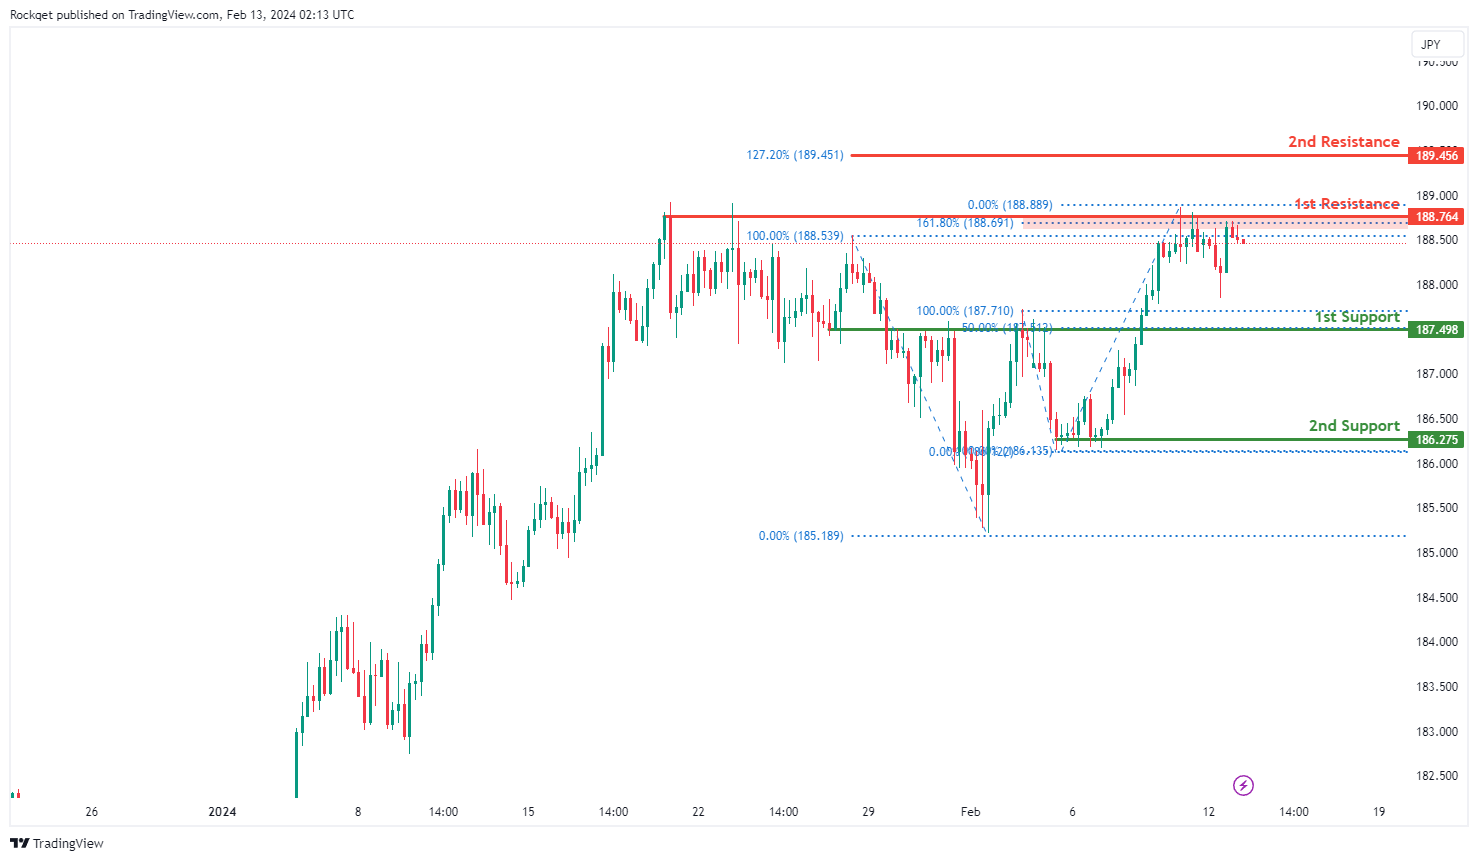
The GBP/JPY chart currently exhibits a bearish momentum, indicating a prevailing downward trend in the market. Given this bearish sentiment, the price could potentially continue its downward movement towards the 1st support level.
The 1st support at 187.498 is considered significant as it represents a pullback support, coinciding with the 50% Fibonacci Retracement level. This suggests a historical level where buying interest has previously emerged. Additionally, the 2nd support at 186.275 is identified as a multi-swing low support, further reinforcing the potential for a bounce at this level.
On the resistance side, the 1st resistance at 188.764 is highlighted as a significant barrier where selling pressure may intensify. This level aligns with a multi-swing high resistance and the 161.80% Fibonacci Extension, adding to its significance. Moreover, the 2nd resistance at 189.456 is recognized, coinciding with the 127.20% Fibonacci Extension, further strengthening its role as a resistance level.
USD/CHF:
The USD/CHF chart currently displays a bullish overall momentum, indicating an upward trend. There’s a potential for further bullish movement towards the 1st resistance level.
The 1st support at 0.8728 is identified as an overlap support, suggesting its historical significance as a level where buying interest has previously emerged.
Additionally, the 2nd support at 0.8675 is characterized as a pullback support, further reinforcing its potential as a significant level of support.
On the resistance side, the 1st resistance level at 0.8807 is categorized as a multi-swing high resistance, indicating its historical significance as a point of potential resistance.
Furthermore, the 2nd resistance at 0.8855 is identified as an overlap resistance, which adds to its importance as a potential barrier for further upside movement.

USD/JPY:
The USD/JPY chart currently exhibits a neutral overall momentum, indicating a lack of clear directional bias. There’s a possibility for price to oscillate between the 1st resistance and 1st support levels.
The 1st support at 148.77 is identified as an overlap support, suggesting its historical significance as a level where buying interest has previously emerged.
Additionally, the 2nd support at 147.81 is also characterized as an overlap support, reinforcing its importance as a potential level of support.
On the resistance side, the 1st resistance level at 149.63 is categorized as a multi-swing high resistance, indicating its historical significance as a point of potential resistance.
Furthermore, the 2nd resistance at 150.41 is identified as a pullback resistance, which adds to its significance as a potential barrier for further upside movement.

USD/CAD:
The USD/CAD chart currently exhibits a neutral bias. In this context, there is a potential scenario for price to fluctuate between the 1st support and the 1st resistance.
The 1st support level at 1.3434 is identified as a pullback support that aligns with the 61.80% Fibonacci Retracement level. Further below, the 2nd support level at 1.3365 is marked as a swing-low support that aligns with the 100.00% Fibonacci projection level, further emphasizing its importance as a potential support zone.
To the upside, the 1st resistance level at 1.3541 is identified as a pullback resistance. Higher up, the 2nd resistance level at 1.3620 is also noted as a pullback resistance that aligns close to the 61.80% Fibonacci Retracement level, further highlighting its importance as a potential resistance point.

AUD/USD:
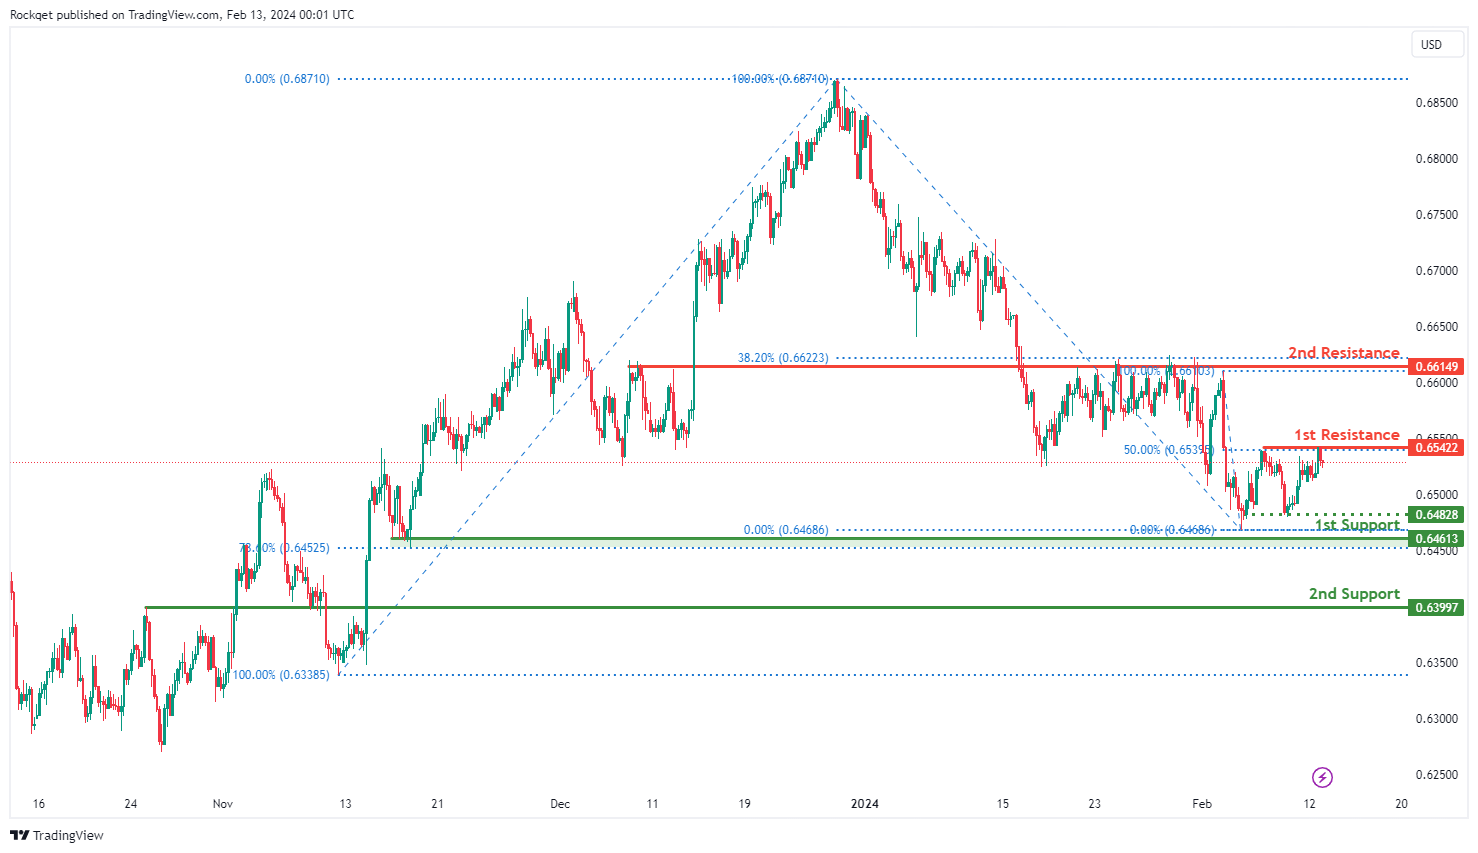
The AUD/USD chart currently exhibits a neutral bias. In this context, there is a potential scenario for price to fluctuate between the 1st support and the 1st resistance.
The intermediate support level at 0.6482 is identified as a pullback support while the 1st support level at 0.6461 is also marked as pullback support that aligns close to the 78.60% Fibonacci Retracement level. Further below, the 2nd support level at 0.6399 is noted as an overlap support, further emphasizing its importance as a potential support zone.
To the upside, the 1st resistance level at 0.6542 is identified as a pullback resistance that aligns with the 50.00% Fibonacci Retracement level. Higher up, the 2nd resistance level at 0.6614 is also marked as a pullback resistance that aligns close to the 38.20% Fibonacci Retracement level, further highlighting its importance as a potential resistance point.
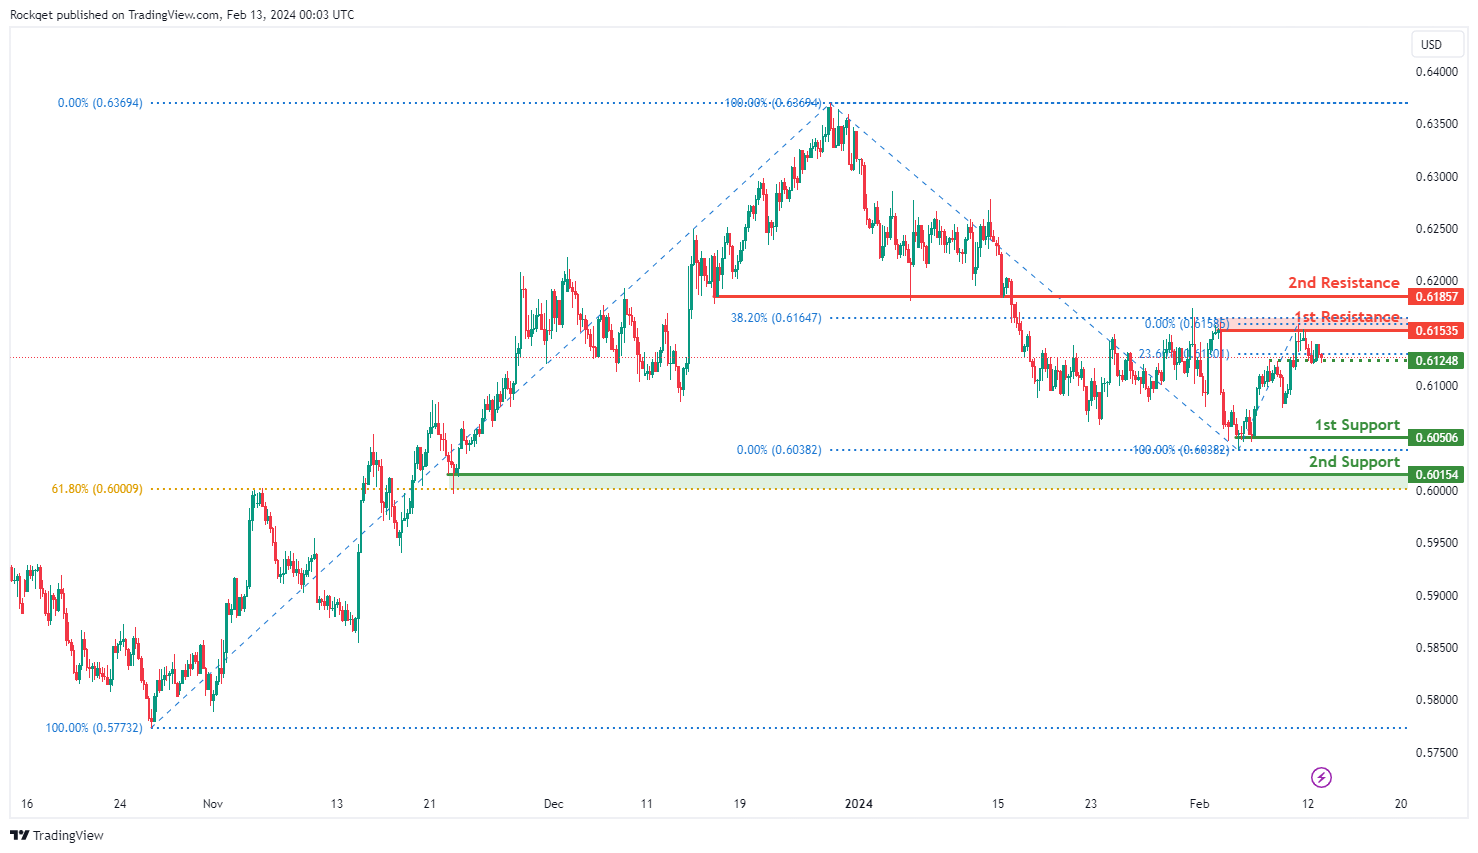
NZD/USD
The NZD/USD chart currently exhibits an overall bearish momentum. In this context, there is a potential scenario for price to drop towards the 1st support should it break under the intermediate support.
The intermediate support level at 0.6124 is identified as an overlap support that aligns with the 23.60% Fibonacci Retracement level while the 1st support level at 0.6050 is marked as a pullback support. Further below, the 2nd support level at 0.6015 is also noted as a pullback support that aligns close to the 61.80% Fibonacci Retracement level, further emphasizing its importance as a potential support zone.
To the upside, the 1st resistance level at 0.6153 is marked as a pullback resistance that aligns close to the 38.20% Fibonacci Retracement level. Higher up, the 2nd resistance level at 0.6185 is also marked as a pullback resistance, further highlighting its importance as a potential resistance point.
DJ30:
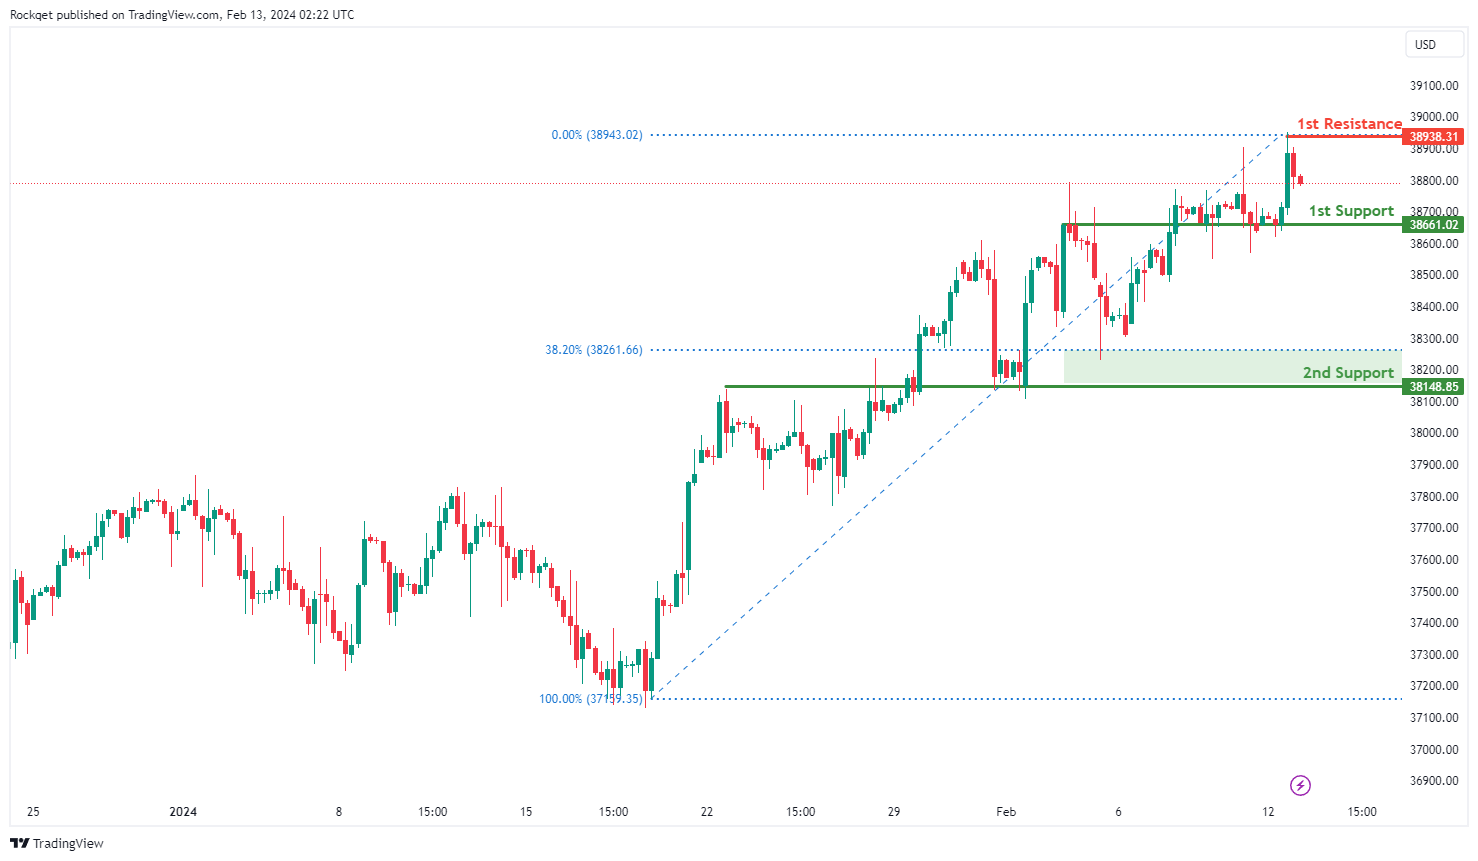
The DJ30 chart currently reflects a bearish momentum, indicating a prevailing downward trend in the market. Given this bearish sentiment, the price could potentially continue its downward movement towards the 1st support level.
The 1st support at 38661.02 is deemed significant as it represents an overlap support, suggesting a historical level where buying interest has previously emerged. Additionally, the 2nd support at 38148.85 aligns with both an overlap support and the 38.20% Fibonacci Retracement level, further reinforcing its potential as a support zone.
On the resistance side, the 1st resistance at 38938.31 is highlighted as a significant barrier where selling pressure may intensify. This level corresponds to a swing high resistance, indicating a historical point where selling interest has emerged.
GER40:
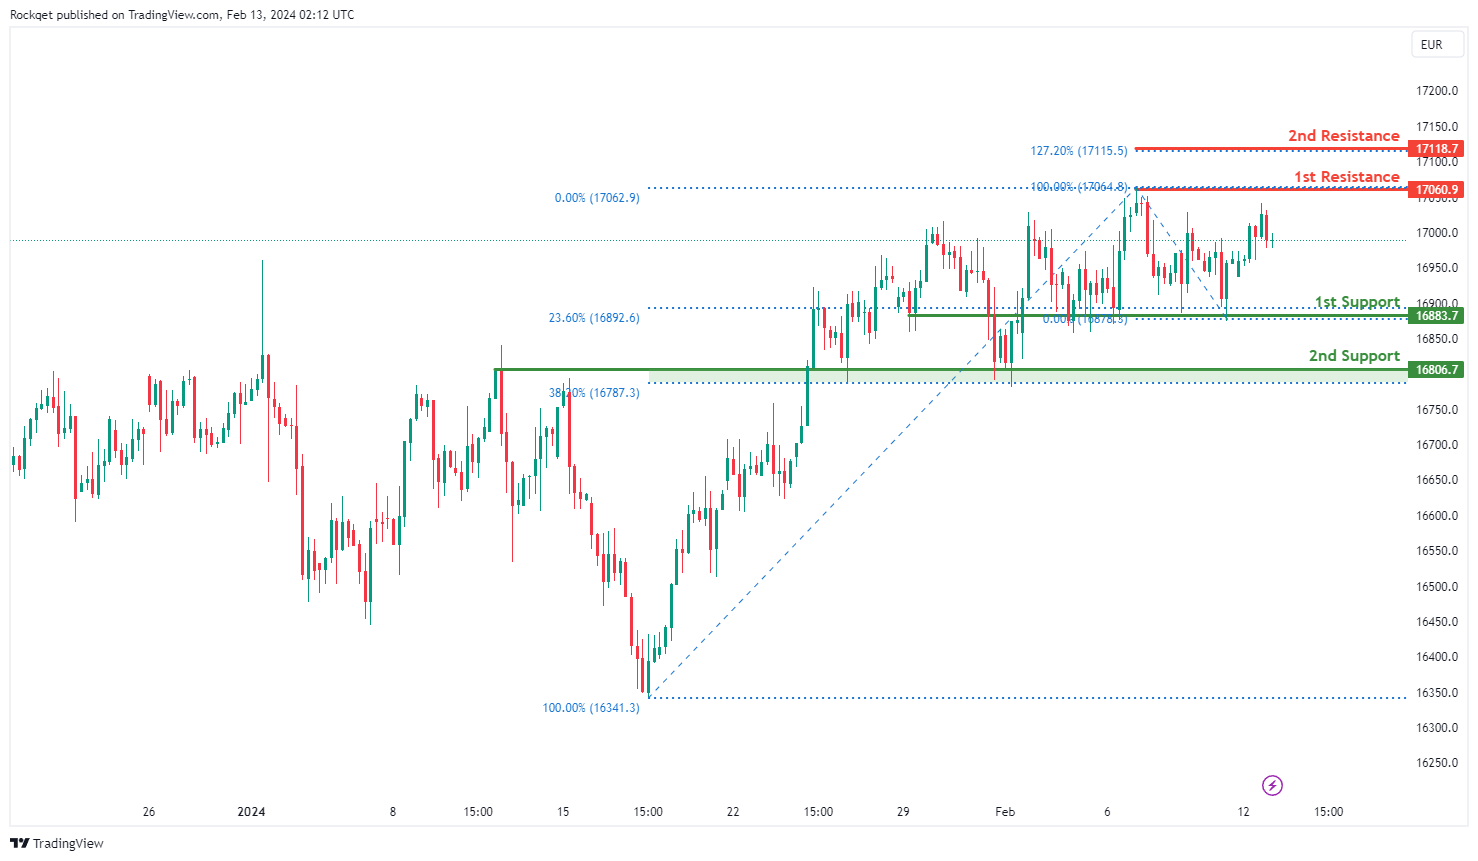
The GER40 chart currently demonstrates a bullish momentum, indicating an overall upward trend in the market. Several factors contribute to this bullish sentiment, supporting the potential for a continued upward movement in the price.
The 1st support at 16883.7 is significant as it aligns with an overlap support and the 23.60% Fibonacci Retracement level, indicating a historical level where buying interest has previously emerged. Additionally, the 2nd support at 16806.7 coincides with both an overlap support and the 38.20% Fibonacci Retracement level, further reinforcing its potential as a support zone.
On the resistance side, the 1st resistance at 17060.9 represents a significant barrier where selling pressure may intensify. This level corresponds to a swing high resistance, indicating a historical point where selling interest has emerged.
Furthermore, an intermediate resistance at 17118.7 is identified, aligning with the 127.20% Fibonacci Extension level, adding further significance to this resistance level.
US500:
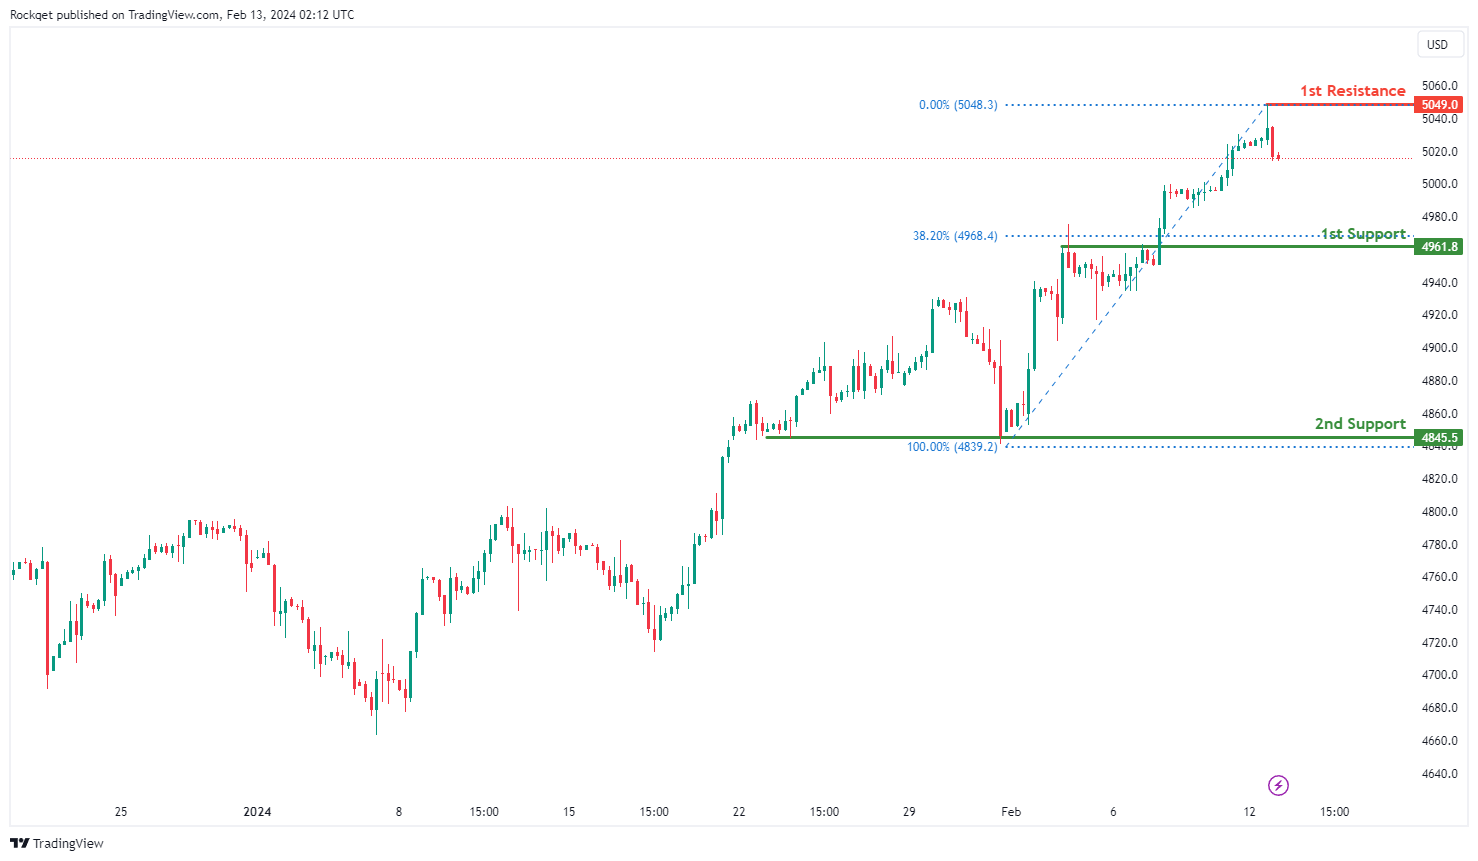
The US500 chart currently exhibits a bearish momentum, indicating a prevailing downward trend. Several factors contribute to this bearish sentiment, suggesting the potential for a continued downward movement in the price.
The 1st support at 4961.8 is considered significant as it aligns with a pullback support level and the 38.20% Fibonacci Retracement, indicating a historical level where buying interest has previously emerged. Additionally, the 2nd support at 4845.5 is identified as a multi-swing low support, further reinforcing the potential support zone.
On the resistance side, an intermediate resistance level at 5049.0 is noted, corresponding to a swing high resistance. This level may act as a barrier where selling pressure could intensify.
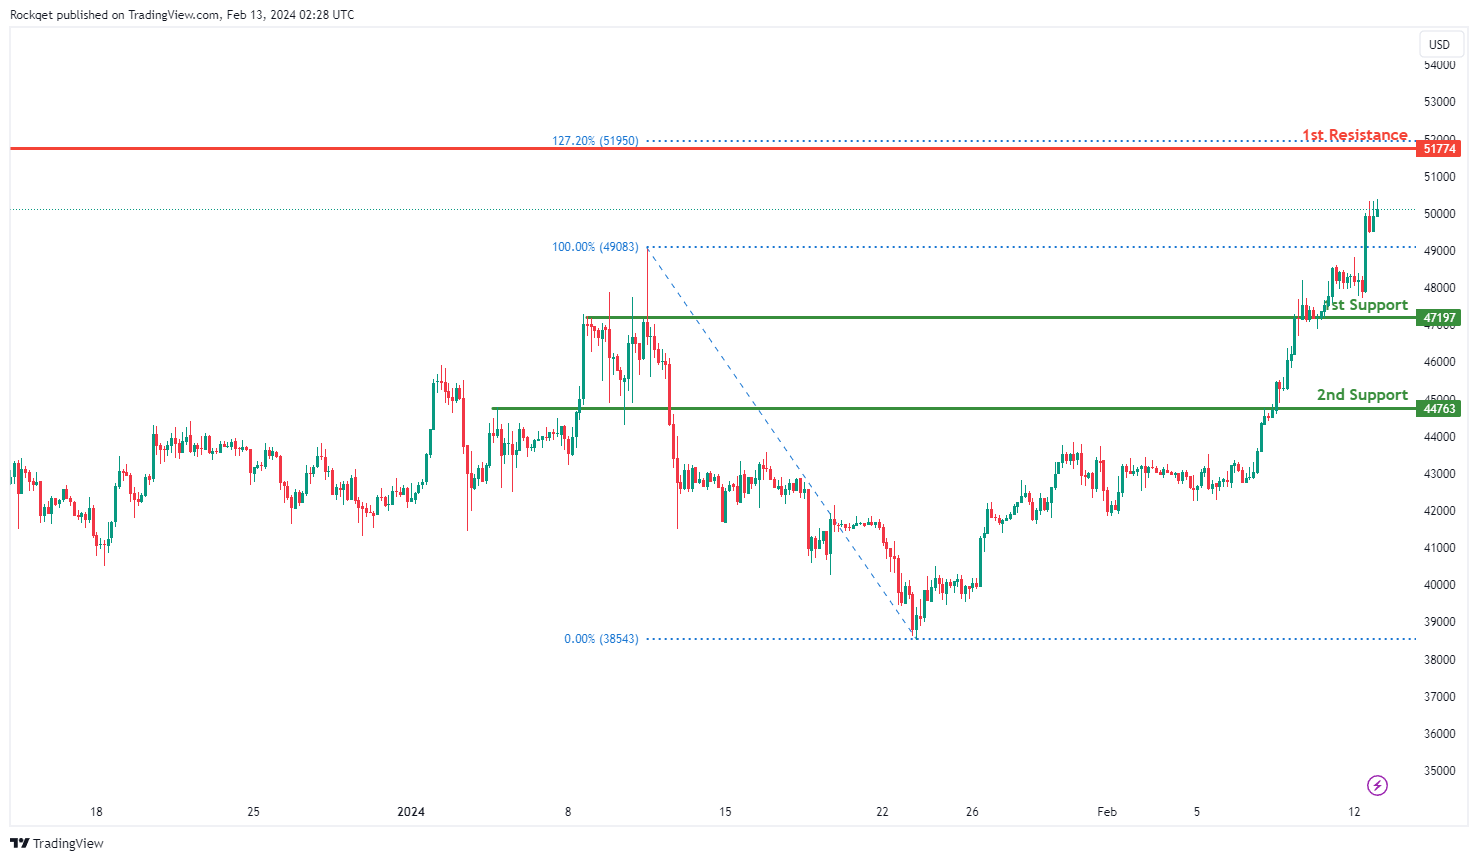
BTC/USD:
The BTC/USD chart currently demonstrates a bullish momentum, indicating an overarching upward trend. Several factors contribute to this bullish sentiment, suggesting the potential for a continued upward movement in the price.
The 1st support level at 47197 is considered significant as it aligns with an overlap support, indicating a historical level where buying interest has previously emerged. Additionally, the 2nd support at 44763 is identified as another overlap support, further reinforcing the potential support zone.
On the resistance side, the 1st resistance level at 51954 is highlighted as a significant barrier where selling pressure may increase, as it coincides with a swing high resistance level and the 127.20% Fibonacci Extension.
ETH/USD:
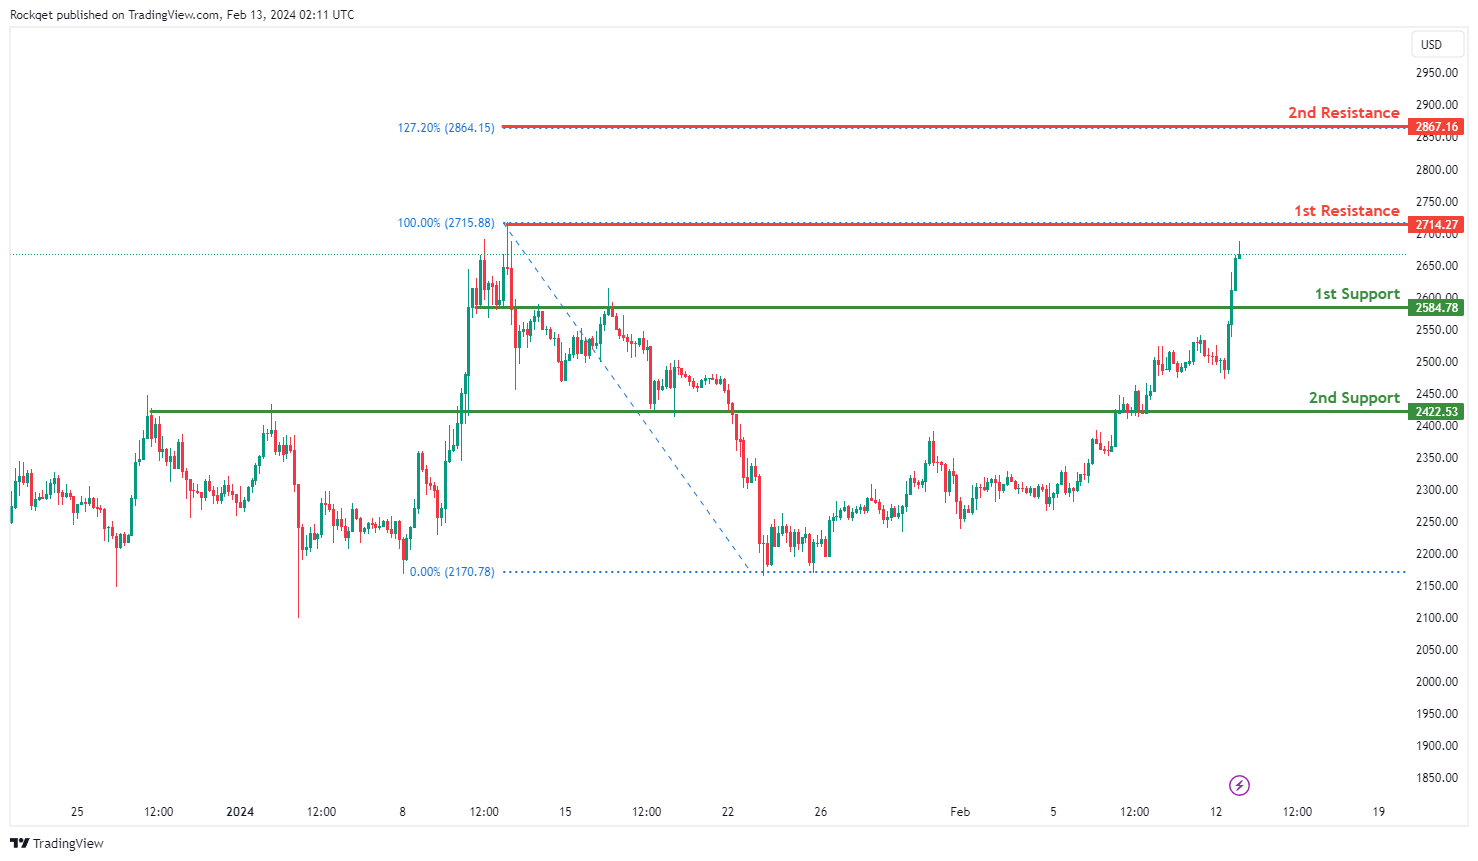
The ETH/USD chart currently maintains a bullish momentum, indicating a prevailing upward trend. Several factors contribute to this bullish sentiment, suggesting the potential for further upward movement in the price.
The 1st support level at 2584.78 is considered significant as it aligns with an overlap support, indicating a historical level where buying interest has previously emerged. Furthermore, the 2nd support at 2422.53 also serves as an overlap support, reinforcing the potential support zone.
On the resistance side, the 1st resistance level at 2714.27 stands out as a notable barrier where selling pressure may intensify, as it coincides with a swing high resistance level. Additionally, the 2nd resistance at 2867.16 aligns with the 127.20% Fibonacci Extension, adding further significance to this resistance level.
WTI/USD:
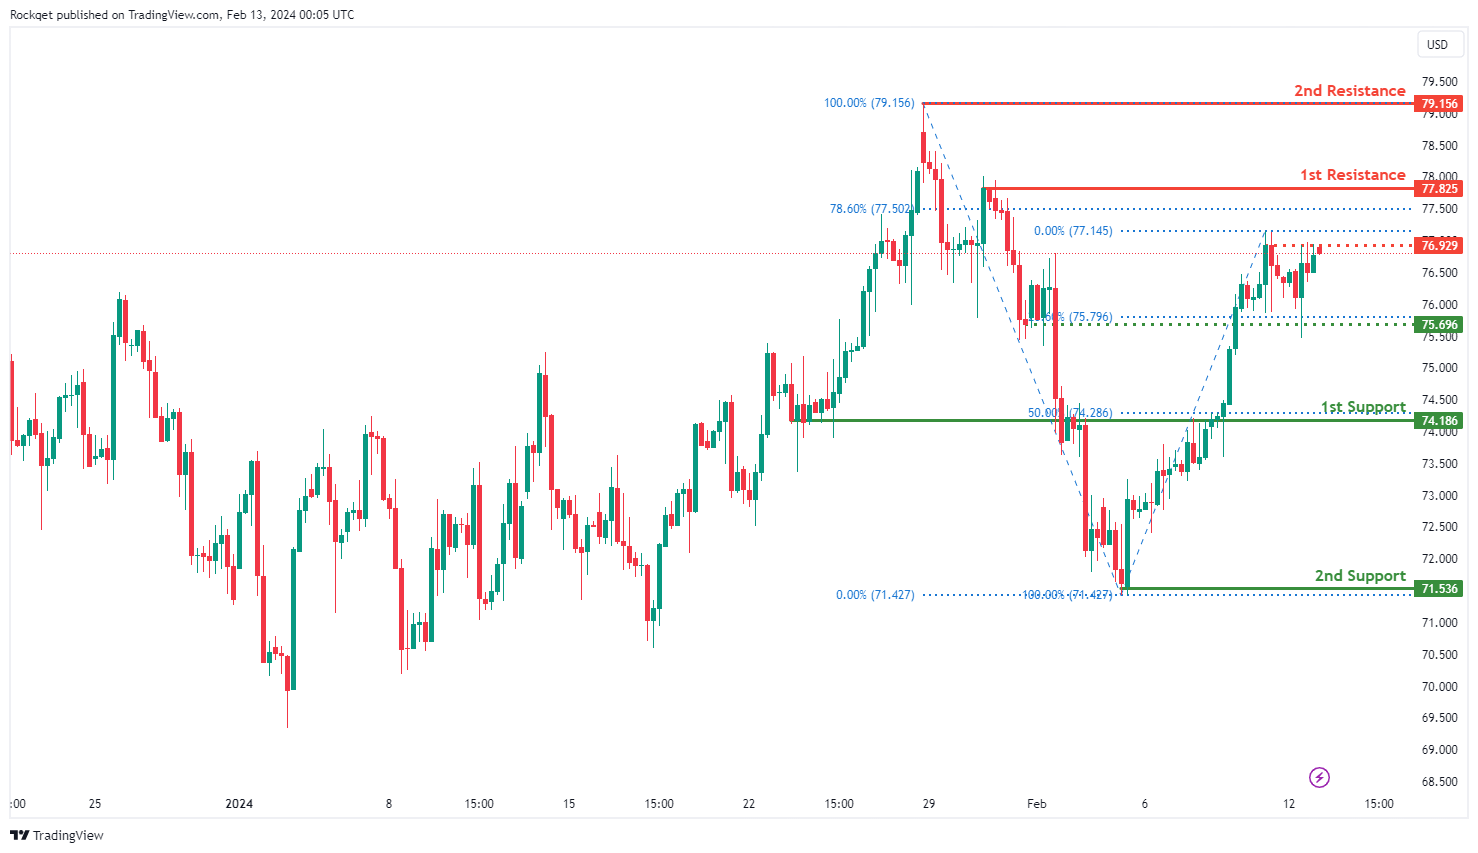
The WTI (West Texas Intermediate) chart currently exhibits an overall bullish momentum. In this context, there is a potential scenario for price to rise towards the 1st resistance should it break above the intermediate resistance.
The intermediate resistance level at 76.92 is identified as a pullback resistance while the 1st resistance level at 77.82 is also noted as a pullback resistance that aligns close to the 78.60% Fibonacci Retracement level. Higher up, the 2nd resistance level at 79.15 is marked as a swing-high resistance, further highlighting its importance as a potential resistance zone.
To the downside, the intermediate support level at 75.69 is identified as a pullback support that aligns with the 23.60% Fibonacci Retracement level while the 1st support level at 74.18 is noted as an overlap support that aligns with the 50.00% Fibonacci Retracement level. Further below, the 2nd support level at 71.53 is identified as a swing-low support, reinforcing its significance as a key support level.
XAU/USD (GOLD):
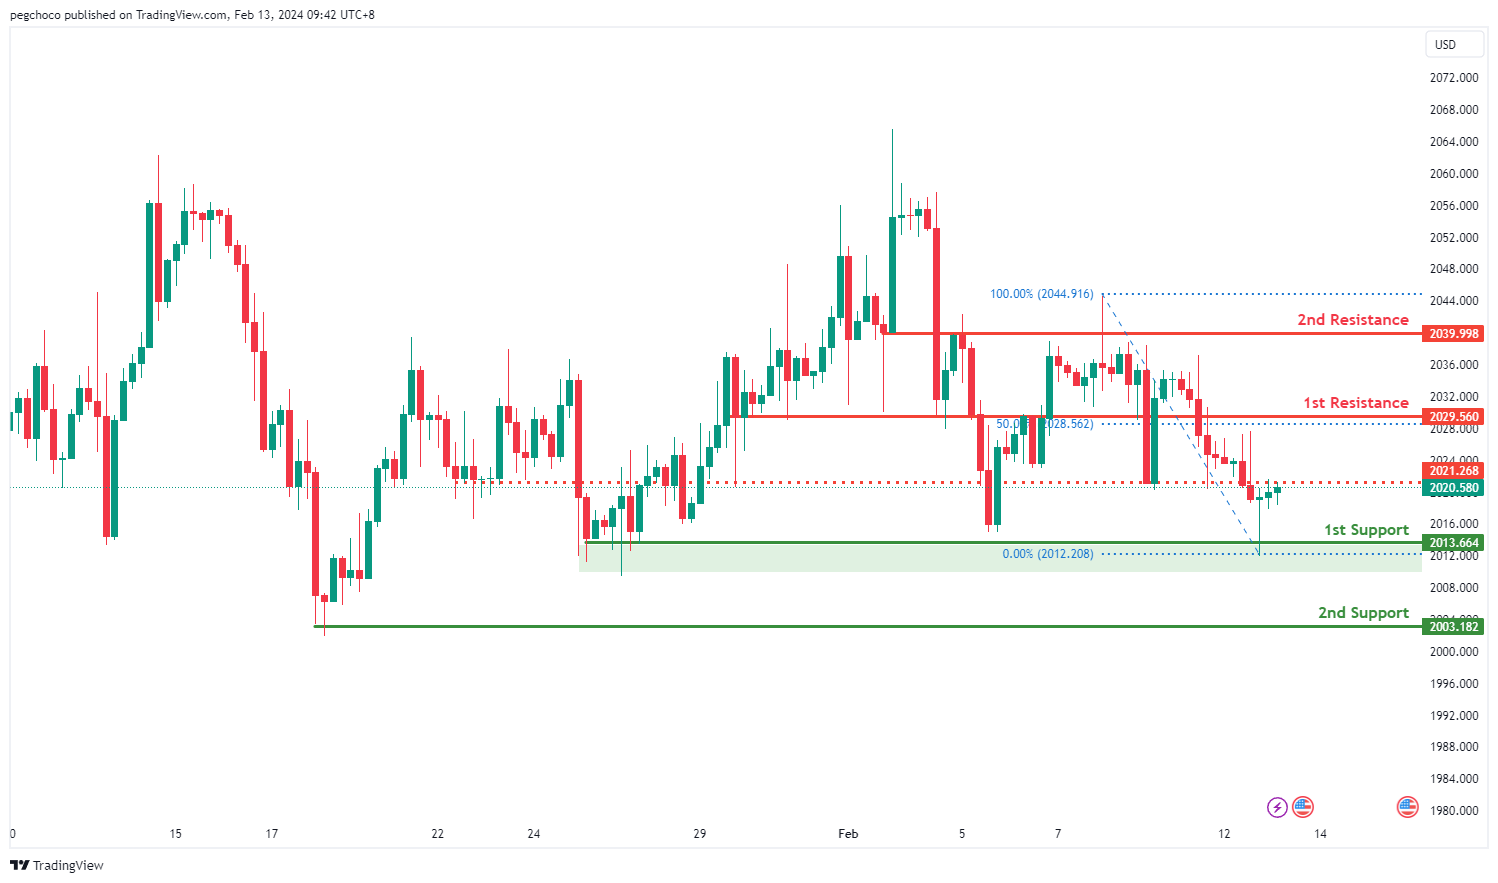
The XAUUSD chart currently demonstrates bullish momentum, indicating a potential continuation of the upward trend.
The first support level at 2013.66 is recognized as a multi-swing low support, suggesting a significant level where buying interest has historically emerged. Additionally, the second support at 2003.18 is characterized as a swing low support, reinforcing its significance as a level where buyers are likely to intervene.
On the resistance side, the first resistance is identified at 2029.56, noted as an overlap resistance. This level is particularly noteworthy as it aligns with the 50% Fibonacci Retracement level, indicating a potential area where selling pressure could emerge. Similarly, the second resistance at 2039.99 is categorized as an overlap resistance, presenting another potential barrier where price may encounter resistance.
Intermediate resistance at 2021.26 is labeled as an overlap resistance, highlighting another level where selling pressure may materialize.
Gold Price Restarts Decline, US CPI Report Next
Key Highlights
- Gold prices started a fresh decline from the $2,060 resistance.
- It traded below a key bullish trend line with support at $2,025 on the 4-hour chart.
- EUR/USD is consolidating losses below the 1.0830 resistance.
- The US Consumer Price Index could decline to 2.9% in Jan 2023 (YoY).
Gold Price Technical Analysis
Gold failed to settle above the $2,060 resistance zone against the US Dollar. It started a fresh decline below the $2,050 and $2,040 levels.
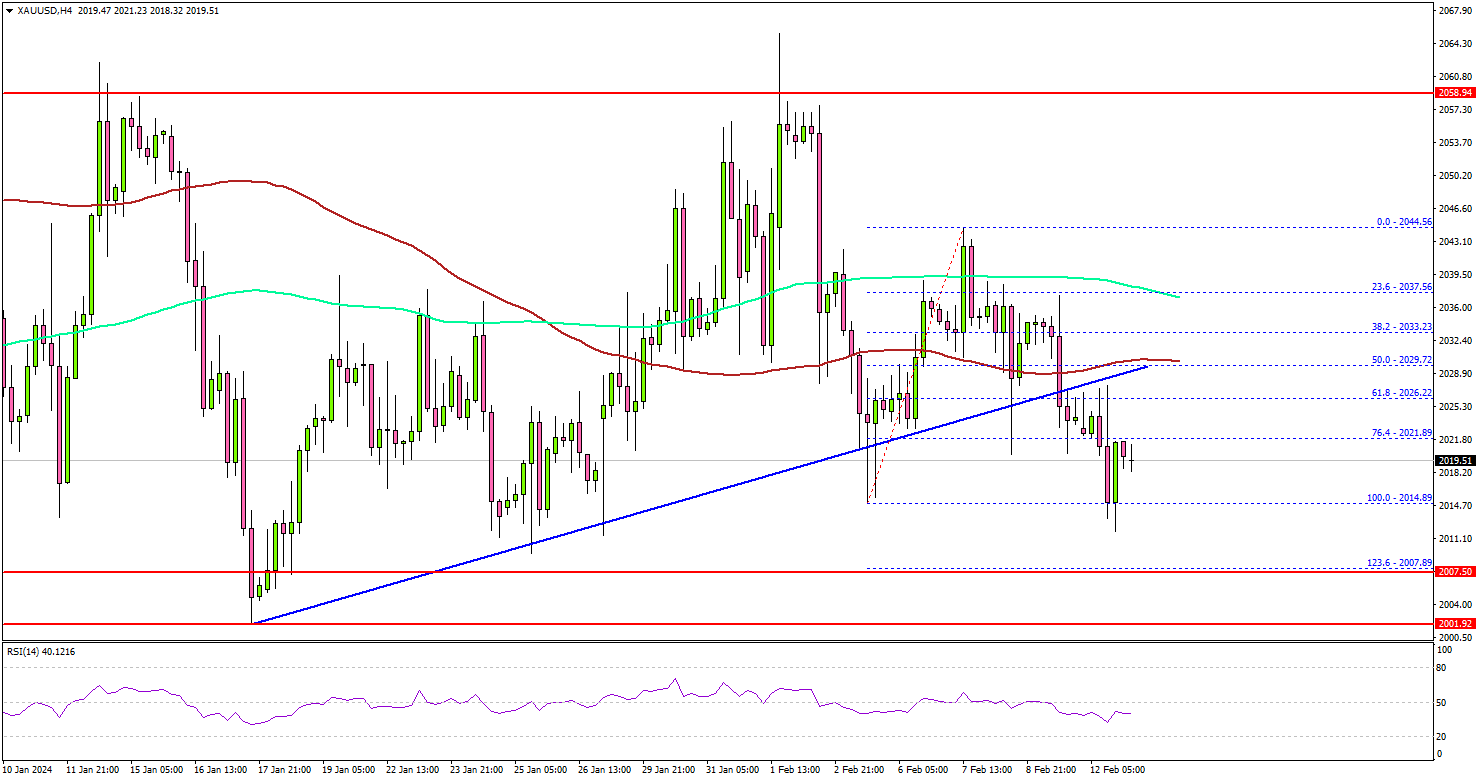
The 4-hour chart of XAU/USD indicates that the price settled below the $2,030 level, the 100 Simple Moving Average (red, 4 hours), and the 200 Simple Moving Average (green, 4 hours).
Besides, Gold traded below a key bullish trend line with support at $2,025 on the same chart. The current price action suggests a high chance of more downsides below the $2,010 level. Initial support is near the $2,007 level.
The first major support sits at $2,000. Any more losses might call for a move toward the $1,975 level in the coming days.
On the upside, the price is facing hurdles near the $2,030 level and the 100 Simple Moving Average (red, 4 hours). An upside break above the $2,030 level could send the price soaring toward the $2,050 resistance. The next major resistance is near the $2,060 level, above which Gold could test $2,078.
Looking at EUR/USD, the pair is still trading in a bearish zone below 1.0830 and there could be more losses in the near term.
Economic Releases to Watch Today
- US Consumer Price Index for Jan 2023 (MoM) – Forecast +0.2%, versus +0.2% previous.
- US Consumer Price Index for Jan 2023 (YoY) – Forecast +2.9%, versus +3.4% previous.
- US Consumer Price Index Ex Food & Energy for Jan 2023 (YoY) – Forecast +3.7%, versus +3.9% previous.
Australia NAB business conditions down to 6, price pressures easing
Australia NAB Business Confidence improved slightly form 0 to 1 in January. Despite this marginal improvement, Business Conditions dropped from 8 to 6, with notable decreases in trading conditions from 11 to 8, profitability conditions from 7 to 5, and employment conditions also falling from 7 to 5.
In terms of cost pressures, labour cost growth remained steady at 2.0% in quarterly equivalent terms, while purchase cost growth saw a slight increase to 1.8% from 1.7%. Product price growth experienced a pickup, moving to 1.2% in quarterly terms from 0.9%, reflecting a broader trend of easing price pressures. Specifically, retail price growth rose to 0.9% from 0.5%, and the growth rate for recreation & personal services prices increased to 1.2% from 0.9%.
NAB Chief Economist Alan Oster commented on the findings, stating, " Capacity utilisation remains high, despite the slowing in growth over the second half of 2023, and price pressures are easing, with hopes they settle well below where they are now."