Sample Category Title
Where Will Bitcoin’s New Growth Momentum End?
Market picture
The crypto market continues its impressive growth, rising over 3.5% in 24 hours to $1.87 trillion. Having broken through its January peak, the market is now at its highest level since April 2022. Confidently gaining momentum even before bitcoin halved, and with the Fed’s rate cut date still some way off, the crypto is confounding not only the pessimists but also the expectations of the cautious. This is a fertile environment for FOMO.
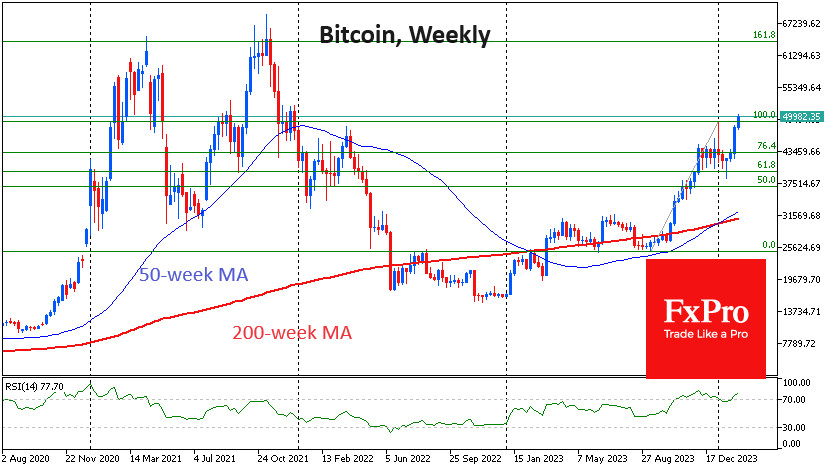
Bitcoin has breached the $50.2K mark, surpassing the psychologically important round level and the January highs set at the time of the spot ETF launch. Looking to the medium term, be prepared for a move out of the $46-52K range to mark the start of an aggressive rally.
From a longer-term perspective, we are formally seeing the beginning of the Fibonacci pattern, the target of which looks to be the $63.7K area. This is close to historical highs and is unlikely to be the end of the global rally, although a significant shakeout is expected.
News background
According to CoinShares, investment in crypto funds rose by a significant $1.116 billion last week, following inflows of $0.708B the week before. Bitcoin investments increased by $1.089B, Ethereum by $17 million, Cardano by $6M and Solana by just $0.1M.
Crypto funds have seen total inflows of $2.7B YTD, with total assets under management of $59B – the highest since the start of 2022.
The potential cash flow into Bitcoin could reach at least $52B a year, according to investment firm Mechanism Capital. At the same time, BlackRock and Fidelity estimate the potential inflow to be $150B-200B over the next three years.
Investment firm Valkуrie Funds expects the number of active spot bitcoin ETFs to be reduced to seven or eight by the end of the year due to the high cost of managing shares and low profits due to competition.
Several on-chain indicators have entered the so-called “risk zone”, which could signal the beginning of a bull market, Glassnode said. More robust net inflows into spot bitcoin ETFs have supported the market’s rally.
Fundamental changes in the supply-demand balance, along with other factors, are likely to have a positive impact on bitcoin prices post-halving, according to Grayscale.
According to a survey by JPMorgan Bank, fewer and fewer large companies believe in the potential of blockchain, with the number falling to 7% by 2024.
Bitcoin Price Exceeds Psychological Level of $50k
The last time the BTC price was above $50,000 was in December 2021, making its way to the low around $15,500 reached in November 2022.
Reaching the $50,000 level was facilitated by:
→ waiting for the halving, after which the price of Bitcoin is believed to receive a bullish impulse due to a reduction in supply;
→ the effect of the approval of a Bitcoin ETF;
→ expectation of easing of the Fed's monetary policy, which increases interest in risky assets. By the way, the Nasdaq-100 technology stock index set a historical high yesterday, breaking the level of 18,000 points.
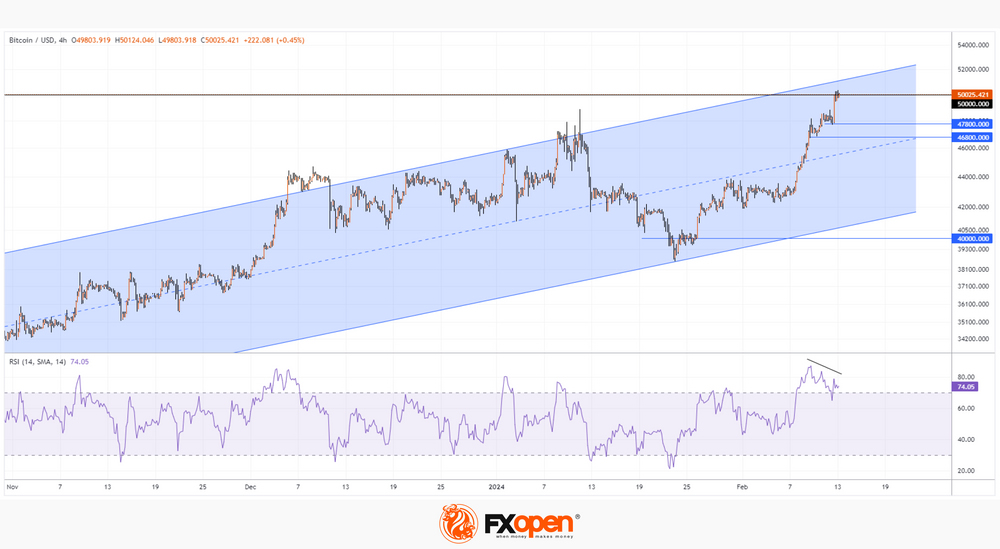
At the same time, the BTC/USD chart shows that:
→ the price of Bitcoin moves within an ascending channel (shown in blue), which dates back to last fall;
→ from the point of view of technical analysis, with this channel construction, the price of Bitcoin still has some room to rise to its upper limit.
However, please note that:
→ the widely known crypto fear and greed index has a value of 79 out of 100, indicating extreme greed;
→ the RSI indicator is in the overbought zone and is forming a bearish divergence pattern, which is a sign of weakening buying pressure;
→ exceeding the psychological level can result in a false breakout, as was the case with a short-term decline in the price of Bitcoin below the support level of 40,000.
Considering the above arguments, there is reason to believe that if the Bitcoin rally continues, it may soon be replaced by a correction to allow the market to “blow off steam” at least in the short term.
FXOpen offers the world's most popular cryptocurrency CFDs*, including Bitcoin and Ethereum. Floating spreads, 1:2 leverage — at your service. Open your trading account now or learn more about crypto CFD trading with FXOpen.
*At FXOpen UK and FXOpen AU, Cryptocurrency CFDs are only available for trading by those clients categorised as Professional clients under FCA Rules and Professional clients under ASIC Rules respectively. They are not available for trading by Retail clients.
This article represents the opinion of the Companies operating under the FXOpen brand only. It is not to be construed as an offer, solicitation, or recommendation with respect to products and services provided by the Companies operating under the FXOpen brand, nor is it to be considered financial advice.
USDCHF Picks Up Steam, But Caution Needed
- USDCHF speeds up, approaches crucial zone
- Overbought signals detected
- Important resistance at 0.8888
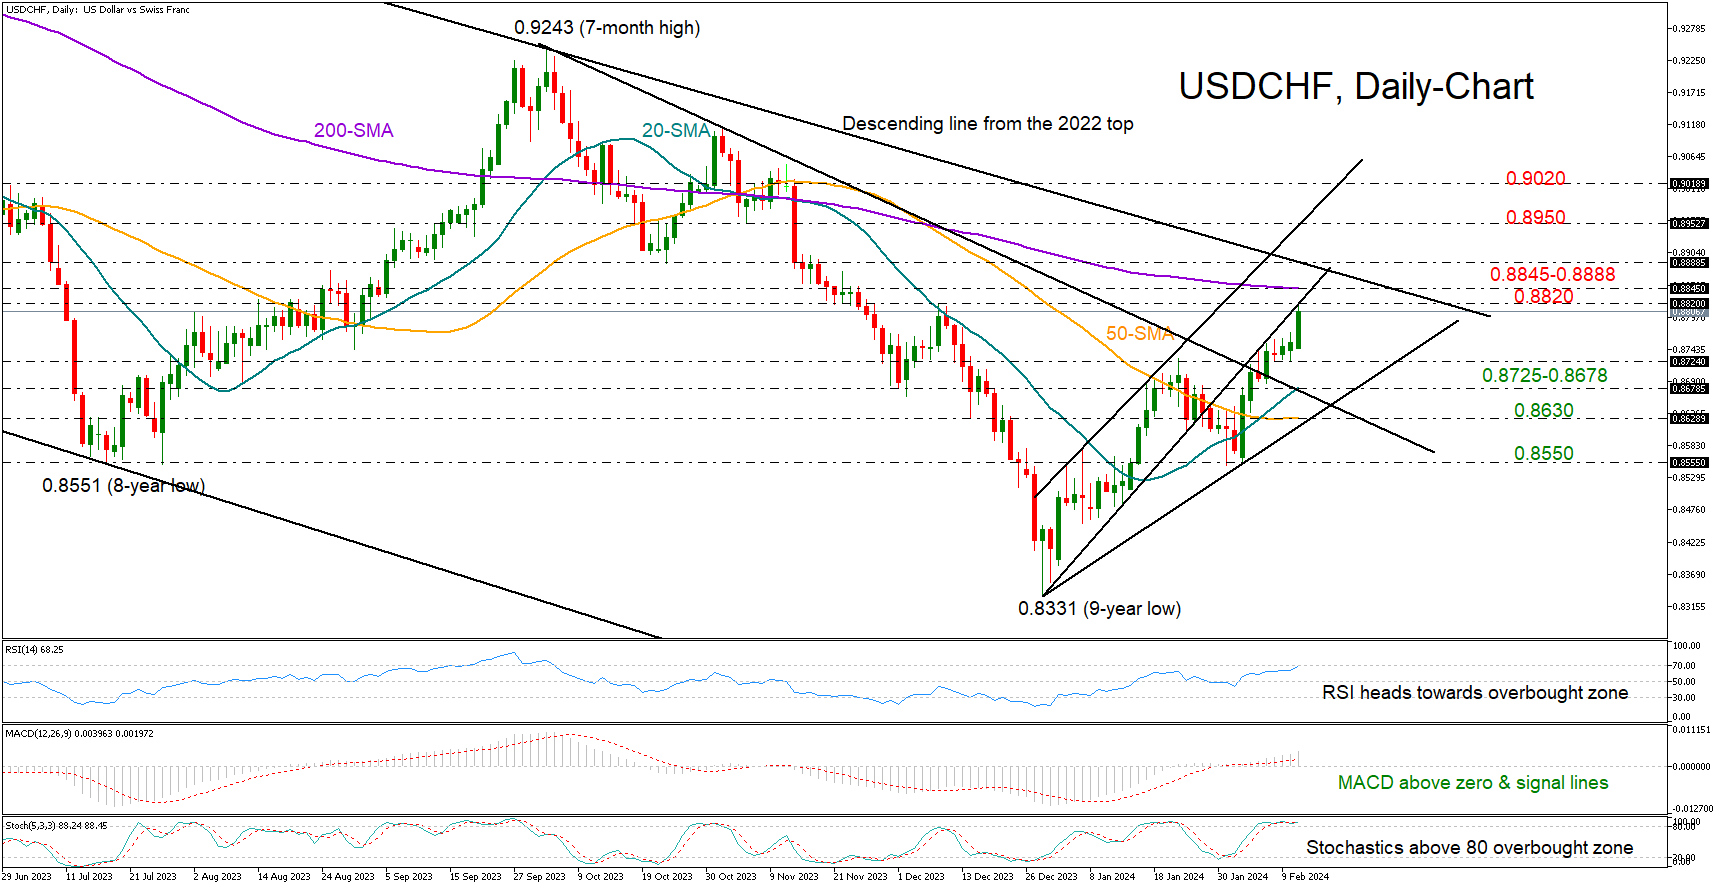
USDCHF gained significant positive momentum during the early European trading hours on Tuesday after a couple of weak sessions, extending its short-term uptrend from December’s low to 0.8816.
Despite the current euphoria in the market, traders will have to be prepared for a potential downside correction as the price is testing the support-turned-to-resistance trendline near December’s high. The 200-day simple moving average (SMA) at 0.8845 and the tentative long-term descending trendline from the 2022 top at 0.8888 are also in the neighborhood.
The RSI and the stochastic oscillator are already near overbought levels. Hence, if upside pressures fade out immediately, the price may reverse lower to seek support near the 0.8725 constraining zone. A break lower could stall around the 20-day SMA and the descending trendline from the 2023 high at 0.8678, while deeper, the decline could stabilize near the 50-day SMA and the tentative ascending trendline from the December low at 0.8630. Failure to hold there could bolster selling appetite towards 0.8550.
Should the pair find enough buyers to cross above the 0.8880 threshold, the uptrend could strengthen towards the 2024 resistance line at 0.8950. Then, the bulls may push again for a close above the 0.9020 bar.
In brief, USDCHF is not out of the woods yet, despite its latest acceleration. Traders would like to see a continuation above 0.8888 to increase their buying orders.
USDJPY Bulls Take Control, But It Could be a Trap
- USDJPY rises but trades within a bearish pattern
- Resistance expected around 149.70-150.00
- US CPI inflation data due for release at 13:30 GMT
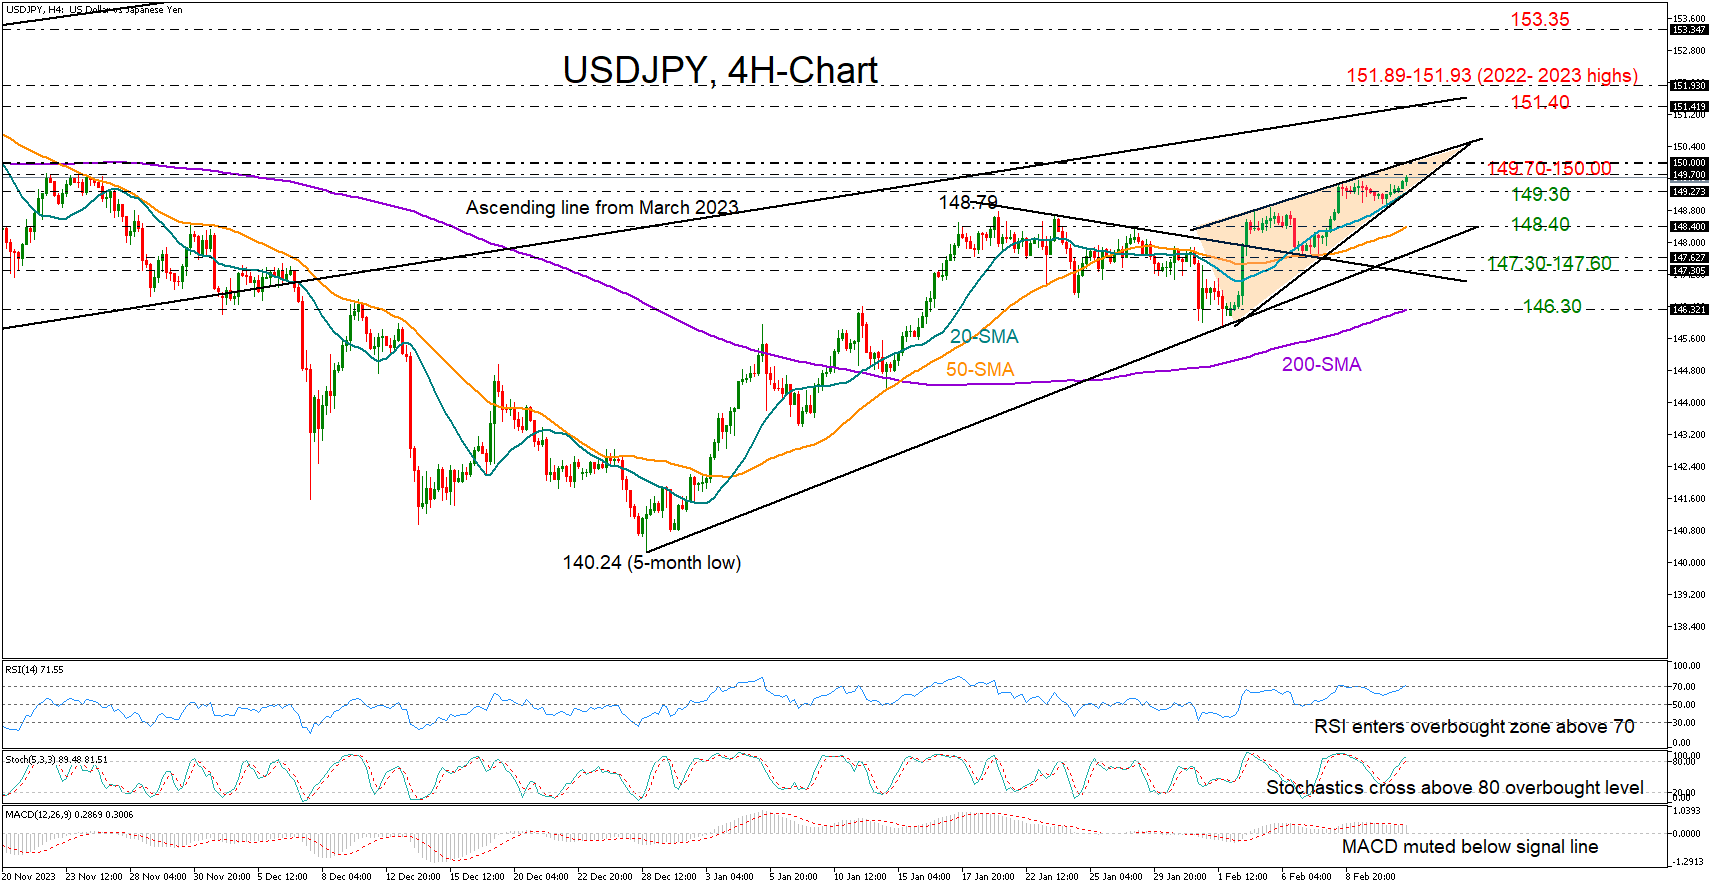
USDJPY turned green after touching its 20-period simple moving average (SMA) in the four-hour chart, rising gradually to a new high of 149.64 on Tuesday and closer to November’s resistance zone ahead of the US CPI inflation data.
February’s trading has transformed into a rising wedge pattern, which is theoretically a signal of a potential bearish reversal. The RSI and the stochastic oscillator are sending a cautious message too as they enter the overbought territory, suggesting upside forces might fade out soon. Note that the MACD has shown no improvement yet, remaining muted below its red signal line.
A decisive close above 149.70-150.00 could eliminate downside risks, boosting the price up to the 151.40 region, where the ascending line from March 2023 is placed. November’s peak of 151.89 and the 2022 top of 151.93 could be the next challenge before the bulls target the 153.35 constraining zone taken from the summer of 1990.
Alternatively, a close below the triangle and the 20-period SMA at 149.30 could trigger a decline towards the 50-period SMA at 148.40. Even lower, the pair may attempt to rebound somewhere within the 147.30-147.60 trendline region. If not, the bears could aggressively squeeze the pair towards the 200-period SMA at 146.30.
All in all, USDJPY continues to face a risky technical picture despite its latest upturn. A durable extension above the 149.70-150.00 region could postpone selling activities.
EURUSD Loses Steam After Bounce Off 1.0725
- EURUSD holds beneath downtrend line in short-term
- 20- and 200-day SMAs post death cross
- Long-term view is still bullish
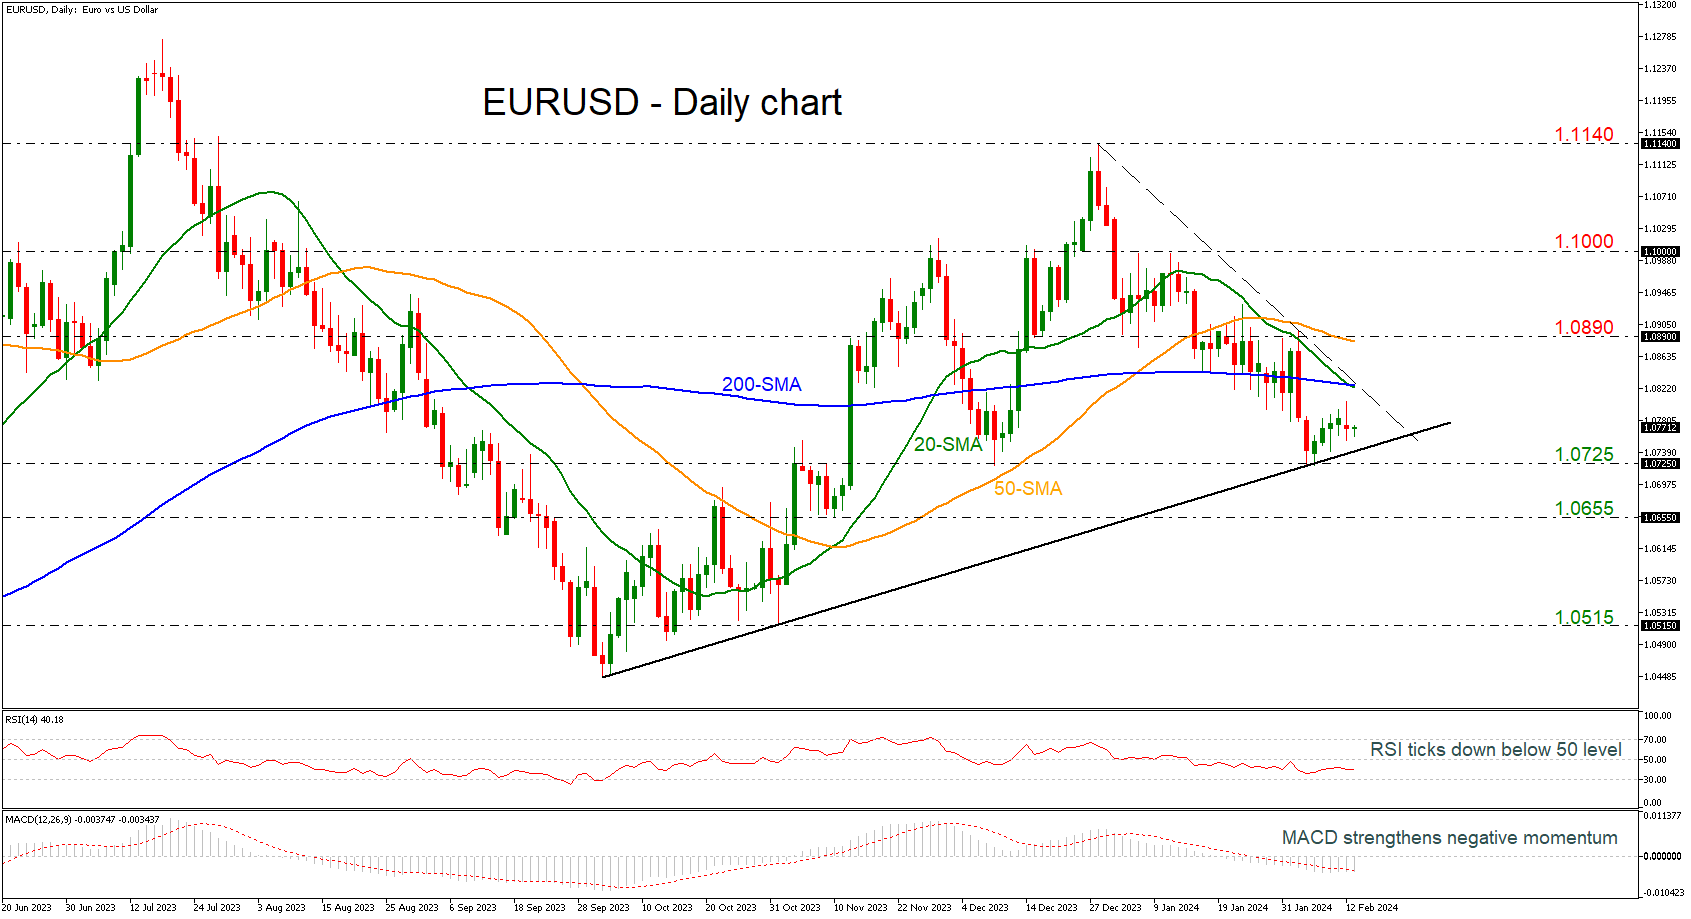
EURUSD is struggling to continue the rebound that started from the 1.0725 support level and the medium-term ascending trend line. Currently, the market is losing momentum indicating a potential downside movement again.
The 20-day and 200-day simple moving averages (SMAs) are on the verge of forming a death cross, confirming a decline. Moreover, the RSI indicator is currently pointing south below the neutral threshold of 50, while the MACD is showing a continuation of its bearish pattern below both its trigger and zero lines.
If the price movement were to reverse, immediate support could once more be found at 1.0725. Steeper decreases could test the 1.0655 barrier serves as an additional important line ahead of the 1.0515 barrier, achieved on November 1.
In the upward direction, the bearish intersection of the SMAs at 1.0830, which coincides with the short-term descending trend line, presents immediate resistance. Beyond that point, the 50-day SMA at 1.0890 emerges as the subsequent significant obstacle to monitor. With a higher run, the 1.1000 round number might put a stop to bullish moves.
Summarizing, in the near-term EURUSD structure is negative; nevertheless, the pair is establishing above the uptrend line over the medium term and any climbs above 1.1000 could endorse the longer-term bullish view.
EURJPY Re-enters Bullish Channel
- EURJPY edges higher after 50-day SMA prevents decline
- Jumps back within its bullish channel in place since June
- Momentum indicators turn positive
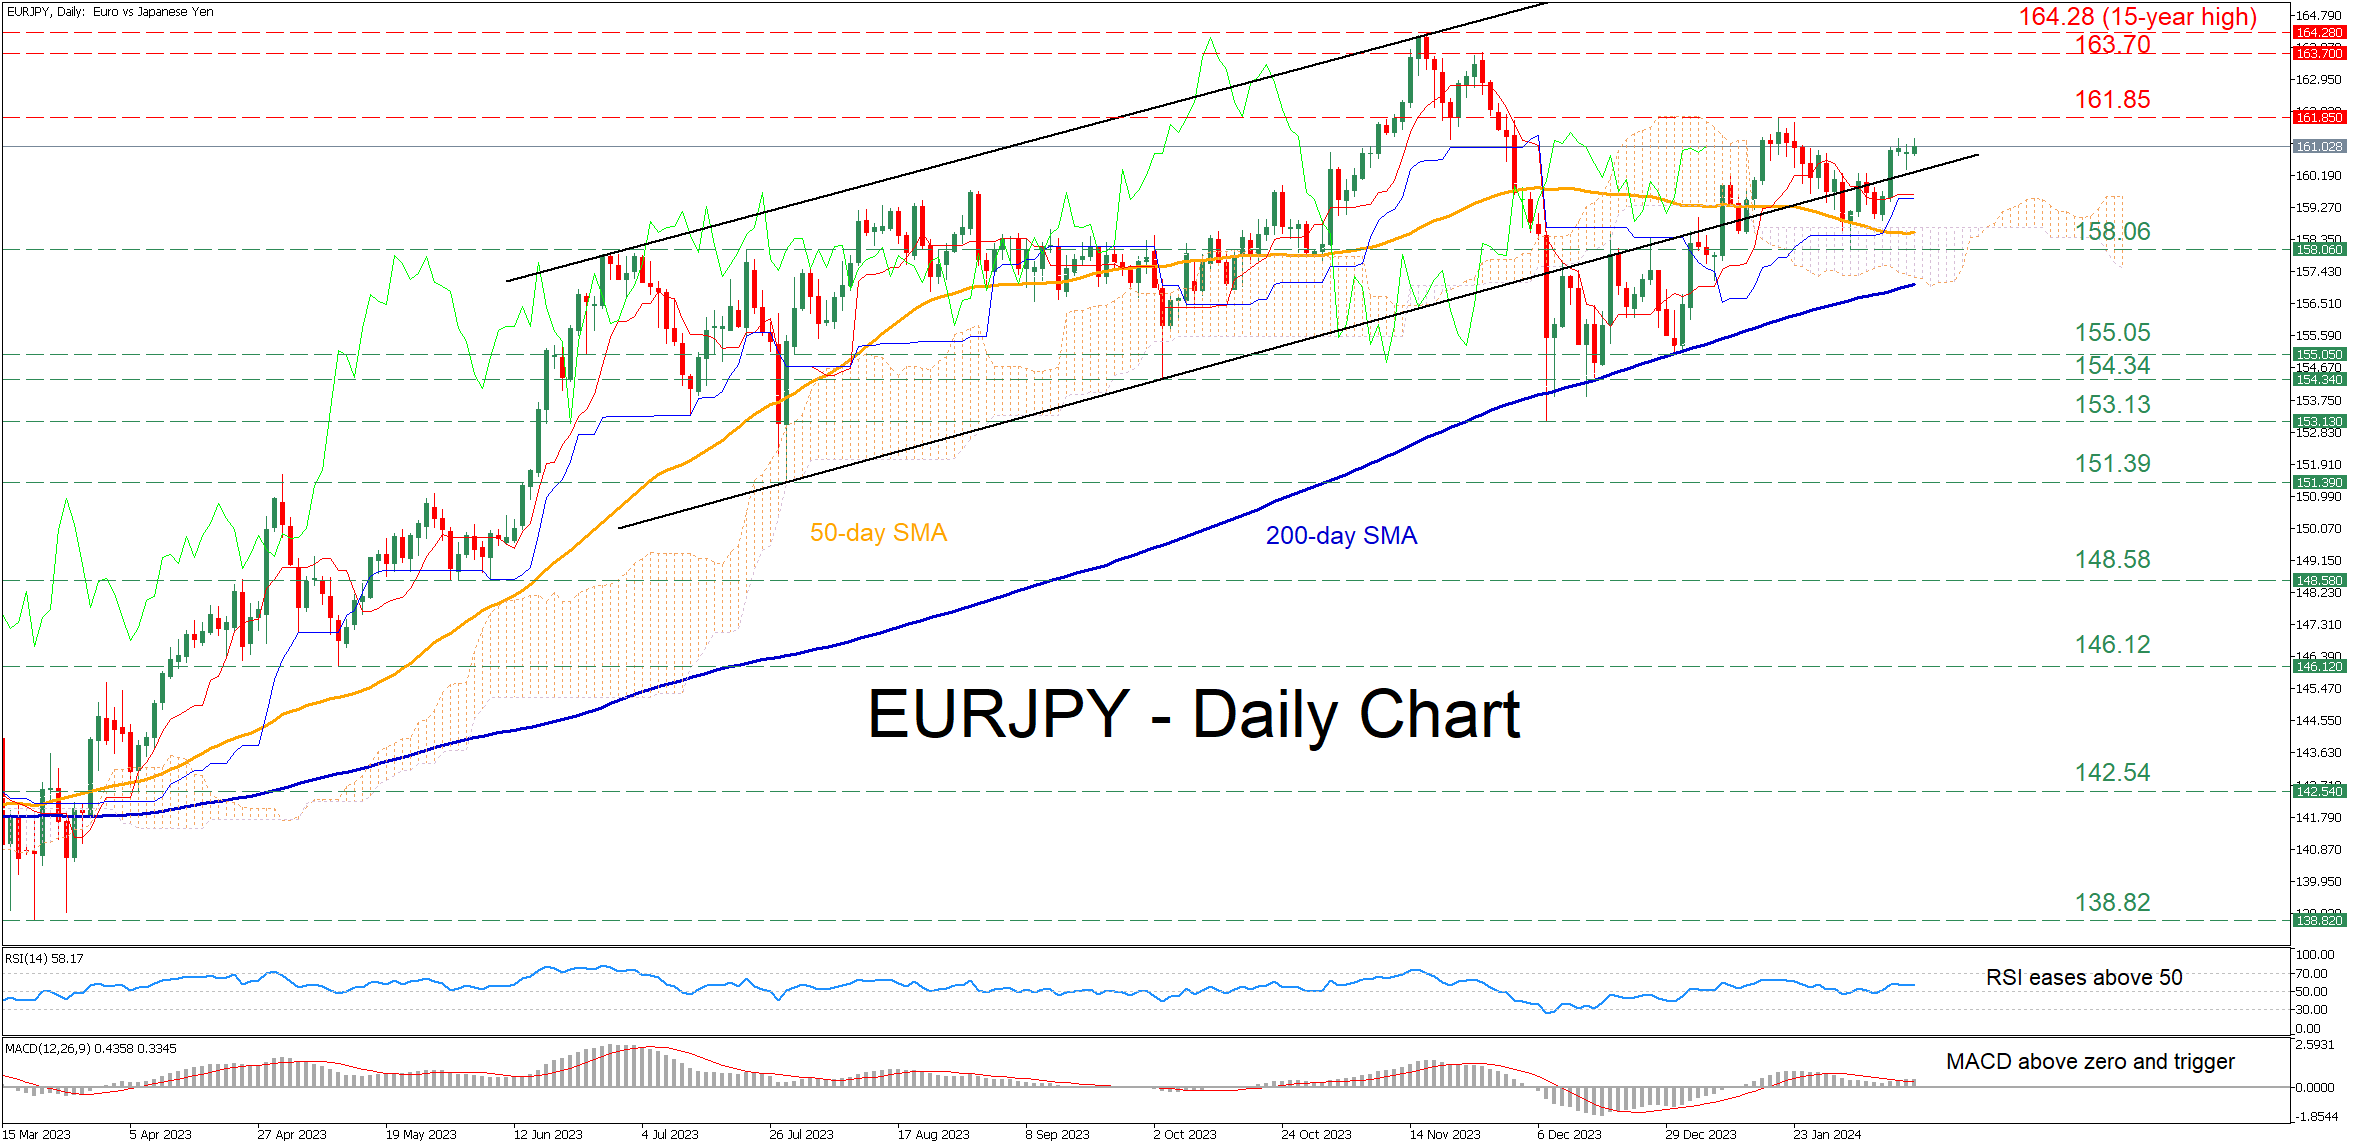
EURJPY had been sliding lower in the short term, following its rejection at 161.85 in late January. Nevertheless, the pair managed to quickly recoup most of its losses after the 50-day simple moving average (SMA) curbed its downside, re-entering its medium-term bullish channel.
Given that both the RSI and MACD are within their positive zones, the price may revisit the January high of 161.85. Should that barricade fail, the spotlight could turn to the November resistance of 163.70. A break above that area could pave the way for the 15-year peak of 164.28.
Alternatively, if the rebound falters and the pair drops back below its upward sloping channel, the February support of 158.06 could act as the first line of defence. Further declines could then come to a halt at the January low of 155.05 ahead of the October support of 154.34. Even lower, the December bottom of 153.13 could provide downside protection.
In brief, EURJPY has been on track to erase the recent pullback after finding its feet at the 158.06 mark. Hence, a break above the recent rejection region of 161.85 could bring the multi-year highs registered in 2023 under scrutiny.
GBP/JPY Daily Outlook
Daily Pivots: (S1) 188.06; (P) 188.40; (R1) 188.93; More...
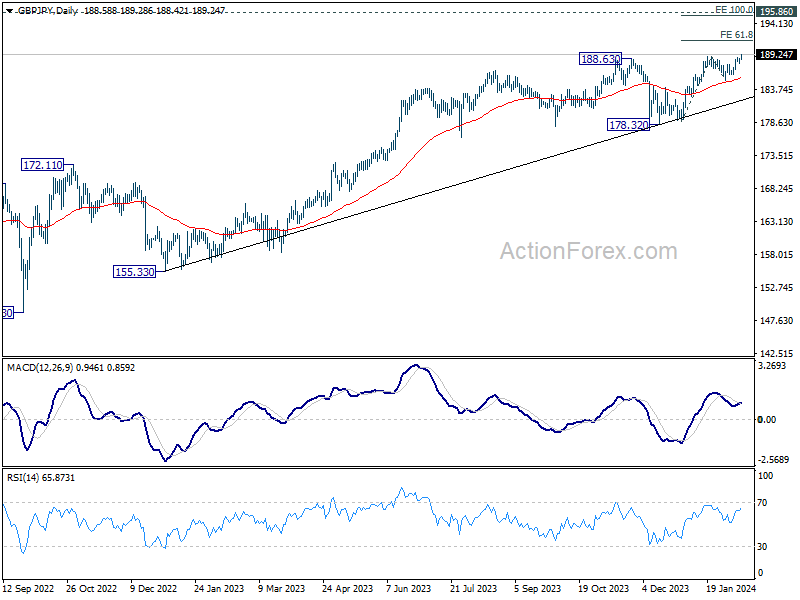
GBP/JPY's strong break of 188.90 confirms up trend resumption. Intraday bias stays on the upside. Next near term target is 61.8% projection of 178.71 to 188.90 from 185.21 at 191.50. On the downside, below 187.83 minor support will turn intraday bias neutral and bring consolidations first. But outlook will stay bullish as long as 185.21 support holds, in case of retreat.
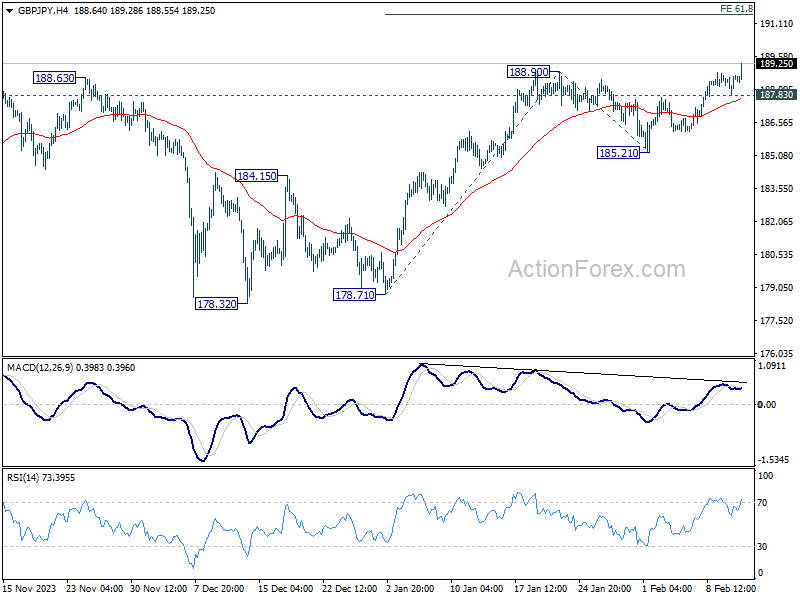
In the bigger picture, up trend from 123.94 (2020 low) in in progress. Medium term outlook will stay bullish as long as 178.32 support holds. Next target is 195.86 long term resistance (2015 high).
EUR/JPY Daily Outlook
Daily Pivots: (S1) 160.47; (P) 160.79; (R1) 161.19; More...
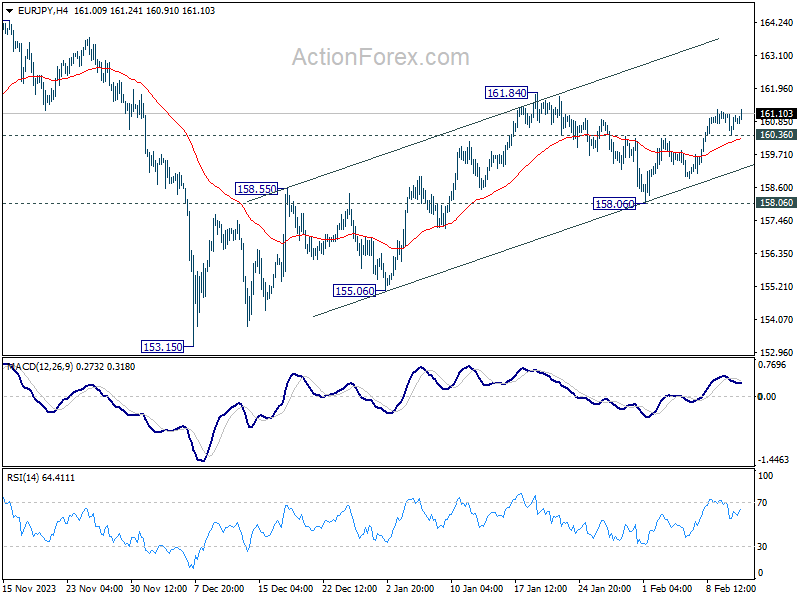
Intraday bias in EUR/JPY stays on the upside despite loss of momentum. Firm break of 161.84 will confirm resumption of whole rise from 153.15. Next target is a retest on 164.29 high. On the downside, below 160.36 minor support will turn intraday bias neutral first. But further rally is expected as long as 158.06 support holds, in case of retreat.
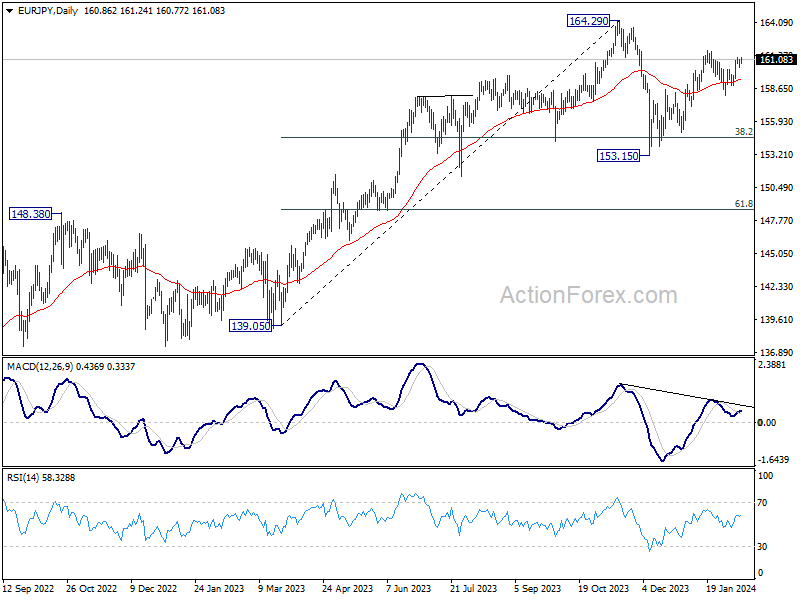
In the bigger picture, price actions from 164.29 medium term top are seen as a correction to rise from 139.05 only. As long as 148.38 resistance turned support holds (2022 high), larger up trend from 114.42 (2020 low) is expected to resume through 164.29 at a later stage. Next target would be 169.96 (2008 high).
EUR/GBP Daily Outlook
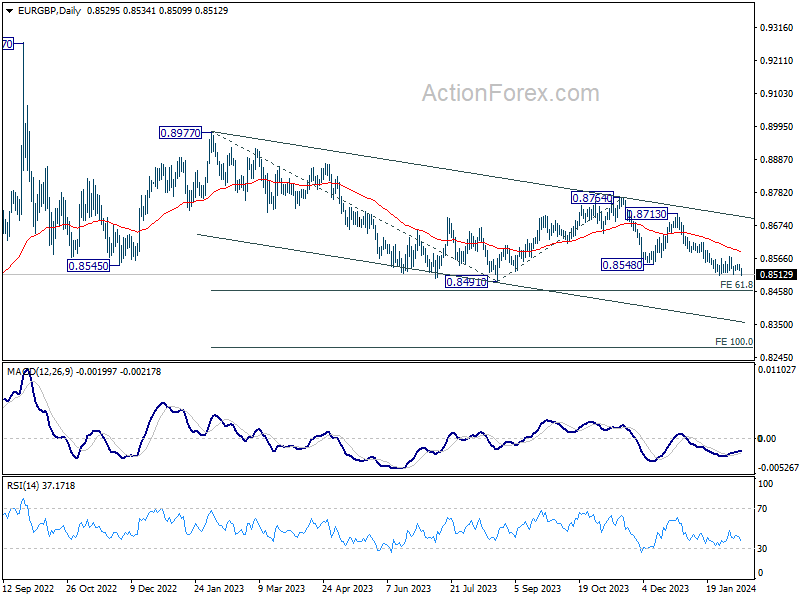
Daily Pivots: (S1) 0.8524; (P) 0.8535; (R1) 0.8542; More...
EUR/GBP's breach of 0.8512 support suggests that recent decline is resuming. Intraday bias is back on the downside for 0.8491. Break there will resume larger down trend to 0.8464 projection level. For now, break of 0.8571 resistance is needed to indicate short term bottoming. Otherwise, outlook will stay bearish in case of recovery.
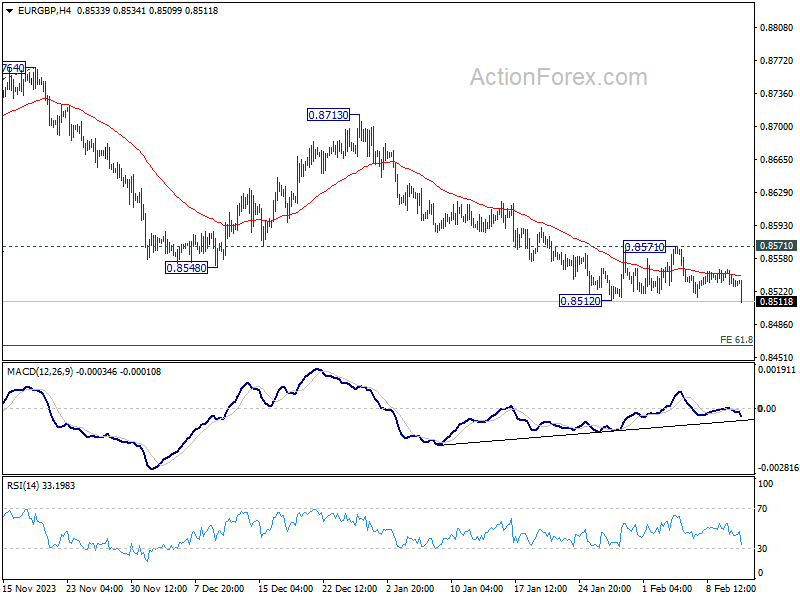
In the bigger picture, fall from 0.8764 is seen as another leg in the whole down trend from 0.9267 (2022 high). Outlook will stay bearish as long as 0.8713 resistance holds. Break of 0.8491 will target 61.8% projection of 0.8977 to 0.8491 from 0.8764 at 0.8464.
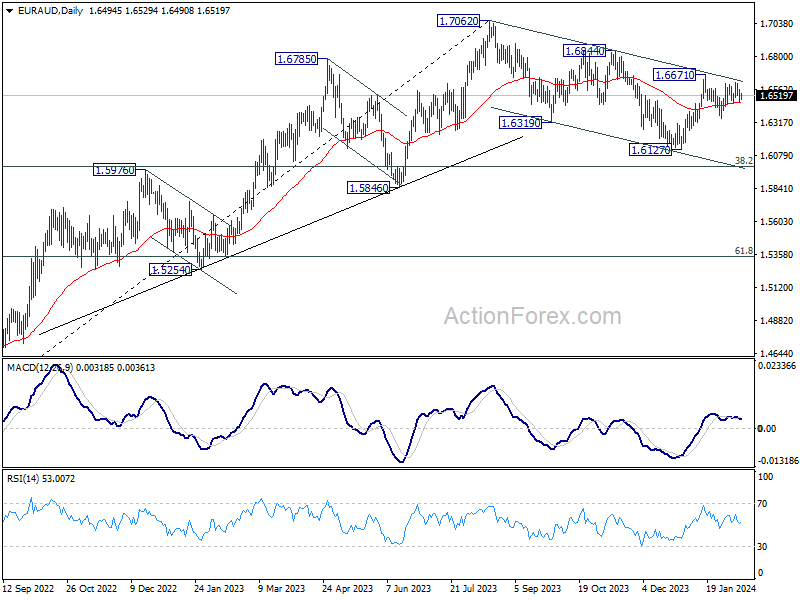
EUR/AUD Daily Outlook
Daily Pivots: (S1) 1.6460; (P) 1.6512; (R1) 1.6547; More...
No change in EUR/AUD's outlook as sideway trading continues. Intraday bias stays neutral at this point. On the upside, decisive break of 1.6671 will revive the case that whole correction from 1.7062 has completed with three waves down to 1.6127. Further rally should then be seen to 1.6844 resistance for confirmation. Nevertheless, break of 1.6438 will bring deeper fall back to 1.6127 support instead.
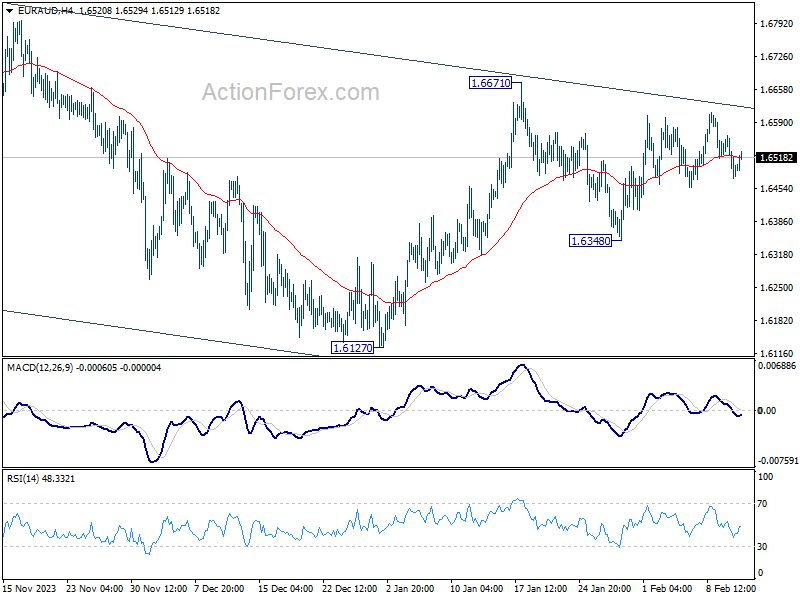
In the bigger picture, fall from 1.7062 medium term top is seen as a correction to the up trend from 1.4281 (2022 low). Break of 1.6844 resistance will argue that this up trend is ready to resume through 1.7062 high. In case of another fall, strong support should be seen around 1.5846 and 38.2% retracement of 1.4281 to 1.7062 at 1.6000 to bring rebound.