Sample Category Title
EURJPY Rotates Lower as Rebound Falters
- EURJPY bounces back after 50-day SMA prevents decline
- But reverses lower again, finding support at descending trendline
- Momentum indicators are neutral-to-negative
EURJPY has been sliding lower in the short term, following its rejection at 161.85 in late January. Despite its temporary rebound at the 50-day simple moving average (SMA), the pair has been on the retreat again, holding marginally above the downward sloping trendline taken from its 15-year peak of 164.28.
Should selling pressures persist, the price could initially test the February support of 158.06. Further declines could then come to a halt at the January low of 155.05 ahead of the October support of 154.34. Even lower, the December bottom of 153.13 could provide downside protection.
Alternatively, if buyers re-emerge and propel the price higher, immediate resistance could be found at 160.80, which overlaps with the lower boundary of the pair’s ascending channel. Jumping above that territory, the price may revisit the January high of 161.85. A break above that area could pave the way for the 15-year peak of 164.28.
In brief, despite attempting to pause its short-term selloff, EURJPY remains under significant downside pressure. Hence, a break below the descending trendline currently in place could accelerate the decline.

EUR/GBP One Step Away from a Descending Stair
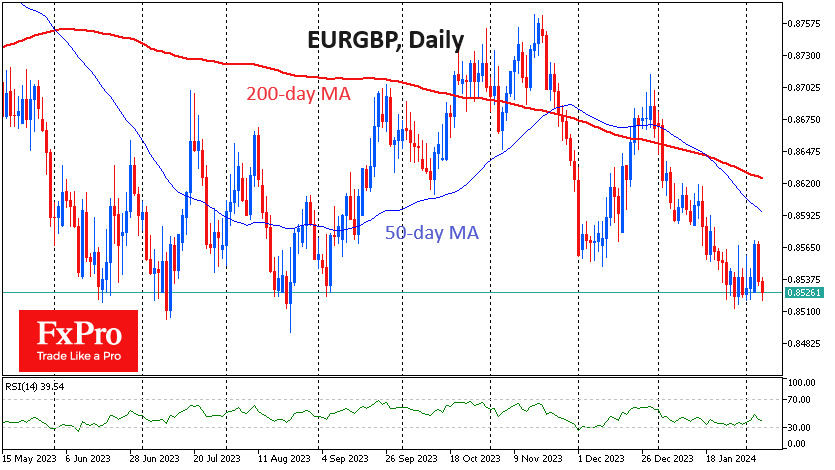
The euro is back at 0.8520 against the pound. The pair bounced off this level in June and August last year. Reaching the same level in late January triggered a shake-out, but active declines resumed on Tuesday and Wednesday, and the pair is testing multi-month lows with renewed vigour.
Technically, a break of support at 0.8500 would allow a move towards 0.8250-0.8300 to be considered as a working scenario. A decline of 2.0-2.5% looks like a significant move. However, we may be seeing the beginning of a new global trend.
EURGBP has tried to break above 0.9200 several times since 2016, mainly triggered by the weakness of the pound. We may now be entering a period of euro weakness, like what we saw in 2013-2015. Back then, a wave of pressure on the euro pushed EURGBP towards 0.7000.
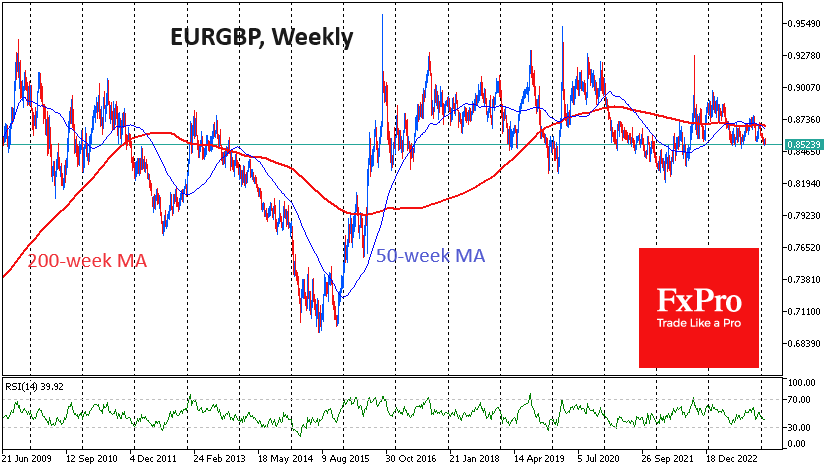
The reason for this global reshuffle in a rather dull pair could be the increasing divergence in economic dynamics. With interest rate changes on the agenda, interest is being drawn to the more buoyant economies where the UK has an advantage due to domestic demand.
The level of interest rates and interest rate expectations will also be critical in the coming quarters. The Bank of England’s base rate is now 5.25%, compared with 4.5% for the ECB. However, markets expect the Bank of England to cut four times to 4.25% by 2024. The ECB is expected to start its rate-cutting cycle a little earlier and bigger.
While one should be prepared for the EURGBP to return to a lower floor, confirmation in the form of a break of 0.8500 is still needed and is not yet a done deal. There is still a relatively high chance of renewed gains from current levels, as the current multi-month lows may attract buyers into the EUR.
AUDUSD: Initiating Macro Bearish Reversal
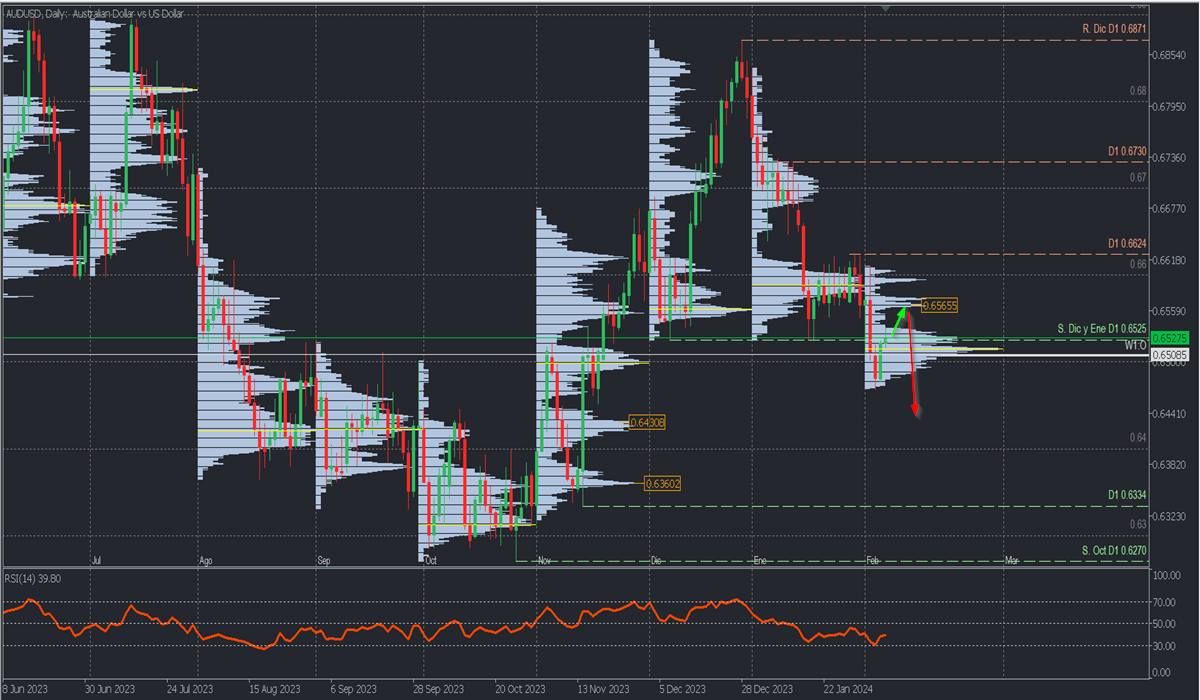
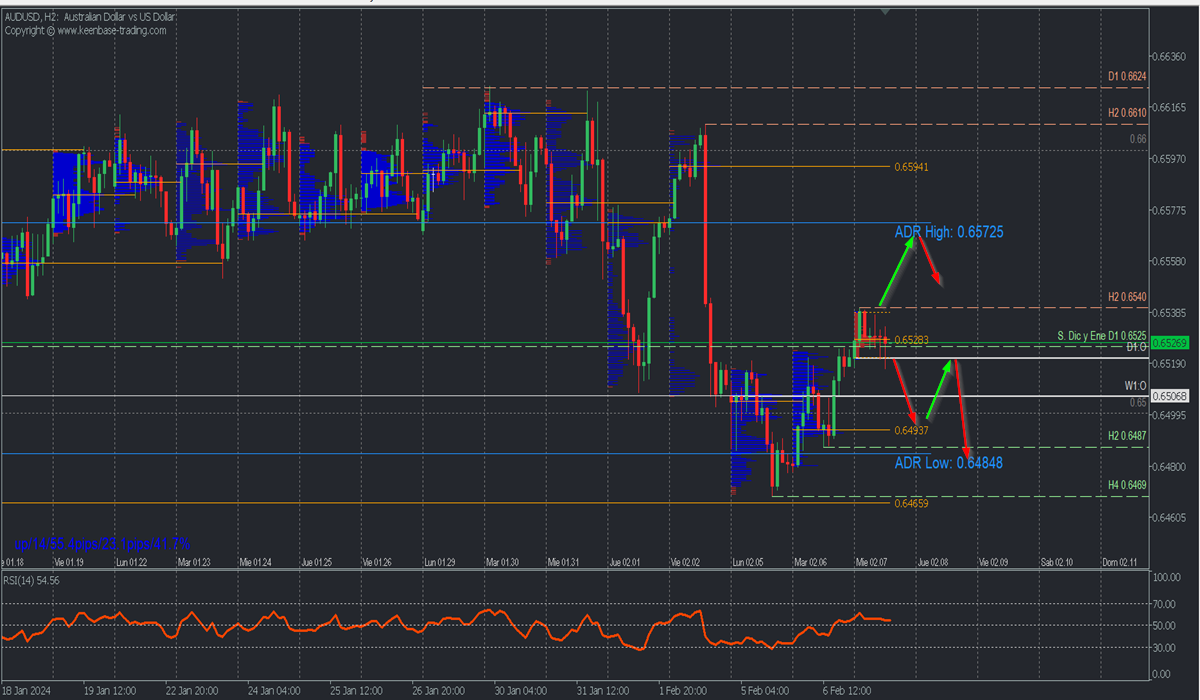
Bearish Scenario: Selling below 0.6516 with TP1: 0.65, TP2: 0.6487, and upon its breakout TP3: 0.6469. It is recommended to place a stop loss above 0.6541, at least 1% of the account capital. Trailing stop can be used.
Bullish Scenario: Buying above 0.6540 with TP1: 0.6572, TP2: 0.6594, and TP3: 0.66. It is recommended to set a stop loss (S.L.) below 0.6520 or at least 1% of the account capital.
Analysis from Daily Chart. Volume Profile and Structure.
AUDUSD may be facing a reversal of the bullish trend from the last quarter of 2023, with the breakdown of the December and January support at 0.6525, leaving resistance at 0.6624. The current correction may still extend towards the high volume node around 0.6565, to resume sales towards one of the high volume nodes of November at 0.6430 and the round level 0.64. This scenario will be active as long as the retracement does not break above 0.66 and the resistance at 0.6624. The RSI positioned in negative territory confirms a bearish momentum for the pair.
Scenario from H2 Chart.
The current correction leaves a local resistance at 0.6540, whose decisive breakout will extend purchases towards the daily bullish average range at 0.6572, opening the door to reach Friday's uncovered POC at 0.6594, thus covering the volume inefficiency or volume gap left by Friday's decline. This is a selling zone that will encourage bearish entry to resume pair sales.
On the other hand, an anticipated bearish scenario will be activated with quotes below the broken support at 0.6525 towards Tuesday's uncovered POC at 0.6493, whose breakout in a second touch will break the correction support at 0.6487, indicating a continued decline towards the next support and buying zone around 0.6466.
*Uncovered POC: POC = Point of Control: It is the level or zone where the highest volume concentration occurred. If there was previously a downward movement from it, it is considered a selling zone and forms a resistance zone. Conversely, if there was previously an upward impulse, it is considered a buying zone, usually located at lows, forming support zones.
Risk Management Consideration:
**It is very important that risk management be based on capital and traded volume. For this, a maximum risk of 1% of the capital is recommended. It is suggested to use risk management indicators like Easy Order.
WTI Oil: Recovery Extends into Third Day But Risk of Stall Exists
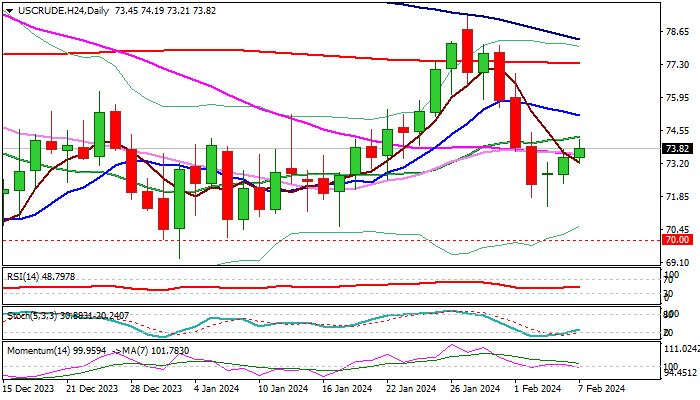
WTI oil price extends recovery from new multi-week low ($71.40) into third consecutive day.
Profit-taking after last week’s 8.1% drop was contained by 200WMA, lifted the price along with lower than expected increase in US crude inventories (API report) and cut in forecast for US oil production growth which cooled concerns about potential oversupply.
Recovery penetrated thick daily cloud, (base of the cloud lays at $73.37) but faced increased headwinds at pivotal barriers at $74.27 (daily Kijun-sen) and generating initial signal of potential recovery stall.
The notion is supported by weakening bullish momentum and daily MA’s in predominantly bearish configuration, which keeps in play risk of very limited correction before larger bears regain full control for renewed probe through cracked $72.12 Fibo support, loss of which to open way for further retracement of $67.70/$79.27 uptrend.
Conversely, firm break of $74.27 pivot to firm near-term structure for attack at upper pivot at $75.34 (50% retracement of $79.27/$71.40 / daily Tenkan-sen).
Res: 74.27; 75.34; 76.92; 78.07.
Sup: 73.37; 72.37; 71.40; 70.61.
Sunset Market Commentary
Markets
In the absence of key eco data, both in the US and Europe, central bankers’ talk today was again earmarked as the main guide for bond markets. ECB board member Isabel Schnabel in the FT gave an in extenso assessment on the importance of the ECB walking the last mile to defeat inflation. She warns on a slowdown in the disinflationary process, especially in the services sector. Nominal wages are rising strongly as employees are trying to catch up on their lost income. At the same time Schnabel sees a worrying decline in productivity. This combination leads to higher unit labour costs. Question is how this will translate into firm’s pricing. Here monetary policy should continue to do its job. A restrictive policy dampening aggregate demand in this respect will make it more difficult for firms to pass through higher costs. The combination of sticky (services) inflation, a resilient labour market and at the same time a loosening of financial conditions makes Schnabel conclude that the ECB should be patient and cautious, even more as recent activity data (PMI’s) suggest that the peak of policy transmission might have passed. Schnabel’s well-founded analysis maybe helped to put a floor to yesterday’s retracement in yields. However, moves in interest rate markets still are limited on both side of the Atlantic. Both US and EMU yields add 1-2 bps across the curve before paring gains again amid intensifying worries in the US regional bank saga. Later today, Fed governors Kugler, Collins, Barkin and Bowman still are scheduled to speak. Fed Kashkari in an interview with CNBC suggested that he currently considers 2-3 rate cut as appropriate. However, more than additional CB guidance, markets further out probably will be driven by confronting incoming inflation, and equally important, activity data against the well-flagged CB guidance. A record $42 bln sale of US Treasuries might give some insight on the supply-demand balance in the US bond market after recent cheapening later today. The absence of bond market volatility is helping equities to hold near recent peak levels or even touching new records The Eurostoxx 50 is trading marginally lower after touching a minor new multi-year top at the open this morning. The S&P 500 even opened at new all-time highs. For now, there are no spill-over effects from the tensions amongst some US regional banks toward the broader equity market. In FX, some softening after recent rally for now is the path of least resistance for the dollar. DXY is revisiting the 104 big figure. EUR/USD is drifting higher in the upper half of the 1.07 big figure (1.0775) after a twice rejected test of the 1.0724 December low. Still the picture for the EUR/USD pair remains fragile/unconvincing. Sterling remains in good shape outperforming (admittedly slightly) the dollar (cable again north of 1.26) and the euro (EUR/GBP 0.853).
News & Views
EUR/HUF rises towards 388 in a move that shows the Hungarian forint clearly underperforming regional peers today. HUF came under pressure in early European dealings before extending losses after the European Union launched a new legal procedure against Hungary. The Commission today sent a letter of formal notice as a first step that could potentially lead to a lawsuit. Hungary has two months to reply. At the heart of the issue is the country’s Defence of National Sovereignty legislation, granting a newly created agency the power to probe organizations (including political parties, non-governmental organizations and the media) for possible violations of national sovereignty. The EC on its website underpinned the move by saying that “the Hungarian legislation at stake violates several provisions of primary and secondary EU law, among others the democratic values of the Union; the principle of democracy and the electoral rights of EU citizens; several fundamental rights enshrined in the EU Charter of Fundamental Rights […]; the requirements of EU law relating to data protection and several rules applicable to the internal market.” The new infringement procedure adds another layer of doubt to the disbursement of some €21bn in funds that are currently withheld. It’s also likely to anger president Orban, who only recently backed down on its opposition for additional Ukraine aid.
The Belgian Debt Agency successfully launched the new 30-y June 2055 OLO 101 bond. The syndicated sale printed €5bn at OLO+4 compared to initial guidance of OLO+7 area. Books were reported in excess of €62bn. Combined with the 10-y syndication in January (raising €7bn), the Debt Agency has completed about 30% of this year’s total OLO funding need (€41bn). Based on the 2024 funding plan, the BDA has one more syndicated sale in store for this year. The final one will have a medium term maturity of five or six years.
EUR/USD Mid-Day Outlook
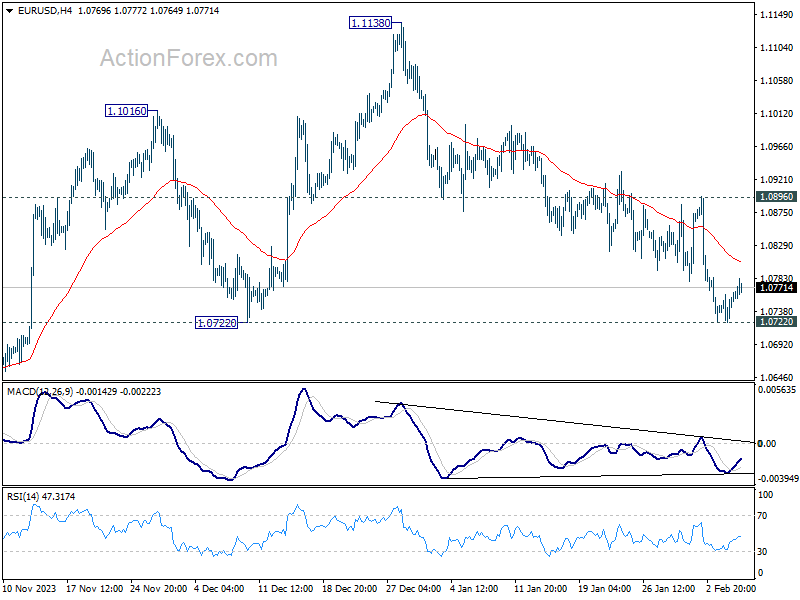
Daily Pivots: (S1) 1.0731; (P) 1.0746; (R1) 1.0770; More...
No change in EUR/USD's outlook and intraday bias stays neutral. Focus remains on 1.0722 structural support. Decisive break there will argue that whole rise from 1.0447 has completed. Deeper fall would then be seen to target this low. On the upside, break of 1.0896 resistance is needed to indicate short term bottoming. Otherwise, risk will stay on the downside in case of recovery.
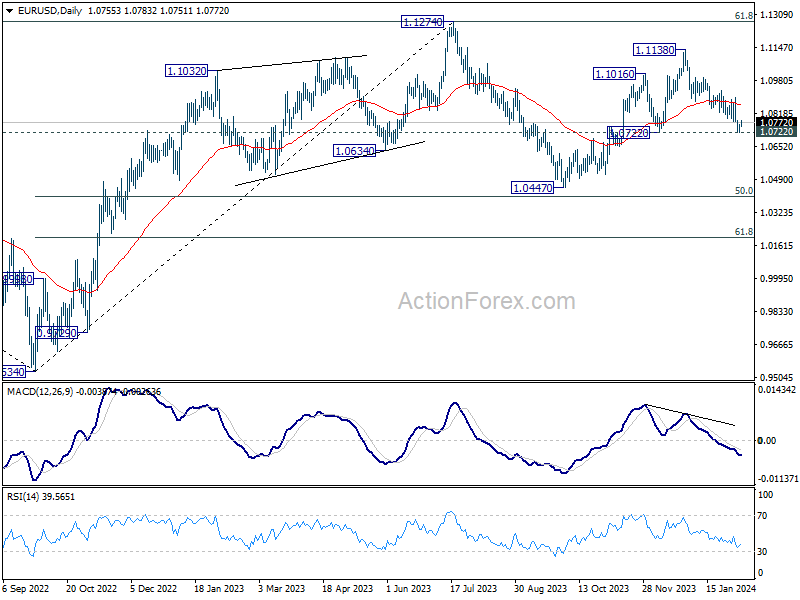
In the bigger picture, price actions from 1.1274 are viewed as a corrective pattern to rise from 0.9534 (2022 low). Rise from 1.0447 is seen as the second leg. While further rally could cannot be ruled out, upside should be limited by 1.1274 to bring the third leg of the pattern. Meanwhile, sustained break of 1.0722 support will argue that the third leg has already started for 1.0447 and possibly below.
GBP/USD Mid-Day Outlook
Daily Pivots: (S1) 1.2551; (P) 1.2577; (R1) 1.2624; More...
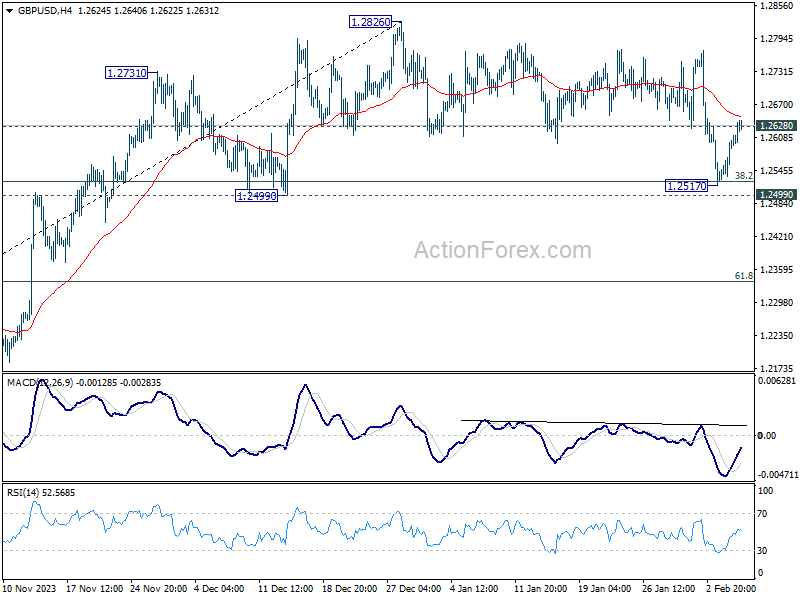
GBP/USD's break of 1.2628 minor resistance argues that correction from 1.2826 might have completed with three waves down to 1.2517. That came just ahead of 1.2499 structural support. Intraday bias is back on the upside for stronger rebound back towards 1.2826. On the downside, however, decisive break of 1.2499 will argue that whole rise from 1.2036 has completed and turn near term outlook bearish.
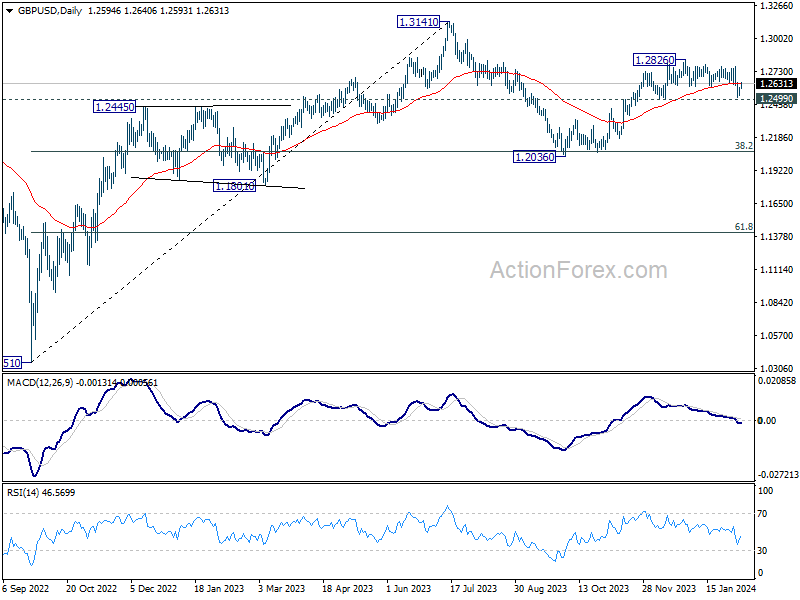
In the bigger picture, price actions from 1.3141 medium term top are seen as a corrective pattern to up trend from 1.0351 (2022 low). Rise from 1.2036 is seen as the second leg that's still in progress. Upside should be limited by 1.3141 to bring the third leg of the pattern. Meanwhile, break of 1.2499 support will argue that the third leg has already started for 38.2% retracement of 1.0351 (2022 low) to 1.3141 at 1.2075 again.
USD/CHF Mid-Day Outlook
Daily Pivots: (S1) 0.8678; (P) 0.8710; (R1) 0.8729; More....
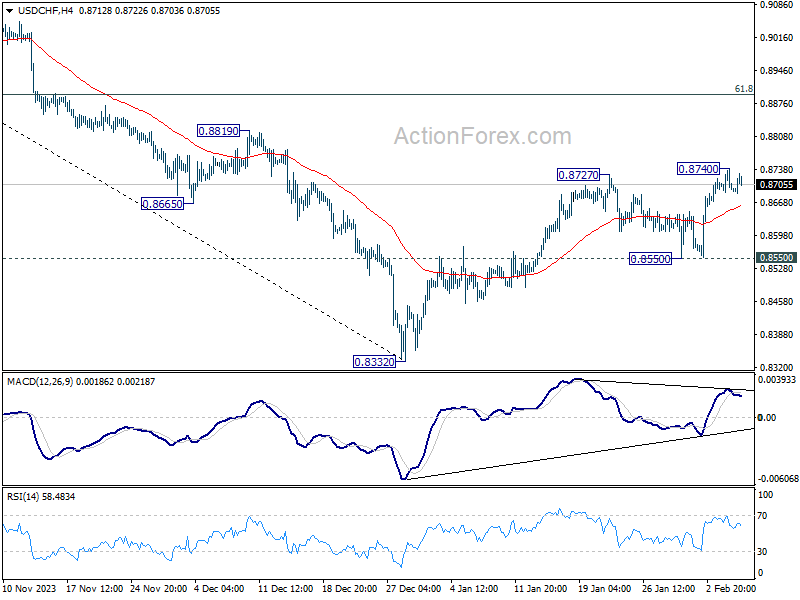
Intraday bias in USD/CHF remains neutral for the moment. With 0.8550 support intact, further rally is still expected. On the upside, break of 0.8740 will resume the rebound from 0.8332 to 61.8% retracement of 0.9243 to 0.8332 at 0.8995 next.
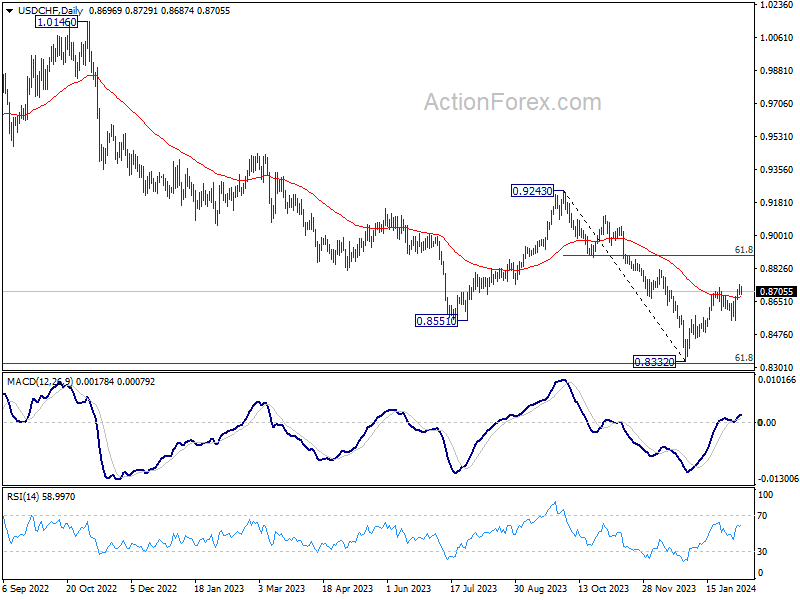
In the bigger picture, there is prospect of medium term bottoming at 0.8332 considering possible bullish convergence condition in W MACD, and the support from 0.8317 long term fibonacci support. Sustained trading above 55 D EMA (now at 0.8672) will affirm this case, and bring stronger rise back towards 0.9243 resistance, even as a corrective move.
USD/JPY Mid-Day Outlook
Daily Pivots: (S1) 147.58; (P) 148.19; (R1) 148.55; More...
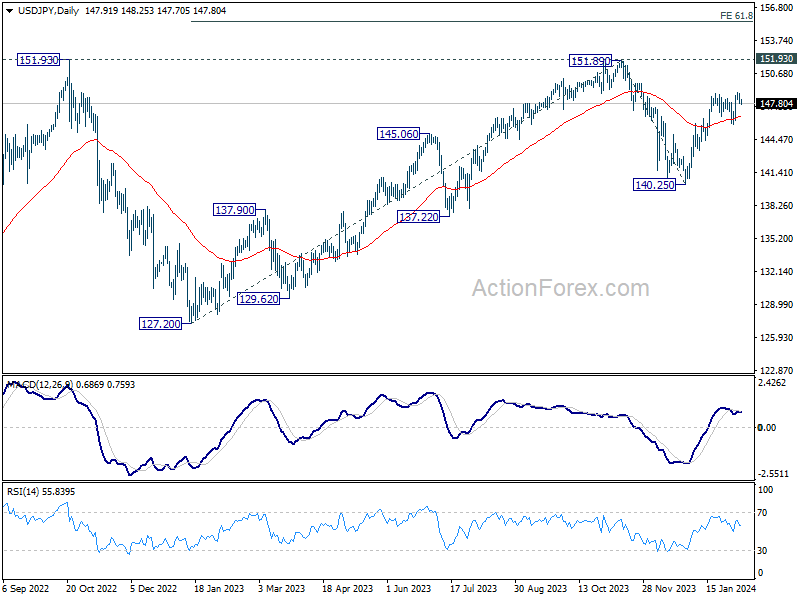
Intraday bias in USD/JPY remains neutral for the moment, and outlook is unchanged. Focus remains on 148.79 resistance. Firm break there will resume the rally from 140.25 to 151.89/93 key resistance zone. For now, further rise will remain in favor as long as 145.88 holds, in case of retreat.
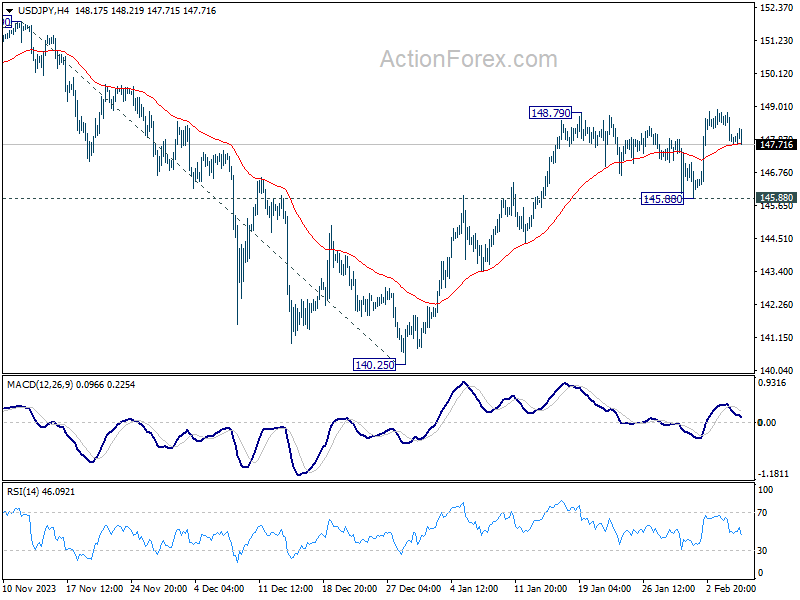
In the bigger picture, fall from 151.89 is seen as a correction to the rally from 127.20, which might have completed at 140.25 already. Firm break of 151.89/93 resistance zone will confirm up trend resumption next target will be 61.8% projection of 127.20 to 151.89 from 140.25 at 155.50. This will now remain the favored case as long as 140.25 support holds.
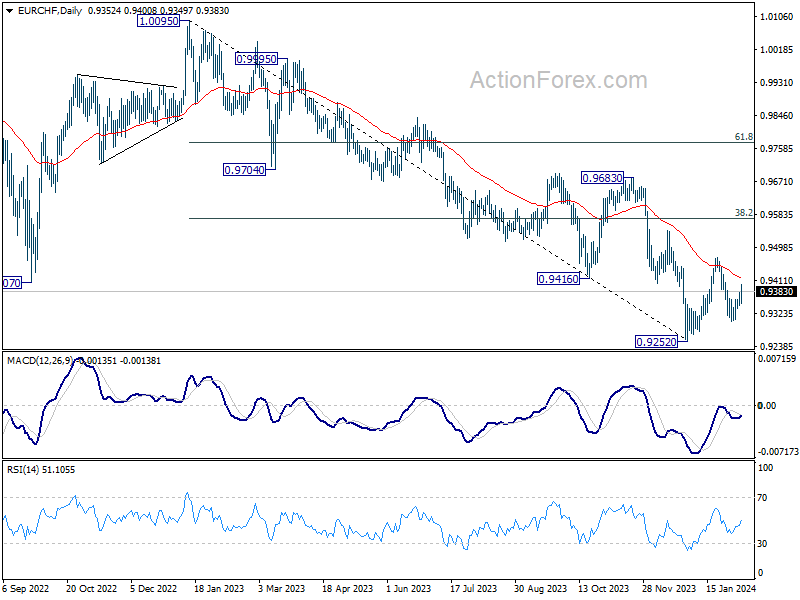
EUR/CHF Mid-Day Outlook
Daily Pivots: (S1) 0.9340; (P) 0.9361; (R1) 0.9375; More...
Intraday bias in EUR/CHF stays mildly on the upside for the moment, as rebound from 0.9304 extends today. As noted before, pullback from 0.9471 could have completed at 0.9304 already. Rise from there would extend to 0.9471 resistance first. On the downside, break of 0.9337 will delay this bullish case, and bring another decline. But still, downside should be contained above 0.9252 low to bring rebound.
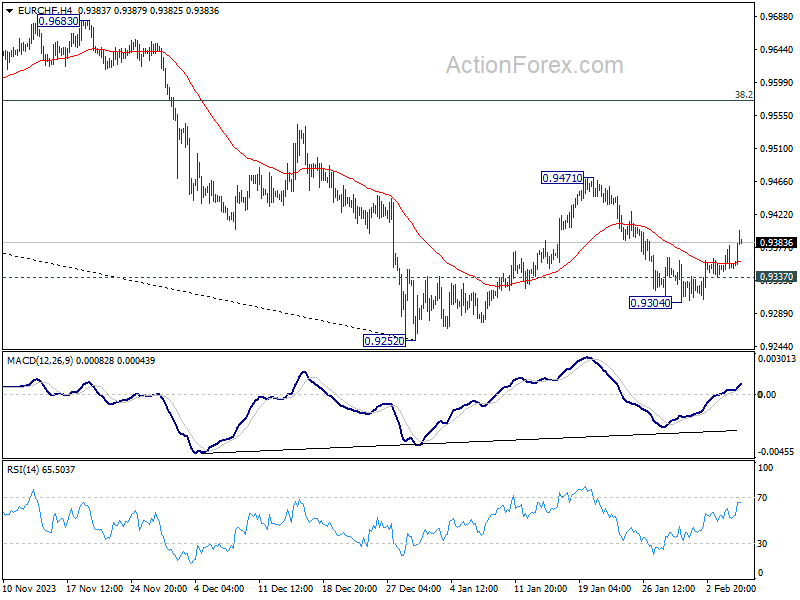
In the bigger picture, price actions from 0.9252 are tentatively seen as a correction to the five-wave down trend from 1.0095 (2023 high). Further rise would be seen to 38.2% retracement of 1.0095 to 0.9252 at 0.9574. But overall medium term outlook will remain bearish as long as 0.9683 resistance holds.