

Sample Category Title
A Modest Sliver Lining for China and Hong Kong Stock Markets
- China’s CPI continued to deflate in January to -0.8% y/y from -0.3% y/y in December 2023 while the pace of contraction has slowed slightly in PPI (factory gate prices) to -2.5% y/y from -2.7% y/y in December.
- The spread of PPI over CPI has widened which in turn may see a turnaround in the current negative profitability growth rate of China’s industrial enterprises.
- Technical analysis suggests the minor countertrend rally in the Hang Seng Index may extend.
Since the start of this week, the China and Hong Kong stock markets have rallied after one of the benchmark China stock indices sank to a 5-year low due to more forceful measures that clamped down on short-selling activities and President Xi’s in-person meeting with the China Securities Regulatory Commission that led to the intermediate replacement of the regulator party chief yesterday, 7 February.
The involvement of President Xi, the pinnacle of China’s top policymakers in an attempt to stop the rout that has wiped out close to US$7 trillion in market capitalization of the China and Hong Kong stock markets since the highs in 2021; has sent a potential signal to the markets that a stock market stabilization fund is likely to be announced soon after an idea of it backed by a fund size of US$278 billion from offshore accounts of Chinese state-owned enterprises was floated two week ago.
The benchmark CSI 300 Index has gained by +4.6% week-to-date as of 8 February at this time of the writing, similar positive movements are seen in the Hong Kong benchmark stock indices as well over the same period; Hang Seng Index (+2.6%), Hang Seng TECH Index (4.5%), and Hang Seng China Enterprises Index (+3.1%).
Previous attempts to shore up investors’ confidence over the past 12 months via piecemeal stimulus and policies have failed to enact sustainable bullish movements in the China and Hong Kong stock benchmark indices other than several bouts of “dead cat bounces”.
A silver lining within the deflationary forces
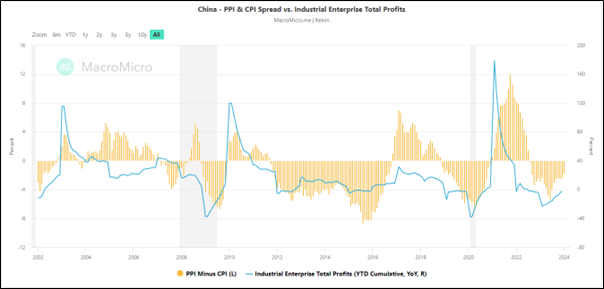
Fig 1: China PPI/CPI spread with Industrial Enterprise Total Profits as of Jan 2024 (Source: MacroMicro, click to enlarge chart)
Can this time round be different? The answer lies with the crux of the problem, the heightened deflationary risk spiral via the wealth effect destruction from a persistently weak property market in China.
No doubt, the latest data has indicated further weakness in consumer prices where the monthly CPI inflation rate for January has further decelerated in the negative territory to -0.8% y/y from -0.3% y/y in December 2023, its longest stretch of contraction since October 2009, and below consensus of -0.5% y/y.
On a slightly positive note, China’s producer prices have continued to fall for the 16th consecutive month but at a slower pace where PPI for January came in at -2.5% y/y, above -2.7% y/y in December, and consensus of -2.6% y/y, notching its softest drop in four months.
Given the slower pace of contraction in PPI, the spread between PPI and CPI has widened significantly in the past six months to -1.70 in January from -3.10 printed in August 2023.
This spread can be used as a proxy to measure the profitability of China’s industrial enterprises. A widening of the spread below zero is likely to indicate some form of recovery or turnaround in the current negative profitability growth of industrial enterprises. The cumulative Industrial Enterprise Total Profits y/y trend has indeed shown modest signs of recovery in the past six months; improving from -15.50% y/y recorded in July 2023 to -2.30% y/y in December 2023 (see Fig 1).
If the spread of PPI and CPI continues to widen, it may reduce the current bout of deflationary forces which in turn ignite more confidence in the stock market that potentially led to more pronounced countertrend rallies.
That said, consumer and business sentiment in China also needs to improve significantly to inspire major multi-month bullish trends to kickstart in the China and Hong Kong stock markets where the required catalysts are direct fiscal stimulus measures to boost spending which are lacking at this juncture.
Minor countertrend rally may extend in Hang Seng Index
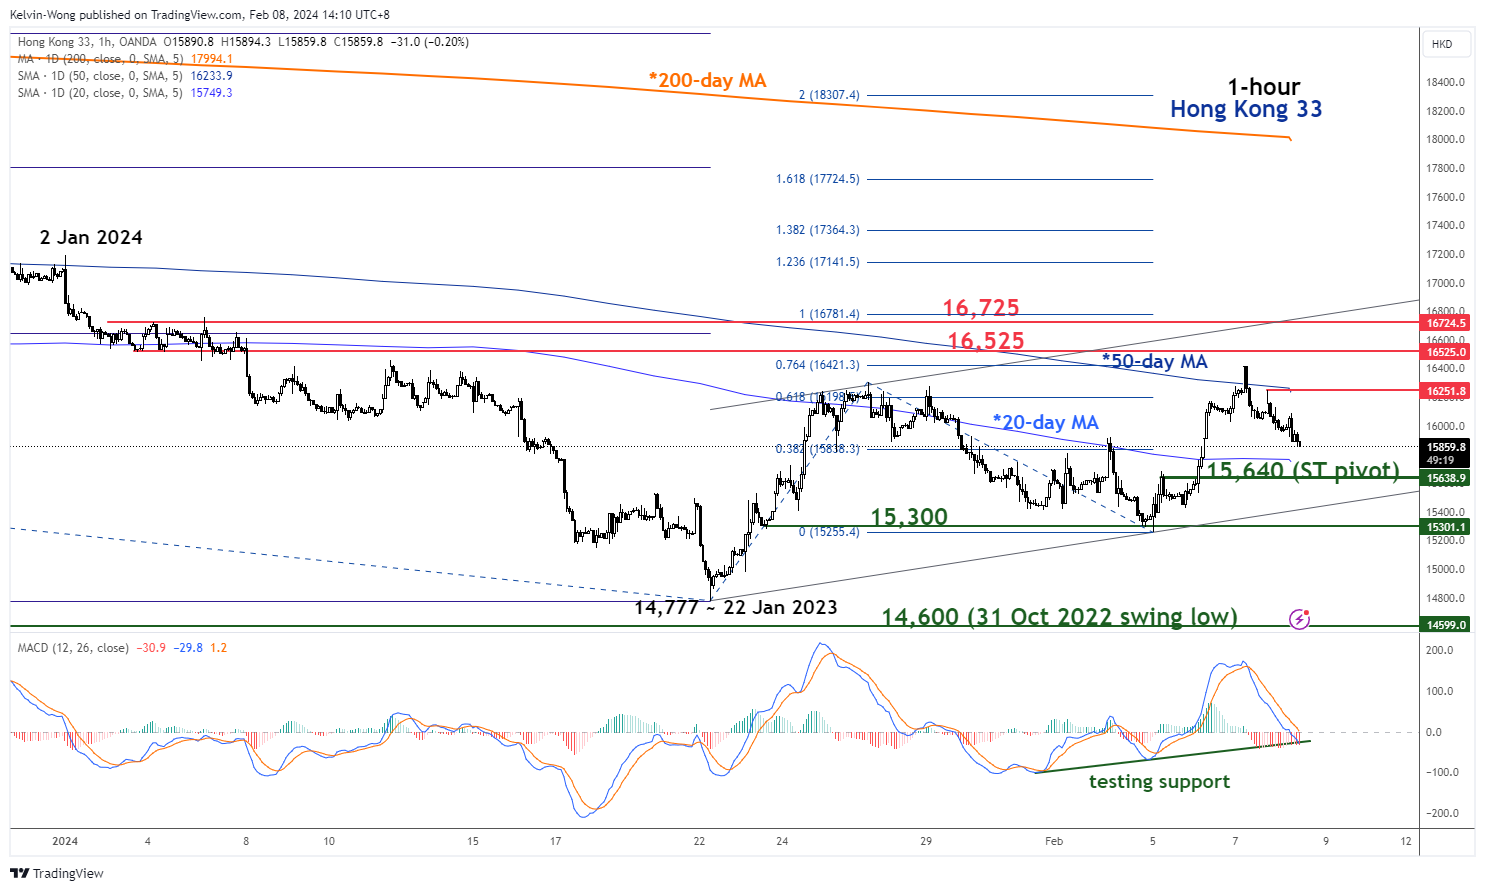
Fig 2: Hong Kong 33 short-term trend as of 8 Feb 2024 (Source: TradingView, click to enlarge chart)
The price actions of the Hong Kong 33 Index (a proxy of the Hang Seng Index futures) have shed -3.5% in the past session from an intraday high of 16,420 printed yesterday, 7 February.
There are still several positive short-term technical elements to note; the current price action of the Index is still oscillating above its 20-day moving average, and the hourly MACD trend indicator has dipped down to retest its ascending support which in turn may translate into a bullish inflection for price actions.
Watch the 15,640 key short-term pivotal support (close to the 20-day moving average & 61.8% Fibonacci retracement of the prior minor rally from the 5 February low to 7 February high) and clearance above the near-term resistance of 16,250 (also the 50-day moving average) may see the next intermediate resistance coming in at 16,525/16,725 (upper boundary of the minor ascending channel from 22 January low & 4/5 January minor swing highs area).
However, failure to hold at 15,640 invalidates the bullish tone for a further slide to expose the next intermediate support at 15,300. Failure to hold at 15,300 increases the risk of a retest on the major support of 14,600.
SP 500 Hits Record, Chinese Deflation Deepens
Hawkish comments from the Federal Reserve members continued to make the headlines in the US, yesterday, with Susan Collins, Thomas Barkin and a new Fed Governor Adriana Kugler, all saying the same exact thing: that there is no hurry for the US to cut the interest rates when the economic data points at such a surprising and historical resilience to the modern times’ most aggressive rate hikes.
But knowing that the Fed is done hiking its rates and the expectation that the next move from the Fed will be a rate cut is enough to keep the market in a sweet spot. A delay in the timing of the first rate cut is even perceived as a good thing: the US economy is doing so well that there is no urge to cut the rates right away. And that’s tant mieux for your corporate earnings.
This is how the US economy shrugs off the latest commercial real estate worries that cost the New York Community Bancorp more than half of its value. And even though the worries jumped to Germany’s Deutsche Pfandbriefbank, the stress is nowhere to be felt on the sovereign bond or index level. On the contrary, the US had a record-breaking auction for its 10-year bonds yesterday, where it sold $42bn worth of notes at a lower than anticipated yield. The strong demand for the US 10-year papers hints that investors continue to binge buy the US 10-year papers while sitting patiently in the waiting room and watching the major US indices’ record-breaking race to occupy themselves. You could think that the regional bank stress could bring the Fed to cut the rates earlier than otherwise, but that’s not necessarily what we sense in the market today, so I am sticking to my rate-cut expectation gun to explain why the US 10-year papers saw such a strong demand yesterday.
In Germany, the 10-year bund yield didn’t blink to Pfandbriefbank jitters, the DAX and the Stoxx 600 were down on Wednesday but the declines remained too soft to hint at panic, while the S&P500 renewed record and traded at a spitting distance from the 5000 psychological mark. That’s a powerful psychological milestone mind you, and it could trigger some profit taking due to the overbought market conditions and bubbling valuations. But the S&P500’s rally is backed by the anticipation of upcoming rate cuts and robust earnings. And sentiment in both yields and earnings remains supportive. In this respect, Disney followed in the footsteps of its happy tech peers yesterday and rose almost 7% in the afterhours trading after reporting better than expected earnings and issuing an upbeat profit outlook.
All’s well that ends well.
In the FX
The slowdown in the US sovereign selloff is weighing on the US dollar. The dollar index returned below its 100-DMA. The fact that central bankers around the world, like the ones in Europe and Australia, are also pushing back on early rate cut expectations certainly play a role in dollar’s limited gains. In this context, the Reserve Bank of Australia (RBA) warned earlier this week that the bank could even think of tightening the financial conditions if inflation didn’t ease to levels that they consider being acceptable. The hawkish accompanying statement from the RBA helped the AUDUSD limit losses near the 65 cents level earlier this week. But the pair remains offered into the 100-DMA, and the morose inflation figures from China don’t help cheer up the bulls.
Oh, China
China announced this morning that deflation accelerated in January to -0.8% y-o-y, faster than a 0.5% deflation penciled in by analysts and the fastest price drop in over 14 years. In plain English, it means that the Chinese efforts to boost growth and bring inflation back are not working according to the plan. Money poured into the Chinese system doesn’t circulate in a way to stimulate economy – blame people who lost confidence – and the radical measures that the government has put in place to prop up equity valuations hardly help China’s battered stock markets to get back on their feet. Today, sentiment in the CPI 300 index is mixed. I was writing yesterday that a deeper than expected deflation number will certainly encourage Chinese authorities to announce more stimulus measures. But measures alone won’t help getting the Chinese markets’ heads above water if investors don’t play along.
Another worry about the Chinese recovery is that because the Chinese dream has been dashed by a $7 trillion selloff in the equity markets, many could be tempted to take their loss and walk away in the slightest recovery. In summary, the road to a sustainable recovery seems far away.
Zooming in, Alibaba missed the opportunity to break above its down-trending channel that has been building since last August as its shares dived 6% after its sales missed expectations in the latest Q4 report. The latter offset a $25bn buyback program that the company has just announced. Alibaba’s price chart over the past 5 years is the best summary of how things went down for Chinese equities as Xi-led government was busy beating their tech gems with baseball bats, imposing absurd covid zero rules, and getting both the Chinese consumers and foreign investors on their back. Here we are today, waiting for more measures to cheer us up.
Chinese Inflation Still Negative
In focus today
- We have a light schedule on for today.
- In the US we receive initial jobless claims.
- The central bank of the Czech Republic announces its policy decision. A Reuters poll expects a 25bp cut in the repo rate to 6.50% from 6.75%.
- In Sweden, Governor Thedéen from the Riksbank will be speaking at a closed event. Deputy Governor Per Jansson will visit London and give a lecture on the economic situation and current monetary policy.
- Fed's Barkin will be speaking twice, at 14.30 CET and 18.05 CET.
Economic and market news
What happened overnight
In China, we received both CPI and PPI data for January. The numbers showed Chinese consumer prices fell by 0.8% y/y (expectations: -0.6% y/y). That marks the fourth month in a row with a negative print y/y. The negative Chinese inflation is however to a large degree driven by lower food prices (food prices were down 5.9% y/y in January). We thus see that core CPI (CPI ex food and energy) remains in positive territory at 0.4% y/y. Hence, we do not see any broad-based deflation in China. The lower food prices are also helpful in terms of stimulating Chinese private consumption, as they ease living costs and improve purchasing power for Chinese consumers. Producer prices fell 2.5% y/y in January (prior: 2.7% y/y).
In Japan, the deputy governor of the Bank of Japan Shinchi Uchida said the BoJ would likely end its risky assets purchases, as part of unwinding its monetary support scheme. He stressed however that beyond putting an end to its negative interest rate (which currently stand at -0.1%), he did not see the BoJ raising rates rapidly if its inflation target of 2% was otherwise met. JPY weakened a bit on the back of this. We still view the spring wage negotiations as key for the development in Japanese inflation, and as such Japanese monetary policy.
What happened yesterday
In Germany, industrial production declined 1.6% m/m compared to consensus expectations of -0.5% m/m. Given the already released German GDP numbers showing the economy contracted 0.3% q/q in Q4 2023 the contraction in industrial production is not surprising. The data however shows German industry was a growth drag in the economy towards the end of 2023.
Israeli premier Benjamin Netanyahu declined a proposed ceasefire deal which US secretary of state Anthony Blinken who arrived in Israel Wednesday had tried to secure. Netanyahu was cited for calling Hamas' demands "delusional" as well as saying "total victory" was achievable within months.
In Sweden, we got the Riksbank's minutes which mostly confirmed what was said at the monetary update last week. Several board members were open to a cut in H1 2024 depending on the development of inflation and the real economy. However, the minutes highlighted somewhat more any risks than in the official statement; namely worries about inflation risks that a new weakening of the SEK could pose, and the currently too alleviated price plans were mentioned as well. There were also some indications of caution to cut before big central banks given risks to the exchange rate. They highlighted the importance of cutting cautiously which matches well with our forecast.
The Polish central bank kept its base rate unchanged at 5.75% in line with expectations.
Equities: Global equities were higher yesterday primarily lifted by US large cap stocks. There was no major top-down news to move the market and we were not surprised to see the market drifting higher and VIX sliding in yesterday's session since the sum of macro, monetary policy and earnings news has been rather positive for stocks lately. One obstacle for equities is the reemerged fear of CRE-related losses for banks in the US and not least regional banks. That was also the case yesterday with a 3% intraday swing in the KBW index (US regional banks). In US yesterday: Dow +0.4%, S&P 500 +0.8%, Nasdaq +1.0%, Russell 2000 -0.2%. Asian equities mostly higher this morning with Japan up more than 2% and hence continuing the strong run back by a weak currency. Futures marginally higher in Europe while mixed in the US.
FI: Wednesday was yet another quiet session without any major news out. Long-end UST yields drifted higher through most of the session but ended unchanged as the refunding auction in the 10Y tenor (USD42bn) saw very decent demand (bid-to-cover: 2.56). Today, focus will turn to the USD25bn offered at the 30Y auction. The German curve bear steepened slightly as Schnabel's FT interview, where she explicitly warns against the still present upside risks to Eurozone inflation, led to renewed moderation of rate cut expectations in markets. In just one week, the pricing of ECB rate cuts for 2024 has declined from 150bp to 125bp. Our base case is still 75bp.
FX: Risk-on as S&P500 closes in on its 5,000 milestone, with EUR/USD gradually edging higher throughout the session. Scandies sideways, with a slight tilt lower for NOK/SEK which now sits below 0.99 once again. USD/JPY remains above 148 as JPY continues to struggle.
GBP/JPY Daily Outlook
Daily Pivots: (S1) 186.45; (P) 186.86; (R1) 187.53; More...
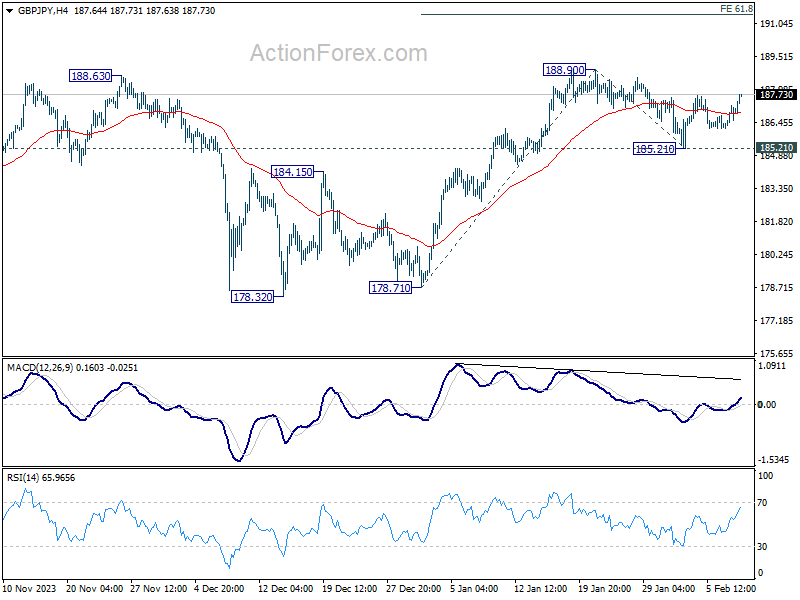
Intraday bias in GBP/JPY is back on the upside as rebound from 185.21 resumes. Further rise is expected to retest 188.90 resistance first. Firm break there will resume larger up trend. Next near term target will be 61.8% projection of 178.71 to 188.90 from 185.21 at 191.50. For now, near term outlook will stay bullish as long as 185.21 support holds, in case of retreat.
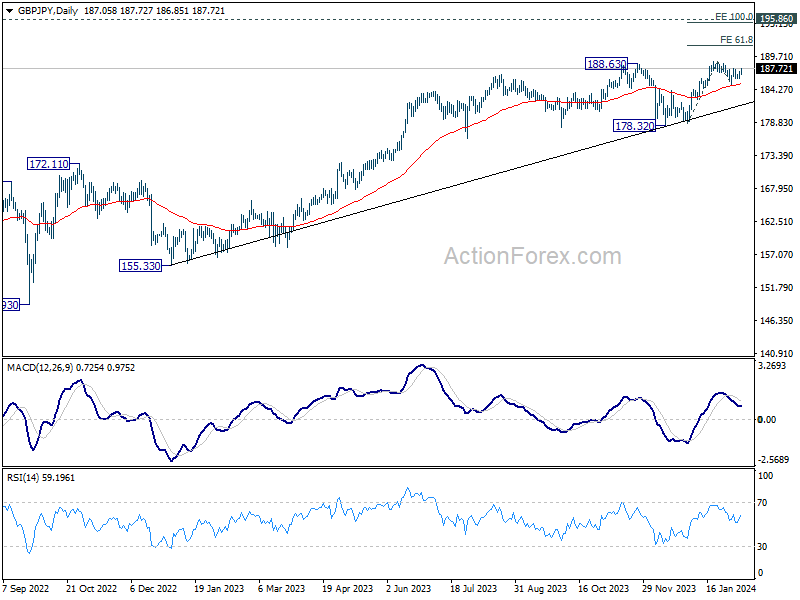
In the bigger picture, up trend from 123.94 (2020 low) is in progress. Medium term outlook will stay bullish as long as 178.32 support holds. Next target is 195.86 long term resistance (2015 high).
Yen Weakens Amid BoJ’s Dovish Signals, S&P 500 Poised to Break Through 5000 Milestone
Japanese Yen declines broadly in today's Asian session, reacting to dovish remarks made by BoJ Deputy Governor. The official's commentary emphasized a cautious approach to monetary tightening, highlighting that even with exit from negative interest rate policy, the pace of interest rate hikes would remain measured.
This outlook, especially the suggestion that inflation could stabilize around the 2% target without prompting rapid policy adjustments, has contributed to Yen's downward trajectory, setting the stage for further depreciation against major currencies in the coming days.
Nevertheless, Yen's performance will still hinge on the movements of benchmark treasury yields in US and Europe.
At the same time, Australian and New Zealand Dollars weakened. This regional currency softness comes at a time when Chinese stock market is set to close for Lunar New Year holidays, pausing trading activities until February 18.
Instead of introducing concrete market supporting measures as rumored, China announced a notable change in leadership at the Securities Regulatory Commission. Yi Huiman, the outgoing chair, will be succeeded by Wu Qing, vice mayor of Shanghai during the stringent 2022 lockdown. Wu is also know for his strict regulation of traders that have earned him the moniker "Broker Butcher."
Elsewhere in the market, Swiss Franc is making a modest recovery after yesterday's selloff, while Euro and Sterling maintain their strength, as near term rebound continued. Canadian Dollar is also showing firmness, contrasting with the mixed performance of Dollar.
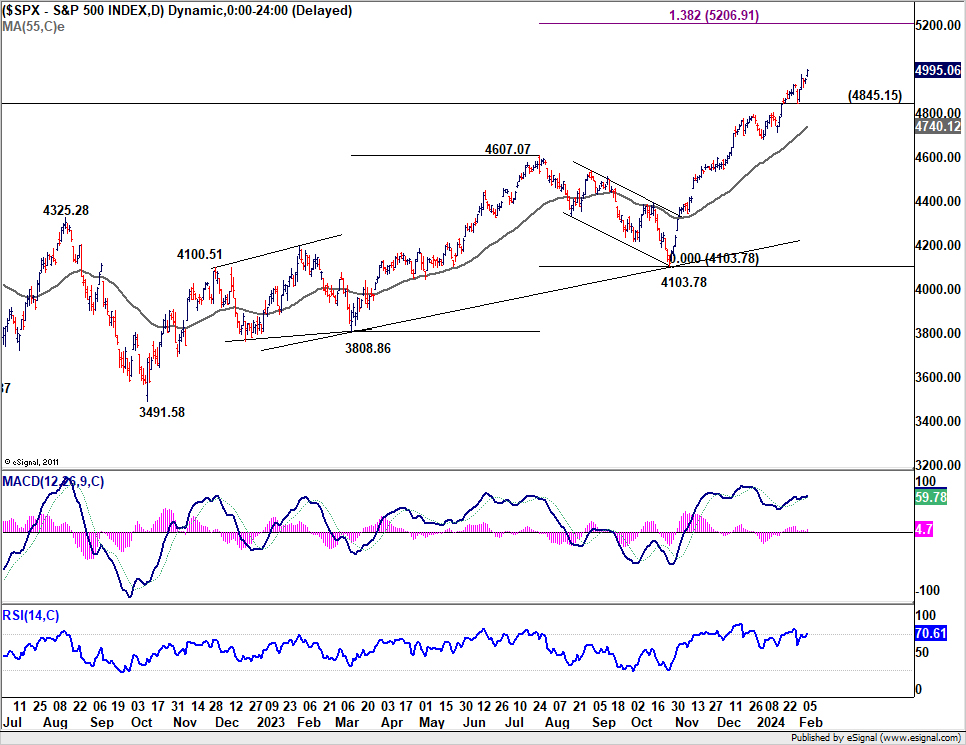
S&P 500 hit another record high overnight despite persistent comments from Fed officials advocating patience regarding rate cuts. Immediate focus will be on 5000 psychological level now. Sustained break there will pave the way to 138.2% projection of 3808.86 to 4607.07 from 4103.78 at 5206.91. In any case, near term outlook will stay bullish as long as 4845.15 support holds.
In Asia, Nikkei rose 2.15. Hong Kong HSI is down -1.16%. China Shanghai SSE is up 1.05%. Singapore Strait Times is down-0.21%. Japan 10-year JGB yield is down -0.0077 at 0.702. Overnight, DOW rose 0.40%. S&P 500 rose 0.82%. NASDAQ rose 0.95%. 10-year yield rose 0.020 to 0.411.
BoJ's Uchida signals no swift hikes after negative rate ends
In a speech today, BoJ Deputy Governor Shinichi Uchida articulated a scenario where, despite an end to the negative interest rate policy, rapid interest rate hikes remain unlikely.
"Even if the Bank were to terminate the negative interest rate policy, it is hard to imagine a path in which it would then keep raising the interest rate rapidly," he stated, suggesting a gradual adjustment process, while financial conditions wild remain "accommodative.
Uchida projected gradual increase in underlying inflation toward 2 percent target through fiscal 2025. This forecast anticipates core CPI (all items less fresh food) at 2.8% for fiscal 2023, with a subsequent moderation to 2.4% in fiscal 2024 and 1.8% in fiscal 2025.
Theses projections are based on the outlook that "while the pass-through of cost increases will continue to wane, prices such as of services will rise, accompanied by wage increases."
To achieve this economic outlook, Uchida emphasized, the virtuous cycle needs to intensify in both directions, from prices to wages and from wages to prices."
China's deepening deflation: CPI hits 14-year low in Jan
China's CPI took a notable dip in January, registering decrease of -0.8% yoy, marking a significant deepening of deflationary pressures from the previous month's -0.3% and falling short of expectation -0.5% yoy. This downturn represents the fourth consecutive negative reading and the most substantial fall observed since 2009, over fourteen years ago.
The decline was particularly pronounced in food prices, which was down -5.9% yoy. Meanwhile, core CPI, which excludes volatile energy and food prices, rose by a modest 0.4% yoy, slowing from December's 0.6% yoy increase. Despite the annual downturn, CPI saw a slight month-on-month increase of 0.3%, albeit below the anticipated 0.4% growth.
The NBS attributed January's inflation figures to the high base effect associated with the Spring Festival, or Lunar New Year, which occurred in January the previous year. This annual holiday, which shifts between January and February depending on the lunar calendar, significantly impacts consumption patterns and inflation metrics due to its influence on consumer spending and business operations.
In parallel, PPI fell by -2.5% yoy in January, showing a modest improvement from the -2.7% yoy observed in the previous month and slightly better than -2.6% forecast. This marks the 16th consecutive month of annual declines for PPI, with factory-gate prices decreasing by -0.2% mom, following -0.3% mom drop in December.
Fed's Kugler highlights inflation risks stemming from consumer behavior, job market, and global tensions
In a speech overnight, Fed Governor Adriana Kugler said she's satisfied with the disinflationary progress, and expects it to "continue". However, she was quick to temper this optimism with a note of caution, emphasizing that Fed's work in combating inflation is far from over. The unpredictability of consumer behavior stands as a reminder of unforeseen developments to "slow progress on inflation."
Kugler also pointed to the recent employment report, which showed unexpected strength. While a strong labor market is generally a positive sign, in the context of Fed's efforts to cool inflation, such robustness could complicate the path to achieving a balanced demand-supply equation in both product and labor markets.
Fed Governor underscored the importance of monitoring geopolitical risks, particularly highlighting how the ongoing conflict in Ukraine and tensions in the Middle East could exacerbate inflationary pressures through "higher commodity prices" and global trade "disruptions", "in turn pushing up goods inflation in the US".
"At some point, the continued cooling of inflation and labor markets may make it appropriate to reduce the target range for the federal funds rate," she noted. Conversely, "if progress on disinflation stalls, it may be appropriate to hold the target range steady at its current level for longer to ensure continued progress on our dual mandate."
Fed's Collins: Sustained, broadening inflation progress needed before methodical policy relaxation
Boston Fed President Susan Collins emphasized the need for "sustained, broadening signs of progress" in inflation reduction before contemplating any "methodical" adjustments to interest rate policy.
"As we gain more confidence in the economy achieving the Committee's goals... I believe it will likely become appropriate to begin easing policy restraint later this year," she stated in a speech overnight.
She advocates for a gradual approach to interest rate adjustments, allowing for "flexibility to manage risks, while promoting stable prices and maximum employment."
Collins also highlighted the resilience of the US economy, as evidenced by recent GDP and labor market data, suggesting that the anticipated slowdown in economic activity "may take some time".
"The path the economy takes toward the Fed's mandated goals may continue to be bumpy and uneven, and we should not overreact to individual data points," she advised.
A critical factor in Collins's assessment is wage dynamics, with a specific interest in wage trends that align with long-term price stability. While acknowledging that not all economic indicators might perfectly converge, "seeing sustained, broadening signs of progress should provide the necessary confidence I would need to begin a methodical adjustment to our policy stance."
Fed's Barkin endorses patience regarding rate cuts
Richmond Fed President Thomas Barkin has voiced a call for patience concerning interest rate cuts, in the face of prevailing economic uncertainties.
"I am very supportive of being patient to get to where we need to get," Barkin articulated during an event overnight.
Barkin highlighted the ongoing efforts to combat inflation, acknowledging that while progress has been made towards balancing the trade-offs between economic growth and inflation control, "a reasonable amount of uncertainty" remains.
He pointed out that the inflationary challenges are not confined to goods alone but extend to services and rental sectors.
"Declaring victory is very enticing, but you're never going to hear me do that," Barkin asserted.
BoC cites difficulty in predicting appropriate timing of rate cuts
BoC's deliberations from the January meeting saw the governing council expressing that it was "difficult to foresee when it would be appropriate to begin cutting interest rates."
The possibility of additional rate hikes was not dismissed, with members indicating that such measures could be warranted should new inflationary surprises emerge. However, the focus of future policy discussions would likely "shift to how much longer to maintain the policy rate at 5% to sustain the disinflationary process."
Inflation's persistent high levels and broad impact have prompted the council to emphasize their ongoing concerns regarding "persistence of underlying inflation" in their communications.
The members collectively agreed on the necessity for "further evidence of progress toward price stability," seeking definitive signs of a downturn in core inflation rates.
To gauge the effectiveness of their monetary policy and the evolving economic landscape, the Governing Council plans to closely monitor core inflation alongside several critical indicators. These include the equilibrium between supply and demand within the economy, corporate pricing strategies, inflation expectations, and the ratio of wage growth to productivity.
Looking ahead
ECB monthly bulletin is the only feature in the European economic calendar. Later today, US will release jobless claims.
GBP/JPY Daily Outlook
Daily Pivots: (S1) 186.45; (P) 186.86; (R1) 187.53; More...
Intraday bias in GBP/JPY is back on the upside as rebound from 185.21 resumes. Further rise is expected to retest 188.90 resistance first. Firm break there will resume larger up trend. Next near term target will be 61.8% projection of 178.71 to 188.90 from 185.21 at 191.50. For now, near term outlook will stay bullish as long as 185.21 support holds, in case of retreat.
In the bigger picture, up trend from 123.94 (2020 low) is in progress. Medium term outlook will stay bullish as long as 178.32 support holds. Next target is 195.86 long term resistance (2015 high).
Economic Indicators Update
| GMT | Ccy | Events | Actual | Forecast | Previous | Revised |
|---|---|---|---|---|---|---|
| 23:50 | JPY | Bank Lending Y/Y Jan | 3.10% | 3.20% | 3.10% | 3.00% |
| 00:01 | GBP | RICS Housing Price Balance Jan | -18% | -28% | -30% | |
| 01:30 | CNY | CPI Y/Y Jan | -0.80% | -0.50% | -0.30% | |
| 01:30 | CNY | PPI Y/Y Jan | -2.50% | -2.60% | -2.70% | |
| 05:00 | JPY | Eco Watchers Survey: Current Jan | 50.2 | 50.3 | 50.7 | |
| 09:00 | EUR | ECB Economic Bulletin | ||||
| 13:30 | USD | Initial Jobless Claims (Feb 2) | 220K | 224K | ||
| 15:00 | USD | Wholesale Inventories Dec F | 0.40% | 0.40% | ||
| 15:30 | USD | Natural Gas Storage | -73B | -197B |
BoJ’s Uchida signals no swift hikes after negative rate ends
In a speech today, BoJ Deputy Governor Shinichi Uchida articulated a scenario where, despite an end to the negative interest rate policy, rapid interest rate hikes remain unlikely.
"Even if the Bank were to terminate the negative interest rate policy, it is hard to imagine a path in which it would then keep raising the interest rate rapidly," he stated, suggesting a gradual adjustment process, while financial conditions wild remain "accommodative.
Uchida projected gradual increase in underlying inflation toward 2 percent target through fiscal 2025. This forecast anticipates core CPI (all items less fresh food) at 2.8% for fiscal 2023, with a subsequent moderation to 2.4% in fiscal 2024 and 1.8% in fiscal 2025.
Theses projections are based on the outlook that "while the pass-through of cost increases will continue to wane, prices such as of services will rise, accompanied by wage increases."
To achieve this economic outlook, Uchida emphasized, the virtuous cycle needs to intensify in both directions, from prices to wages and from wages to prices."
Silver (XAGUSD) Looking to Extend Lower in Sideways Price Action
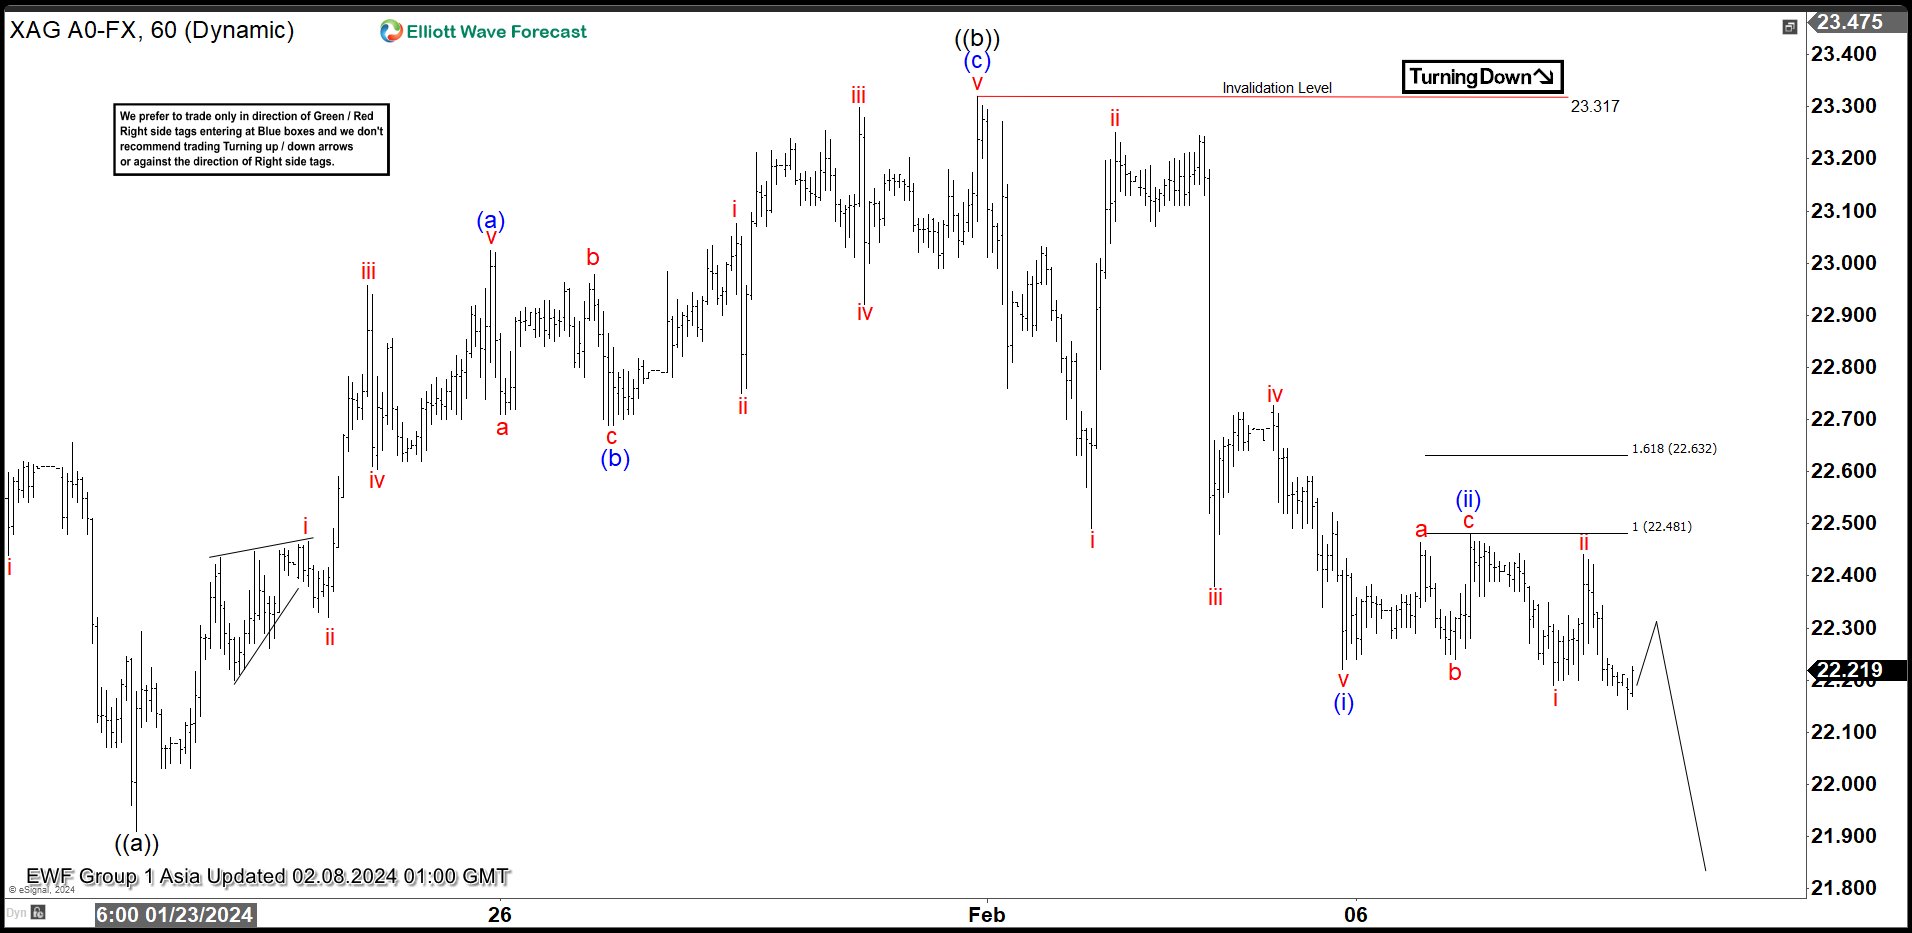
Short Term Elliott Wave view in Silver (XAGUSD) suggests that the metal has traded sideways since the low in August 2022. The short term 1 hour chart below shows the move down from 12.4.2023 high which takes the form of a double three Elliott Wave structure. Down from 12.4.2023 high, wave W ended at 22.49 and rally in wave X ended at 24.6. Wave Y lower is in progress as a zigzag structure. Down from wave X, wave ((a)) ended at 21.91 as the 1 hour chart below shows. Up from there, wave (a) ended at 23.02 and pullback in wave (b) ended at 22.68. Wave (c) lower ended at 23.31 which completed wave ((b)) corrective rally.
Wave ((c)) lower is in progress as a 5 waves impulse Elliott Wave structure. Down from wave ((b)), wave (i) ended at 22.22 and rally in wave (ii) ended at 22.48. The metal then extended lower in wave (iii). Near term, as far as pivot at 23.3 high stays intact, expect rally to fail in 3, 7, 11 swing and the metal to extend lower. Potential target lower is 100% – 161.8% Fibonacci extension from 12.4.2023 high. This area comes at 19.1 – 21.2 where buyers can appear for further upside or 3 waves rally at least.
XAGUSD 60 Minutes Elliott Wave Chart
Silver (XAGUSD) Elliott Wave Video
https://www.youtube.com/watch?v=DONxHAdd8kc
Technical Outlook and Review
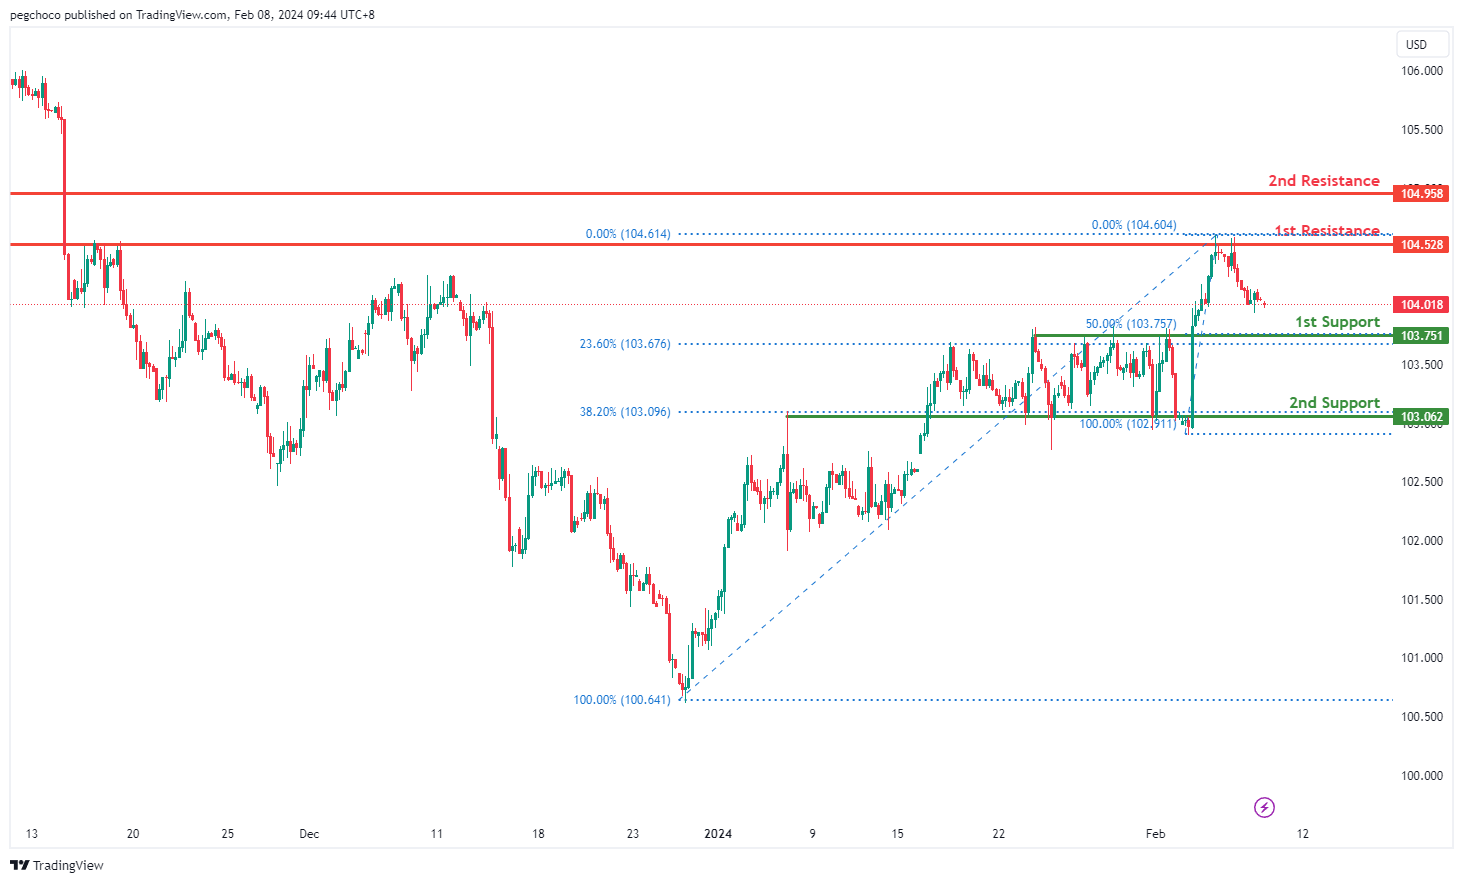
DXY:
The DXY chart currently indicates a bearish overall momentum, suggesting a downward trend. There’s a potential for a bearish continuation towards the 1st support level.
The 1st support at 103.73 is identified as a pullback support, with the presence of both the 50% and 23.60% Fibonacci Retracement levels, indicating Fibonacci confluence and strengthening its significance as a support level.
Furthermore, the 2nd support level at 103.06 is also recognized as a pullback support, coinciding with the 23.60% Fibonacci Retracement, further reinforcing its potential as a support zone.
On the resistance side, the 1st resistance level at 104.52 is categorized as an overlap resistance, suggesting its historical significance as a potential barrier for upward movement.
Similarly, the 2nd resistance at 104.95 is considered a pullback resistance, indicating its potential role in impeding further upward momentum.
EUR/USD:
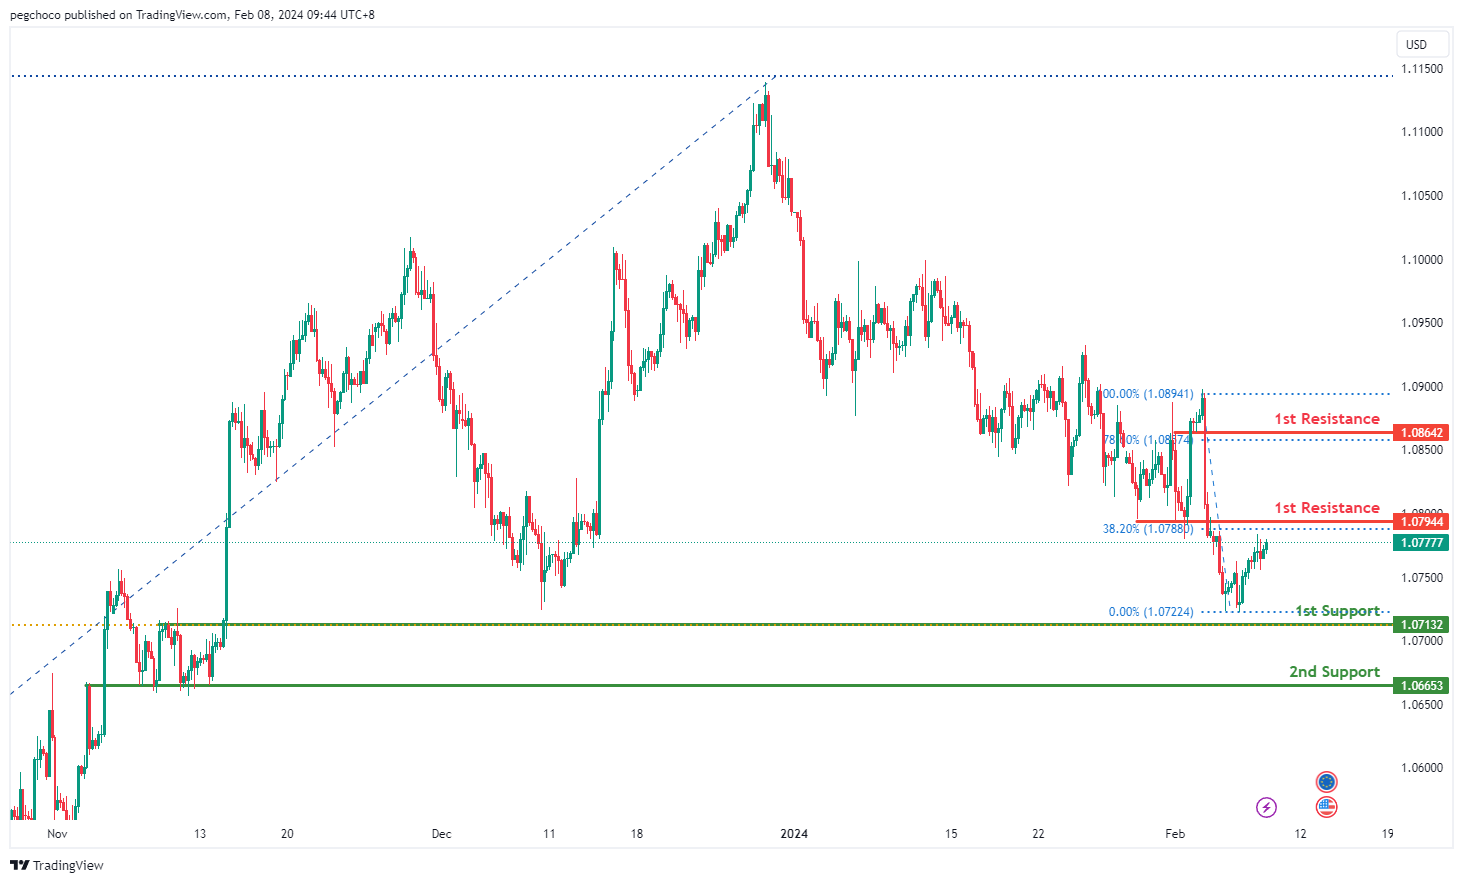
The EUR/USD chart currently demonstrates a bearish overall momentum, signaling a downward trend. There’s a potential for a bearish reaction off the 1st resistance level, leading to a drop towards the 1st support.
The 1st support at 1.0713 is identified as a pullback support, aligning with the 61.80% Fibonacci Retracement level, suggesting its significance as a potential support zone.
Additionally, the 2nd support level at 1.0665 is characterized as an overlap support, indicating its historical importance as a potential area where buying interest may emerge.
On the resistance side, the 1st resistance level at 1.0794 is categorized as an overlap resistance, coinciding with the 38.20% Fibonacci Retracement, suggesting its historical significance as a potential barrier for further upward movement.
Furthermore, the 2nd resistance at 1.0864 is identified as a pullback resistance, aligning with the 78.60% Fibonacci Retracement, indicating its potential role in impeding further upward momentum.
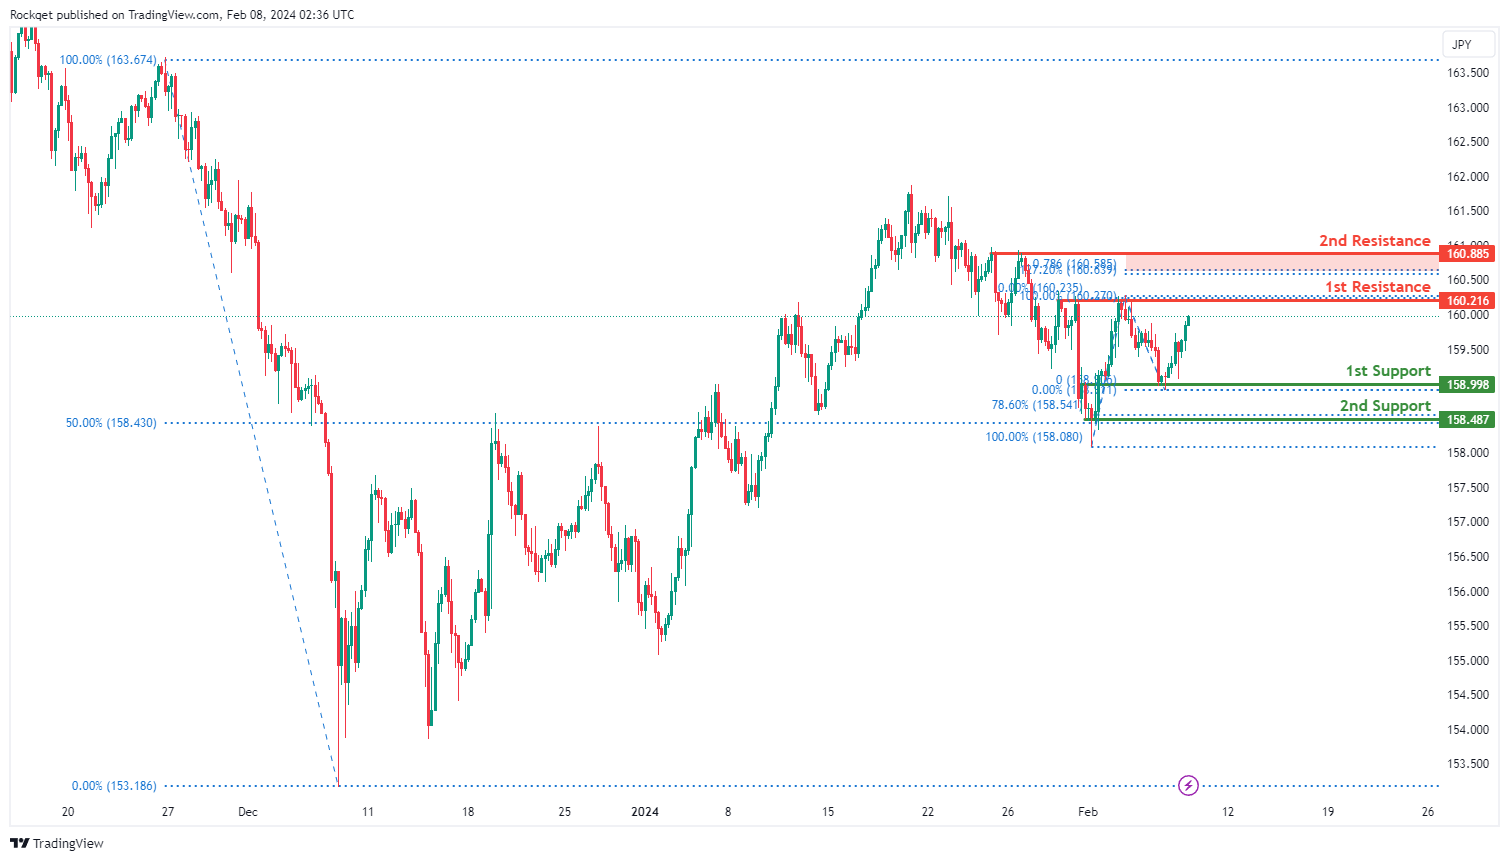
EUR/JPY:
The EUR/JPY chart currently exhibits a bullish momentum, indicating an upward trend. Several factors contribute to this bullish sentiment, including pullback and swing low supports, as well as key Fibonacci retracement levels.
The 1st support level at 158.998 is significant due to its alignment with a pullback support and the 78.60% Fibonacci Retracement level. This suggests that historical buying interest has emerged at this level.
Additionally, the 2nd support at 158.487 coincides with a swing low support and the 50% Fibonacci Retracement, adding further strength to the potential support zone.
On the resistance side, the 1st resistance level at 160.216 is highlighted as a point of potential selling pressure, representing a pullback resistance.
Furthermore, the 2nd resistance at 160.885 serves as another barrier to bullish continuation, aligning with a pullback resistance and the 78.60% Fibonacci Projection
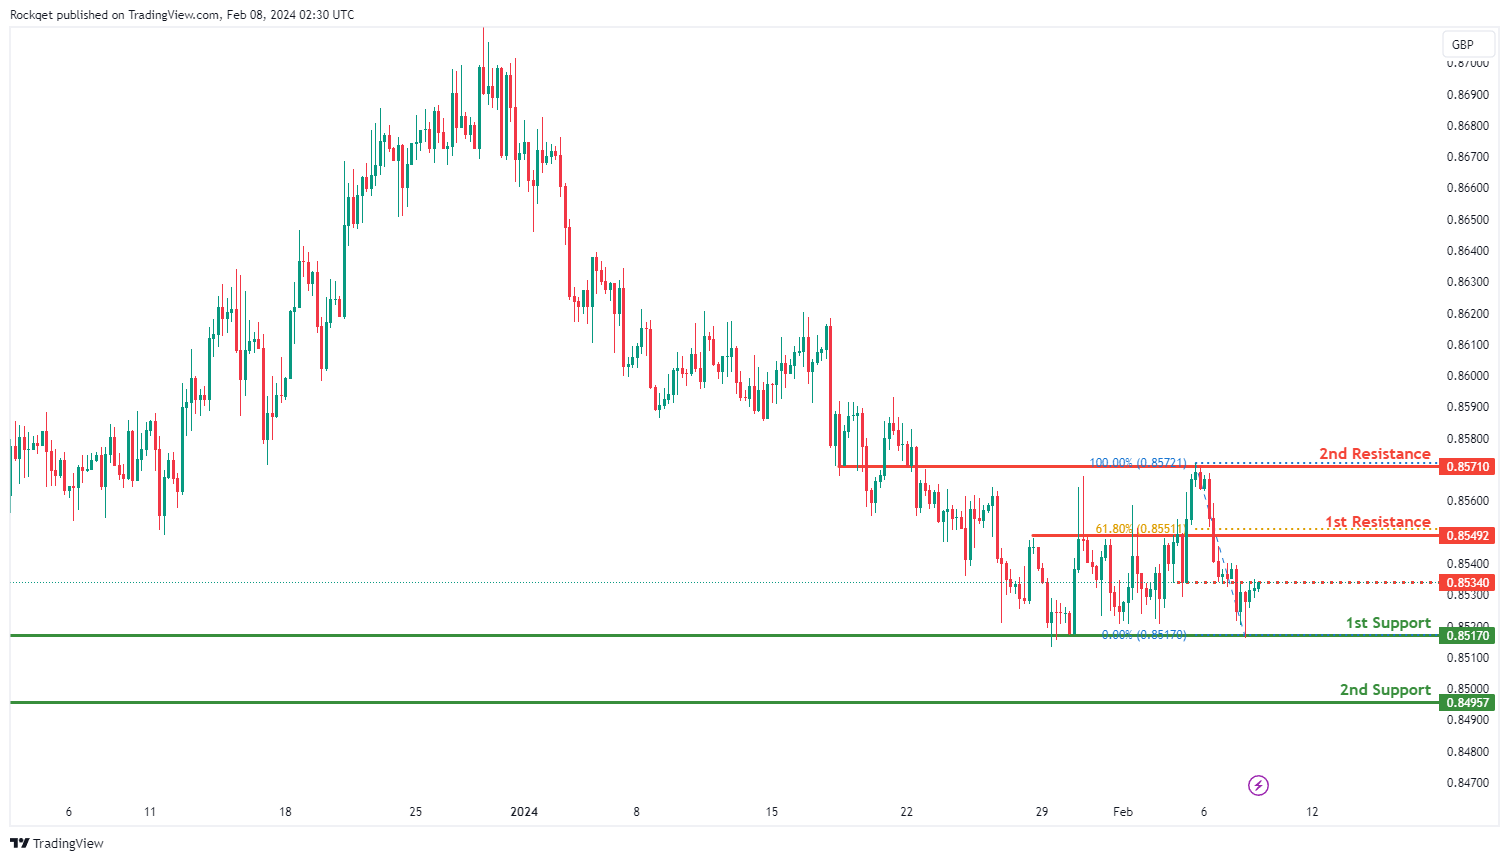
EUR/GBP:
The EUR/GBP chart currently shows a weak bullish momentum with low confidence, suggesting a tentative upward movement. Despite the cautious sentiment, there are key levels that may influence price action.
The 1st support at 0.85170 is notable as it represents a multi-swing low support, indicating a level where buying interest has previously emerged.
Additionally, the 2nd support at 0.84957 is recognized as an overlap support, further reinforcing its significance as a potential area of price support.
On the resistance side, the 1st resistance at 0.85492 is identified as a key level where selling pressure may arise, aligning with an overlap resistance and the 61.80% Fibonacci Retracement. This level could serve as a barrier to bullish momentum.
Furthermore, the 2nd resistance at 0.85710 is another noteworthy level, characterized by an overlap resistance. An intermediate resistance level at 0.85340 is also identified, representing another point where selling interest may intensify.
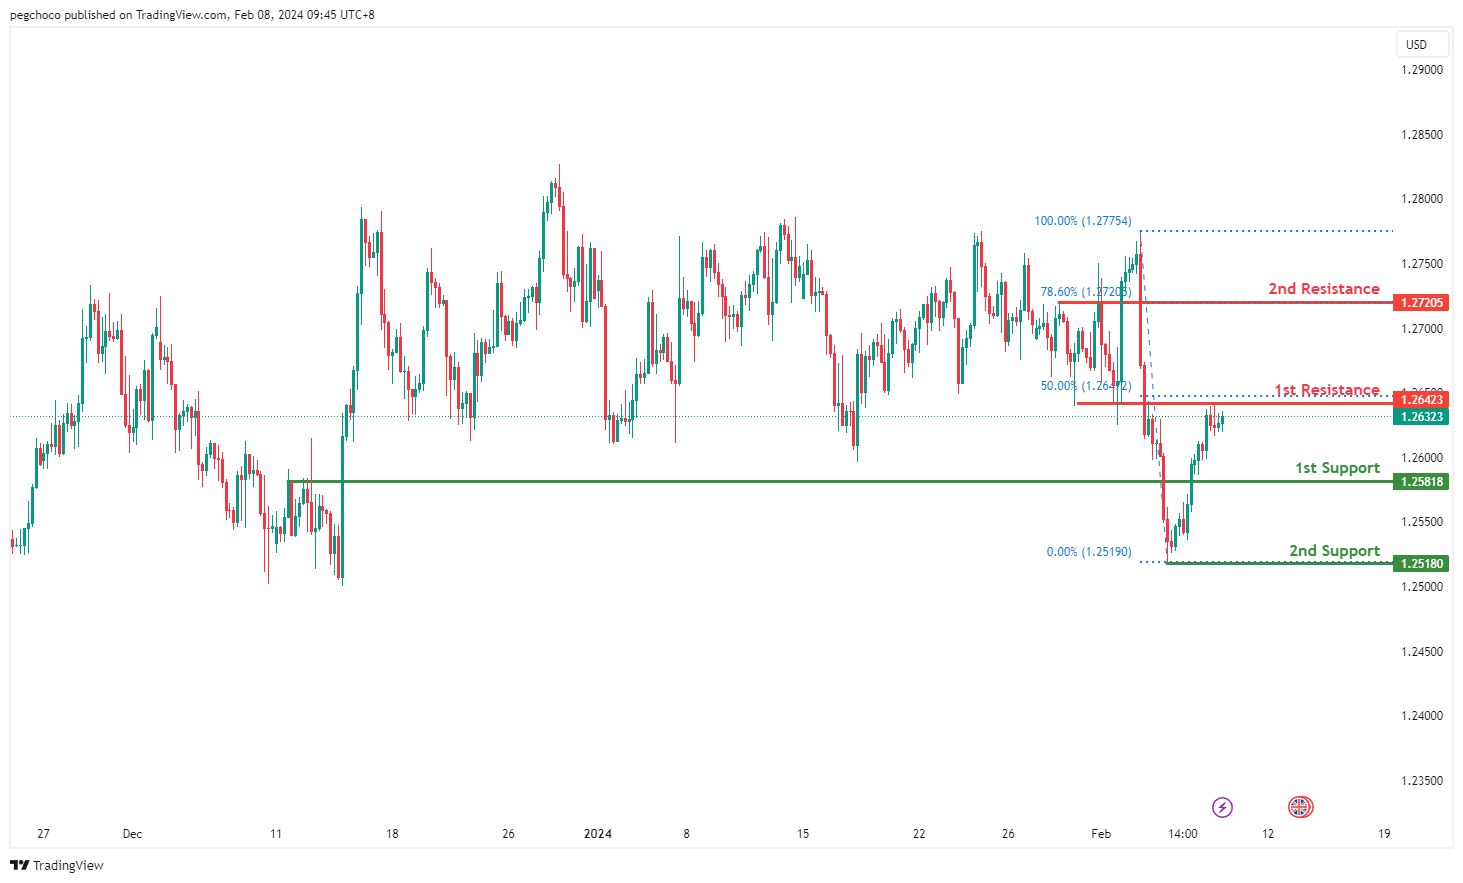
GBP/USD:
The GBP/USD chart currently indicates a bearish overall momentum, suggesting a downward trend. There’s a potential scenario where the price reacts bearishly off the 1st resistance level and declines towards the 1st support.
The 1st support level at 1.2581 is identified as a pullback support, indicating its significance as a potential area where buying interest could emerge.
Additionally, the 2nd support at 1.2518 is characterized as a swing low support, further reinforcing its importance as a potential support level.
On the resistance side, the 1st resistance level at 1.2642 is categorized as an overlap resistance, coinciding with the 50% Fibonacci Retracement, suggesting its historical significance as a potential barrier for further upward movement.
Furthermore, the 2nd resistance at 1.2720 is identified as a pullback resistance, aligning with the 78.60% Fibonacci Retracement, indicating its potential role in impeding further upward momentum.
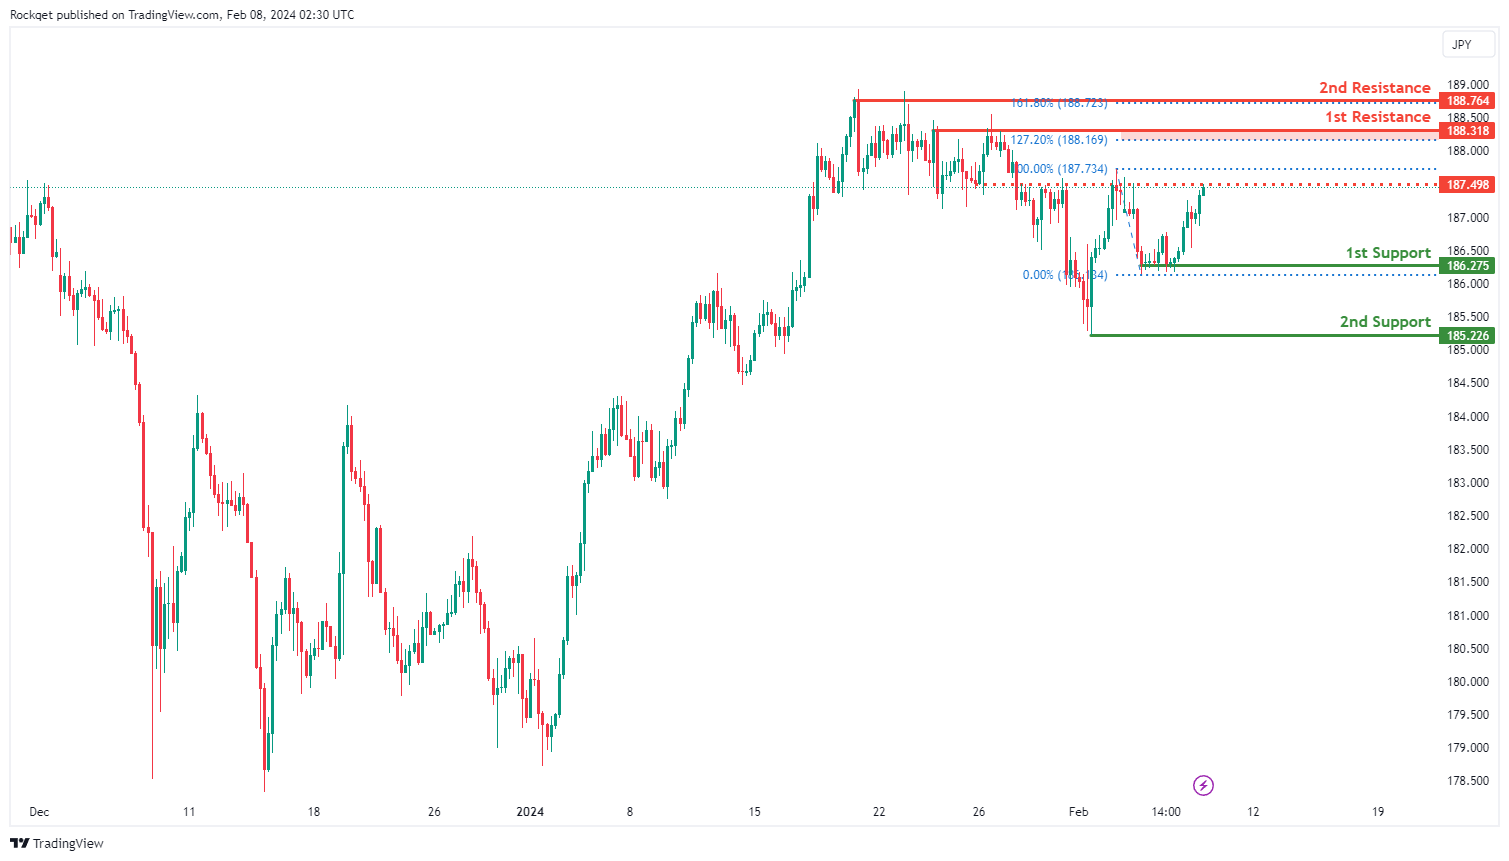
GBP/JPY:
The GBP/JPY chart currently exhibits a bullish momentum, indicating a prevailing upward trend. Several key levels have been identified that could influence future price movements.
The 1st support level at 186.275 is significant as it represents a multi-swing low support, suggesting a strong historical level where buying interest has previously emerged.
Additionally, the 2nd support at 185.226 aligns with a swing low support, further reinforcing its potential as a level of price support.
On the resistance side, the 1st resistance at 188.318 is highlighted as a key level where selling pressure may intensify, coinciding with a pullback resistance and the 127.20% Fibonacci Extension. This level could act as a barrier to the bullish momentum.
Furthermore, the 2nd resistance at 188.764 represents a swing high resistance and aligns with the 161.80% Fibonacci Extension, adding further significance to this level. An intermediate resistance level at 187.50 is also identified, characterized by an overlap resistance.
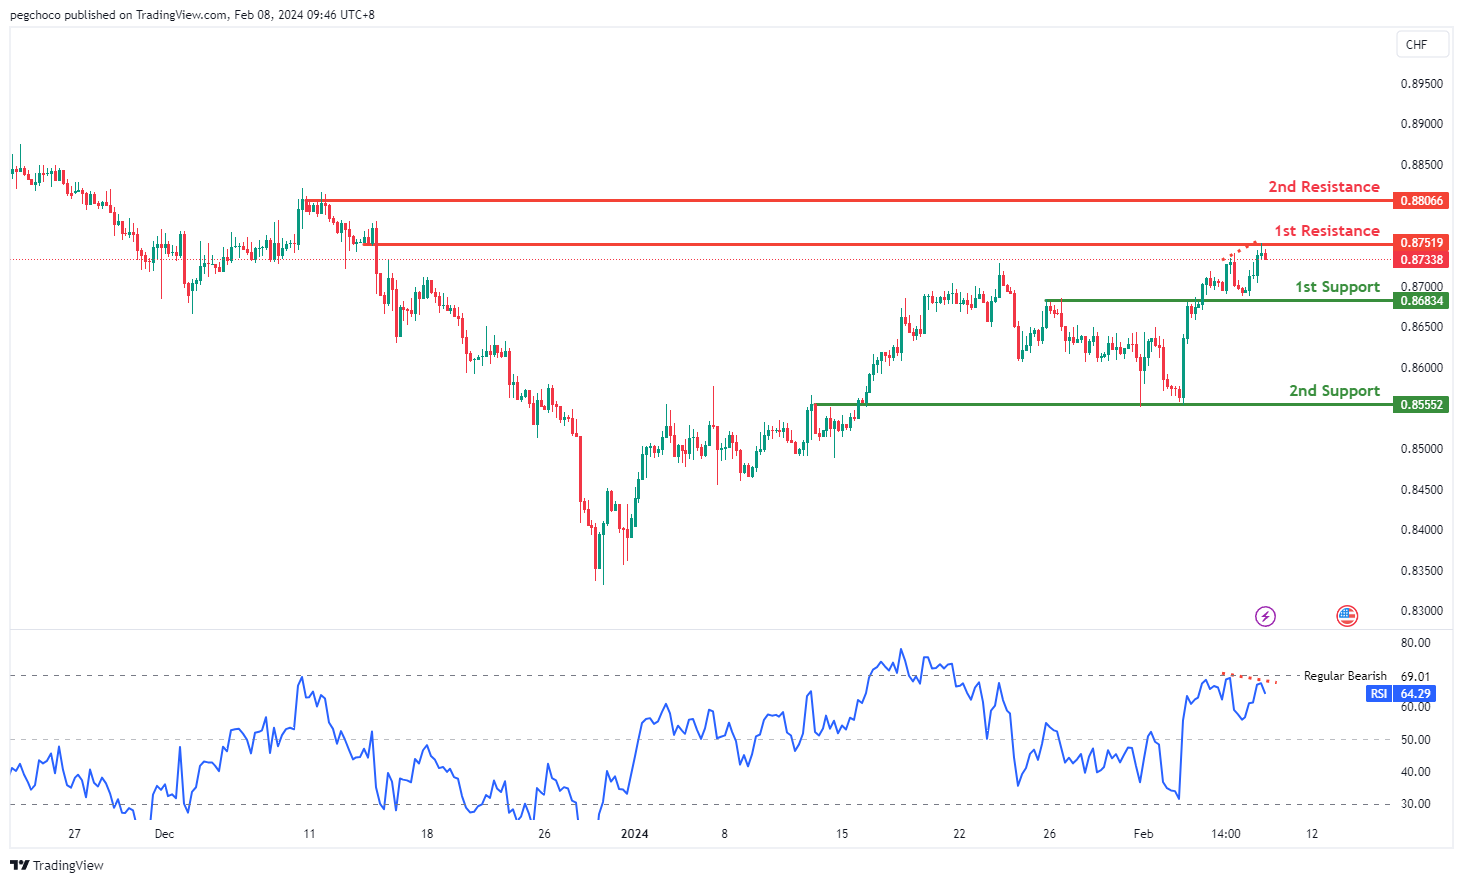
USD/CHF:
The USD/CHF chart currently demonstrates a bearish overall momentum, indicating a downward trend. There’s a possibility of a bearish reaction occurring at the 1st resistance level, leading to a decline towards the 1st support.
The 1st support level at 0.8683 is identified as an overlap support, suggesting its historical significance as a potential area where buying interest may emerge.
Similarly, the 2nd support at 0.8555 is characterized as another overlap support, further emphasizing its importance as a potential support zone.
On the resistance side, the 1st resistance level at 0.8751 is categorized as an overlap resistance, indicating its historical significance as a potential barrier for further upward movement.
Additionally, the 2nd resistance at 0.8806 is identified as a multi-swing high resistance, suggesting its role in impeding further upward momentum.
Moreover, the Relative Strength Index (RSI) is also displaying bearish divergence versus price, suggesting that a reversal might occur soon. This indicates a potential shift in momentum favoring further downward movement.
USD/JPY:
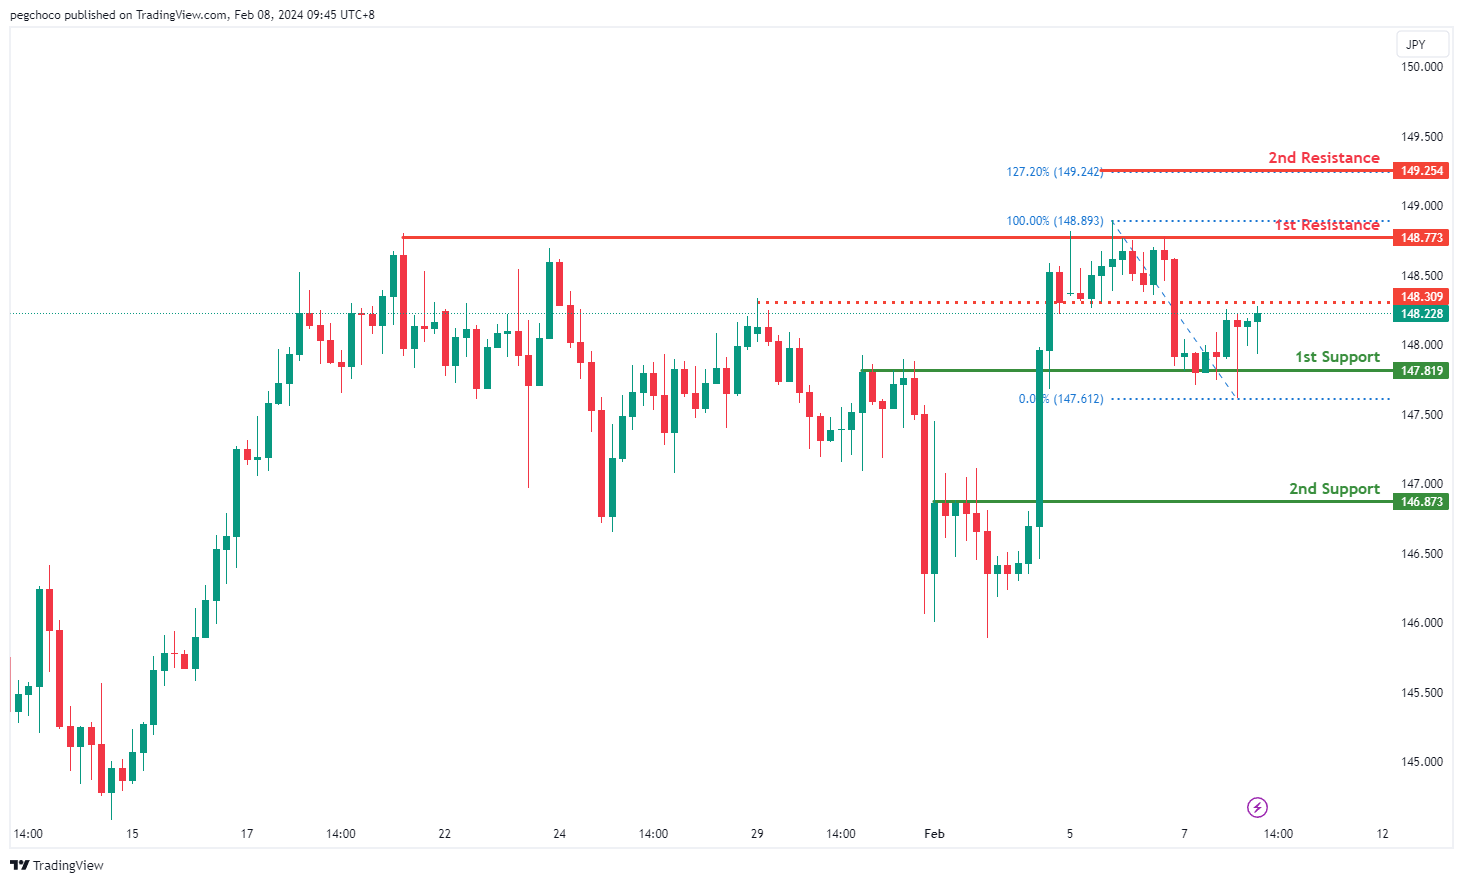
The USD/JPY chart currently indicates a bullish overall momentum, suggesting an upward trend. There’s a possibility of a bullish continuation towards the 1st resistance level.
The 1st support level at 147.81 is identified as an overlap support, indicating its historical significance as a potential area where buying interest may emerge.
Similarly, the 2nd support at 146.87 is characterized as a pullback support, reinforcing its importance as a level where buyers might step in.
On the resistance side, the 1st resistance level at 148.77 is categorized as a multi-swing high resistance, suggesting its historical significance as a barrier for further upward movement.
Additionally, the 2nd resistance level at 149.25 is identified based on the 127.20% Fibonacci Extension, indicating a potential area of resistance derived from Fibonacci analysis.
Moreover, the intermediate resistance at 148.30 is considered a pullback resistance, further adding to the potential barriers for upward movement.
USD/CAD:
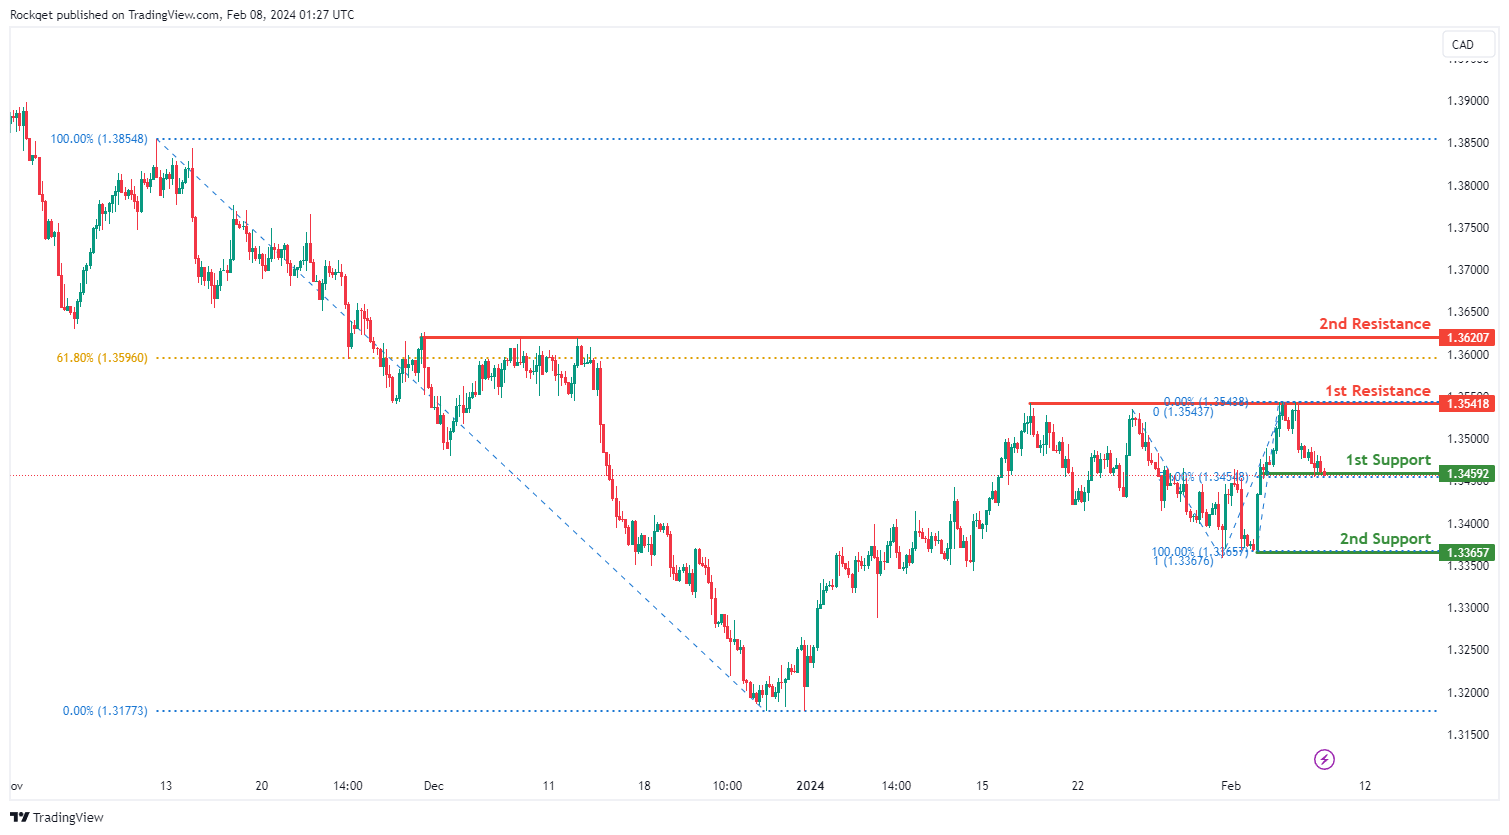
The USD/CAD chart currently exhibits an overall bearish momentum. In this context, there is a potential scenario for price to break bellow the 1st support and fall towards the 2nd support.
The 1st support level at 1.3459 is identified as a pullback support that aligns with the 50.00% Fibonacci Retracement level. Further below, the 2nd support level at 1.3365 is marked as a swing-low support that aligns with the 100.00% Fibonacci projection level, further emphasizing its importance as a potential support zone.
To the upside, the 1st resistance level at 1.3541 is identified as a pullback resistance. Higher up, the 2nd resistance level at 1.3620 is also noted as a pullback resistance that aligns close to the 61.80% Fibonacci Retracement level, further highlighting its importance as a potential resistance point.
AUD/USD:
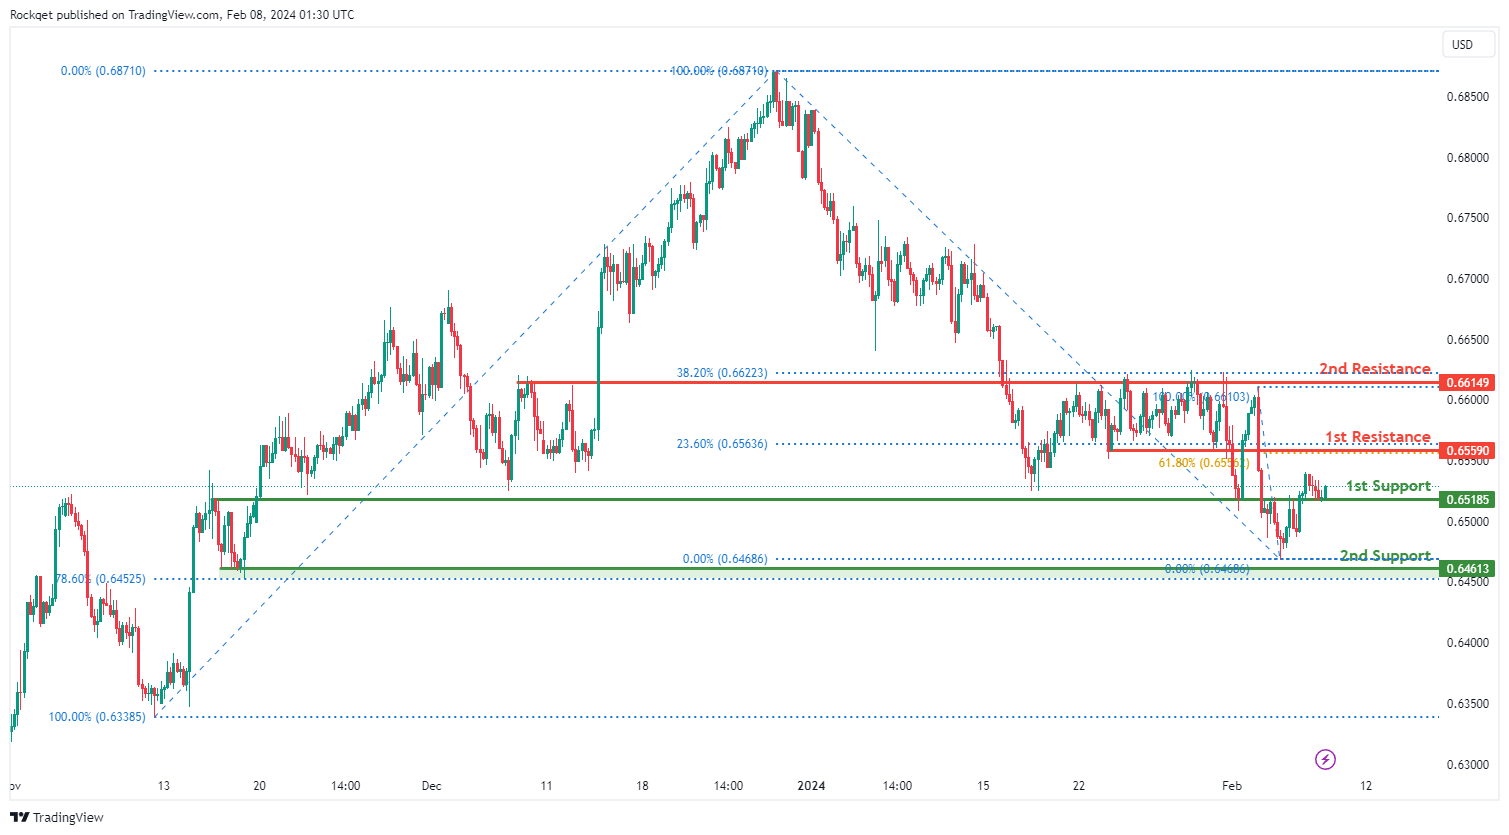
The AUD/USD chart currently exhibits an overall bullish momentum. In this context, there is a potential scenario for price to rise towards the 1st resistance.
The 1st resistance level at 0.6559 is identified as a pullback resistance that aligns with a confluence of Fibonacci levels i.e. the 23.60% and the 61.80% Retracement levels. Higher up, the 2nd resistance level at 0.6614 is also marked as a pullback resistance that aligns close to the 38.20% Fibonacci Retracement level, further highlighting its importance as a potential resistance point.
To the downside, the 1st support level at 0.6518 is identified as an overlap support. Further below, the 2nd support level at 0.6461 is noted as a pullback support that aligns close to the 78.60% Fibonacci Retracement level, further emphasizing its importance as a potential support zone.
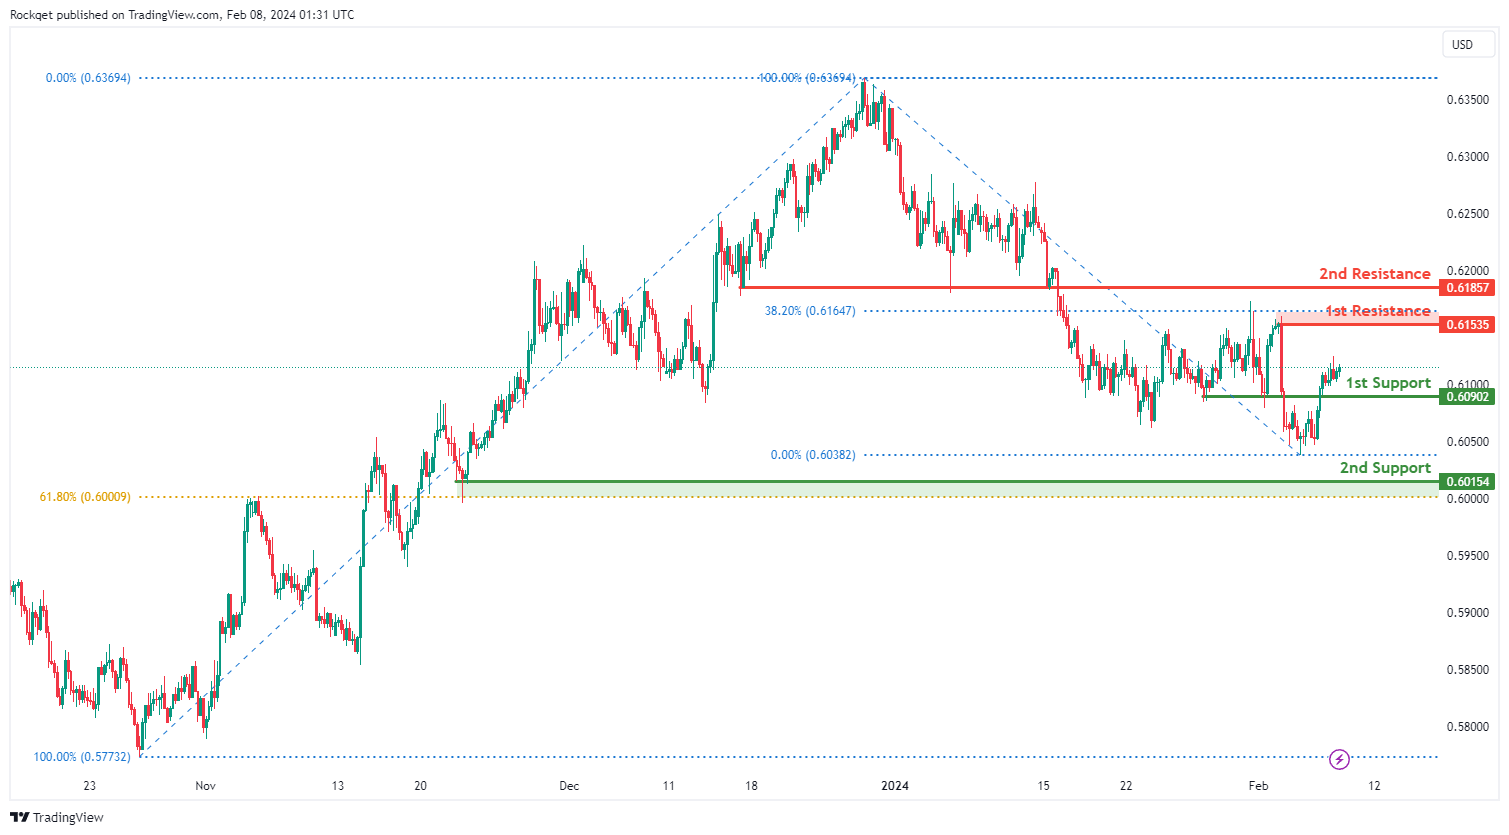
NZD/USD
The NZD/USD chart currently exhibits an overall bullish momentum. In this context, there is a potential scenario for price to rise towards the 1st resistance.
The 1st resistance level at 0.6153 is identified as a pullback resistance that aligns close to the 38.20% Fibonacci Retracement level. Higher up, the 2nd resistance level at 0.6185 is also marked as a pullback resistance, further highlighting its importance as a potential resistance point.
To the downside, the 1st support level at 0.6090 is identified as a pullback support. Further below, the 2nd support level at 0.6015 is also noted as a pullback support that aligns close to the 61.80% Fibonacci Retracement level, further emphasizing its importance as a potential support zone.
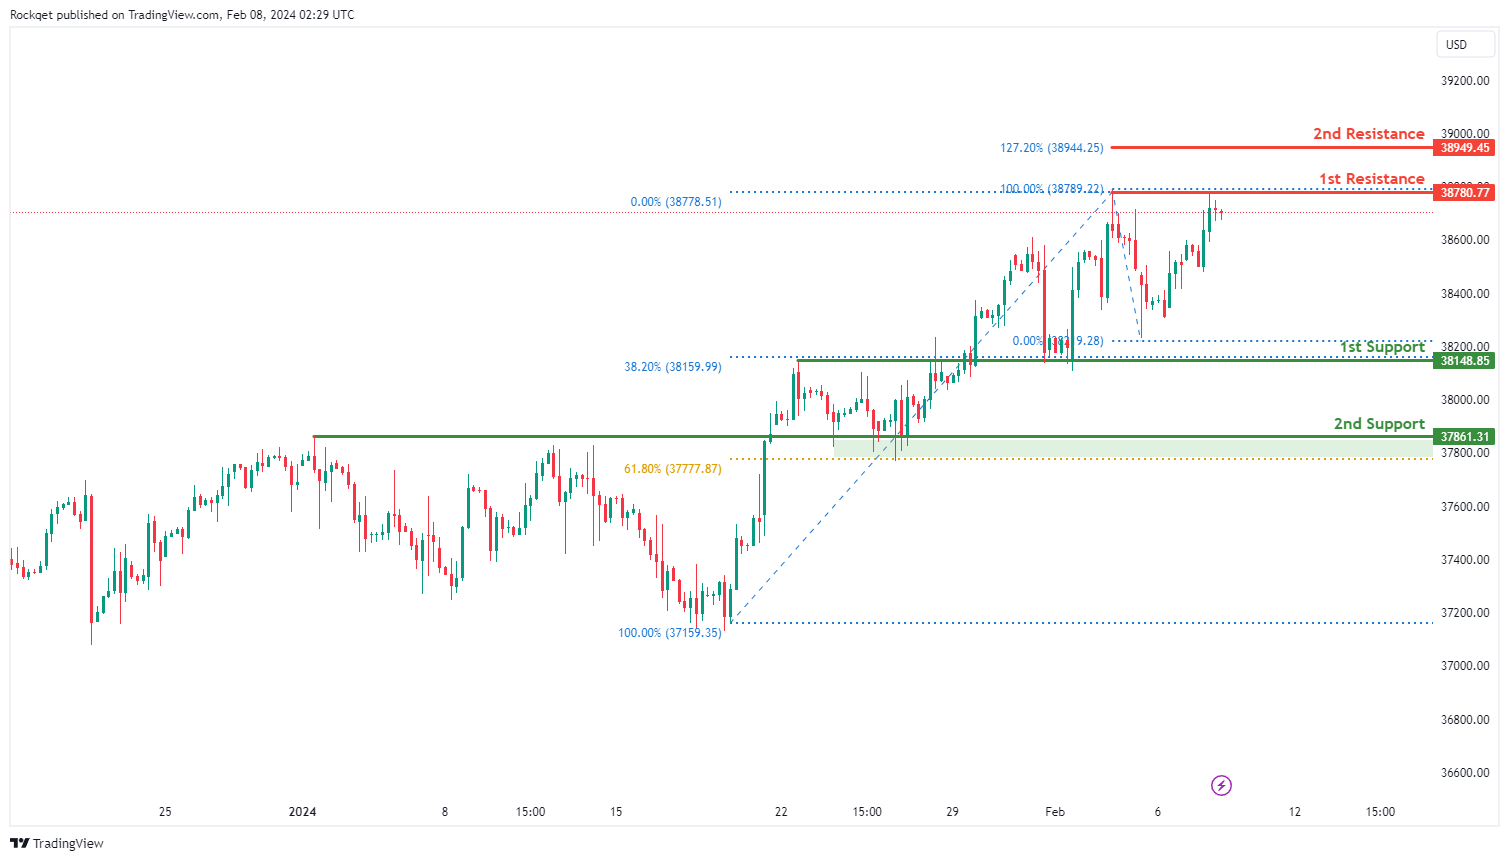
DJ30:
The DJ30 chart currently indicates a weak bearish momentum with low confidence, suggesting a tentative downward trend. Several key levels have been identified that could influence future price movements.
The 1st support level at 38,148.85 is significant as it represents an overlap support and coincides with the 38.20% Fibonacci Retracement, indicating a historical level where buying interest has previously emerged.
Additionally, the 2nd support at 37,861.31 aligns with an overlap support and the 61.80% Fibonacci Retracement, further reinforcing its potential as a level of price support.
On the resistance side, the 1st resistance at 38,780.77 is highlighted as a key level where selling pressure may intensify, representing a swing high resistance.
Furthermore, the 2nd resistance at 38,949.45 suggests a significant level of resistance, coinciding with the 127.20% Fibonacci Extension.
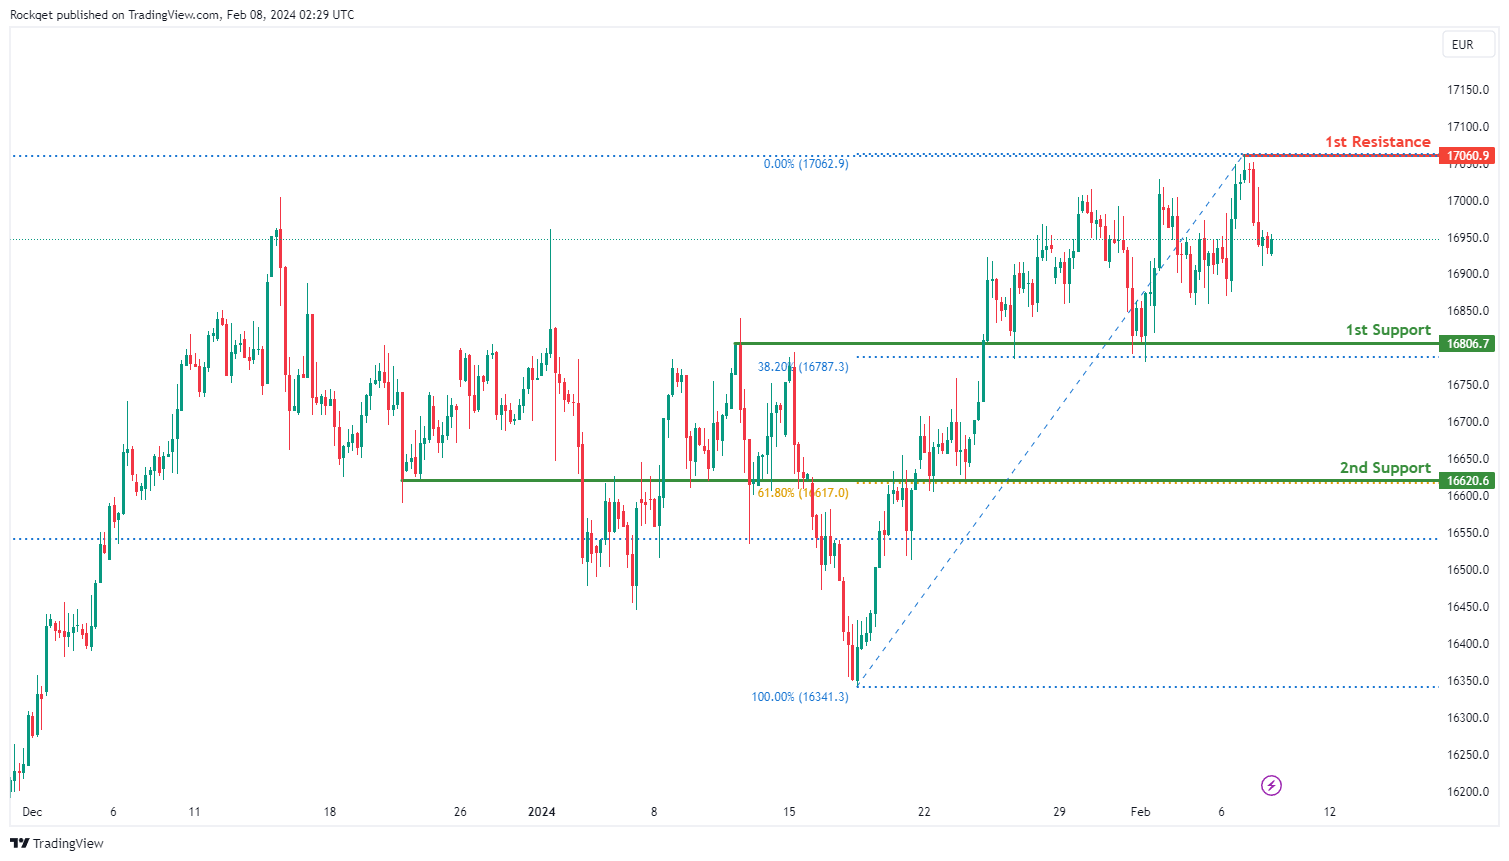
GER40:
The GER40 chart currently exhibits a bearish momentum, indicating a prevailing downward trend. Several factors contribute to this bearish sentiment, suggesting the potential for continued downward movement in the price.
The 1st support level at 16,806.7 is significant as it represents an overlap support and coincides with the 38.20% Fibonacci Retracement, indicating a historical level where buying interest has previously emerged.
Additionally, the 2nd support at 16,620.6 aligns with an overlap support and the 61.80% Fibonacci Retracement, adding further strength to the potential support zone.
On the resistance side, the 1st resistance at 17,060.9 is highlighted as a significant level where selling pressure may intensify, representing a swing high resistance. Furthermore, this level coincides with the 127.20% Fibonacci Extension, adding additional significance to this resistance level.
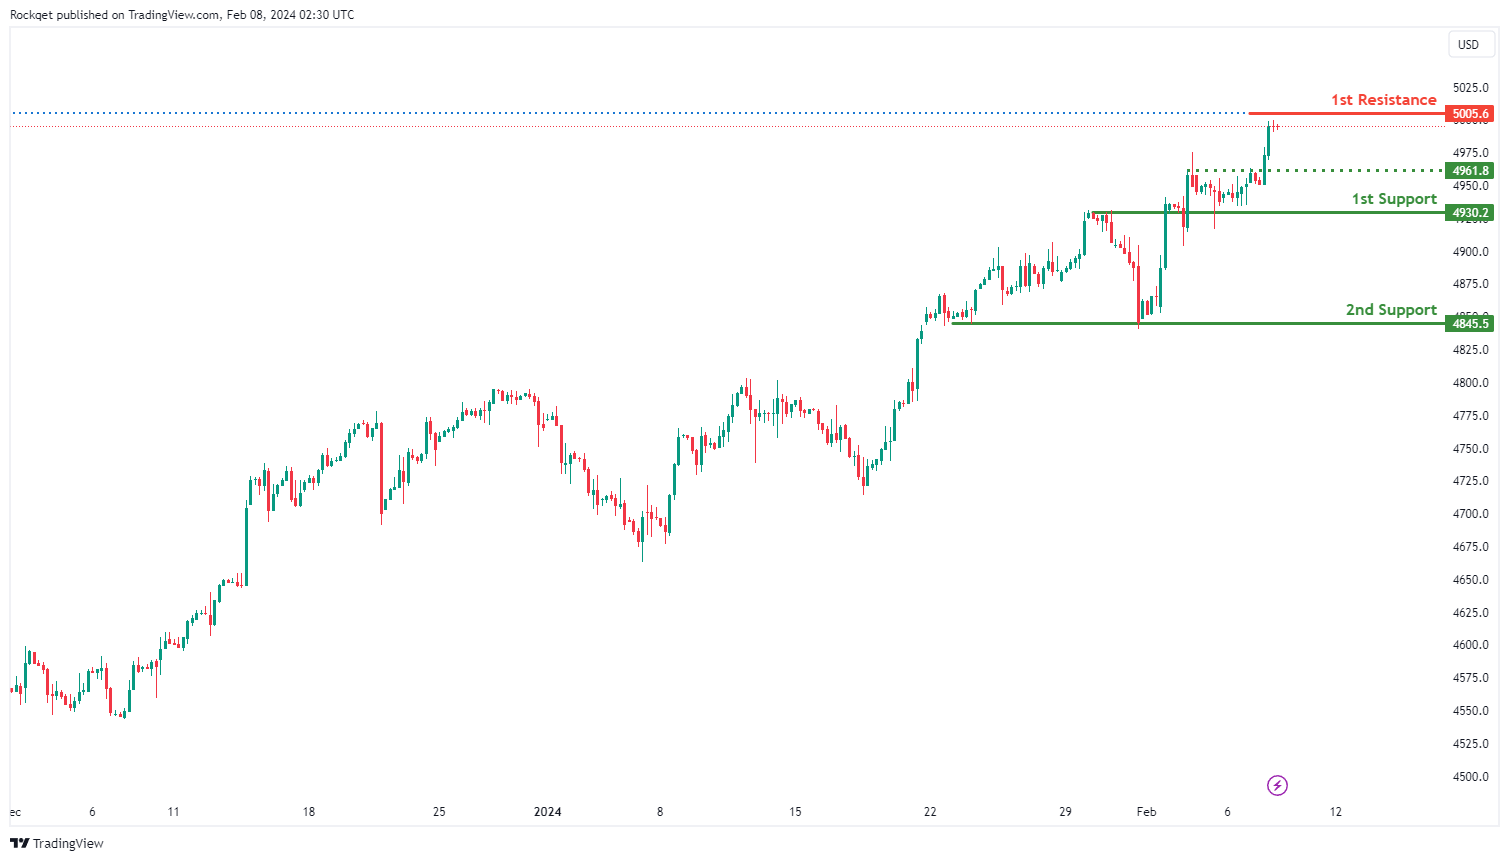
US500:
The US500 chart currently demonstrates a bullish overall momentum, indicating a prevailing upward trend. Multiple factors contribute to this bullish sentiment, supporting the potential for sustained upward movement in the price.
The 1st support level at 4930.2 is considered significant as it represents an overlap support and coincides with the 50% Fibonacci Retracement, indicating a historical level where buying interest has previously emerged.
Additionally, the 2nd support at 4845.5 is a swing low support, further strengthening the potential support zone.
An intermediate support level at 4961.8 is identified, aligning with a pullback support, providing additional reinforcement to the bullish scenario.
On the resistance side, the 1st resistance at 5005.6 is highlighted as a significant level where selling pressure may intensify. This resistance level corresponds to the 78.60% Fibonacci Projection, adding further significance to this resistance level.
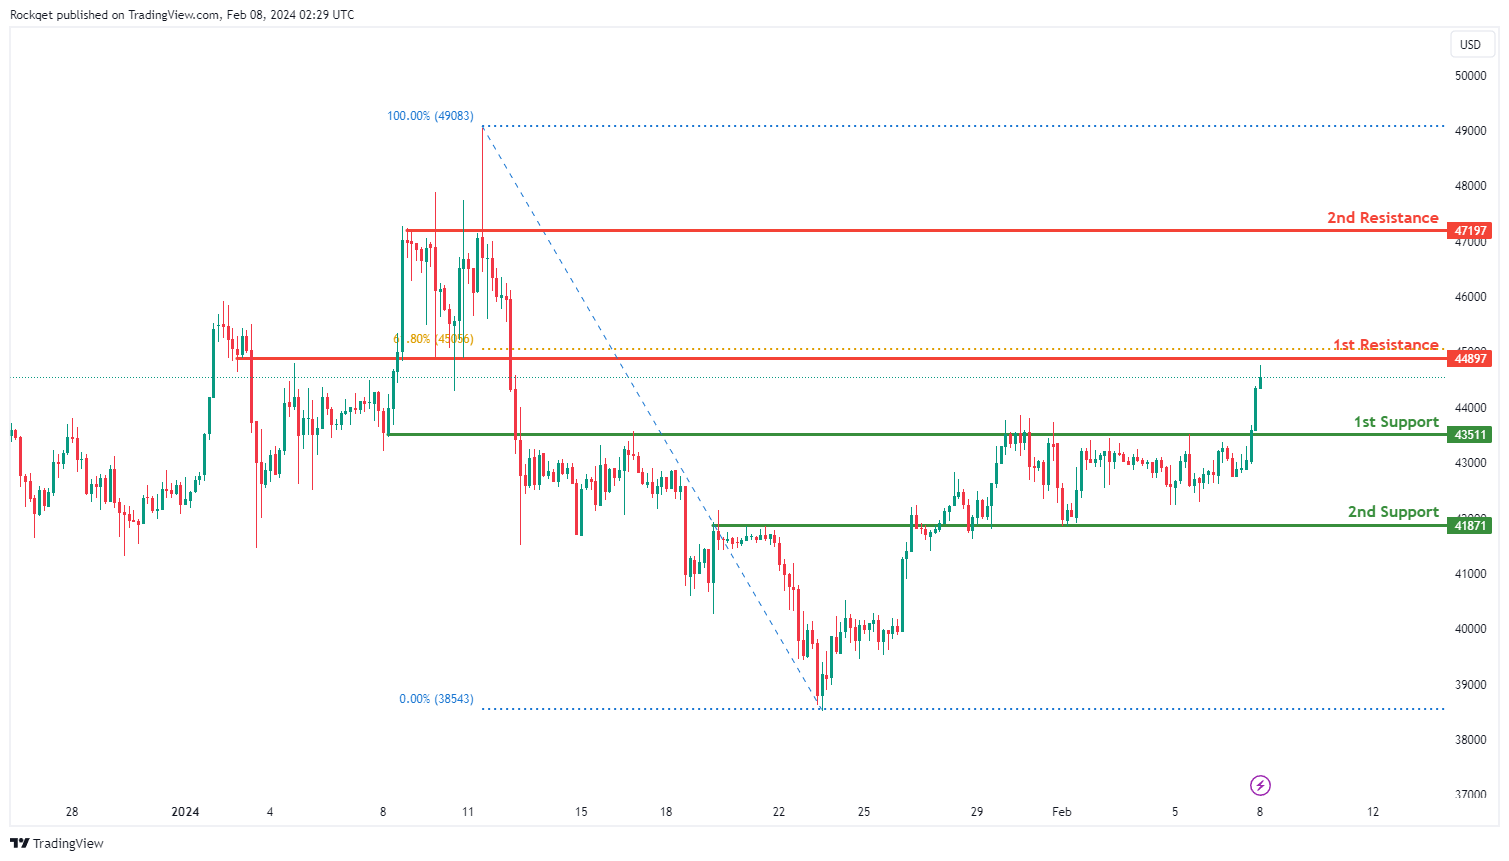
BTC/USD:
The BTC/USD chart currently exhibits a bullish overall momentum, suggesting a prevailing upward trend. Several factors contribute to this bullish sentiment, supporting the potential for continued upward movement in the price.
The 1st support level at 43511 is identified as an overlap support, indicating a historical level where buying interest has previously emerged.
Additionally, the 2nd support at 41871 reinforces the potential support zone as another overlap support.
On the resistance side, the 1st resistance at 44897 is highlighted as a significant level where selling pressure may intensify. This resistance level also aligns with the 61.80% Fibonacci Retracement, adding further significance to its potential as a barrier to the bullish momentum.
Furthermore, the 2nd resistance at 47197 is recognized as a multi-swing high resistance level, indicating a historically significant obstacle to price movement.
ETH/USD:
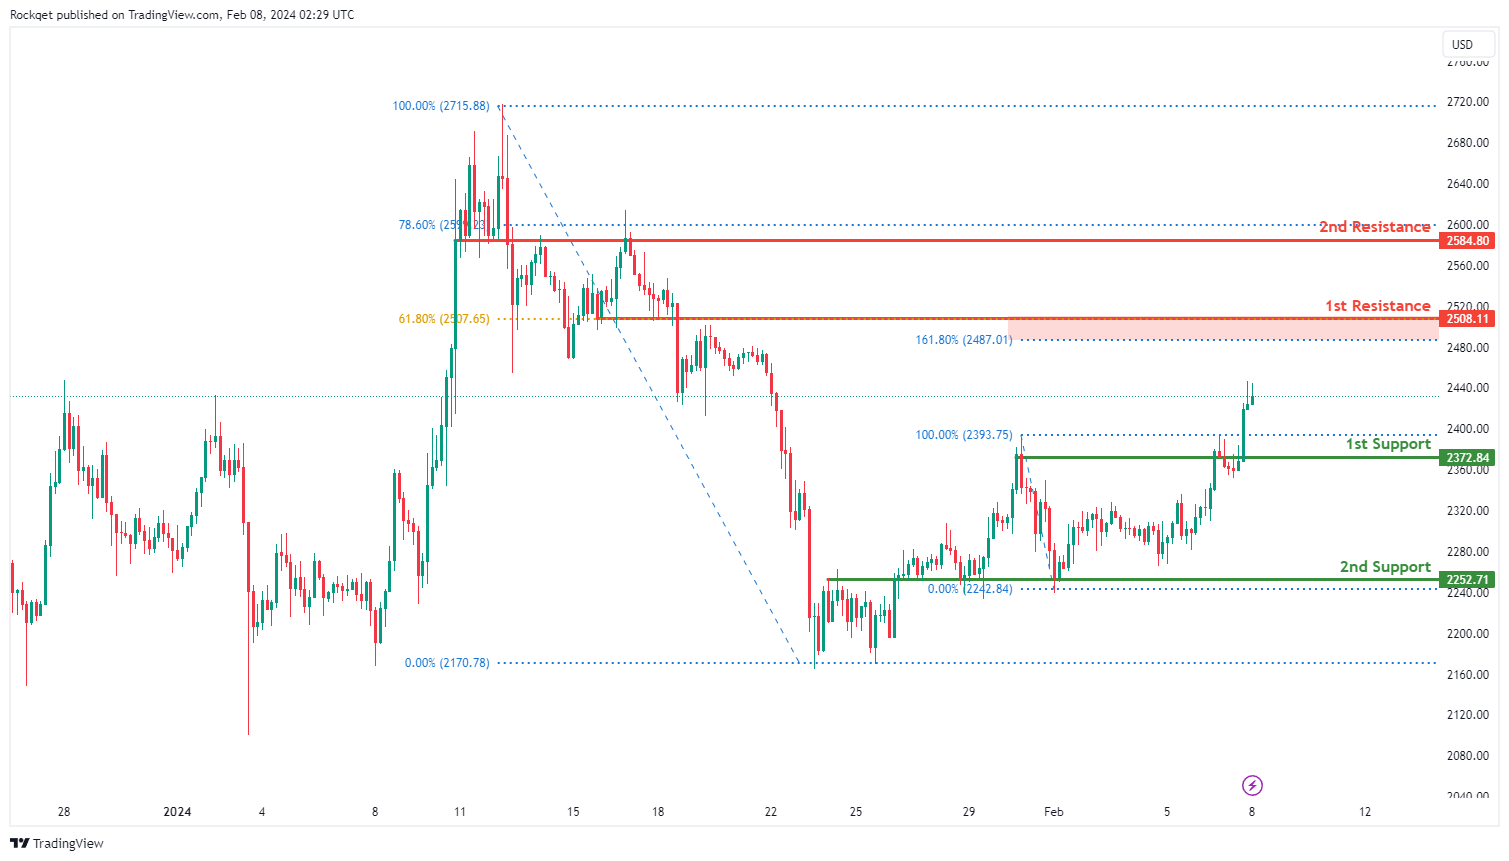
The ETH/USD chart currently demonstrates a bullish overall momentum, indicating a prevailing upward trend. Several factors contribute to this bullish sentiment, supporting the potential for continued upward movement in the price.
The 1st support level at 2372.84 is recognized as an overlap support, indicating a historical level where buying interest has previously emerged. Additionally, the 2nd support at 2252.71 reinforces the potential support zone as another overlap support.
On the resistance side, the 1st resistance at 2508.11 is highlighted as a significant level where selling pressure may intensify. This resistance level aligns with the 61.80% Fibonacci Retracement and the 161.80% Fibonacci Extension, adding further significance to its potential as a barrier to the bullish momentum.
Furthermore, the 2nd resistance at 2584.80 is recognized as an overlap resistance, coinciding with the 78.60% Fibonacci Retracement, reinforcing its importance as a resistance level.
WTI/USD:
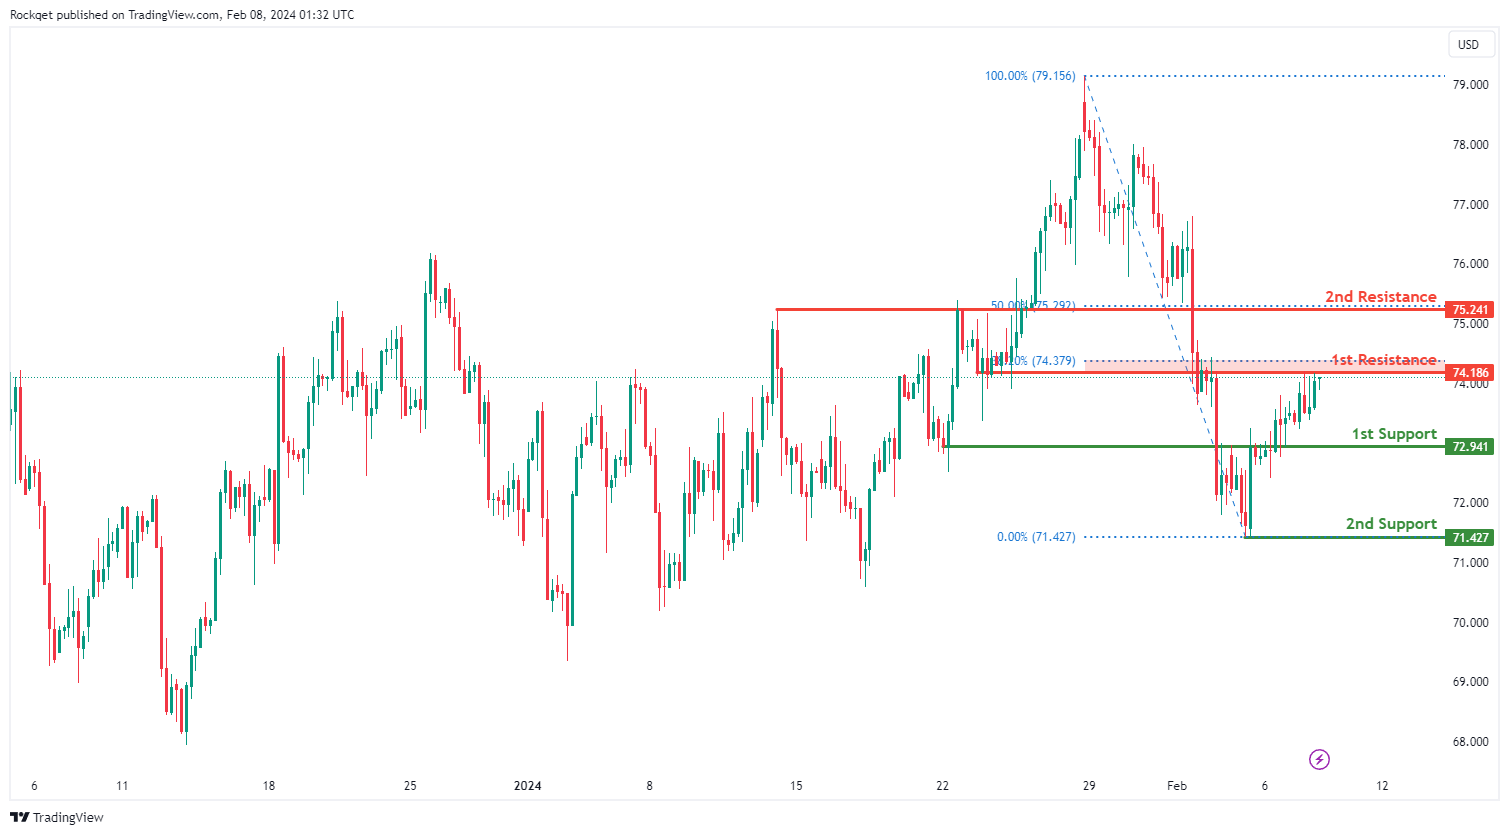
The WTI (West Texas Intermediate) chart currently exhibits an overall bullish momentum. In this context, there is a potential scenario for price to rise towards the 1st resistance.
The 1st resistance level at 74.18 is identified as an overlap resistance that aligns close to the 38.20% Fibonacci Retracement level. Higher up, the 2nd resistance level at 75.24 is marked as a pullback resistance that aligns with the 50.00% Fibonacci Retracement level, further highlighting its importance as a potential resistance zone.
To the downside, the 1st support level at 72.94 is identified as an overlap support. Further below, the 2nd support level at 71.42 is identified as a pullback support, reinforcing its significance as a key support level.
XAU/USD (GOLD):
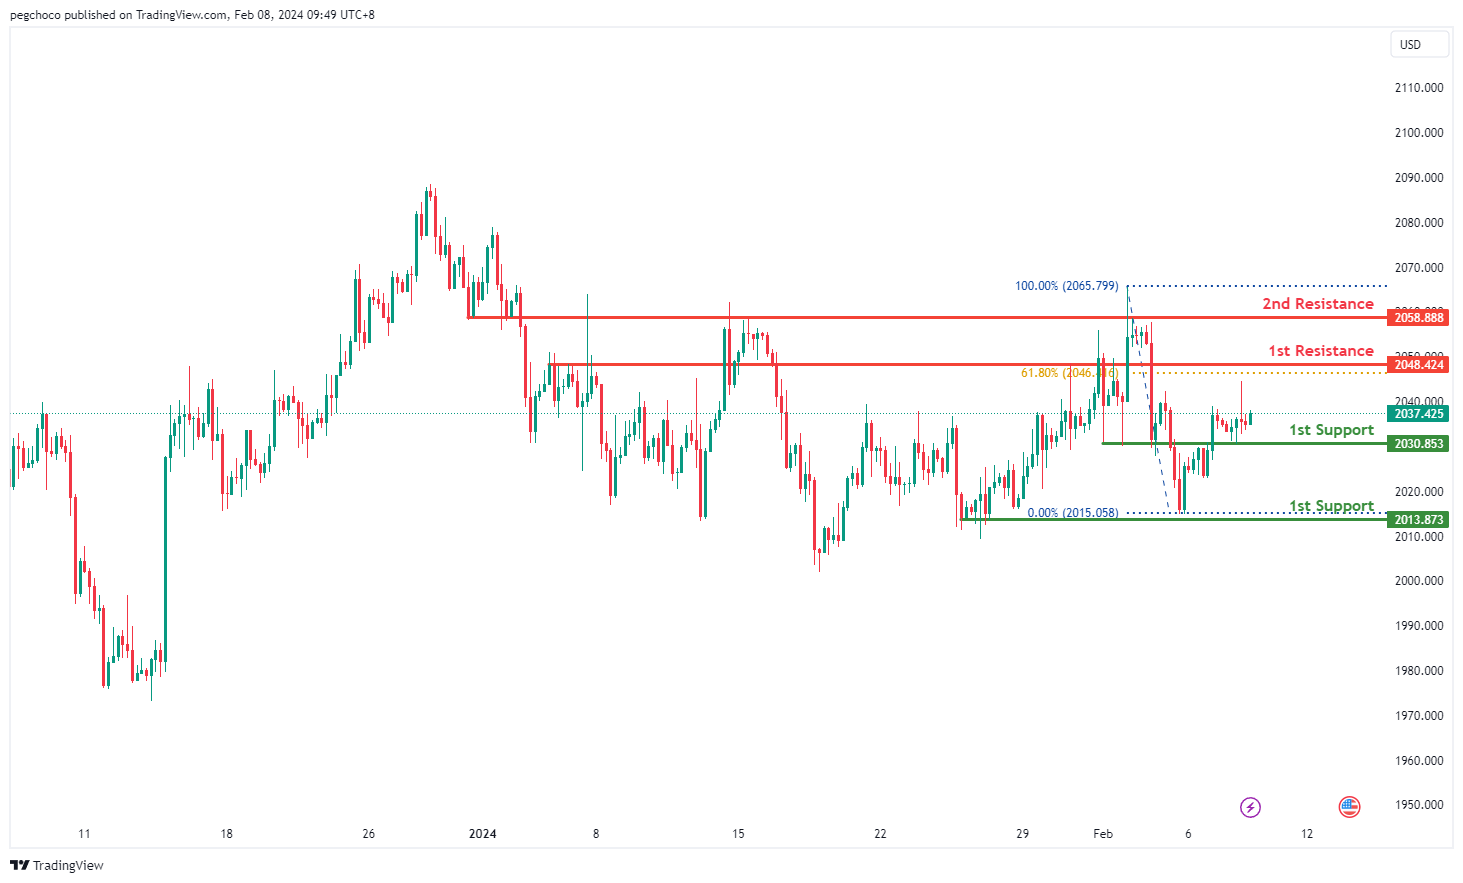
The XAUUSD chart currently demonstrates bullish momentum, indicating an upward trend. There’s a potential for a bullish continuation towards the 1st resistance level.
The 1st support level at 2030.85 is identified as an overlap support, suggesting its historical significance as a level where buying interest may emerge.
Similarly, the 2nd support at 2013.87 is characterized as a multi-swing low support, reinforcing its importance as a level where buyers might enter the market.
On the resistance side, the 1st resistance level at 2048.42 is categorized as a pullback resistance, indicating its historical significance as a barrier for further upward movement. This level aligns with the 61.80% Fibonacci Retracement, adding to its significance.
Additionally, the 2nd resistance level at 2058.88 is identified as an overlap resistance, further adding to its potential as a barrier for further upside movement.
China’s deepening deflation: CPI hits 14-year low in Jan
China's CPI took a notable dip in January, registering decrease of -0.8% yoy, marking a significant deepening of deflationary pressures from the previous month's -0.3% and falling short of expectation -0.5% yoy. This downturn represents the fourth consecutive negative reading and the most substantial fall observed since 2009, over fourteen years ago.
The decline was particularly pronounced in food prices, which was down -5.9% yoy. Meanwhile, core CPI, which excludes volatile energy and food prices, rose by a modest 0.4% yoy, slowing from December's 0.6% yoy increase. Despite the annual downturn, CPI saw a slight month-on-month increase of 0.3%, albeit below the anticipated 0.4% growth.
The NBS attributed January's inflation figures to the high base effect associated with the Spring Festival, or Lunar New Year, which occurred in January the previous year. This annual holiday, which shifts between January and February depending on the lunar calendar, significantly impacts consumption patterns and inflation metrics due to its influence on consumer spending and business operations.
In parallel, PPI fell by -2.5% yoy in January, showing a modest improvement from the -2.7% yoy observed in the previous month and slightly better than -2.6% forecast. This marks the 16th consecutive month of annual declines for PPI, with factory-gate prices decreasing by -0.2% mom, following -0.3% mom drop in December.
BoC cites difficulty in predicting appropriate timing of rate cuts
BoC's deliberations from the January meeting saw the governing council expressing that it was "difficult to foresee when it would be appropriate to begin cutting interest rates."
The possibility of additional rate hikes was not dismissed, with members indicating that such measures could be warranted should new inflationary surprises emerge. However, the focus of future policy discussions would likely "shift to how much longer to maintain the policy rate at 5% to sustain the disinflationary process."
Inflation's persistent high levels and broad impact have prompted the council to emphasize their ongoing concerns regarding "persistence of underlying inflation" in their communications.
The members collectively agreed on the necessity for "further evidence of progress toward price stability," seeking definitive signs of a downturn in core inflation rates.
To gauge the effectiveness of their monetary policy and the evolving economic landscape, the Governing Council plans to closely monitor core inflation alongside several critical indicators. These include the equilibrium between supply and demand within the economy, corporate pricing strategies, inflation expectations, and the ratio of wage growth to productivity.