

Sample Category Title
EUR/USD Mid-Day Outlook
Daily Pivots: (S1) 1.0755; (P) 1.0770; (R1) 1.0787; More...
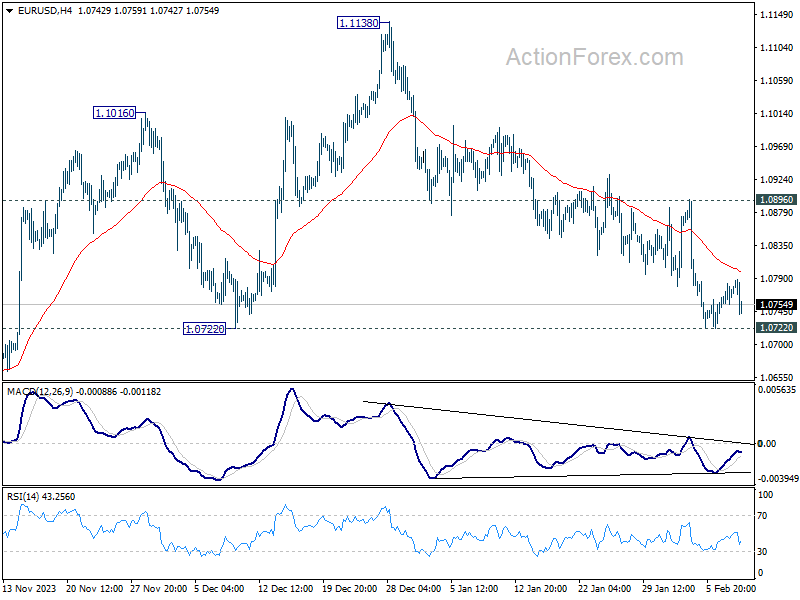
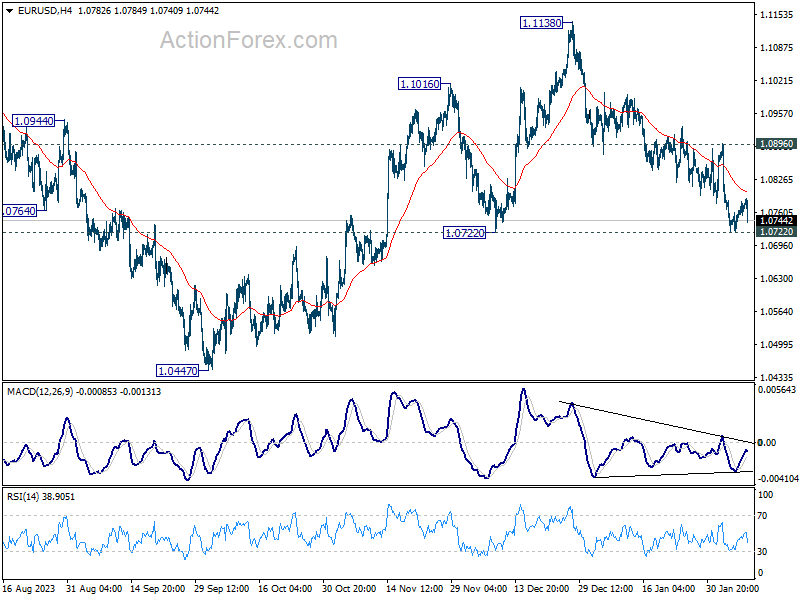
EUR/USD is still holding above 1.0722 support and intraday bias stays neutral. On the downside, decisive break of 1.0722 will argue that whole rise from 1.0447 has completed. Deeper fall would then be seen to target this low. On the upside, break of 1.0896 resistance is needed to indicate short term bottoming. Otherwise, risk will stay on the downside in case of recovery.
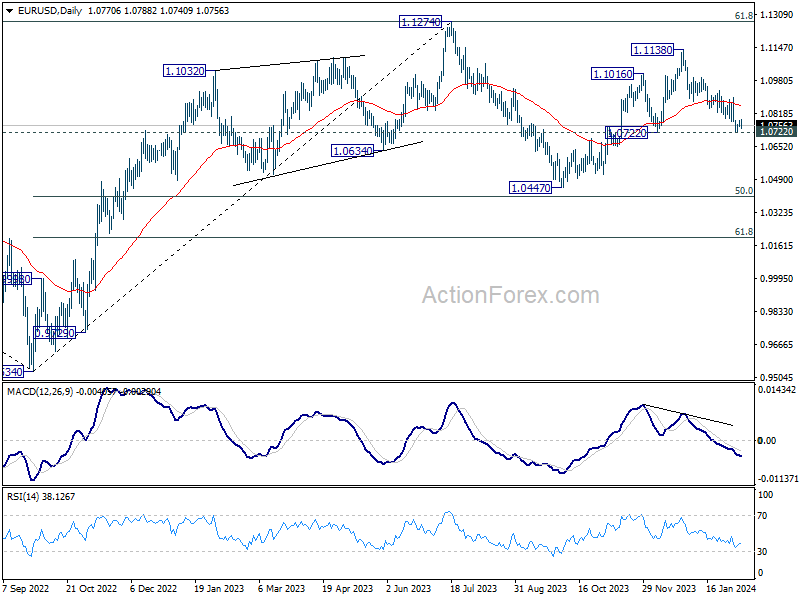
In the bigger picture, price actions from 1.1274 are viewed as a corrective pattern to rise from 0.9534 (2022 low). Rise from 1.0447 is seen as the second leg. While further rally could cannot be ruled out, upside should be limited by 1.1274 to bring the third leg of the pattern. Meanwhile, sustained break of 1.0722 support will argue that the third leg has already started for 1.0447 and possibly below.
GBP/USD Mid-Day Outlook
Daily Pivots: (S1) 1.2599; (P) 1.2620; (R1) 1.2650; More...
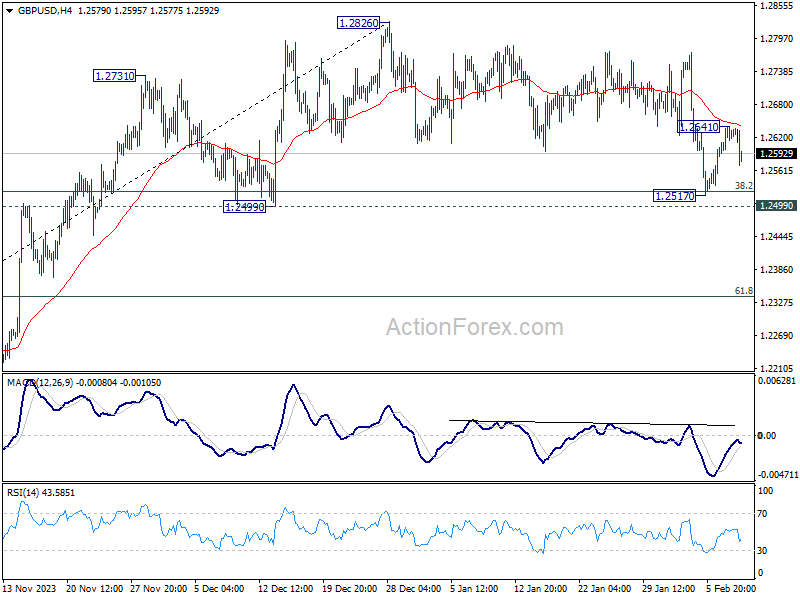
GBP/USD retreated ahead of 55 4H EMA (now at 1.2642) and intraday bias is turned neutral first. Above 1.2641 will resume the rebound from 1.2517 to retest 1.2826 high. On the downside, however, decisive break of 1.2499 will argue that whole rise from 1.2036 has completed and turn near term outlook bearish.
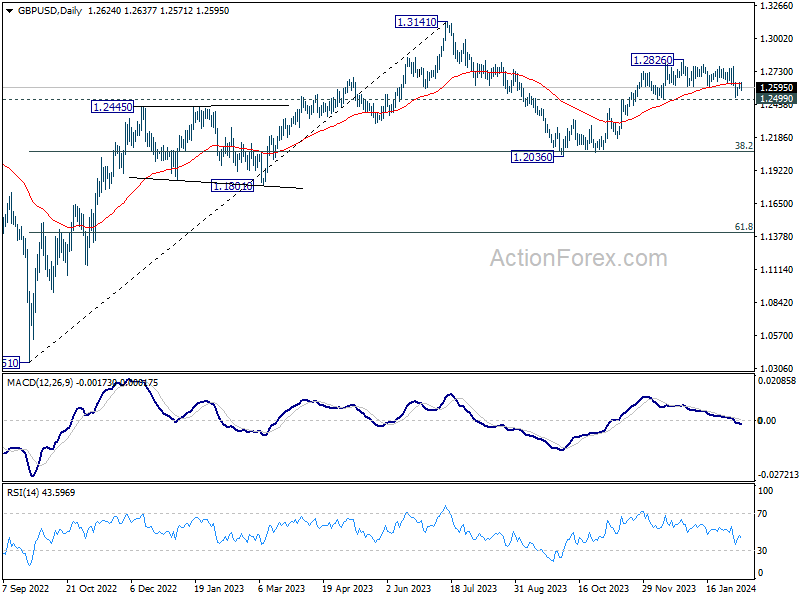
In the bigger picture, price actions from 1.3141 medium term top are seen as a corrective pattern to up trend from 1.0351 (2022 low). Rise from 1.2036 is seen as the second leg that's still in progress. Upside should be limited by 1.3141 to bring the third leg of the pattern. Meanwhile, break of 1.2499 support will argue that the third leg has already started for 38.2% retracement of 1.0351 (2022 low) to 1.3141 at 1.2075 again.
USD/CHF Mid-Day Outlook
Daily Pivots: (S1) 0.8706; (P) 0.8730; (R1) 0.8770; More....
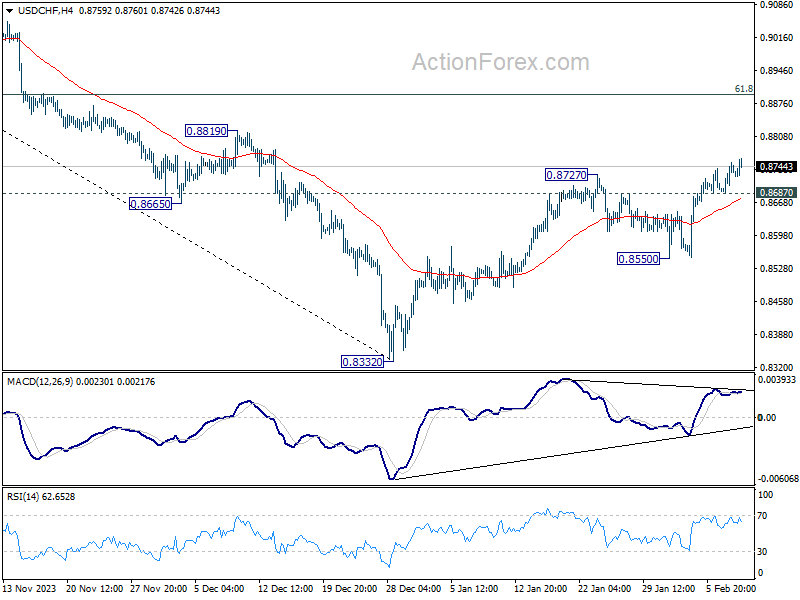
Intraday bias in USD/CHF remains on the upside as rise from 0.8332 is in progress. Further seen to 61.8% retracement of 0.9243 to 0.8332 at 0.8995 next. On the downside, below 0.8687 minor support will turn intraday bias neutral first. But near term outlook will stay cautiously bullish as long as 0.8550 support holds.
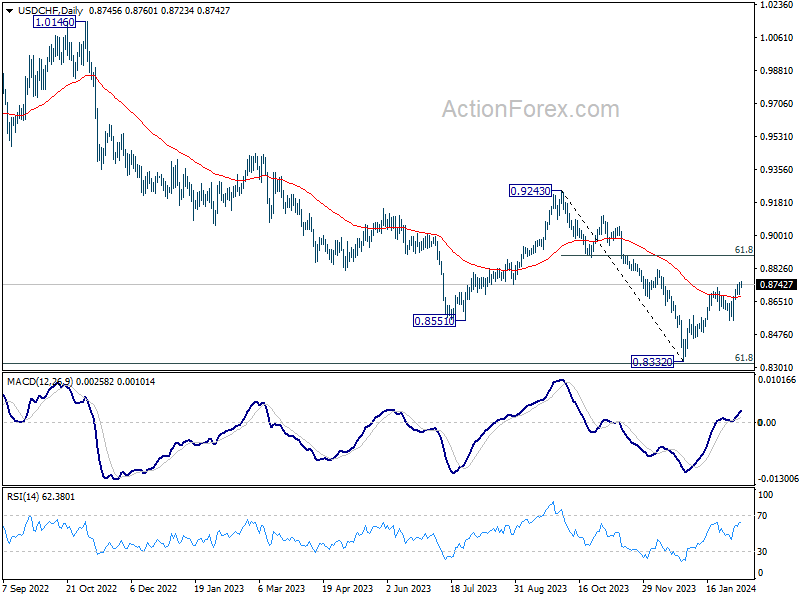
In the bigger picture, there is prospect of medium term bottoming at 0.8332 considering possible bullish convergence condition in W MACD, and the support from 0.8317 long term fibonacci support. Sustained trading above 55 D EMA (now at 0.8677) will affirm this case, and bring stronger rise back towards 0.9243 resistance, even as a corrective move.
USD/JPY Mid-Day Outlook
Daily Pivots: (S1) 147.79; (P) 148.02; (R1) 148.42; More...
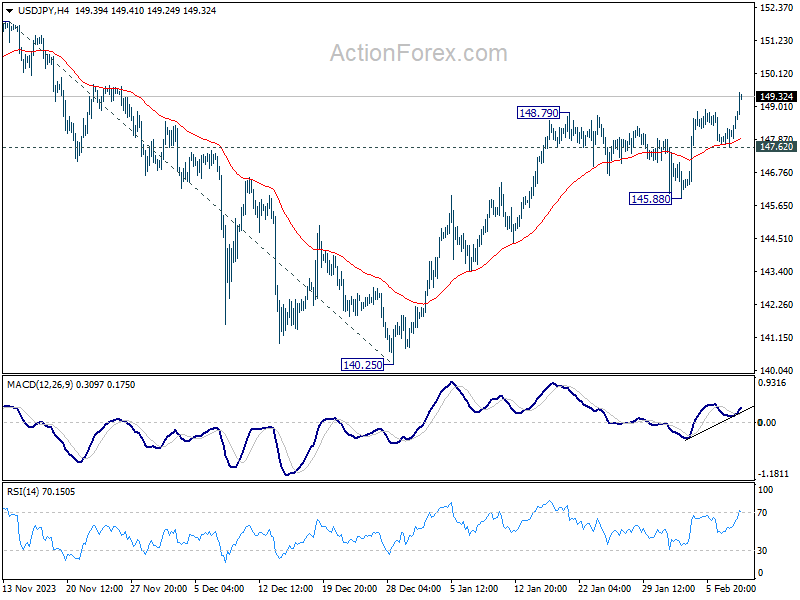
USD/JPY's rally from 140.25 is in progress and intraday bias remains on the upside. Further rally is expected to retest 151.89/93 key resistance zone. Decisive break there will confirm resumption of larger up trend. On the downside, below 147.62 minor support will turn intraday bias neutral first. But near term outlook will remain cautiously bullish as long as 145.88 support holds.
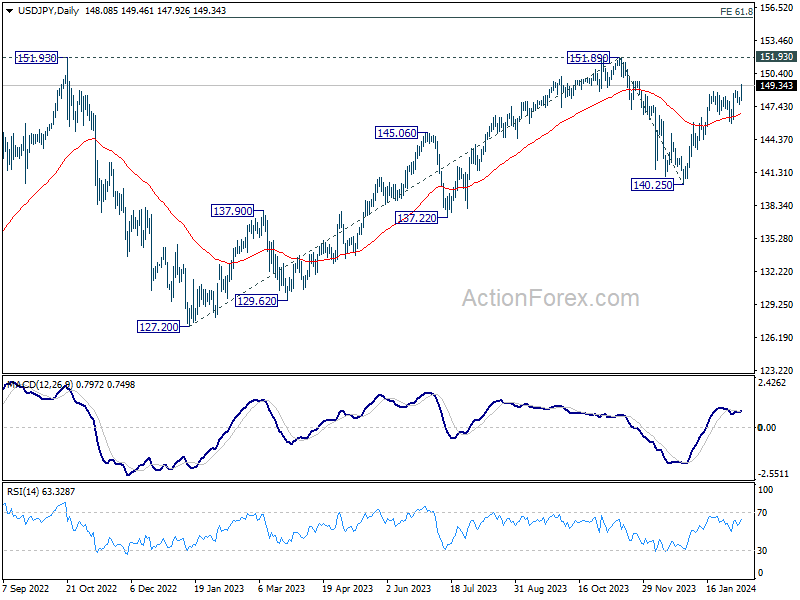
In the bigger picture, fall from 151.89 is seen as a correction to the rally from 127.20, which might have completed at 140.25 already. Firm break of 151.89/93 resistance zone will confirm up trend resumption next target will be 61.8% projection of 127.20 to 151.89 from 140.25 at 155.50. This will now remain the favored case as long as 140.25 support holds.
Dollar Rises on Relative Yield Strength and Economic Optimism
Dollar rises broadly in early US session, standing out in a day characterized by relatively slow news flow. The move in the greenback can be primarily attributed to the rise in US benchmark yields, which outpaced those of other regions, thereby bolstering the greenback's appeal.
Sentiment surrounding the US market remains positive, with traders showing confidence in resilience of the US economy. This optimism persists despite expectations that Fed's cycle of interest rate cuts may commence later than previously anticipated.
The development is fostering a relatively unusual scenario where Dollar, yields, and stocks may ascend in tandem, a convergence that could persist until the correlation dynamics shift.
Meanwhile, Japanese Yen finds itself at the bottom of today's performance chart, initially dragged down by dovish remarks from a senior BoJ official and further pressured by the strength in US and European benchmark yields.
Following closely behind in terms of underperformance were Australian and New Zealand Dollars, which succumbed to the gravitational pull of concerning economic data from China indicating deepening of deflationary pressures as the new year commenced.
In contrast, the Swiss Franc and Canadian Dollar showcased resilience, managing to secure firmer ground amidst the currency tumult, while the Euro and Sterling exhibit mixed performance.
Technically, it's possible that EUR/USD's recovery since Monday has already completed, after failing to even tough 55 4H EMA. 1.0722 support is back as the focus for the rest of the week. Decisive break there will indicate that whole rebound from 1.0447 has completed at 1.1138, and solidify near term bearishness for retesting 1.0447 low later in the month.
In Europe, at the time of writing, FTSE is down -0.09%. DAX is up 0.51%. CAC is up 0.81%. UK 10-year yield is up 0.0030 at 4.021. Germany 10-year yield is up 0.019 at 2.337. Earlier in Asia, Nikkei rose 2.06%. Hong Kong HSI fell -1.27%. China Shanghai SSE rose 1.28%. Singapore Strait Times fell -0.42%. Japan 10-year JGB yield fell -0.0108 to 0.699.
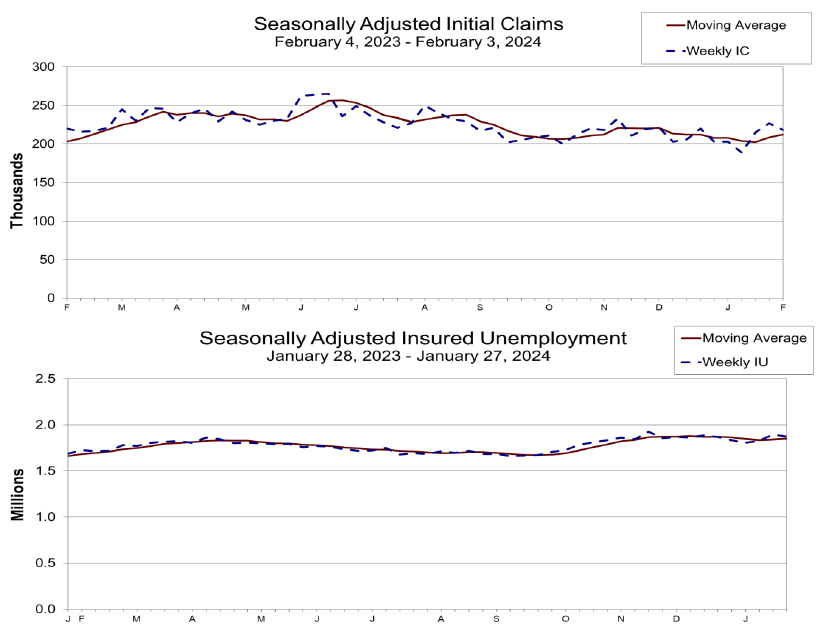
US initial jobless claims falls to 218k, vs exp 220k
US initial jobless claims fell -9k to 218k in the week ending February 3, slightly better than expectation of 220k. Four-week moving average of continuing claims rose 4k to 212k.
Continuing claims fell -23k to 1871k in the week ending January 27. Four-week moving average of continuing claims rose 9.5k to 1850k.
ECB's Wunsch sees some value to waiting
ECB Governing Council member Pierre Wunsch said today, "I'm on the side of those that believe there's some value to waiting" before cutting interest rates.
Nevertheless, Wunsch also acknowledged the inherent uncertainties in economic forecasting and the eventual need to make decisions based on the best available data. "But again, we won't get full comfort. So at some point, we'll have to look at all the information we have and take a bet," he said.
A critical factor in Wunsch's cautious stance is the current state of wage growth within Eurozone. He pointed out that wage increases are occurring at a pace that may undermine ECB's efforts to bring inflation down to 2% inflation target. Were it not for the uptick in salaries, ECB might already be in a position to initiate monetary easing.
BoJ's Uchida signals no swift hikes after negative rate ends
In a speech today, BoJ Deputy Governor Shinichi Uchida articulated a scenario where, despite an end to the negative interest rate policy, rapid interest rate hikes remain unlikely.
"Even if the Bank were to terminate the negative interest rate policy, it is hard to imagine a path in which it would then keep raising the interest rate rapidly," he stated, suggesting a gradual adjustment process, while financial conditions wild remain "accommodative.
Uchida projected gradual increase in underlying inflation toward 2 percent target through fiscal 2025. This forecast anticipates core CPI (all items less fresh food) at 2.8% for fiscal 2023, with a subsequent moderation to 2.4% in fiscal 2024 and 1.8% in fiscal 2025.
Theses projections are based on the outlook that "while the pass-through of cost increases will continue to wane, prices such as of services will rise, accompanied by wage increases."
To achieve this economic outlook, Uchida emphasized, the virtuous cycle needs to intensify in both directions, from prices to wages and from wages to prices."
China's deepening deflation: CPI hits 14-year low in Jan
China's CPI took a notable dip in January, registering decrease of -0.8% yoy, marking a significant deepening of deflationary pressures from the previous month's -0.3% and falling short of expectation -0.5% yoy. This downturn represents the fourth consecutive negative reading and the most substantial fall observed since 2009, over fourteen years ago.
The decline was particularly pronounced in food prices, which was down -5.9% yoy. Meanwhile, core CPI, which excludes volatile energy and food prices, rose by a modest 0.4% yoy, slowing from December's 0.6% yoy increase. Despite the annual downturn, CPI saw a slight month-on-month increase of 0.3%, albeit below the anticipated 0.4% growth.
The NBS attributed January's inflation figures to the high base effect associated with the Spring Festival, or Lunar New Year, which occurred in January the previous year. This annual holiday, which shifts between January and February depending on the lunar calendar, significantly impacts consumption patterns and inflation metrics due to its influence on consumer spending and business operations.
In parallel, PPI fell by -2.5% yoy in January, showing a modest improvement from the -2.7% yoy observed in the previous month and slightly better than -2.6% forecast. This marks the 16th consecutive month of annual declines for PPI, with factory-gate prices decreasing by -0.2% mom, following -0.3% mom drop in December.
USD/JPY Mid-Day Outlook
Daily Pivots: (S1) 147.79; (P) 148.02; (R1) 148.42; More...
USD/JPY's rally from 140.25 is in progress and intraday bias remains on the upside. Further rally is expected to retest 151.89/93 key resistance zone. Decisive break there will confirm resumption of larger up trend. On the downside, below 147.62 minor support will turn intraday bias neutral first. But near term outlook will remain cautiously bullish as long as 145.88 support holds.
In the bigger picture, fall from 151.89 is seen as a correction to the rally from 127.20, which might have completed at 140.25 already. Firm break of 151.89/93 resistance zone will confirm up trend resumption next target will be 61.8% projection of 127.20 to 151.89 from 140.25 at 155.50. This will now remain the favored case as long as 140.25 support holds.
Economic Indicators Update
| GMT | Ccy | Events | Actual | Forecast | Previous | Revised |
|---|---|---|---|---|---|---|
| 23:50 | JPY | Bank Lending Y/Y Jan | 3.10% | 3.20% | 3.10% | 3.00% |
| 00:01 | GBP | RICS Housing Price Balance Jan | -18% | -28% | -30% | |
| 01:30 | CNY | CPI Y/Y Jan | -0.80% | -0.50% | -0.30% | |
| 01:30 | CNY | PPI Y/Y Jan | -2.50% | -2.60% | -2.70% | |
| 05:00 | JPY | Eco Watchers Survey: Current Jan | 50.2 | 50.3 | 50.7 | |
| 09:00 | EUR | ECB Economic Bulletin | ||||
| 13:30 | USD | Initial Jobless Claims (Feb 2) | 218K | 220K | 224K | 227K |
| 15:00 | USD | Wholesale Inventories Dec F | 0.40% | 0.40% | ||
| 15:30 | USD | Natural Gas Storage | -73B | -197B |
ECB’s Wunsch sees some value to waiting
ECB Governing Council member Pierre Wunsch said today, "I'm on the side of those that believe there's some value to waiting" before cutting interest rates.
Nevertheless, Wunsch also acknowledged the inherent uncertainties in economic forecasting and the eventual need to make decisions based on the best available data. "But again, we won't get full comfort. So at some point, we'll have to look at all the information we have and take a bet," he said.
A critical factor in Wunsch's cautious stance is the current state of wage growth within Eurozone. He pointed out that wage increases are occurring at a pace that may undermine ECB's efforts to bring inflation down to 2% inflation target. Were it not for the uptick in salaries, ECB might already be in a position to initiate monetary easing.
US initial jobless claims falls to 218k, vs exp 220k
US initial jobless claims fell -9k to 218k in the week ending February 3, slightly better than expectation of 220k. Four-week moving average of continuing claims rose 4k to 212k.
Continuing claims fell -23k to 1871k in the week ending January 27. Four-week moving average of continuing claims rose 9.5k to 1850k.
WTI Oil Futures Need One More Confirmation
- WTI oil aims for some recovery but lacks confidence
- Price fluctuates within a bullish channel
- Resistance at 74.40; support at 72.70
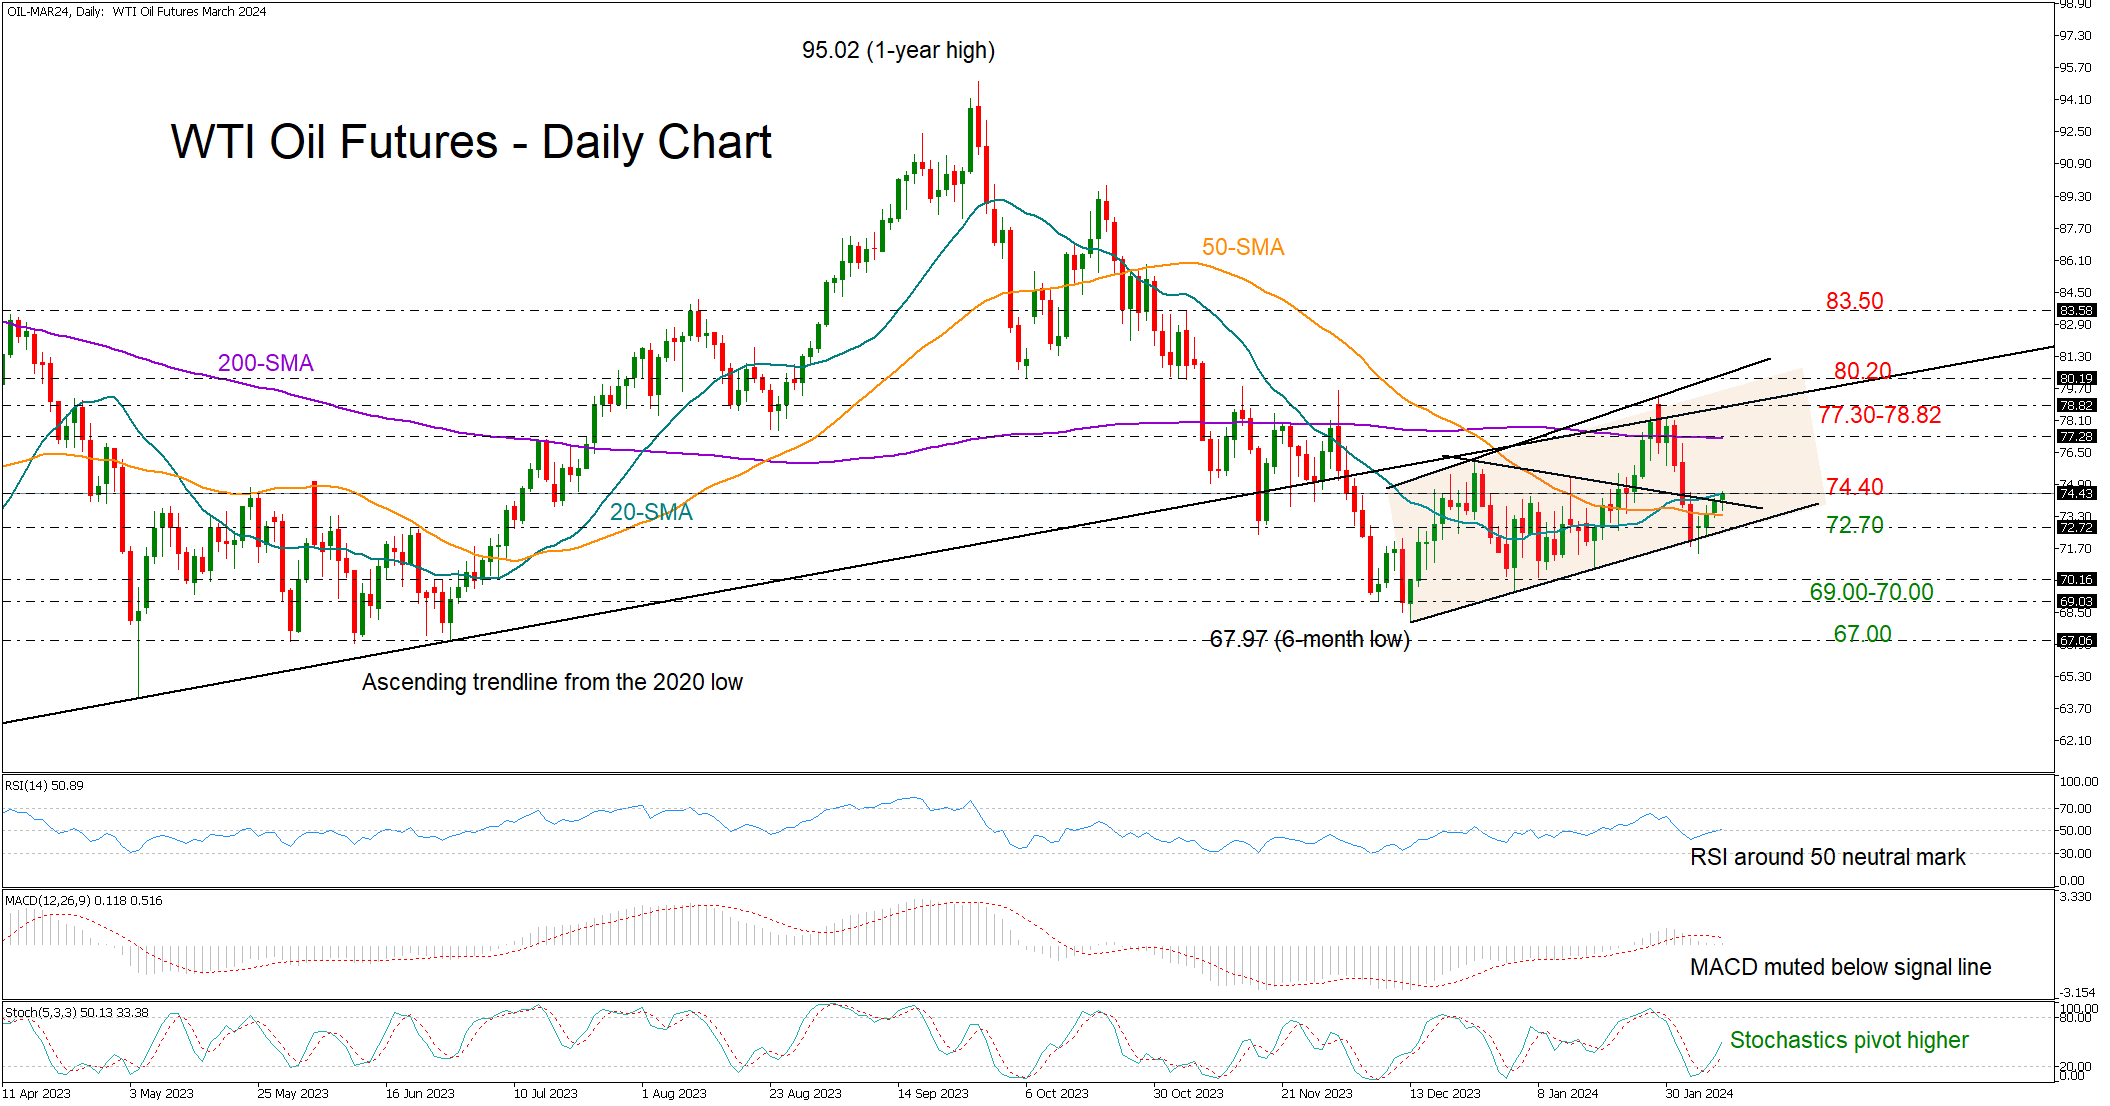
WTI oil futures have been tip-toeing higher after last week’s steep downfall paused at the lower boundary of a short-term bullish channel. The price posted a doji green candlestick on Monday with scope to change direction higher, but gains have been limited so far, and currently constrained below the 20-day simple moving average (SMA) at 74.40.
The technical indicators cannot embrace the latest upturn in the price either. Although the stochastic oscillator has resumed its positive slope, the RSI has yet to cross above its 50 neutral mark, while the MACD hasn't shown signs of improvement, remaining below its red signal line and close to zero.
Should the bulls pierce through the 74.40 area, the 200-day SMA and the long-term ascending trendline could cap upside movements within the 77.30-78.82 region, preventing a test at the upper band of the bullish channel at 80.20. If the price strengthens its uptrend above the channel, resistance could next develop near the 83.50 barrier.
Alternatively, a pullback below the 20-day SMA could re-examine the channel’s lower band around 72.70. A break beneath that threshold could initially stabilize somewhere between 70.00 and 69.00 and then extend towards the 67.00 constraining zone taken from May-June 2023.
Summing up, WTI oil futures cannot promise additional gains in the coming sessions, despite the latest increase in the price. A clear close above 74.00 could stimulate bullish forces, though only a new higher high above 80.00 would upgrade the bullish short-term outook.
AUD/USD Outlook: Dips After Soft China CPI Data
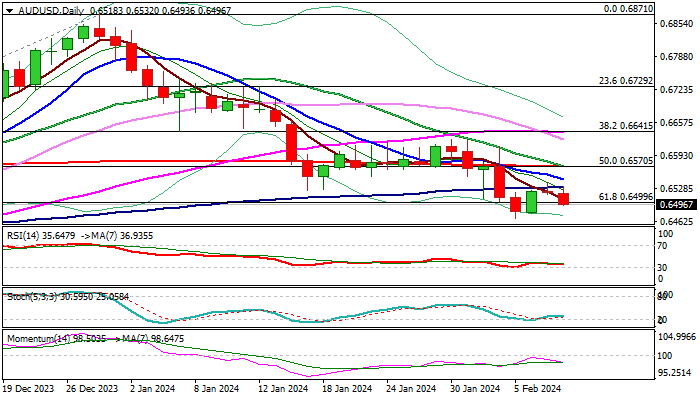
AUDUSD eased below 0.6500 mark (cracked Fibo 61.8% of 0.6270/0.6871 rally) on Thursday, deflated by softer than expected China inflation data.
Fresh weakness emerged after recovery attempts from 0.6468 (new 2024 low, posted on Feb 5) were repeatedly capped by 100DMA (0.6530), keeping the larger bearish technical picture intact.
Daily moving averages remain in full bearish setup, with a double death-cross (10/200 and 20/200DMA’s) adding pressure, along with rising negative momentum.
Bears look for initial signal on daily close below 0.6500 to attack 0.6468 pivot, loss of which would open way for extension towards targets at 0.6411 (Fibo 76.4%) and 0.6338 (Nov 10 low).
Near-term bias to remain with bears as long as 100DMA caps, while break higher would ease bearish pressure and expose the upper pivot at 0.6571 (200DMA / base of thick daily Ichimoku cloud).
Res: 0.6530; 0.6571; 0.6600; 0.6624.
Sup: 0.6468; 0.6411; 0.6351; 0.6338.
Why Are Chinese Stocks Melting Down?
- Chinese stock markets sink to lowest levels in five years
- Real estate crisis and other problems haunt investors
- Valuations are cheap, but more is needed for lasting recovery
Chinese equities implode
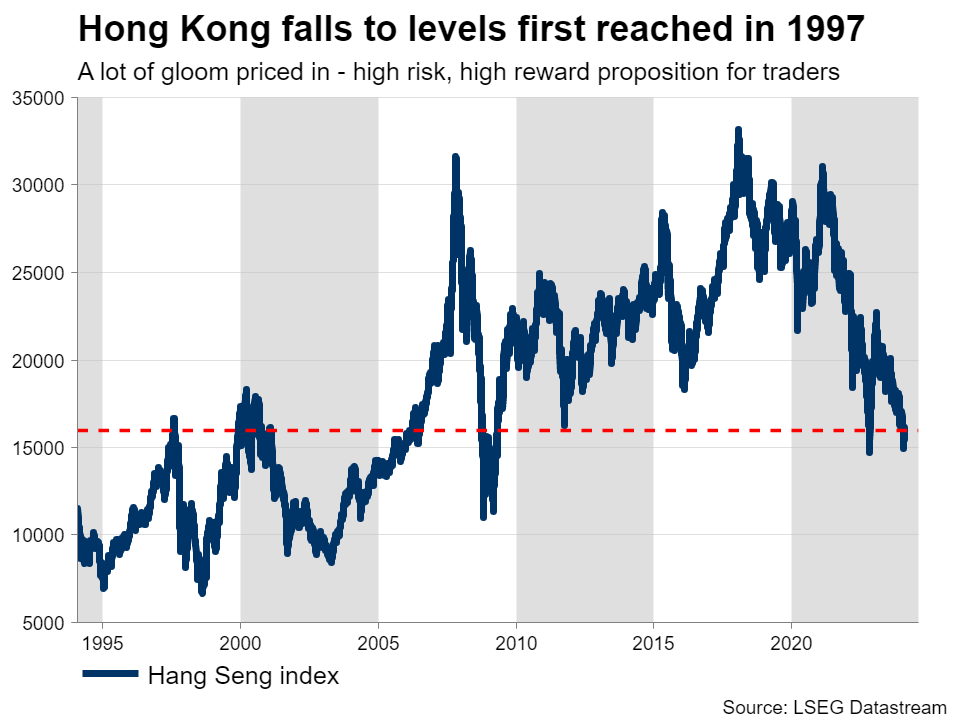
It’s been a tough few years for Chinese stock markets. Shares in mainland China have fallen to their lowest levels since 2019 as investors continue to liquidate their positions, despite a series of stimulus measures by Beijing that were meant to stop the bleeding.
An ongoing crisis in the property sector, a slowdown in global manufacturing, and high youth unemployment have joined forces to hamstring growth, pushing the Chinese economy into deflation. Deteriorating trade relations with the United States have made matters worse, fueling concerns that China is headed for a ‘lost decade’.
In the past, the solution to similar problems was to stimulate the economy, by encouraging local governments and businesses to take on debt and invest in infrastructure projects. Alas, the same trick won’t work this time, as the property sector is already dealing with the toxic aftermath of decades of malinvestment and overinvestment.
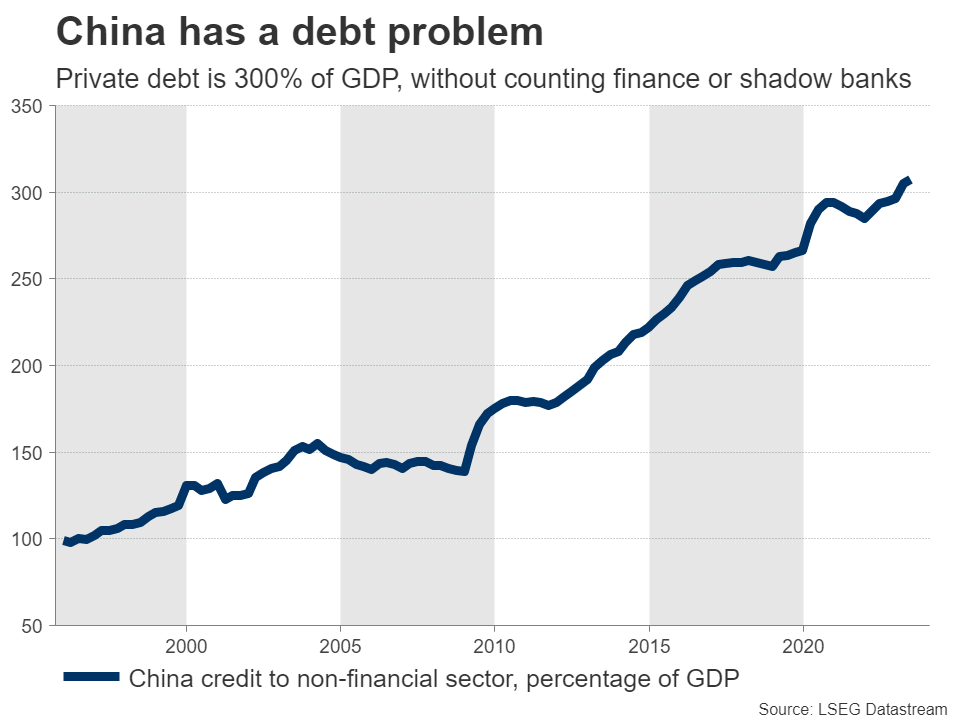
Another issue is that the scope for stimulus measures is limited. Debt in the private sector has skyrocketed to reach 300% of GDP, and that’s without even counting debts of financial institutions or shadow banks. Chinese authorities want to avoid a further increase in debt levels, as that could destabilize the financial system and lead to a deeper crisis.
For similar reasons, the central bank has not slashed interest rates in a meaningful way.
So far, measures have not been enough
Unable to flood the economy with debt-fueled stimulus, Beijing has taken a more cautious approach, announcing a series of piecemeal measures that appear insufficient to turn the tide.
The latest steps include a reduction in the cash that banks must hold in reserve. This is estimated to free up 1 trillion yuan that can be used for lending, which equals nearly 140 billion dollars. In tandem, the government said it will expand access to loans for struggling property developers, to restore confidence in a sector mired in bankruptcy.
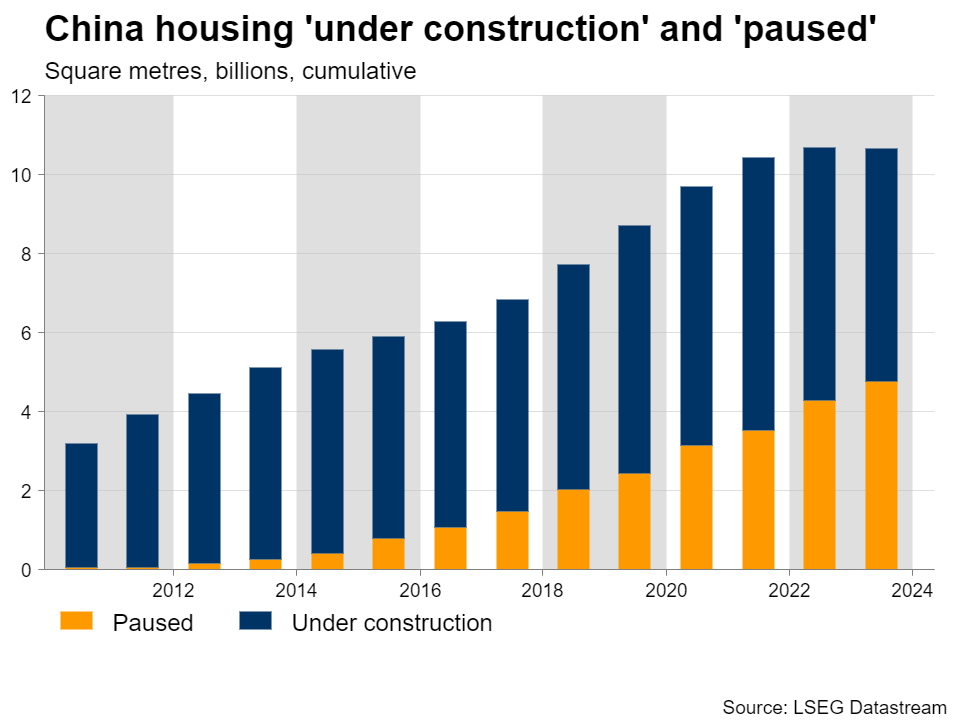
But for the most part, authorities have focused on lifting the stock market. Strict restrictions on short selling have been introduced and recent reports suggest Beijing will deploy about 2 trillion yuan to purchase stocks directly.
Sadly, this rescue package probably lacks the firepower and scope to make a true impact on an economy haunted by plunging investment and depressed consumer sentiment. Throwing money at the stock market could temporarily calm investors, but a lasting recovery will require a turnaround in the real economy.
Valuations are cheap
With stock markets getting hammered, valuations have collapsed. For instance, shares listed in Hong Kong are currently trading for only 7.5 times what analysts expect earnings to be over the next year, which is their cheapest valuation in at least two decades. That’s almost three times as cheap as US equities.
These businesses are not heading for bankruptcy. The biggest among them include Alibaba and Tencent, both of which are highly profitable and regularly return cash to shareholders via dividends and buybacks.
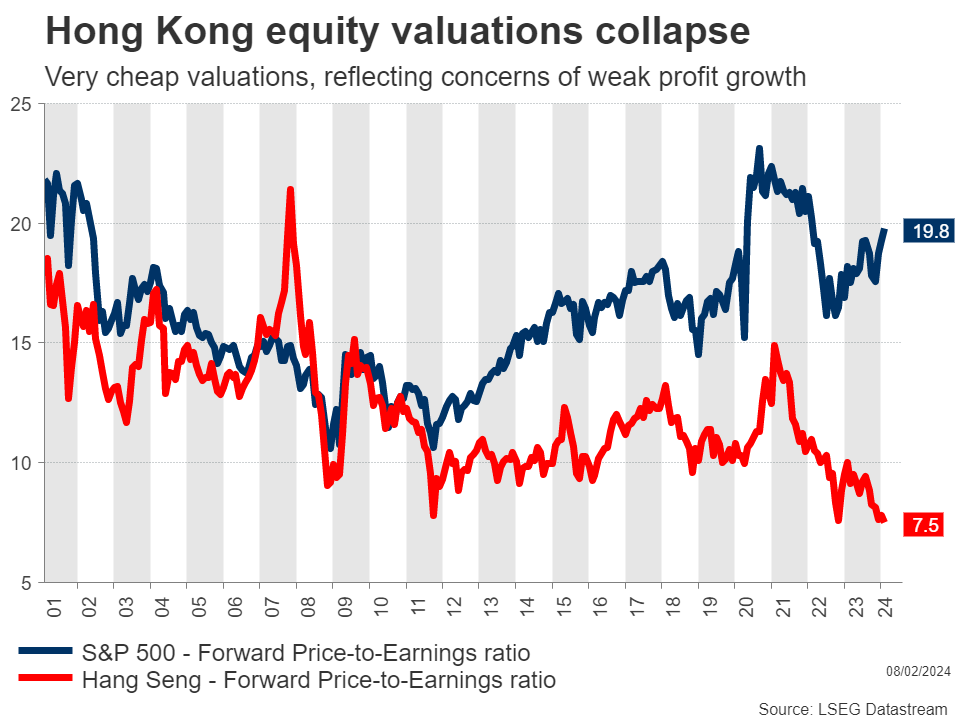
Of course, there’s a reason why valuations are so cheap. Weak prospects for future profit growth, sudden regulatory crackdowns, and a general lack of investor protection have eroded confidence in Chinese assets. It’s going to take more than cheap valuations to solve that.
There are several other threats too. Another trade war could ensue if Trump is elected US president in November, as he has already promised new tariffs against China. Not to mention the risk that Beijing might let the yuan depreciate if the economy worsens.
The bottom line
Bearing all this in mind, the outlook for Chinese assets is not very bright. The housing sector will probably need several years to recover, judging by other countries that saw similar property collapses, such as Japan in the 1990s and the United States after 2008. That could restrict growth, especially in the absence of ‘bazooka-style’ stimulus.
That said, much of this pessimism is already reflected in depressed valuations. With so much gloom priced into Chinese equities, any piece of good news could have a disproportionately large impact. Therefore, Chinese markets offer a high-risk, high-reward proposition for traders.
The middle ground would be to focus on quality businesses. Companies such as Tencent are still growing earnings at a rapid pace, yet their share price has been slammed lower with the rest of the market and their valuations are as cheap as they have ever been.
In other words, shares of quality companies have suffered collateral damage, which might present an opportunity for brave investors. Ultimately though, the road to a sustained stock market recovery will be long and will almost certainly require more forceful steps from Chinese authorities.