

Sample Category Title
GBP/USD Daily Outlook
Daily Pivots: (S1) 1.2599; (P) 1.2620; (R1) 1.2650; More...
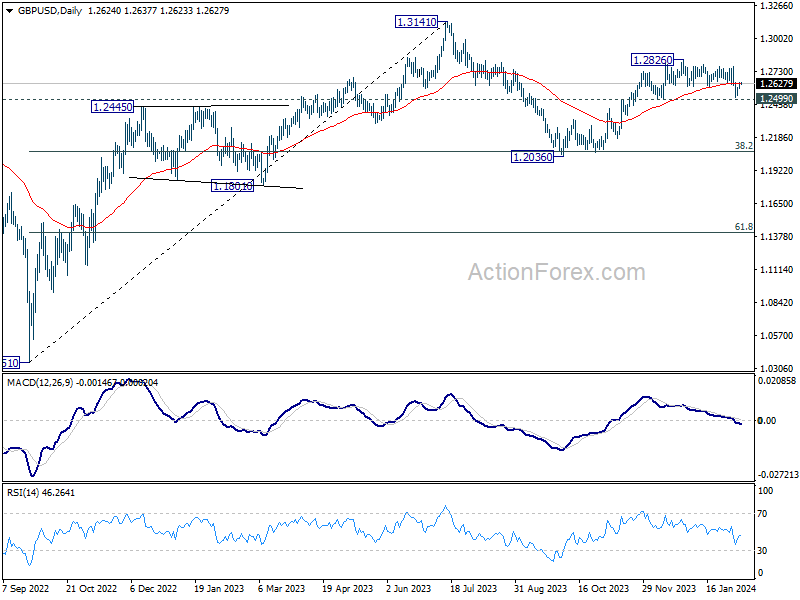
Intraday bias in GBP/USD remains mildly on the upside. Correction from 1.2826 might have completed with three waves down to 1.2517. Further rise would be seen to retest 1.2826 high. On the downside, however, decisive break of 1.2499 will argue that whole rise from 1.2036 has completed and turn near term outlook bearish.
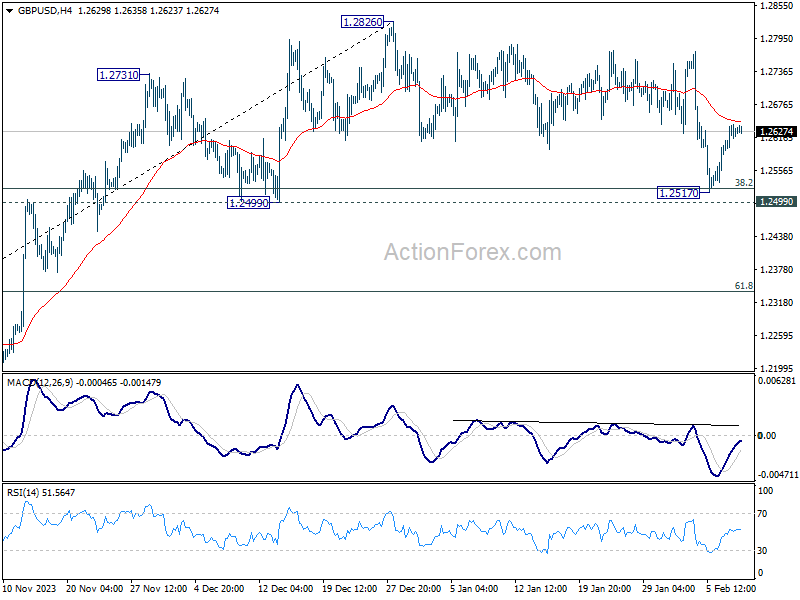
In the bigger picture, price actions from 1.3141 medium term top are seen as a corrective pattern to up trend from 1.0351 (2022 low). Rise from 1.2036 is seen as the second leg that's still in progress. Upside should be limited by 1.3141 to bring the third leg of the pattern. Meanwhile, break of 1.2499 support will argue that the third leg has already started for 38.2% retracement of 1.0351 (2022 low) to 1.3141 at 1.2075 again.
USD/CHF Daily Outlook
Daily Pivots: (S1) 0.8706; (P) 0.8730; (R1) 0.8770; More....
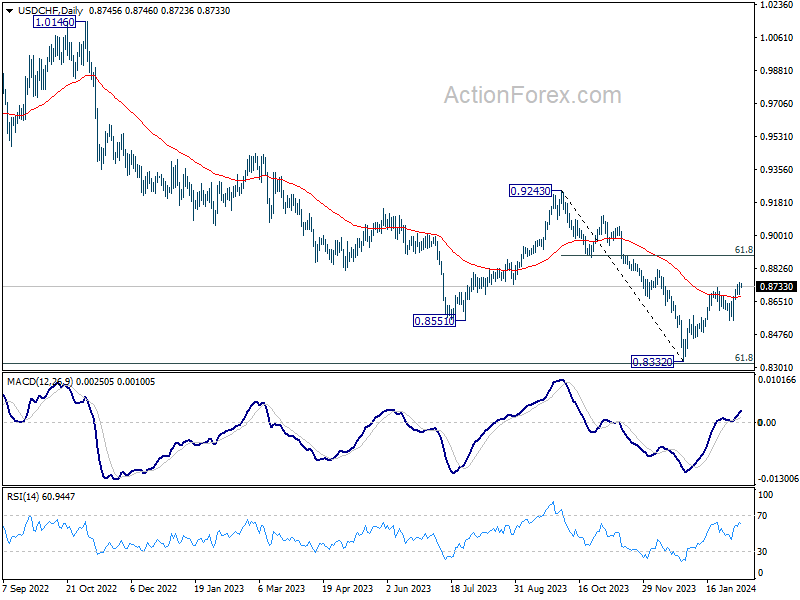
USD/CHF's rally from 0.8332 resumed after brief retreat, and intraday bias is back on the upside. Further rally should be seen to 61.8% retracement of 0.9243 to 0.8332 at 0.8995 next. On the downside, break of 0.8550 support is needed to indicate completion of the rebound. Otherwise, further rise is still expected in case of retreat.
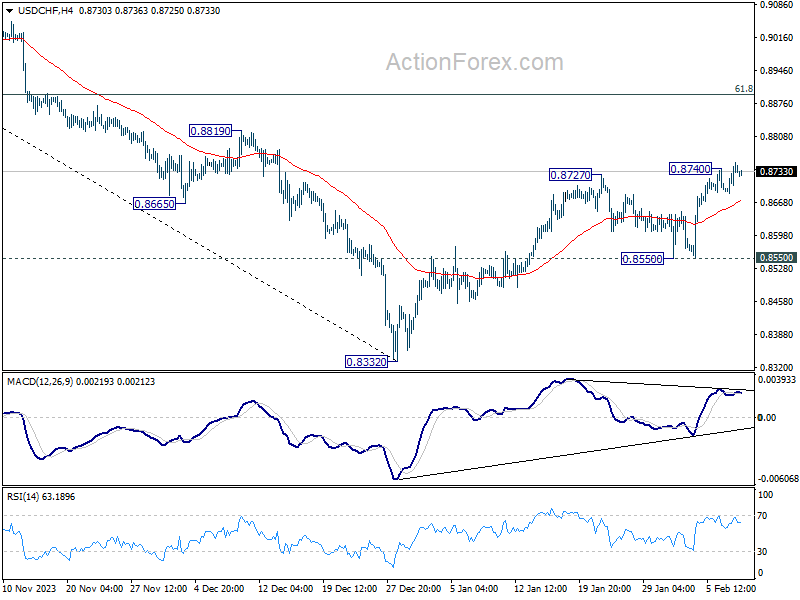
In the bigger picture, there is prospect of medium term bottoming at 0.8332 considering possible bullish convergence condition in W MACD, and the support from 0.8317 long term fibonacci support. Sustained trading above 55 D EMA (now at 0.8677) will affirm this case, and bring stronger rise back towards 0.9243 resistance, even as a corrective move.
AUD/USD Daily Report
Daily Pivots: (S1) 0.6511; (P) 0.6526; (R1) 0.6535; More...
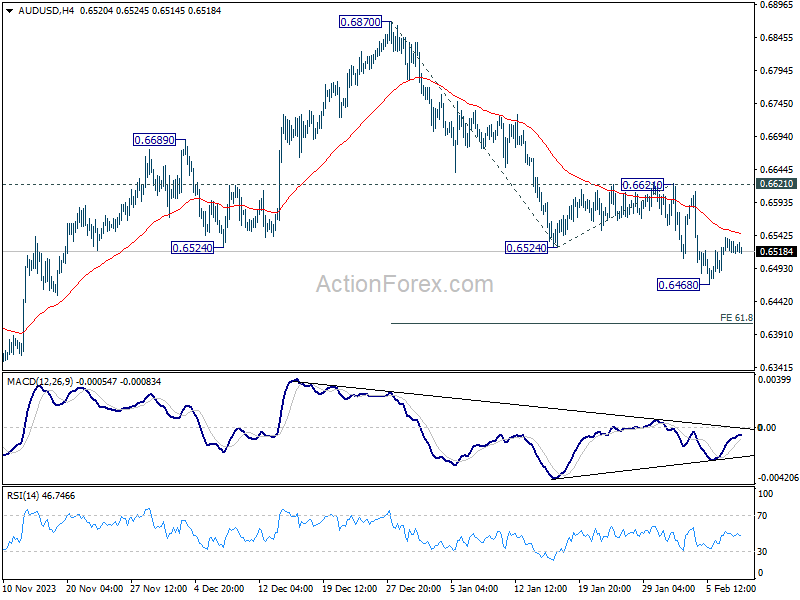
Intraday bias in AUD/USD remains neutral as consolidation from 0.6468 is extending. Stronger recovery cannot be ruled out, but outlook will stay bearish as long as 0.6621 resistance holds. On the downside, break of 0.6468 will resume the fall from 0.6870, as part of the down trend from 0.7156, to 61.8% projection of 0.6870 to 0.6524 from 0.6621 at 0.6407 next.
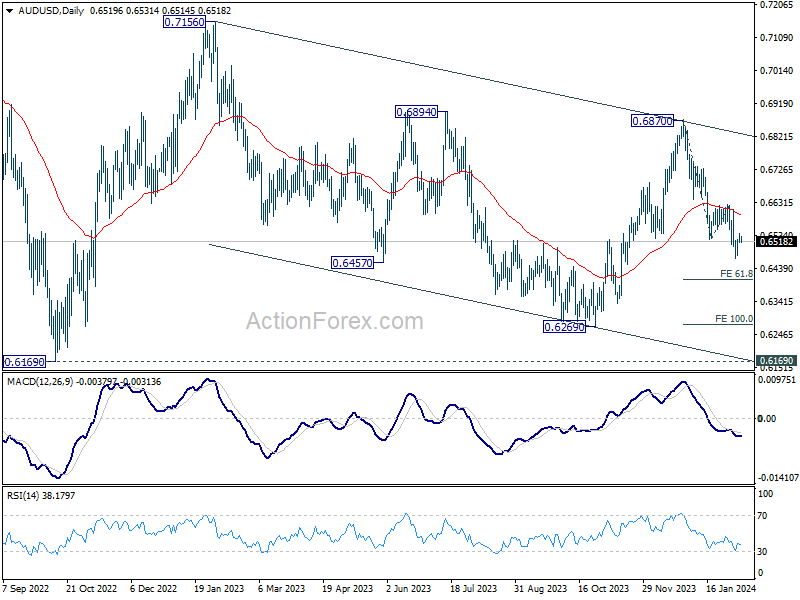
In the bigger picture, price actions from 0.6169 (2022 low) are seen as a medium term corrective pattern to the down trend from 0.8006 (2021 high). Fall from 0.7156 (2023 high) is seen as the second leg, which might still be in progress. Overall, sideway trading could continue in range of 0.6169/7156 for some more time. But as long as 0.7156 holds, an eventual downside breakout would be mildly in favor.
USD/CAD Daily Outlook
Daily Pivots: (S1) 1.3445; (P) 1.3472; (R1) 1.3488; More...
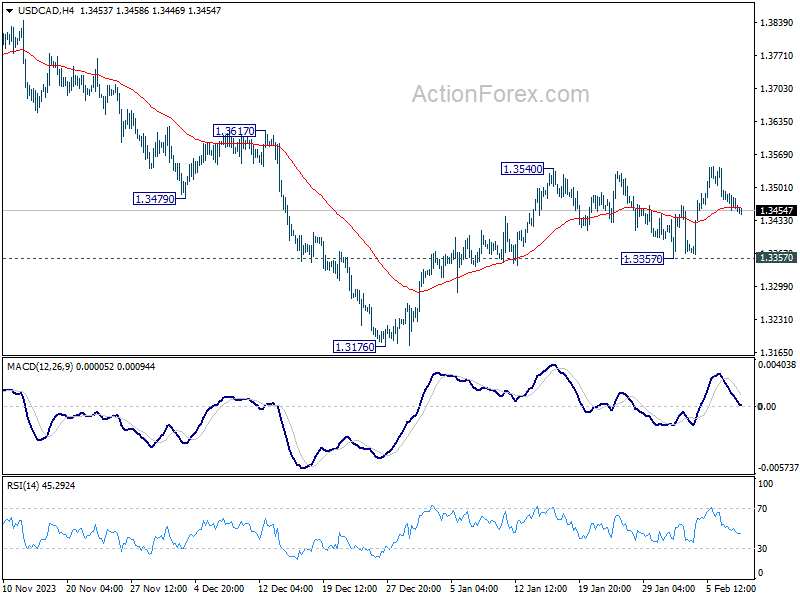
Intraday bias in USD/CAD remains neutral for the moment as sideway trading continues. On the upside, break of 1.3540 will resume the rise from 1.3176. That will also revive that case that whole fall from 1.3897 has completed, and target this resistance. Nevertheless, firm break of 1.3357 support will argue that rebound from 1.3176 has completed, and target this low for resuming whole fall from 1.3897.
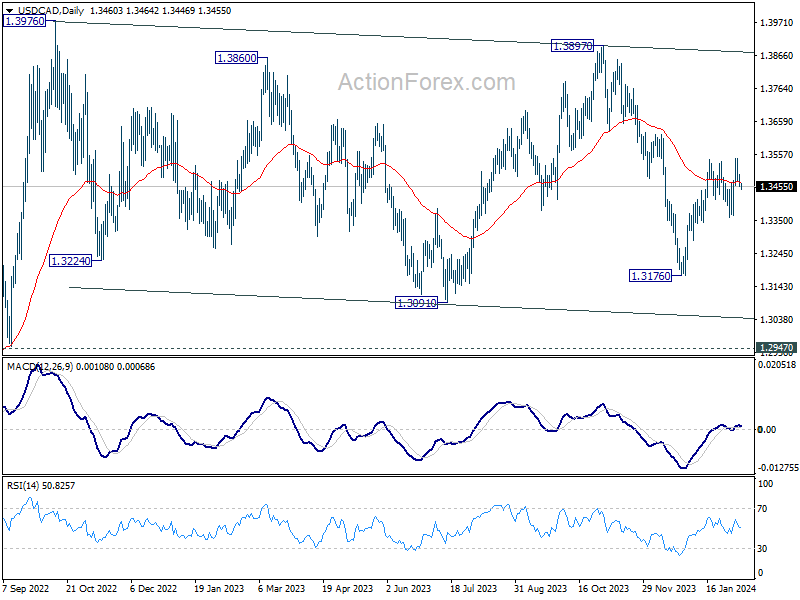
In the bigger picture, price actions from 1.3976 (2022 high) are viewed as a corrective pattern only. In case of another fall, strong support should emerge above 1.2947 resistance turned support to bring rebound. Overall, larger up trend from 1.2005 (2021 low) is still expected to resume through 1.3976 at a later stage.
EUR/GBP Daily Outlook
Daily Pivots: (S1) 0.8517; (P) 0.8530; (R1) 0.8543; More...
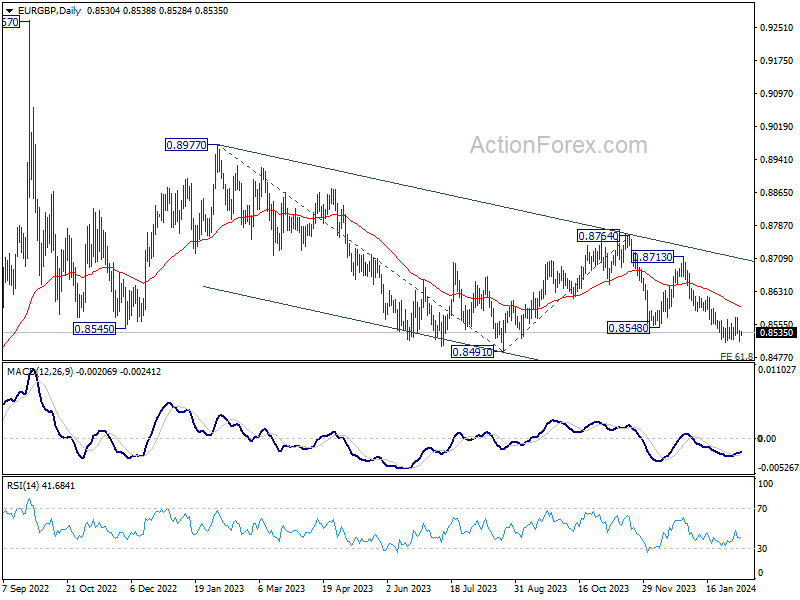
EUR/GBP recovered ahead of 0.8512 support, and intraday bias remains neutral. Further decline is expected with 0.8591 resistance intact. On the downside, below 0.8512 will resume the fall from 0.8713 to 0.8491, and then 0.8464 projection level. However, firm break of 0.8591 will turn bias back to the upside for stronger rebound.
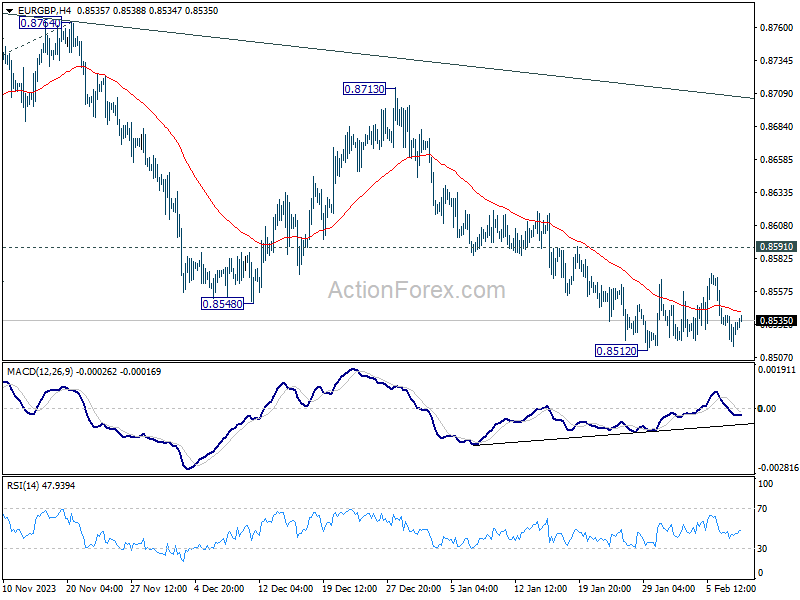
In the bigger picture, fall from 0.8764 is seen as another leg in the whole down trend from 0.9267 (2022 high). Outlook will stay bearish as long as 0.8713 resistance holds. Break of 0.8491 will target 61.8% projection of 0.8977 to 0.8491 from 0.8764 at 0.8464.
EUR/AUD Daily Outlook
Daily Pivots: (S1) 1.6476; (P) 1.6504; (R1) 1.6551; More...
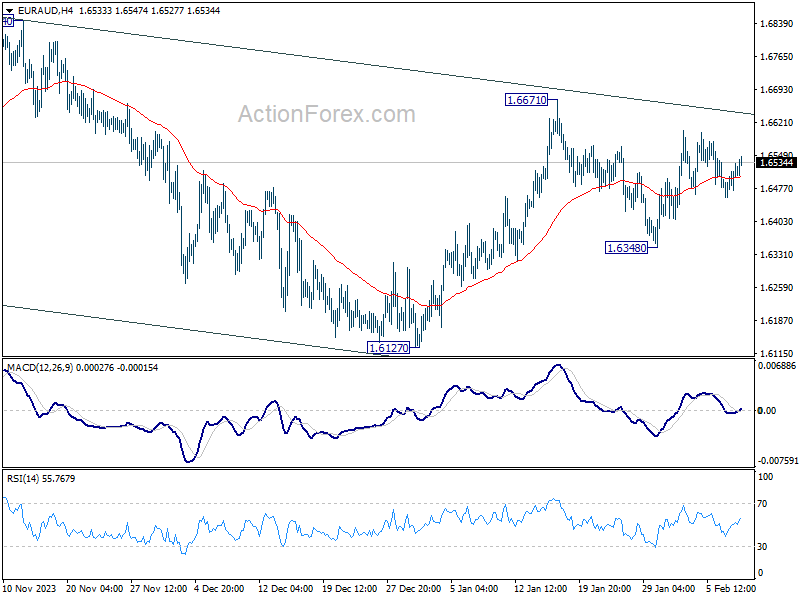
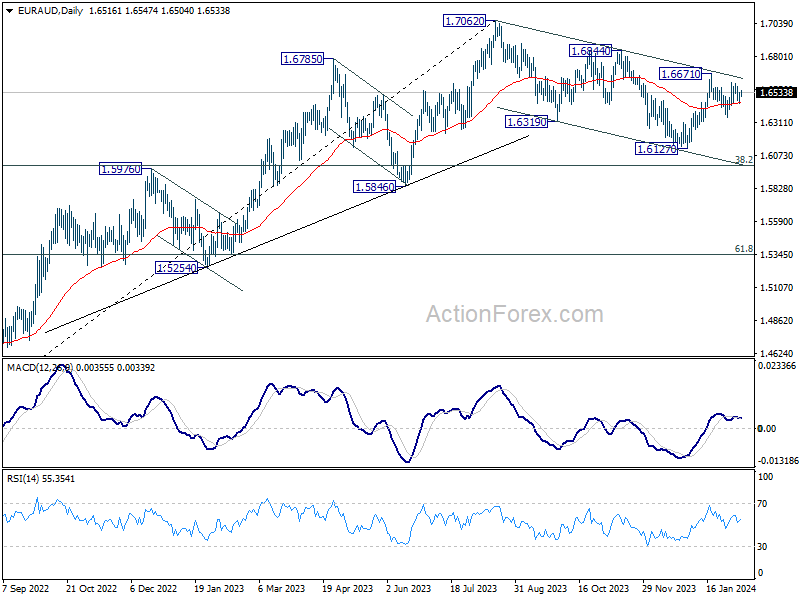
EUR/AUD is still bounded in range trading and intraday bias stays neutral. On the upside, decisive break of 1.6671 will revive the case that whole correction from 1.7062 has completed with three waves down to 1.6127. Further rally should then be seen to 1.6844 resistance for confirmation. Nevertheless, break of 1.6438 will bring deeper fall back to 1.6127 support instead.
In the bigger picture, fall from 1.7062 medium term top is seen as correction to the up trend from 1.4281 (2022 low). Break of 1.6844 resistance will argue that this up trend is ready to resume through 1.7062 high. In case of another fall, strong support should be seen around 1.5846 and 38.2% retracement of 1.4281 to 1.7062 at 1.6000 to bring rebound.
EUR/CHF Daily Outlook
Daily Pivots: (S1) 0.9375; (P) 0.9399; (R1) 0.9448; More...
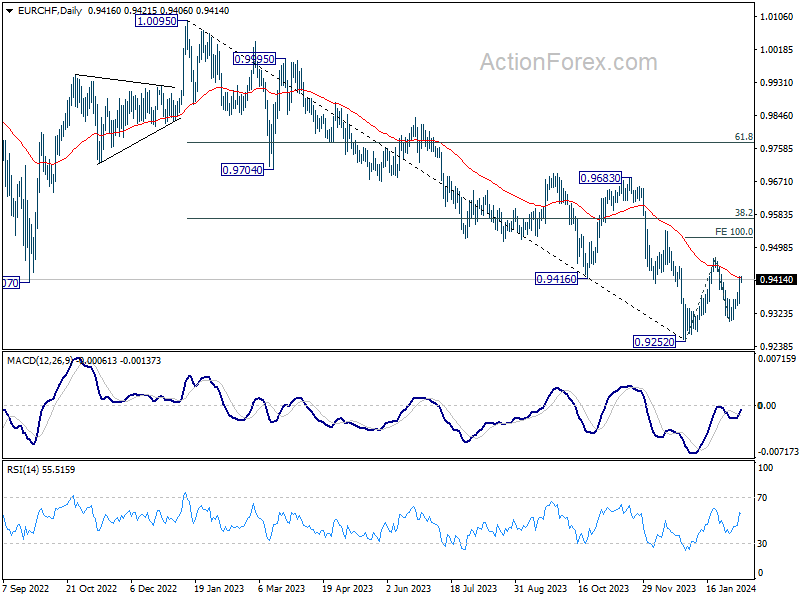
Intraday bias in EUR/CHF stays on the upside for 0.9471 resistance. Firm break there will resume whole rebound from 0.9252. Next target is 100% projection of 0.9252 to 0.9471 from 0.9304 at 0.9523. On the downside, below 0.9376 minor support will turn intraday bias neutral first.
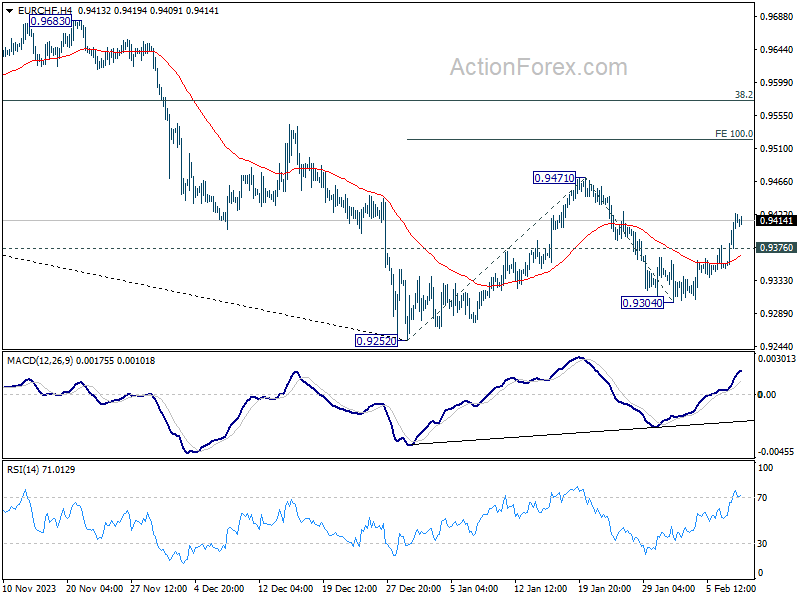
In the bigger picture, price actions from 0.9252 are tentatively seen as a correction to the five-wave down trend from 1.0095 (2023 high). Further rise would be seen to 38.2% retracement of 1.0095 to 0.9252 at 0.9574. But overall medium term outlook will remain bearish as long as 0.9683 resistance holds.
EUR/JPY Daily Outlook
Daily Pivots: (S1) 159.12; (P) 159.43; (R1) 159.94; More...
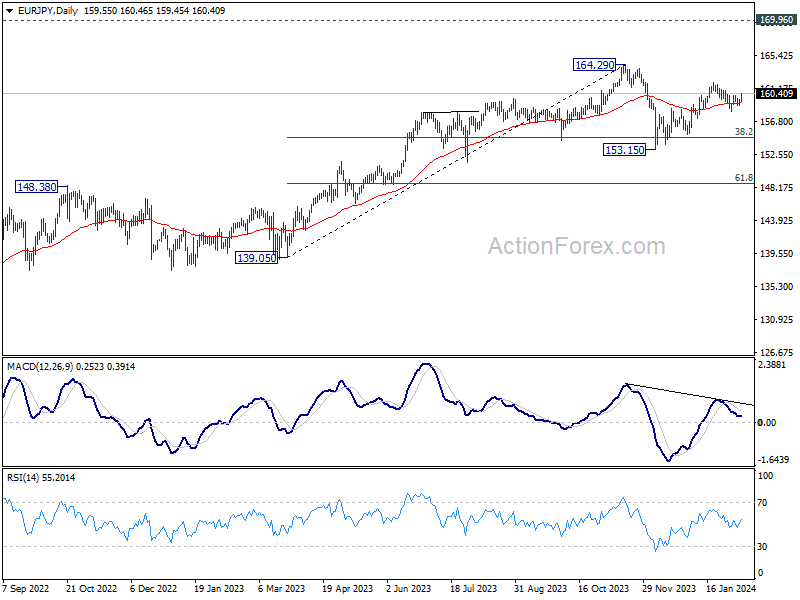
Intraday bias in EUR/JPY is back on the upside with break of 160.25 minor resistance. Further rise should be seen to 161.84 resistance first. Firm break there will target 164.29 high. For now, further rally is expected as long as 158.06 support holds, in case of recovery.
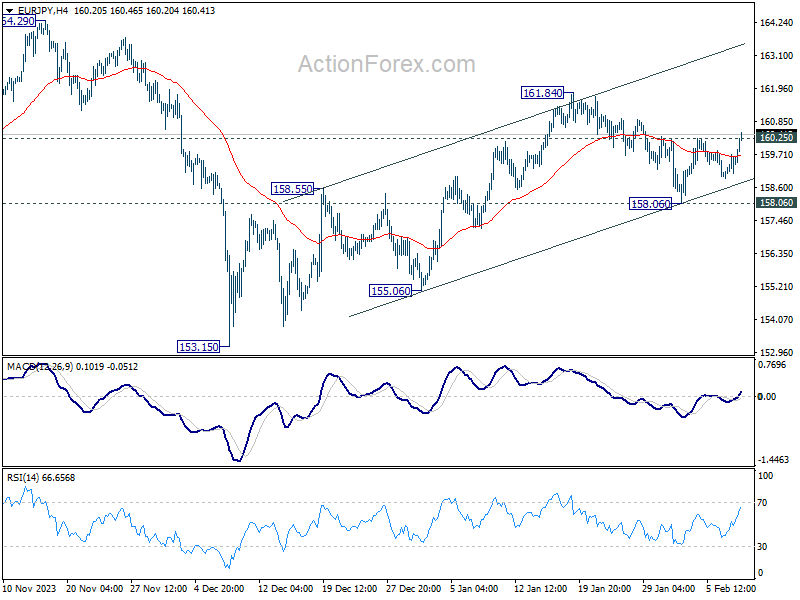
In the bigger picture, price actions from 164.29 medium term top are seen as a correction to rise from 139.05 only. As long as 148.38 resistance turned support holds (2022 high), larger up trend from 114.42 (2020 low) is expected to resume through 164.29 at a later stage.
Euro Doesn’t Give the Impression to be Able to Really Profit from (Temporary) USD Softness
Markets
US and European bond yields both ‘rebounded’ 2-3 bps yesterday after Tuesday correction. YTD peak which came within reach after Monday’s strong US services ISM for now prove to be a too high hurdle. Fed Speakers (Kugler, Collins, Barkin, Kashkari) gave small nuances on the mantra that inflation is cooling, but that more evidence is needed to start lowering rates somewhere later this year. For now, tensions at some regional US Banks are not a major topic in the official Fed communication. Still it remains a risk for the Fed to step in earlier than what is guided for now. This maybe also be why markets don’t rule out the option of a May rate cut that easily. The issue is also reaching some banks in Europe and Japan, but for now remains a secondary theme for markets. The S&P 500 yesterday even touched a new all-time record close (+0.85% and almost touching the psychological barrier of 5000). After a poor open, the US regional bank index (KWB) also regained some ground after a negative open. Still the issue deserves to keep an eye on. The record $42bn sale of 10y US Treasury notes met with solid investor demand. Investors apparently see recent price concessions as an opportunity to step in. On FX markets, the dollar ceded slightly further ground, but with no major technical impact. DXY closed just below 104 (103.94). EUR/USD extended its rebound off the 1.0724 support (close 1.077), but the euro doesn’t give the impression to be able to really profit from (temporary) USD softness. USD/JPY was the exception as it is again nearing the 148.84/89 YTD peak levels. Sterling remained in good shape (close 0.8531), but the key 0.8493 support stays out of reach.
Asian equities show a mixed picture this morning, with Japan and Korea outperforming. Chinese markets (CSI 300) basically are hovering sideways going into the Lunar New Year Holidays starting tomorrow. BOJ Deputy Governor Shinichi Uchida in a speech indicated that even if the BoJ were to end its negative policy rate policy, it is very unlikely that it will raise interest rates rapidly. Markets drew some comfort from the Uchida comments (Nikkei +2%, USD/JPY rising). Even so, the comments implicitly suggest that a first rate hike is coming (very?) close. Later today, the calendar is again thin with the US jobless claims and the sale of $25bn 30y US Treasury bonds the exception. Central bank speakers include ECB’s Wunch, BoE’s Catherine Mann, ECB’s Lane and Fed Barkin. We also keep an eye at the policy decision of the Czech national bank.
News & Views
Chinese consumer prices dropped for a fourth month straight in January. The accelerated pace of -0.8% y/y is the fastest since September 2009 and more than the -0.5% expected. Food was still weighed heavily (-5.9%) on the headline number. Excluding for this as well as energy, core inflation rose 0.4% but that as well was a further deceleration from the 0.6% the month before. Persistent deflationary pressures are also seen in factory gate inflation, which has remained in sub-zero territory since October 2022. The numbers once again raise pressure on authorities to step up policies and revive aggregate demand that’s buckled under weak consumer confidence and private debt. Several measures have been announced in recent months but none of them have the shock-and-awe effect that’s probably needed to kickstart the economy. USD/CNY this morning opened weaker but pared the minor gains quickly after. The pair is currently trading around recent highs just south of 7.20.
The US Congressional Budget Office yesterday projected the country’s deficit to soar by about two-thirds in the next 10 years, bringing it from $1.6tn this year to $2.6tn. In terms of GDP, this means going from 5.6% to 6.1%. The director of the non-partisan organization said interest payments would account for about 75% of the deficit’s rise with the average rate seen advancing to 3.4% over that period. Net interest payments will climb to 3.1% of GDP next year, that’s the highest since recording began in 1940, and will hit 3.9% in 2034. The CBO sees US debt piling up to more than 100% of GDP in 2025 and then further to 116% in 2034..
A Modest Sliver Lining for China and Hong Kong Stock Markets
- China’s CPI continued to deflate in January to -0.8% y/y from -0.3% y/y in December 2023 while the pace of contraction has slowed slightly in PPI (factory gate prices) to -2.5% y/y from -2.7% y/y in December.
- The spread of PPI over CPI has widened which in turn may see a turnaround in the current negative profitability growth rate of China’s industrial enterprises.
- Technical analysis suggests the minor countertrend rally in the Hang Seng Index may extend.
Since the start of this week, the China and Hong Kong stock markets have rallied after one of the benchmark China stock indices sank to a 5-year low due to more forceful measures that clamped down on short-selling activities and President Xi’s in-person meeting with the China Securities Regulatory Commission that led to the intermediate replacement of the regulator party chief yesterday, 7 February.
The involvement of President Xi, the pinnacle of China’s top policymakers in an attempt to stop the rout that has wiped out close to US$7 trillion in market capitalization of the China and Hong Kong stock markets since the highs in 2021; has sent a potential signal to the markets that a stock market stabilization fund is likely to be announced soon after an idea of it backed by a fund size of US$278 billion from offshore accounts of Chinese state-owned enterprises was floated two week ago.
The benchmark CSI 300 Index has gained by +4.6% week-to-date as of 8 February at this time of the writing, similar positive movements are seen in the Hong Kong benchmark stock indices as well over the same period; Hang Seng Index (+2.6%), Hang Seng TECH Index (4.5%), and Hang Seng China Enterprises Index (+3.1%).
Previous attempts to shore up investors’ confidence over the past 12 months via piecemeal stimulus and policies have failed to enact sustainable bullish movements in the China and Hong Kong stock benchmark indices other than several bouts of “dead cat bounces”.
A silver lining within the deflationary forces
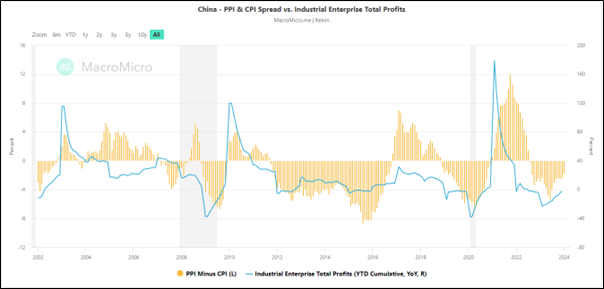
Fig 1: China PPI/CPI spread with Industrial Enterprise Total Profits as of Jan 2024 (Source: MacroMicro, click to enlarge chart)
Can this time round be different? The answer lies with the crux of the problem, the heightened deflationary risk spiral via the wealth effect destruction from a persistently weak property market in China.
No doubt, the latest data has indicated further weakness in consumer prices where the monthly CPI inflation rate for January has further decelerated in the negative territory to -0.8% y/y from -0.3% y/y in December 2023, its longest stretch of contraction since October 2009, and below consensus of -0.5% y/y.
On a slightly positive note, China’s producer prices have continued to fall for the 16th consecutive month but at a slower pace where PPI for January came in at -2.5% y/y, above -2.7% y/y in December, and consensus of -2.6% y/y, notching its softest drop in four months.
Given the slower pace of contraction in PPI, the spread between PPI and CPI has widened significantly in the past six months to -1.70 in January from -3.10 printed in August 2023.
This spread can be used as a proxy to measure the profitability of China’s industrial enterprises. A widening of the spread below zero is likely to indicate some form of recovery or turnaround in the current negative profitability growth of industrial enterprises. The cumulative Industrial Enterprise Total Profits y/y trend has indeed shown modest signs of recovery in the past six months; improving from -15.50% y/y recorded in July 2023 to -2.30% y/y in December 2023 (see Fig 1).
If the spread of PPI and CPI continues to widen, it may reduce the current bout of deflationary forces which in turn ignite more confidence in the stock market that potentially led to more pronounced countertrend rallies.
That said, consumer and business sentiment in China also needs to improve significantly to inspire major multi-month bullish trends to kickstart in the China and Hong Kong stock markets where the required catalysts are direct fiscal stimulus measures to boost spending which are lacking at this juncture.
Minor countertrend rally may extend in Hang Seng Index
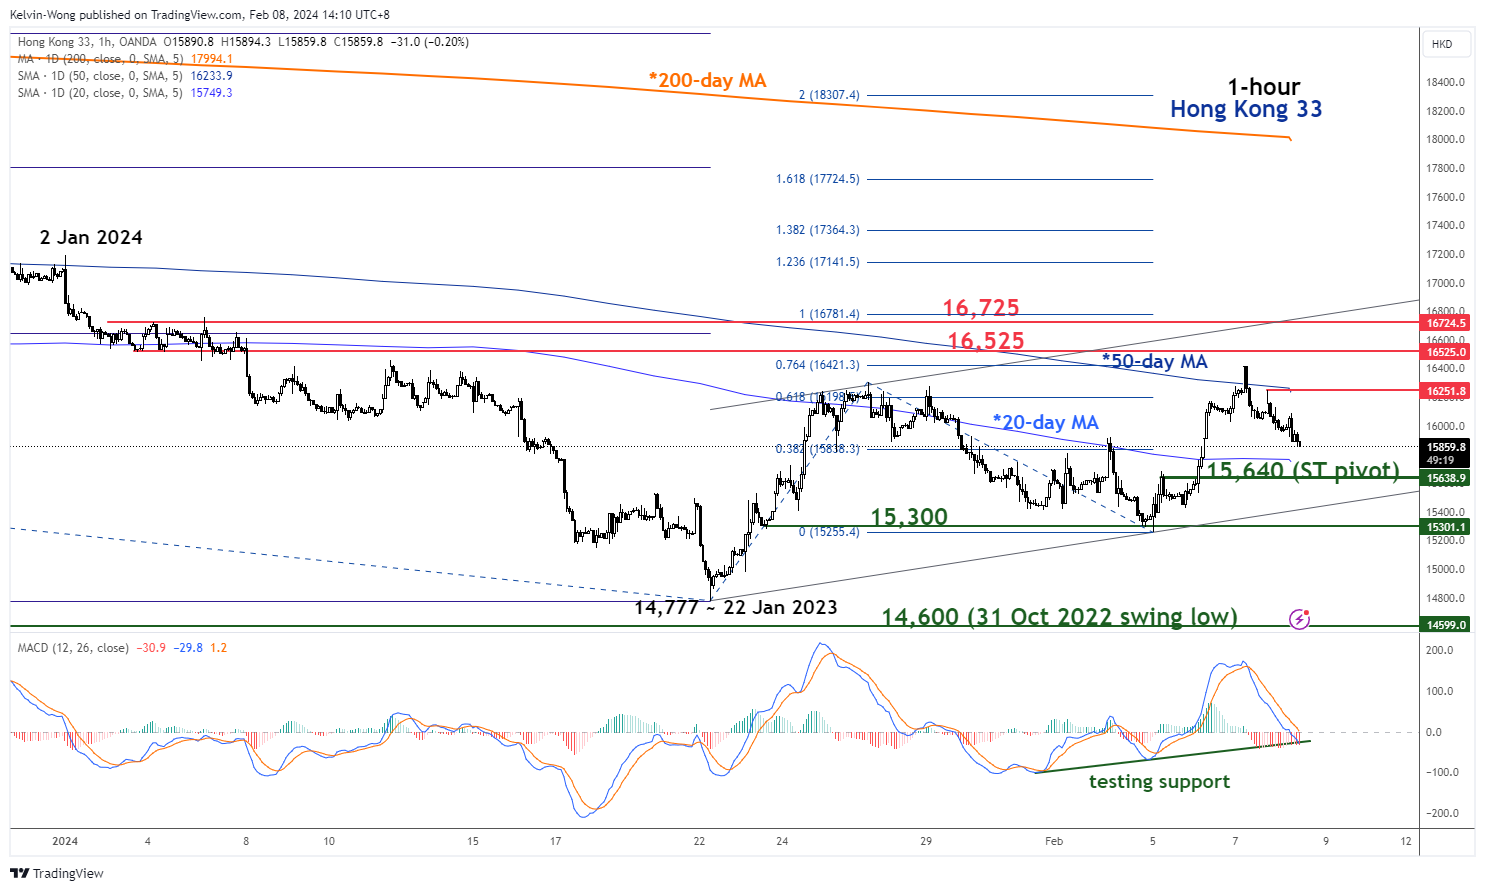
Fig 2: Hong Kong 33 short-term trend as of 8 Feb 2024 (Source: TradingView, click to enlarge chart)
The price actions of the Hong Kong 33 Index (a proxy of the Hang Seng Index futures) have shed -3.5% in the past session from an intraday high of 16,420 printed yesterday, 7 February.
There are still several positive short-term technical elements to note; the current price action of the Index is still oscillating above its 20-day moving average, and the hourly MACD trend indicator has dipped down to retest its ascending support which in turn may translate into a bullish inflection for price actions.
Watch the 15,640 key short-term pivotal support (close to the 20-day moving average & 61.8% Fibonacci retracement of the prior minor rally from the 5 February low to 7 February high) and clearance above the near-term resistance of 16,250 (also the 50-day moving average) may see the next intermediate resistance coming in at 16,525/16,725 (upper boundary of the minor ascending channel from 22 January low & 4/5 January minor swing highs area).
However, failure to hold at 15,640 invalidates the bullish tone for a further slide to expose the next intermediate support at 15,300. Failure to hold at 15,300 increases the risk of a retest on the major support of 14,600.