Sample Category Title
EUR/USD Technical Analysis Forecast Ahead of FOMC
This week is loaded with critical economic releases, keeping markets on edge. We have FOMC rate decisions, Nonfarm Payrolls, and inflation numbers, to name a few. This comes as investors remain divided on the FED’s rate cut path for 2024. Many analysts and investors see that the robust consumer spending and declining inflation are enough reasons for the FED to begin their rate cut cycle as early as March 2024. On the other hand, others are concerned about the risks, arguing that inflation may start rising again, derailing the robust consumer spending, thus suggesting that the first 25 bps rate cut may be better delayed till June or July 2024. The risks that may lead to inflation remaining high may arise for multiple reasons, including but not limited to shipping disruptions leading to higher costs and/or shortage of raw materials.
US inflation indicators continued their decline, bringing inflation closer to the FED’s target of 2%. According to the latest analyst surveys from Bloomberg Financials, the declining trend is expected to remain; the forecasted CPI (YoY%) for 2024 is 2.7% and 2.3% in 2025, down from its latest reading of 3.4% for 2023.
Source: CME Group
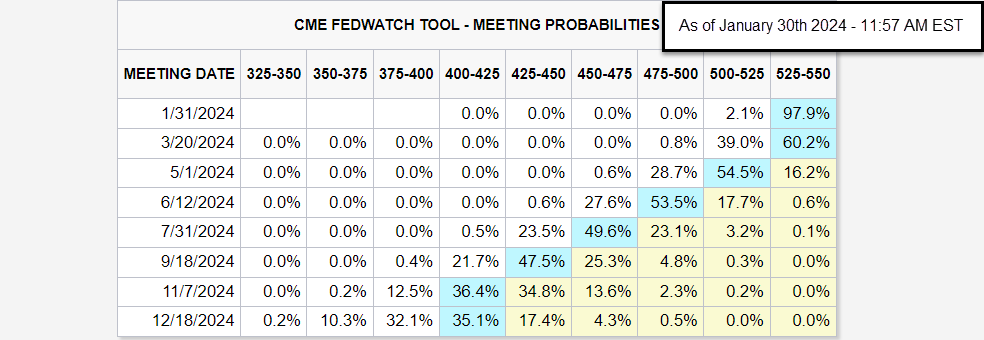
According to the most recent review of the CME FedWatch tool, 97.9% of market participants anticipate interest rates to remain at their current level of 525-550 for the meeting on January 31st, 2024, the expectation for a 25-basis points rate cut for the March 20th meeting is down from last week’s 50.0% to 39.0% today. As for the May 1st, 2024, Fed’s meeting, the percentage of two 25-basis points rate cuts dropped from 40.1% last week to 28.7%. The probability of two 25-basis points cuts for June 12th, 2024, FED’s meeting currently stands at 53.5%.
Daily Chart
Source: TradingView
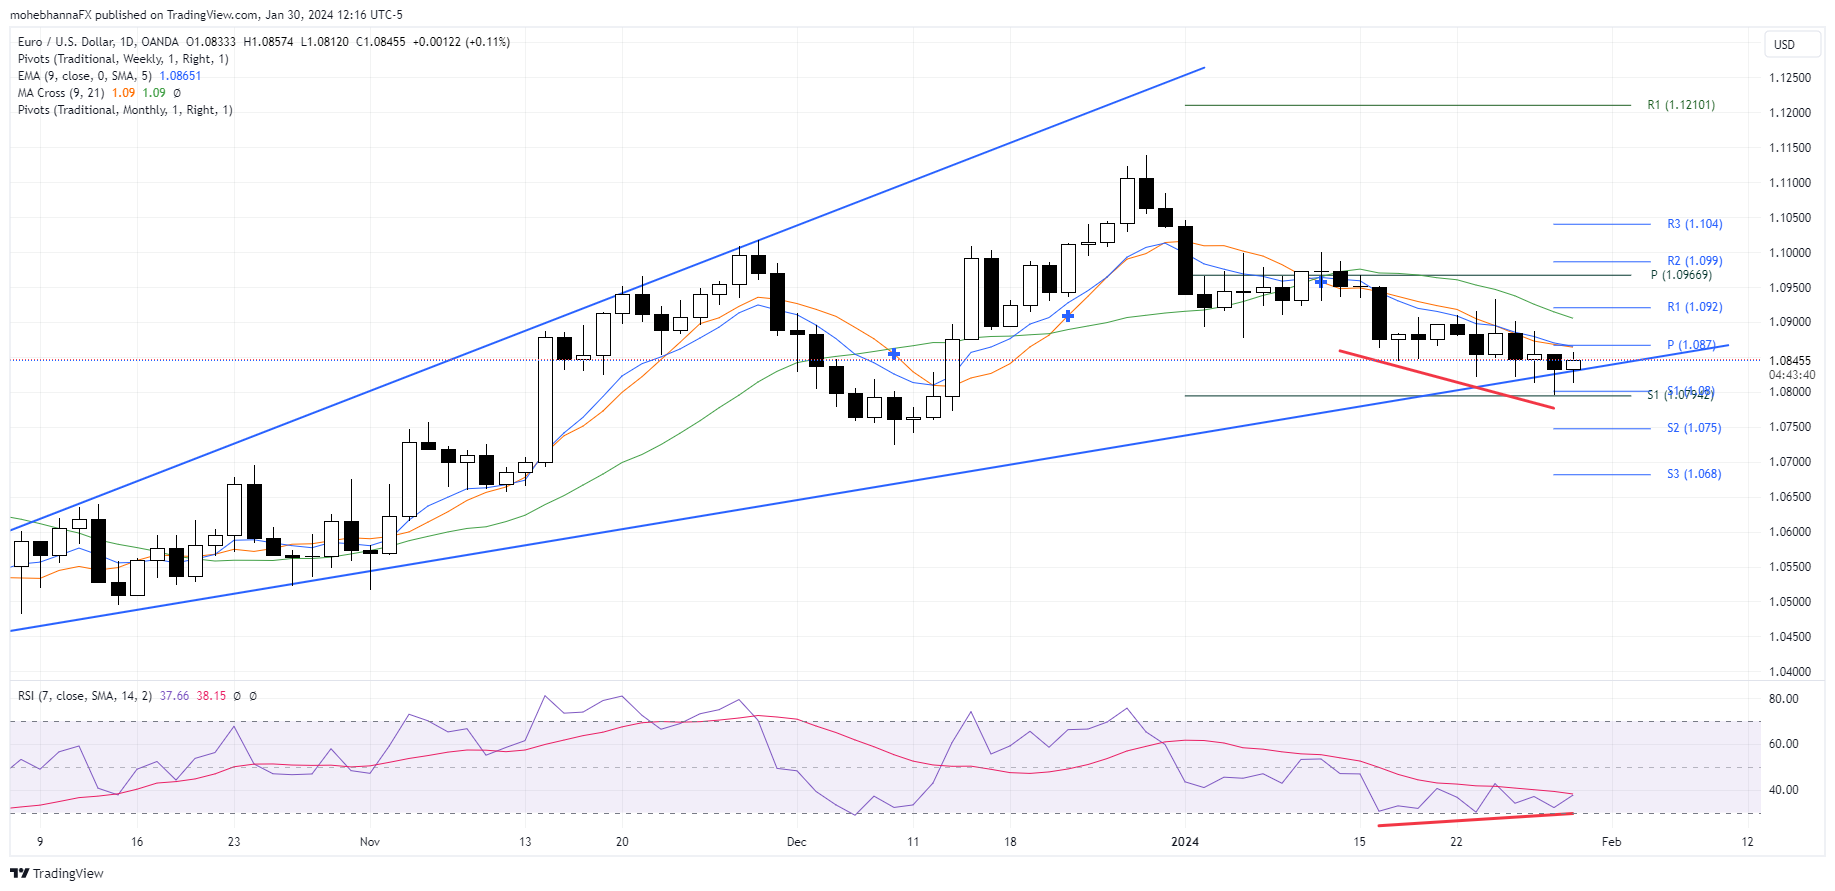
- Price is trading within an ascending widening pattern; price action previously found support along the lower pattern border.
- It is back to trade along the extension of the exact borderline, where it found support on January 23rd, 2024. It is important to remember that the widening formation is part of a more considerable flag formation on the monthly/weekly chart.
- Candlestick patterns around the support level reflect indecision as markets await the FOMC.
- A confluence of support lies below the price action, represented by the lower pattern borderline, monthly and weekly S1 standard calculation.
- The price action broke and closed below EMA9, MA9, and MA21.
- The fast EMA9 and the SMA9 currently represent a confluence of resistance above the price action; the two averages also intersect with the weekly pivot point.
- The chart (red lines) highlights a positive divergence between price action and RSI. Price action made lower lows later in the downtrend, while RSI plotted higher lows and remained near its oversold levels.
4-Hour Chart
Source: TradingView
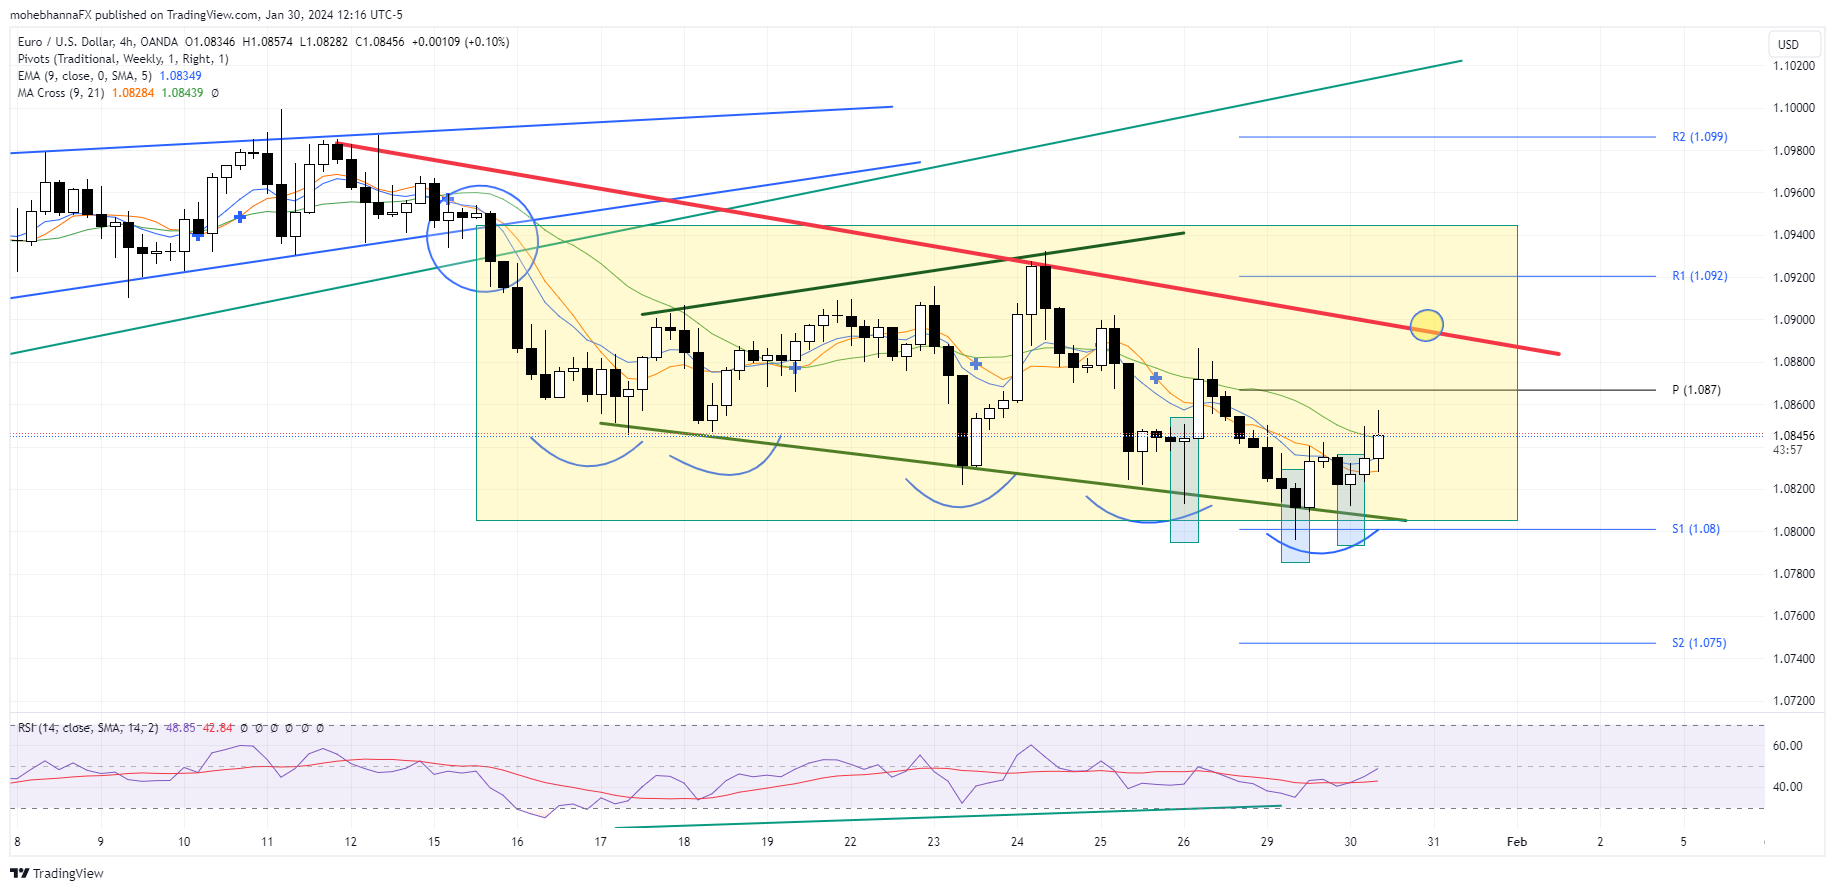
- Price action broke out and closed (Circle) below the lower borders of a preexisting narrowing formation with no pullbacks, followed by an attempt to form a widening formation. (Dark green lines)
- Price action trades within a slightly widening range (Highlighted), forming lower lows as it moves within the pattern.
- A positive divergence between price action and RSI is identified on the chart as prices continue to form lower lows while RSI is plotting higher lows. (Green lines) This is the same positive divergence previously mentioned on the Daily chart.
- Multiple bottom formations are within the widening pattern, and the baseline (Red line) lies just above the weekly pivot point of 1.0870.
- The price broke and closed above its EMA9 and MA9. However, it has yet to close above its MA21, which may act as resistance in case of any upside price move.
- Multiple 4-hour candles found support above the weekly S1 calculation of 1.0800, including multiple hammer formations.
- If the multiple bottom formation works out, it may open the way for price action to trade back above the pattern baseline, which, if it happens, may also lead the price to the pullback level of the narrowing formation (Blue Circles).
- A confluence of resistance lies at the pullback level represented by the narrowing formation lower border (Blue line), an uptrend line that began in November 2023 (Light Green line), and R2 standard calculation.
- RSI remains neutral and below its moving average.
Nonfarm Payrolls to Decide Dollar’s Fortunes
- US employment data will hit the markets on Friday at 13:30 GMT
- Another solid jobs report expected, supported by early indicators
- If so, dollar could receive a boost as investors unwind rate cut bets
Dollar shines in early 2024
It's been a phenomenal start to 2024 for the US dollar, which has already risen more than 2% against a basket of major currencies as a streak of encouraging economic data reinstilled confidence in the US economy, forcing traders to dial back bets of immediate Fed rate cuts.
Economic growth has been faster than expected, empowered by strong consumption trends and heavy government spending. With the labor market also in good shape, it is becoming clearer that there's no urgency to slash interest rates. Inflation has been cooling off, but is still far too high for the Fed to declare victory.
In this light, market participants have started to scale back bets around how quickly and how deeply the Fed will cut rates this year. The prospect of a rate cut in March is now priced as a 50-50 coin toss, which puts even more emphasis on incoming data to decide whether the Fed will pull the trigger or not.
Labor market still tight
Turning to the upcoming data releases, the ball will get rolling on Wednesday with the private ADP employment report for January alongside the employment cost index for Q4, which measures wage growth.
On the same day, Fed officials will deliver their interest rate decision. A full preview of this event can be found here. Expectations of any policy changes are low, so investors will focus mostly on the commentary by Chairman Powell about whether rate cuts are on the horizon. The ISM manufacturing survey for January will follow on Thursday.
Then on Friday, the spotlight will fall on the latest employment report. Nonfarm payrolls are projected to have risen by 180k in January, slightly less than the 216k recorded in the previous month but still a solid number overall. The unemployment rate is forecast to have ticked up to 3.8%, while wage growth as measured by average hourly earnings is seen holding steady at 4.1% in yearly terms.
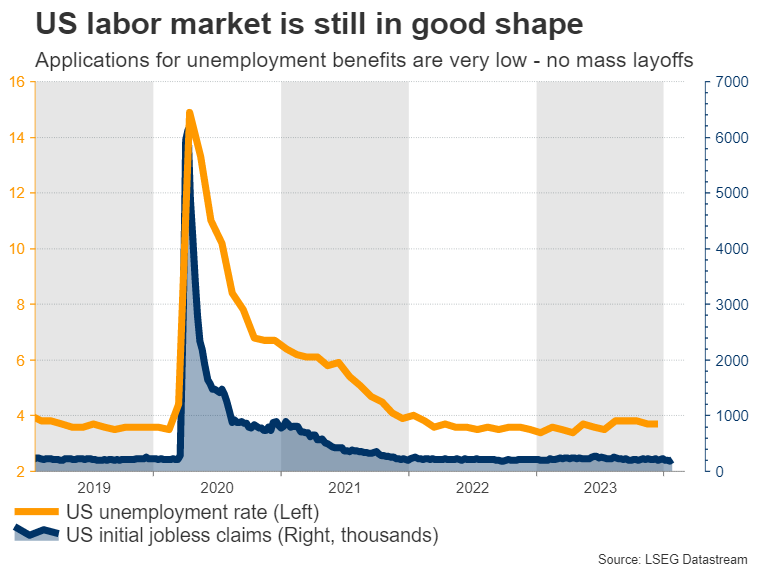
As for any surprises, early indicators point to another decent jobs report. Applications for unemployment benefits fell sharply in January, so there were no signs of mass layoffs in the US economy. Similarly, the number of advance layoffs filed under the WARN Act, which forces big businesses to notify workers about mass firings in the next two months, remained very low.
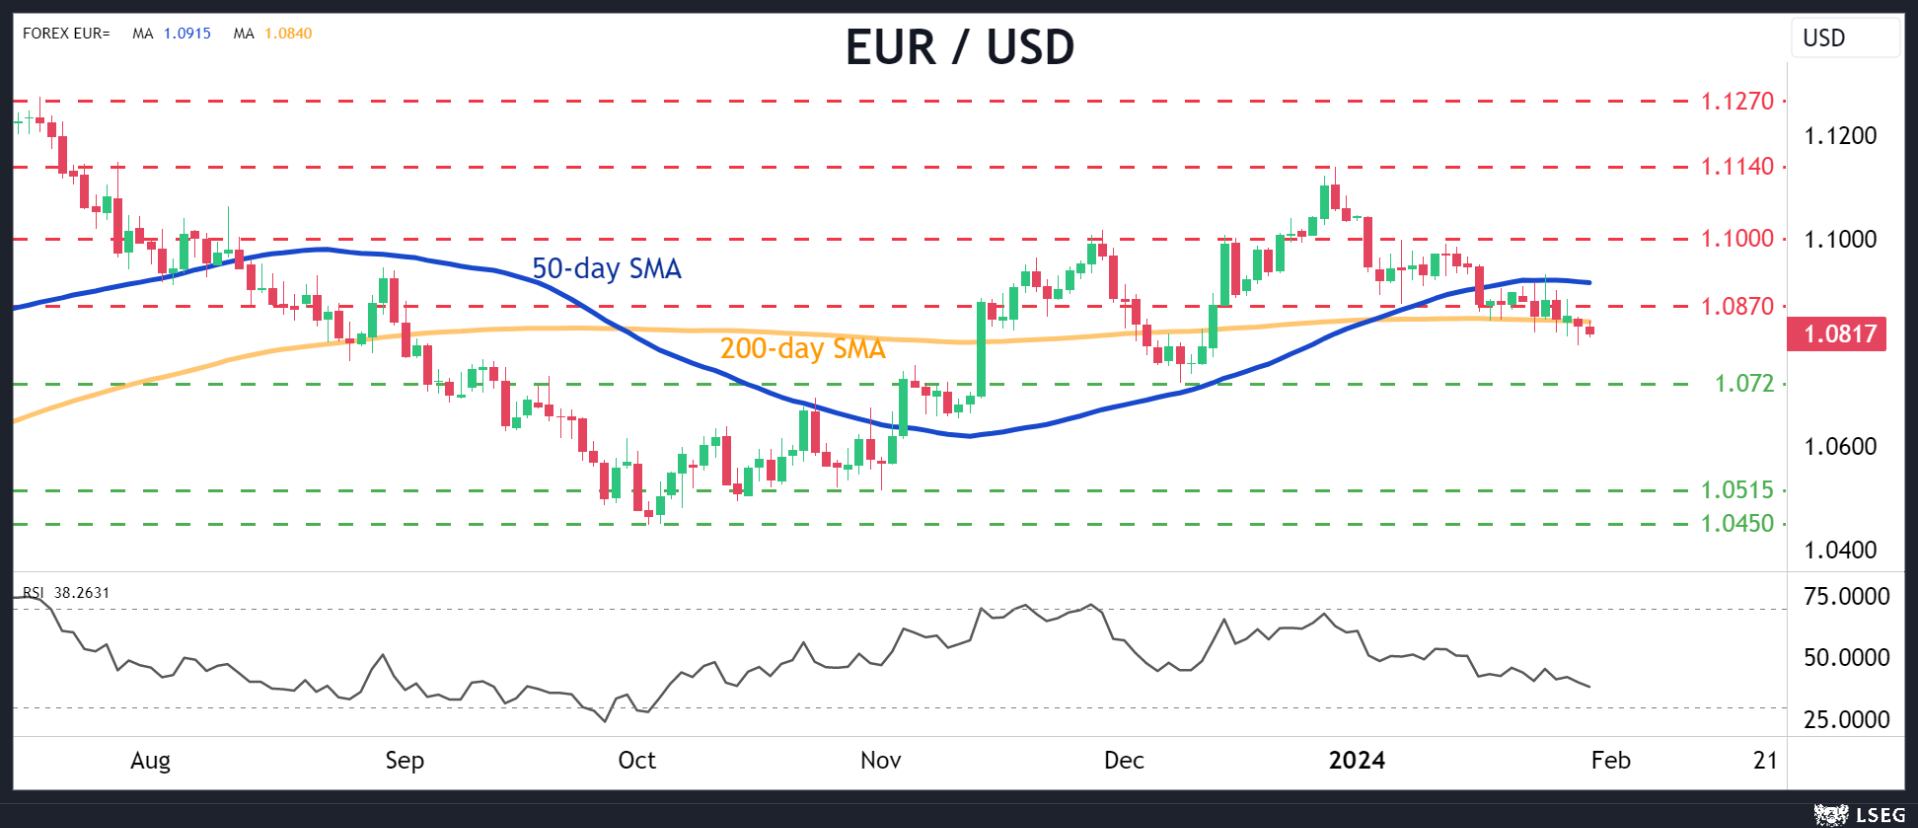
In the markets, an employment report that tops estimates could lead to a further unwinding of Fed rate-cut bets, which would likely benefit the dollar. Looking at the euro/dollar chart, such an outcome might push the pair lower, perhaps towards the 1.0720 support region.
On the other hand, a dataset that misses expectations could fuel the opposite reaction and propel euro/dollar higher, with the first barrier on the upside likely to be the congested 1.0870 zone.
Dollar remains attractive overall
In the bigger picture, the outlook for the dollar still appears positive. In terms of growth, the US economy is much stronger than other major regions like the Eurozone, which barely avoided falling into a technical recession last year.
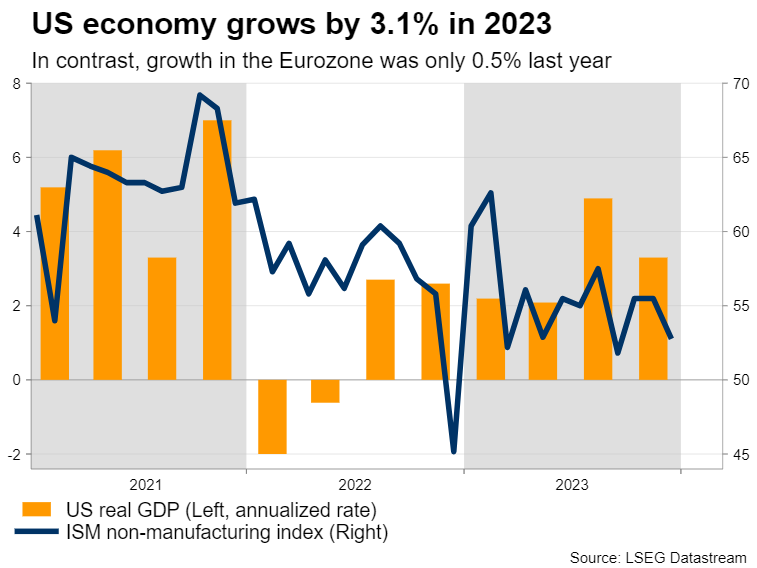
Markets are currently pricing an equal amount of rate cuts in the US and Eurozone this year. However, with growth differentials clearly in favor of the US, there's a strong possibility the Fed will cut rates at a slower pace than the European Central Bank, boosting the dollar through the interest rate channel.
One element that has prevented the dollar from appreciating significantly in this environment has been the explosive rally in stock markets, which has dampened demand for safe haven assets. That said, this dynamic cuts both ways. If the equity market loses steam or suffers a correction, it might become easier for the dollar to advance, as risk appetite deteriorates.
Chinese PMIs in the Spotlight; Australian Inflation Key for Next Week’s RBA
- Quarterly Australian inflation on Wednesday; could surprise on the upside
- Chinese PMI surveys also on Wednesday; Chinese stock indices remains under pressure
- Aussie’s outperformance against the US dollar depends on stronger data releases
Market focusing on the Fed and US labour data
Amidst a week monopolized by Wednesday’s Fed meeting and Friday’s US labour market statistics, which could play a crucial role in the market’s short-term performance, the calendar also includes important data releases from both Australia and China. Especially the latter remains the big elephant in the room regarding its 2024 economic growth.
Aussie inflation in the spotlight
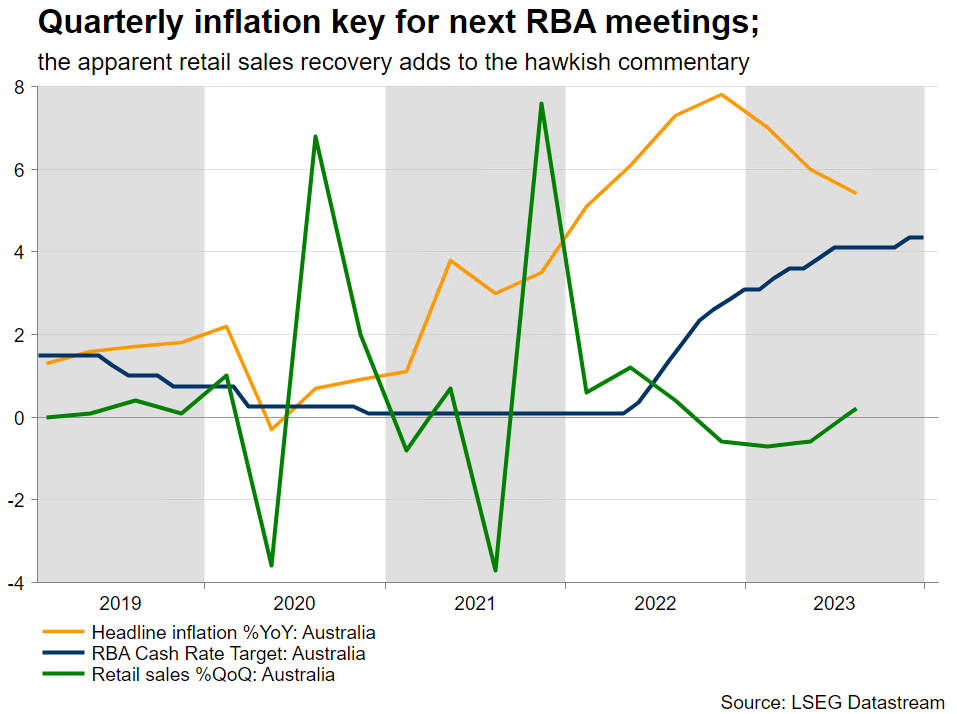
Starting with Down Under and the very important inflation report for the fourth quarter of 2023 will be released on Wednesday at 00.30 GMT. The Reserve Bank of Australia was the last one to hike by 25bps in November 2023 and has since maintained its hawkish stance. The December gathering kept the door open to further rate hikes, with the hawkish bias confirmed by the eye-opening minutes. More specifically, the comment that the “Board noted RBA staff forecast had inflation returning to top of band by end 2025 rather than midpoint” has thrown a spanner in the works for RBA doves. Nevertheless, the market is currently fully pricing in a 25bps rate cut by September 2024.
Like other central banks, the RBA remains data-driven. On Wednesday, the headline inflation is expected to show a 0.8% quarter-on-quarter change with the annual figure dropping to 4.3%, the lowest print since fourth quarter of 2021; the RBA’s favourite trimmed mean CPI is also forecast to record a similar slowdown.
Slim chance of an inflation upside surprise
With the October and November monthly CPI prints printing at 4.9% and 4.3% respectively, the December inflation figure has to slow down to 3.8% in order to confirm the market’s forecasts for the quarterly figure. However, considering that December inflation surprised on the upside across the major economies, there is a non-negligible chance of an upside surprise on Wednesday. Such an outcome would limit the RBA's options at next week's meeting.
China economic issues remain unaddressed
Turning to China, the January PMI surveys could enlighten the market on the economic undercurrents. Despite the numerous support programmes announced during 2023, the market remains unconvinced about their effectiveness. Other key economies like Australia and Germany are pinning their 2024 growth hopes on China overcoming its difficulties.
With the Chinese stock market remaining under severe selling pressure, the PBoC was forced to announce a 50bps Reserve requirement ratio (RRR) effective, from February 5, and has essentially also been enforcing a short sale ban. The Chinese authorities are trying to reverse the current market pessimism and are hoping that positive news from the economy will start to hit the airwaves soon. In addition, this RRR change offers significant support to domestic banks and opens the door for further announcements, possibly an MLF rate cut – the interest rate that banks borrow funds from the PBoC for up to one year - during the first quarter of 2024.
PMI surveys on the menu
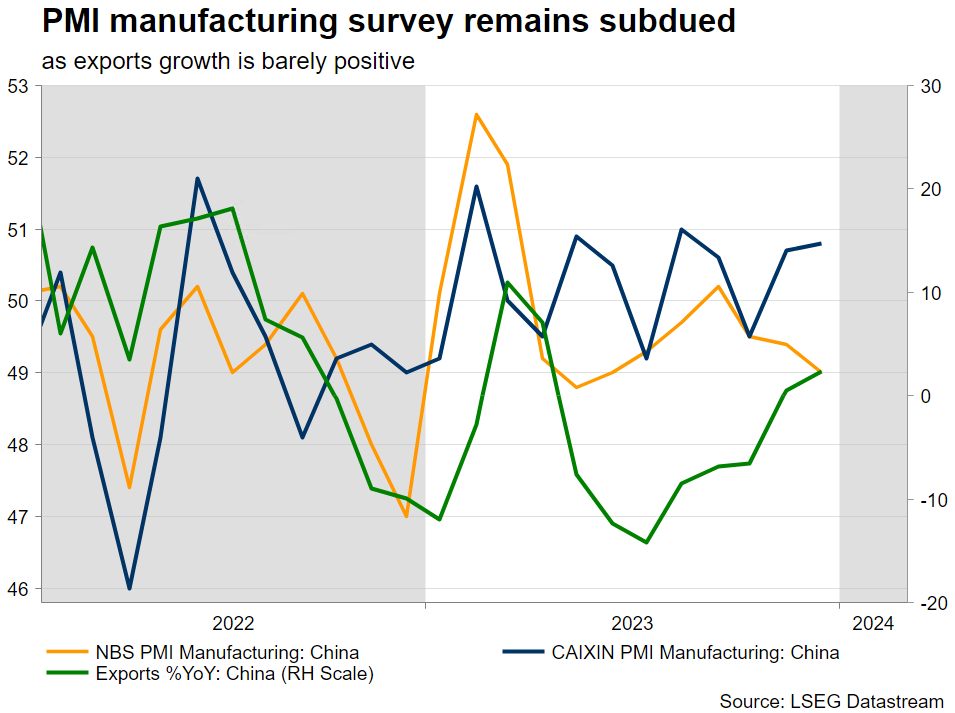
Only time will tell if these measures prove successful as the market wants to see improving economic growth data to feel more confident. In this context the national PMI surveys are seen edging slightly higher with the manufacturing component remaining below 50 for the fourth consecutive month. On the other hand, the Caixin PMI manufacturing survey is expected to drop to 50.6. It is worth noting that the NBS survey has a larger poll and focuses mostly on state-owned firms while the private Caixin survey covers mostly private and export-oriented firms.
Aussie would enjoy stronger data
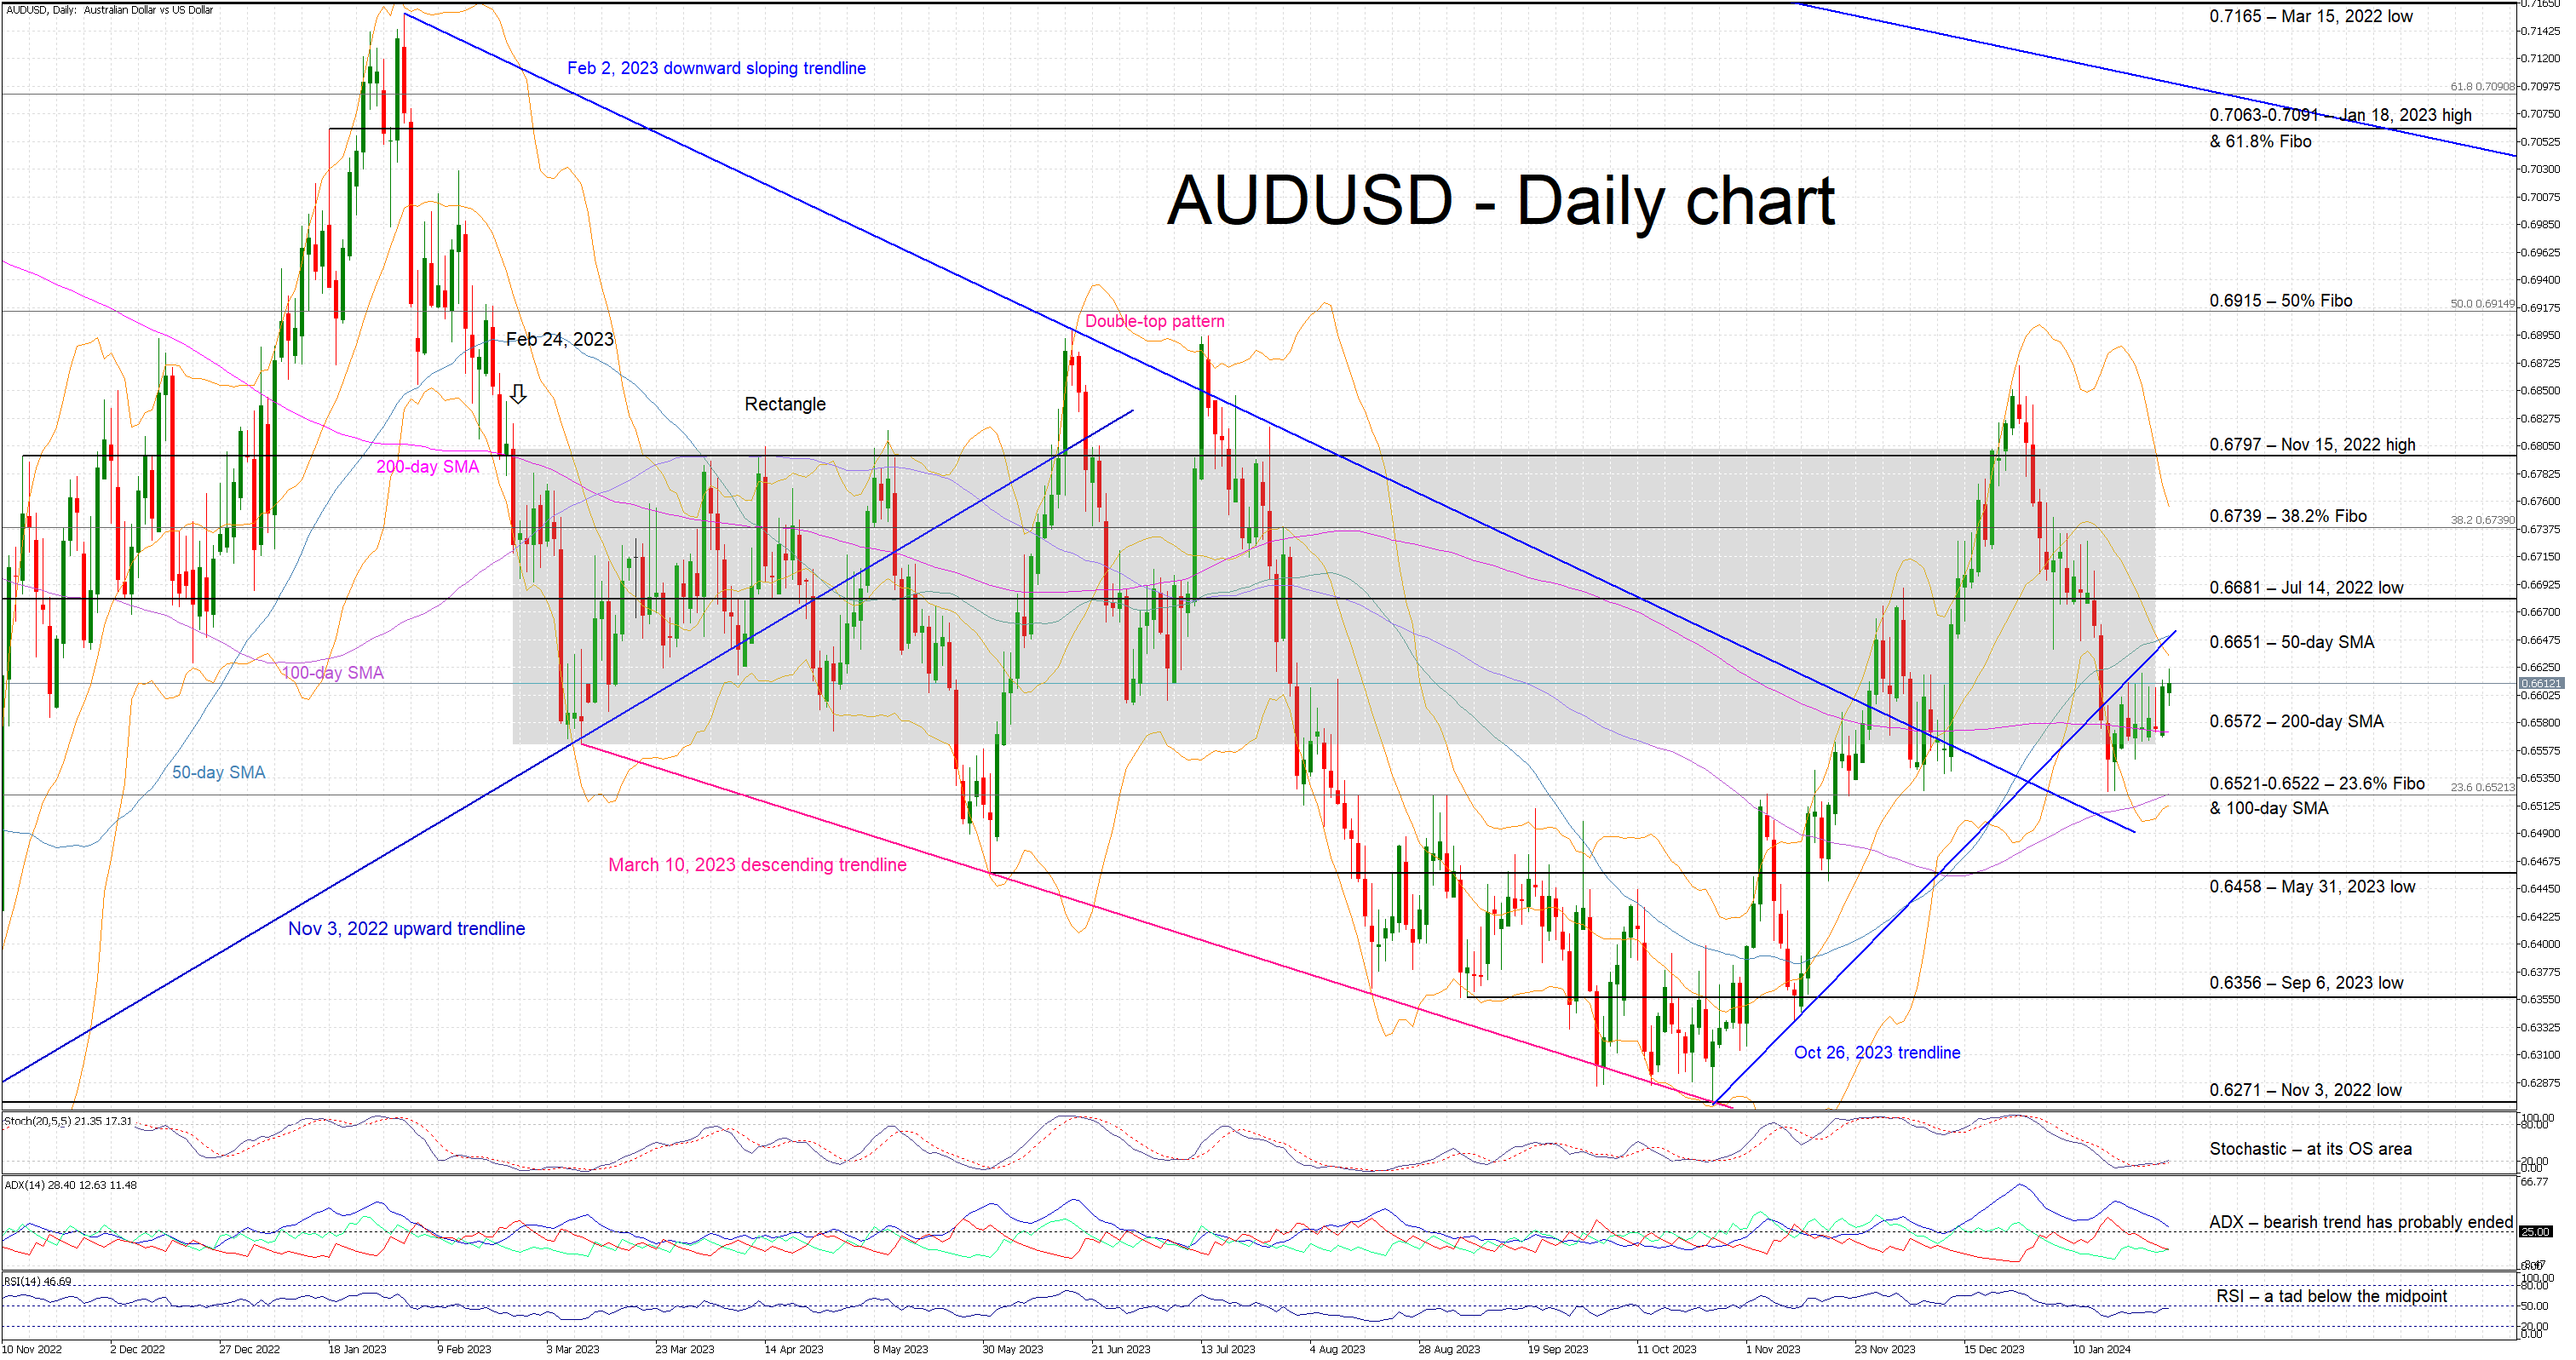
This week’s events could finally allow the aussie-US dollar pair to escape its recent range trading. It remains at the lower boundary of the rectangle that defined the price action during most of 2023 and it is hovering above its 200-day simple moving average. A strong set of data releases in both Australia and China could push aussie-dollar towards the 0.6651 level. On the flip side, a negative set of data, especially in China, could open the door for a protracted correction below the busy 0.6521-0.6522 area.
USDCAD Slides But Finds Support at Around 1.3410
- USDCAD retreats but meets support at 1.3410
- Both the daily oscillators paint a mixed picture
- For the picture to brighten, a break above 1.3535 may be needed
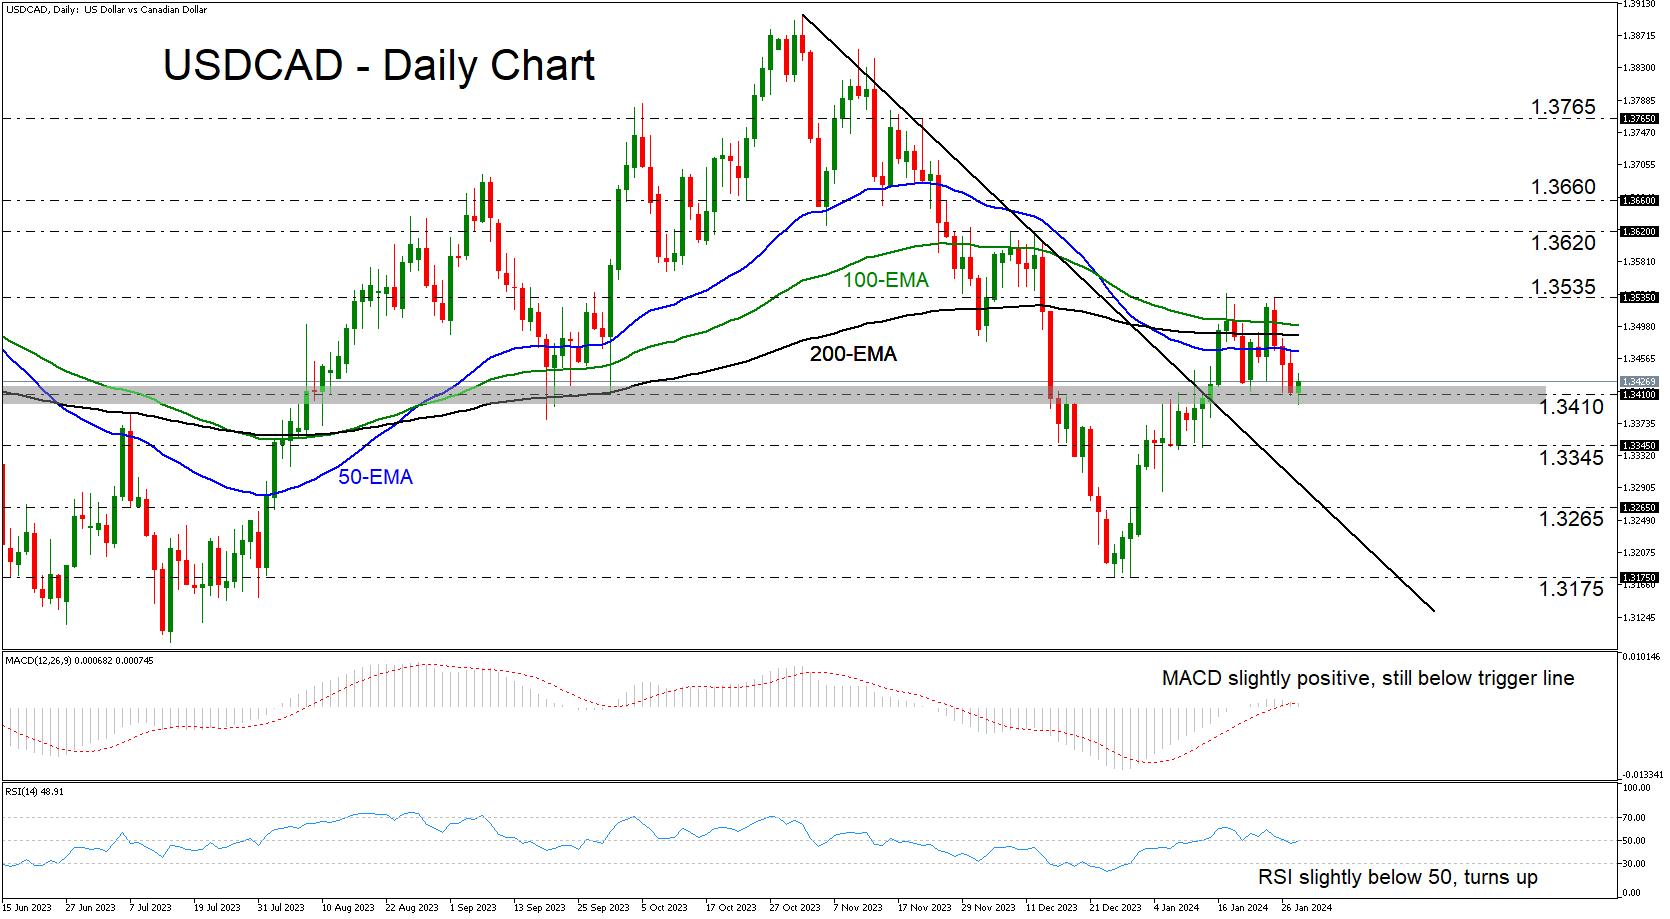
USDCAD slid in the last few days after hitting resistance once again at around 1.3535. That said, the retreat stopped near the 1.3410 barrier, keeping the pair above the prior downtrend line drawn from the high of November 1.
If more bulls are willing to jump into the action from near the 1.3410 barrier, the pair may advance and challenge again the 1.3535 zone, but for the near-term outlook to be considered positive, a break higher may be needed. Such a move would confirm a higher high on the daily chart and may see scope for extensions towards the 1.3620 territory, marked by the high of December 7.
The daily oscillators are sending mixed signals, casting more doubt with regards to where this pair may be headed next. The MACD lies slightly above zero, but still below its trigger line, while the RSI, although slightly below 50, shows signs of turning up again.
On the downside, a break below 1.3410 may encourage more selling, perhaps towards the low of January 12 at 1.3345, the break of which could carry extensions towards the crossroads of the aforementioned downtrend line and the 1.3265 zone.
To recapitulate, USDCAD met some buy orders near the key support level of 1.3410. However, the move signaling an uptrend continuation may be a decisive break above 1.3535.
US consumer confidence hits 2-year high at 114.8, reflecting inflation slowdown and positive employment outlook
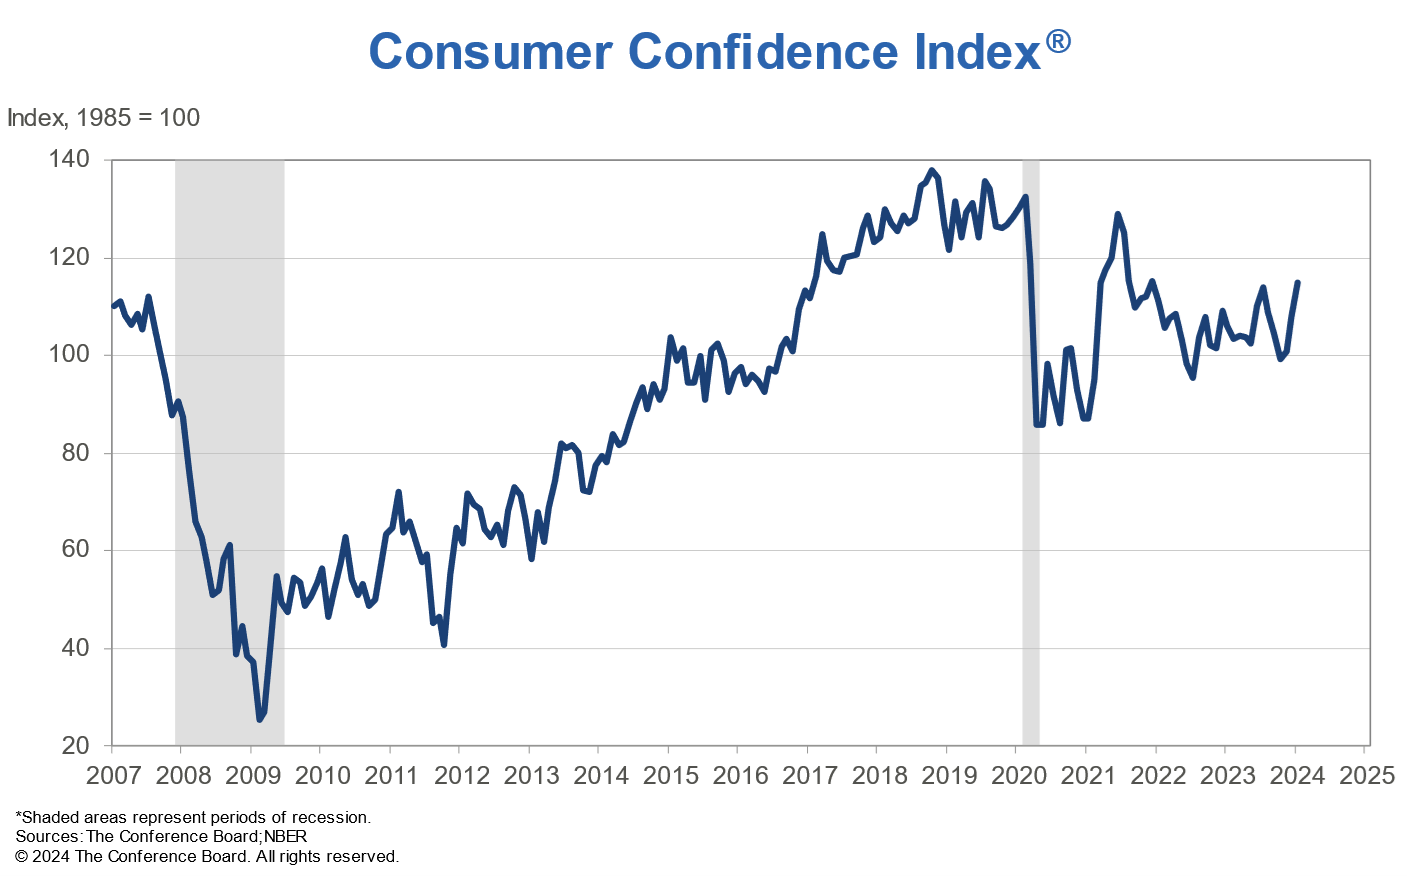
US Conference Board Consumer Confidence rose from 110.7 to 114.8 in January, above expectation of 113.2, and marks the highest level since December 2021. Present Situation Index rose sharply from 147.2 to 161.3. Expectations Index also improved slightly from 81.9 to 83.8.
Dana Peterson, The Conference Board's Chief Economist, attributes this surge in consumer confidence to several key factors, including decelerating inflation, prospects of future interest rate reductions, and the robust employment environment, as companies exhibit a tendency to retain labor.
Furthermore, consumers' perception of the likelihood of a US recession within the upcoming year has continued to diminish, aligning with the Expectations Index's climb above 80.
Sunset Market Commentary
Markets
Economic growth stood in the spotlights today. The IMF in its quarterly World Economic Outlook raised the global forecast from 2.9% to 3.1% this year while keeping the 2025 estimate at 3.2%. The chief economist of the Washington-based institute said “The global economy continues to display remarkable resilience, and we are now in the final descent toward a soft landing with inflation declining steadily and growth holding up”. Global inflation is seen slowing from 6.8% to 4.4% this year, allowing the likes of the Fed, ECB and BoE to start cutting rates but only from 2024H2 on. The US (2.1%), China (4.6%) and Russia (2.6%) saw some of the biggest growth upgrades. The euro area was among the losers (0.9%) thanks to Germany and France. The latter are struggling indeed, according to Q4 GDP numbers released today. A lackluster French (flat) and German (-0.3%) performance was more than made up for by Italy, Spain and Portugal, though. Growing 0.2%, 0.6% and a very solid 0.8% respectively, southern European outperformance helped the European-wide economy narrowly avoid a technical recession in 2023H2. GDP stagnated instead of shrinking by a back-to-back -0.1% that analysts put forward. The first EU member states also published January inflation figures. Belgian CPI (national calculations) accelerated by 0.49% m/m to 1.75% y/y (see below). Spanish HICP fell 0.2% m/m, less than the 0.6% expected, bringing the yearly gauge from 3.3% to 3.5%. After a sharp drop from July 2022 to June 2023, Spanish y/y HICP inflation has fluctuated between above 3.3% and 3.5% since September last year. It’s the paella-loving country that set the tone for European/German bond markets. Bunds opened higher but pared all gains and more after the Spanish data was released. Current changes amount to <2 bps across the curve with the 7 bps drop in the 2-y being a benchmark change. US Treasuries simultaneously left their intraday highs behind but the move there lacked conviction. Yields currently ease 1.6-3.2 bps.
On currency markets, sterling displayed some of the sharpest moves. EUR/GBP rebounded from as low as 0.8517 to 0.8564 before paring some of the gains again to 0.8545 currently. We didn’t see a specific trigger and assume it was mainly a technically driven sprint. Indeed, the pair over the course of January neared the lower bound of a sideways trading range in place since May last year. A break lower was bound to be tricky given the looming Bank of England meeting (inc. new forecasts) on Thursday. Other FX pairs trade muted. EUR/USD sticks around 1.084. JPY hovers near its recent lows. The Hungarian forint is leading Central-European peers. The central bank backtracked on earlier guidance from deputy governor Virag and stuck to a 75 bps cutting pace (to 10%). Virag noted inflation was declining faster than expected, creating room for bigger (100 bps) cuts. Since then, however, the forint fell sharply amid rising tensions between Orban and the EC and concerns about Hungary missing out on billions of EU funding. Financial & forint stability is considered essential by the central bank, so it opted for caution today. The approach brings some relief to the forint with EUR/HUF easing from 390+ to 387.4 currently.
News & Views
Belgian inflation rose by 0.49% M/M in January with the Y/Y-figure accelerating for a third consecutive month, from 1.35% to 1.75%. The most significant price increases in January concerned dairy products, domestic services, bread and cereals, alcoholic beverages and rents. Natural gas, motor fuels, plane tickets, electricity and hotel rooms had a decreasing effect on the index. Food inflation slid for 10th consecutive time from 7.03% Y/Y to 6.58%. Energy inflation is negative for almost a year now at -22.3% Y/Y. Underlying core inflation, correcting for energy products and unprocessed food, decreased for the 8th month in a row from 5.47% Y/Y in December to 4.7%. Service inflation declined from 6.44% Y/Y to 5.15%, but inflation for rents increased from 5.57% Y/Y to 5.91%.
The Saudi government announced a change in investment plans for Saudi Aramco, the Kingdom’s state-owned oil and gas producer. They abandoned a plan to lift output capacity from the current 12 million barrels a day to about 13 mn by 2027. The move is seen as a potential harbinger of a U-turn of global oil demand forecasts by Saudi Arabia (and by OPEC+) especially given that the Kingdom is currently producing ‘only’ 9 million barrels a day given production output cuts. Brent crude prices slide today from around $82.5/b to $81.5/b.
Euro Steady Despite German GDP Decline
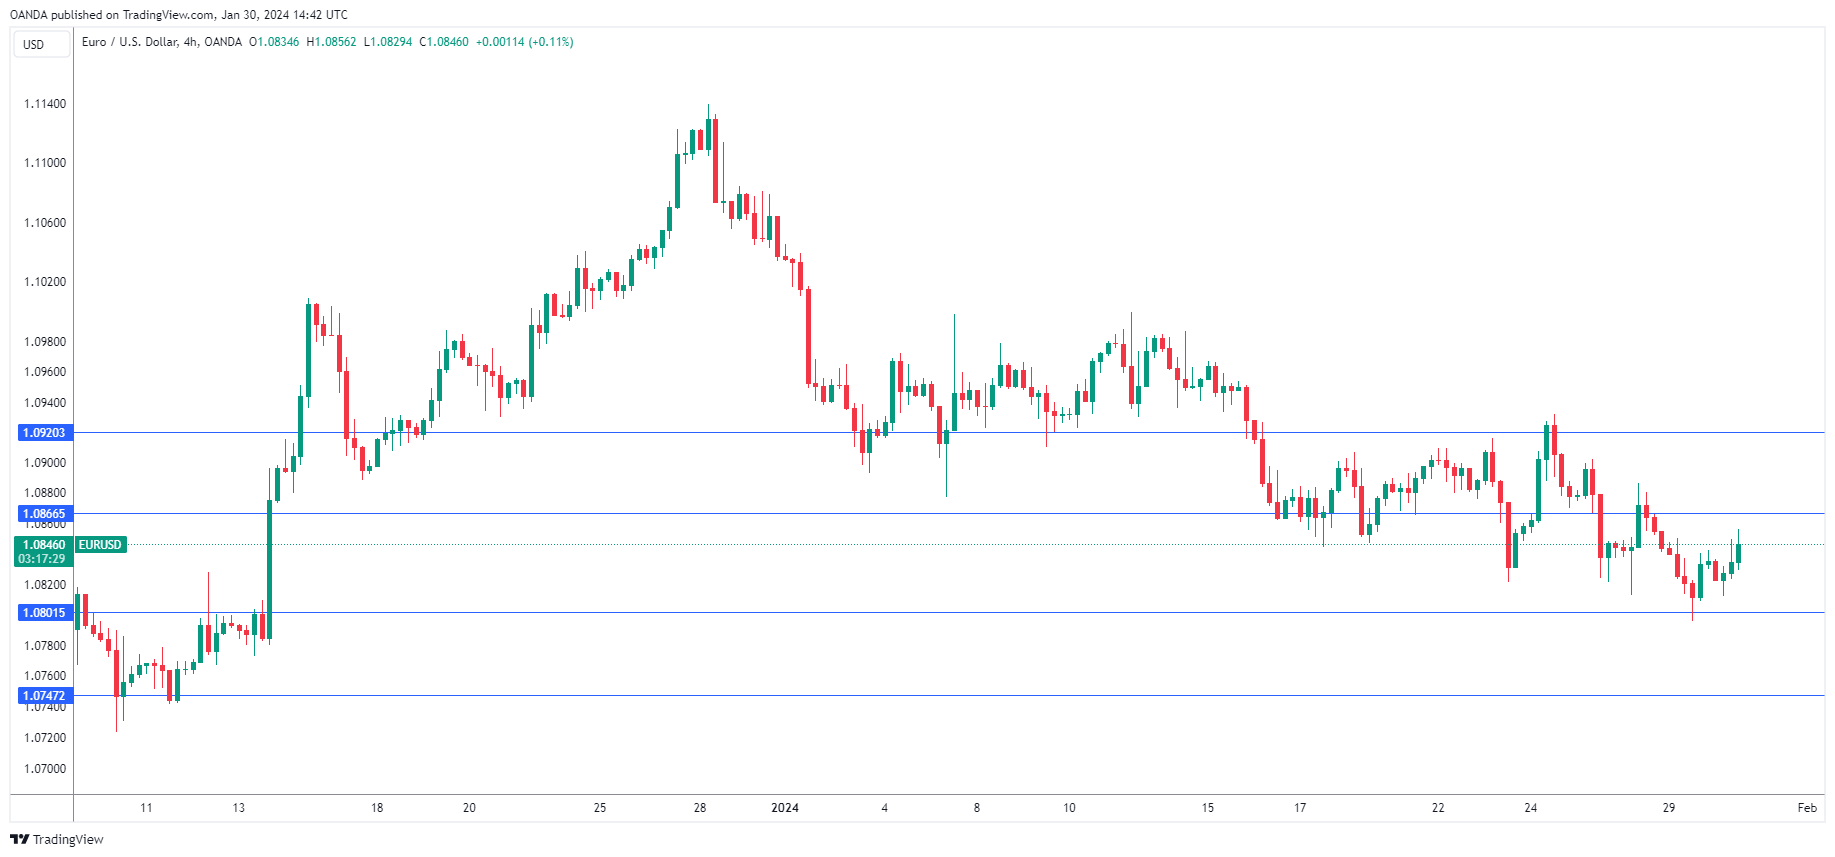
The euro has edged higher on Tuesday. In the European session, EUR/USD is trading at 1.0850, up 0.16%.
German GDP declines by 0.2%
Germany, the largest economy in the eurozone, continues to weigh on the bloc with its weak economy. Germany’s GDP declined by 0.3% q/q in the fourth quarter, matching the consensus estimate. Third-quarter GDP was revised upwards from -0.1% to 0.0%. On an annualized basis, German GDP fell -0.2%, just above an upwardly revised reading in Q3 of -0.3% and matching the consensus estimate of -0.2%. This means the economy entered a technical recession, with two consecutive quarters of negative growth, for the first time in two years.
Eurozone growth remained unimpressive in the fourth quarter. GDP came in at 0%, following a Q3 reading of -0.1% q/q which was also the consensus estimate. On a yearly basis, GDP eked out a 0.1% gain, creeping above the Q3 reading of 0% which was also the market consensus. The eurozone just managed to avoid a recession at the end of 2023, but with weak global demand and the crisis in the Middle East, the outlook for early 2024 does not appear favorable.
The US releases employment and consumer confidence data later in the day, with mixed readings expected. JOLTS Job Openings is expected to drop to 8.75 million, down from 8.79 million, while CB Consumer Confidence is projected to rise to 115 in January, up from 110.7 in December.
The Fed may be on the rate cut bandwagon, but the markets aren’t as feverish about a rate cut in March. Just one month ago, the odds of a March cut were at 73%, but that has plunged to 44%, according to CME’s FedWatch tool. The Fed meets tomorrow and it’s a given that it will hold rates for a fourth straight time. Investors will be on the hunt for clues about rate policy in the upcoming months. Will the rate statement and Jerome Powell’s presser provide some answers?
EUR/USD Technical
- EUR/USD faces resistance at 1.0866 and 1.0920
- There is support at 1.0801 and 1.0747
IMF raises 2024 global growth forecasts, risk of hard landing recedes
In the World Economic Outlook update, IMF upgraded global growth forecast for 2024 by 0.2% to 3.1%. 2025 growth forecast was left unchanged at 3.2%. This upward revision largely stems from stronger-than-expected economic resilience in the US and key emerging markets, along with fiscal support measures in China.
Also, IMF anticipates slowdown in global inflation to 5.8% in 2024 and a further reduction to 4.4% in 2025. With this expected disinflation and steady economic growth, "likelihood of a hard landing has receded", and risks to global growth are now viewed as "broadly balanced".
IMF outlines several potential upside and downside risks to its forecast. Upside risks include faster disinflation potentially leading to looser financial conditions and temporary growth boosts from more expansionary fiscal policies. However, these could pose longer-term challenges. Enhanced structural reforms could also positively impact productivity and have cross-border benefits.
On the downside, IMF cautions against risks like new commodity price increases due to geopolitical tensions, including ongoing conflicts in the Red Sea. Persistent inflation could maintain the need for tight monetary policies. Further, troubles in China's property market or unexpected fiscal tightening in other regions could lead to lower growth than anticipated.
Looking at some details growth forecast:
- US at 2.1% in 2024 (up 0.6% from October estimate), 1.7% in 2025 (down -0.1% from October estimate).
- Eurozone at 0.9% in 2024 (down -0.3%), 1.7% in 2025 (down -0.1%).
- Japan at 0.9% in 2024 (down -0.1%), 0.8% in 2025 (up 0.2%).
- UK at 0.6% in 2024 (unchanged), 1.6% in 2025 (down -0.4%).
- Canada at 1.4% in 2024 (down -0.2%), 2.3% in 2025 (down -0.1%).
- China at 4.6% in 2024 (up 0.4%), 4.1% in 2025 (unchanged).
Silver Recovers But Picture Still Cautiously Negative
- Silver prices bounce back after seven-week decline
- Momentum oscillators around their neutral levels
- Break either above 24.60 or below 21.90 would signal direction
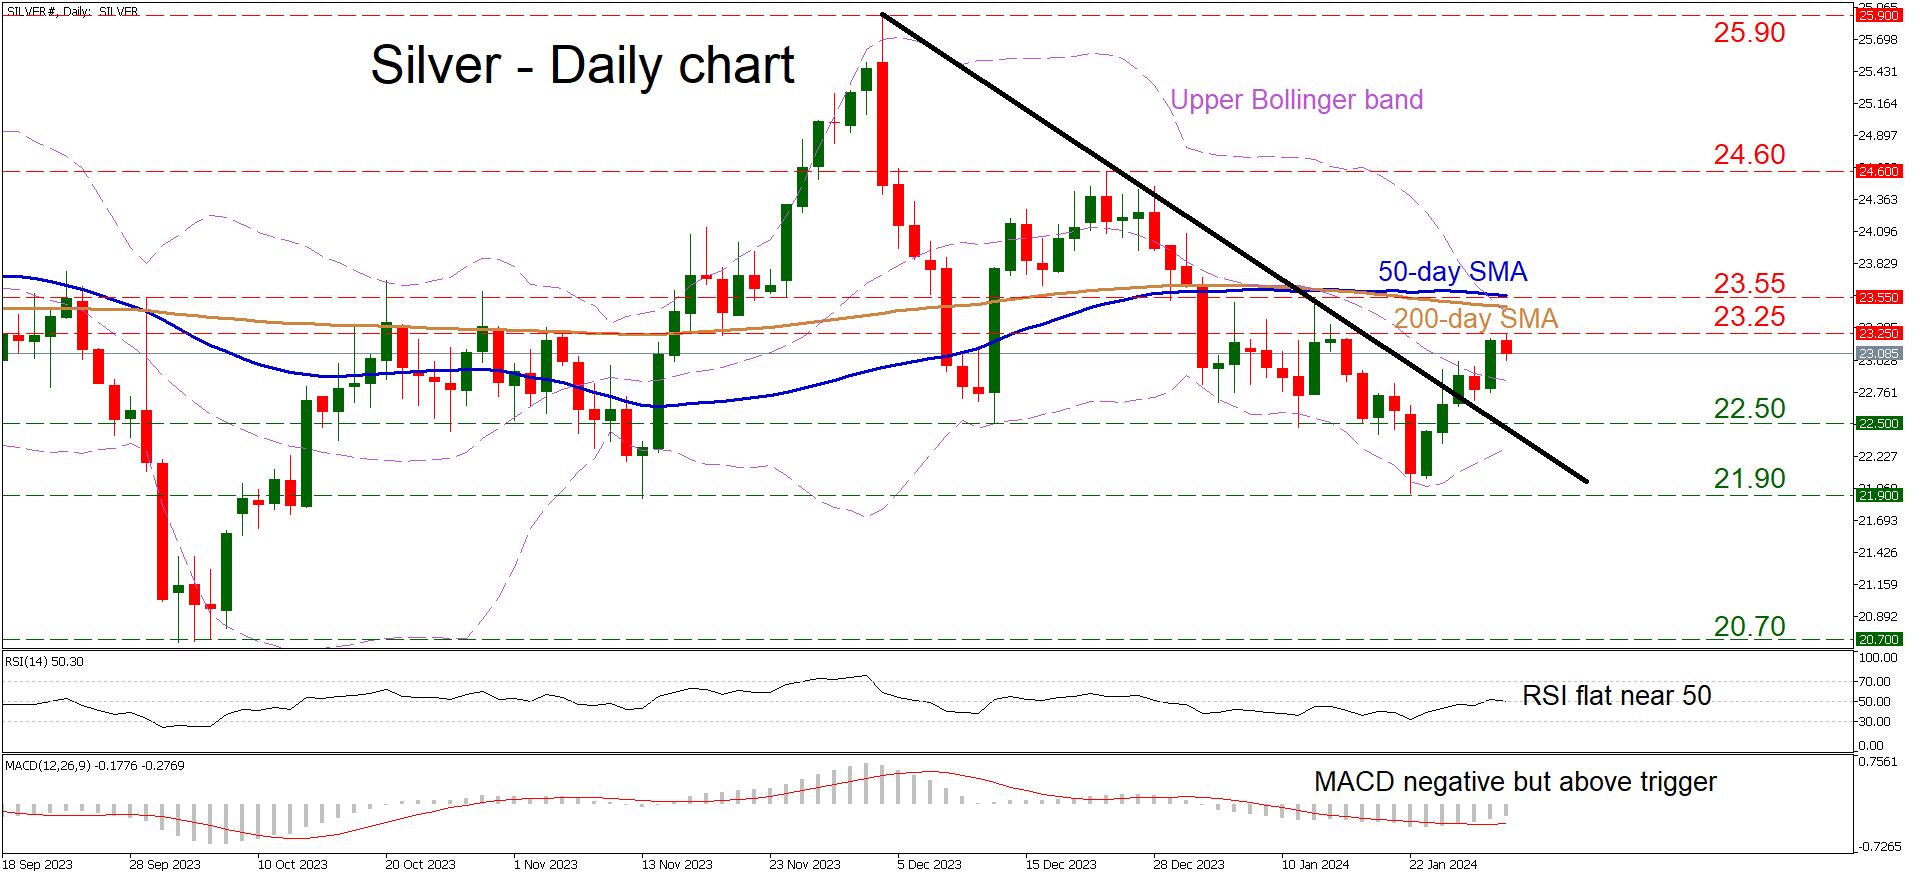
Silver prices have risen over the last week, breaking above a downtrend line to recover a small chunk of the losses from the selloff that started in early December. That said, the structure of lower highs and lower lows is still in force and the market is also trading below its key moving averages, which suggests that the outlook remains cautiously negative.
Momentum oscillators are near their neutral levels, providing no indications about what comes next. The RSI has flattened close to its 50 line, and while the MACD is above its red trigger line, it’s still in negative territory.
If buyers remain in control and pierce above the 23.25 level, an even bigger battle would probably wait for them slightly higher at 23.55, which is roughly where the 50- and 200-day simple moving averages (SMAs) have converged. Another successful break could open the door towards the 24.60 zone, defined by the top in late December.
On the downside, sellers would need to penetrate below the 22.50 region, and even more importantly below the latest low of 21.90, to signal a resumption of the recent downtrend.
All told, the recovery in silver prices is unconvincing so far. A new high above 24.60 could change that, while in contrast, a clean break below 21.90 would signal further losses.