

Sample Category Title
EURJPY Starts a New Bearish Cycle
- EURJPY trims January’s gains within bullish channel
- Short-term risk skewed to the downside
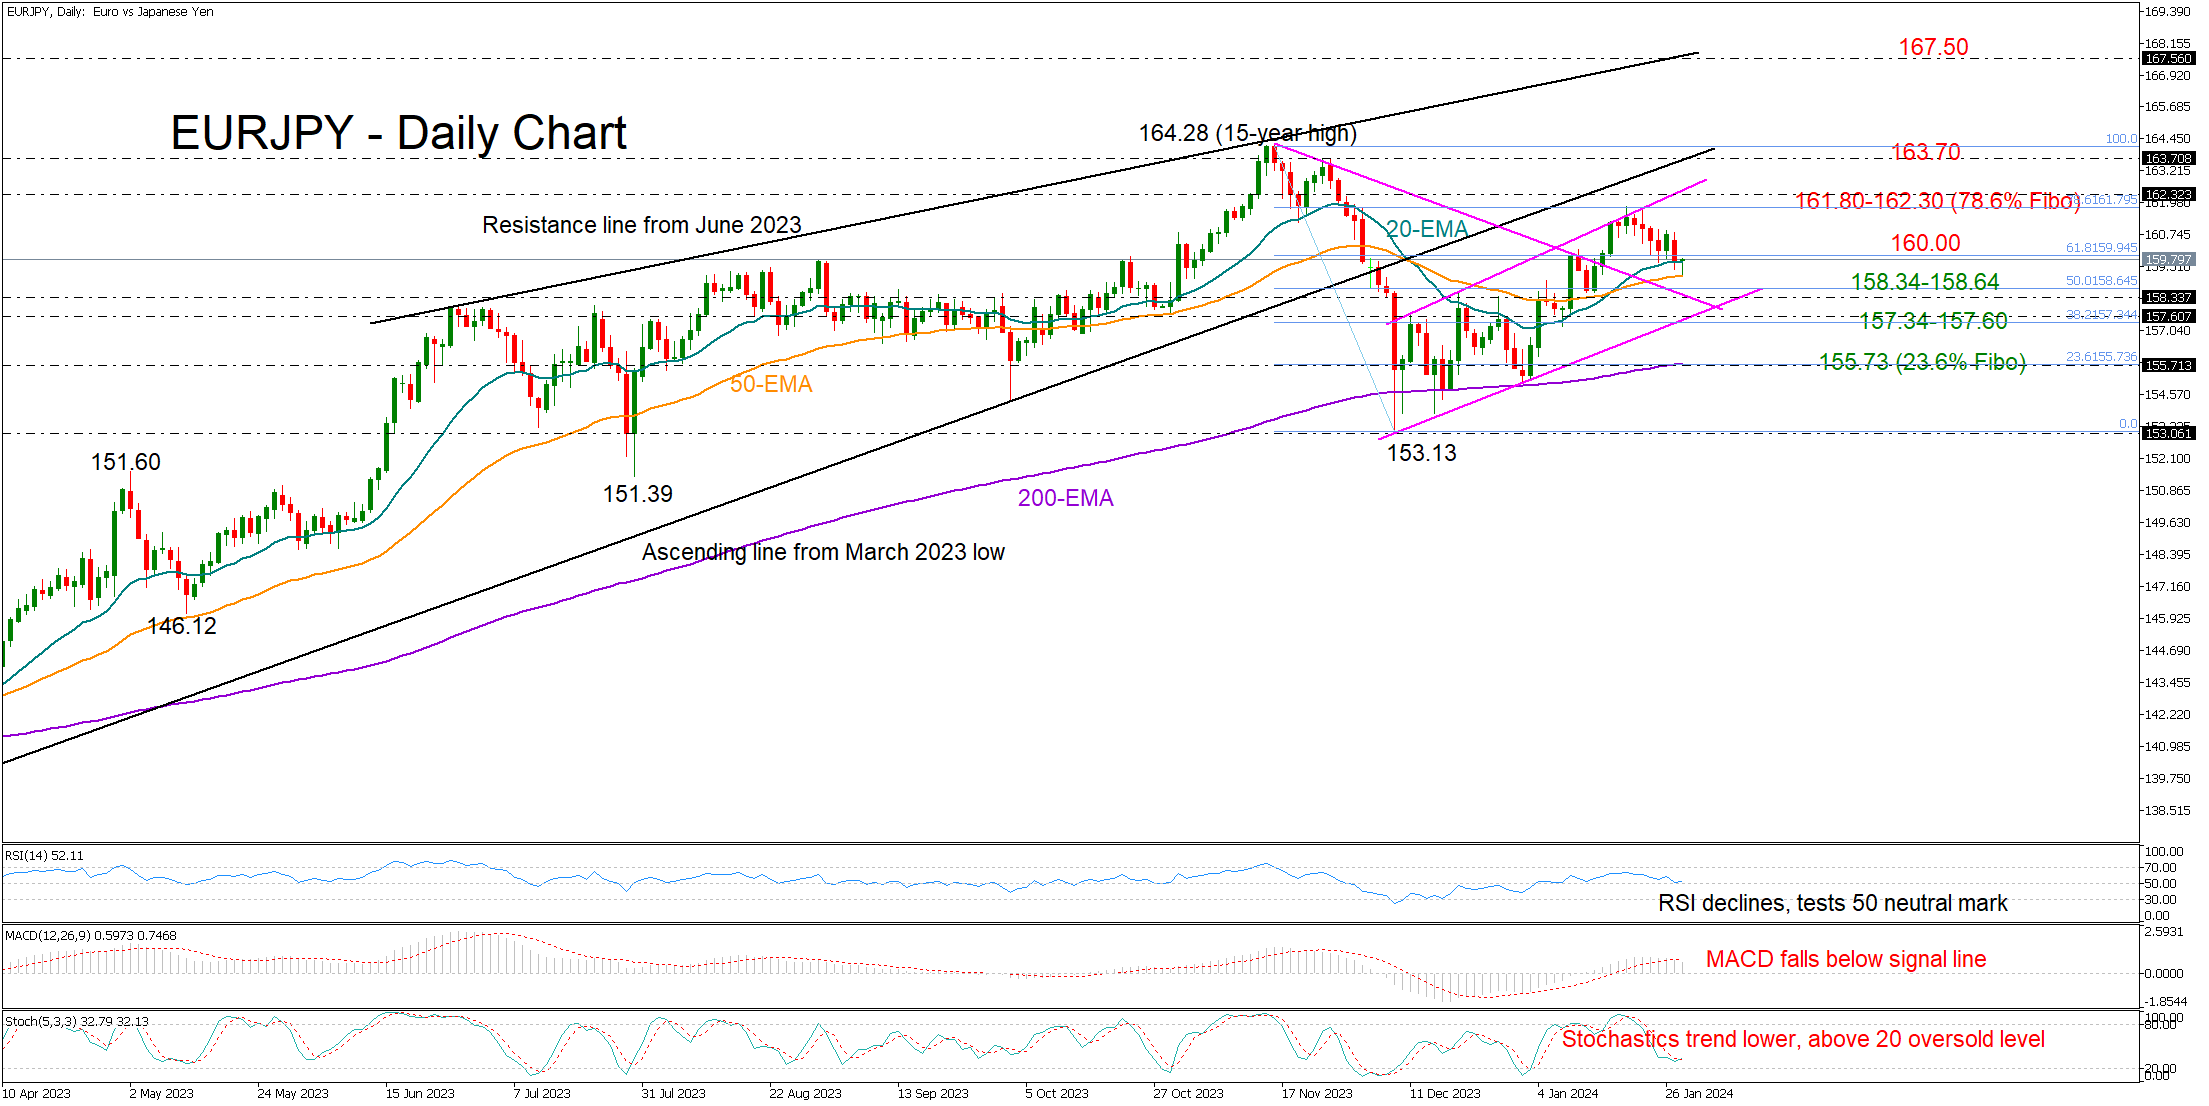
EURJPY started a new bearish cycle within a short-term upward-sloping channel, pulling from a one-and-a-half month high of 161.85 to reach a low of 159.20 on Tuesday.
If the bulls manage to run back above the 160.00 mark, they may stage another battle near the 78.6% Fibonacci of 161.80 and the channel’s upper band at 162.30. A successful penetration higher could lose steam near November’s ceiling of 163.70-164.28. Should the rally continue, the pair could advance towards the resistance trendline, which connects the highs from June and November 2023 at 167.50.
Summing up, EURJPY is expected to lose more ground in the coming sessions, with support likely coming next within the 158.34-158.64 region.
EURGBP Hits the Lower Bound of a Broader Range
- EURGBP slides but finds support at the lower end of a range
- A break below that support may turn the outlook bearish
- Both the MACD and the RSI detect downside momentum
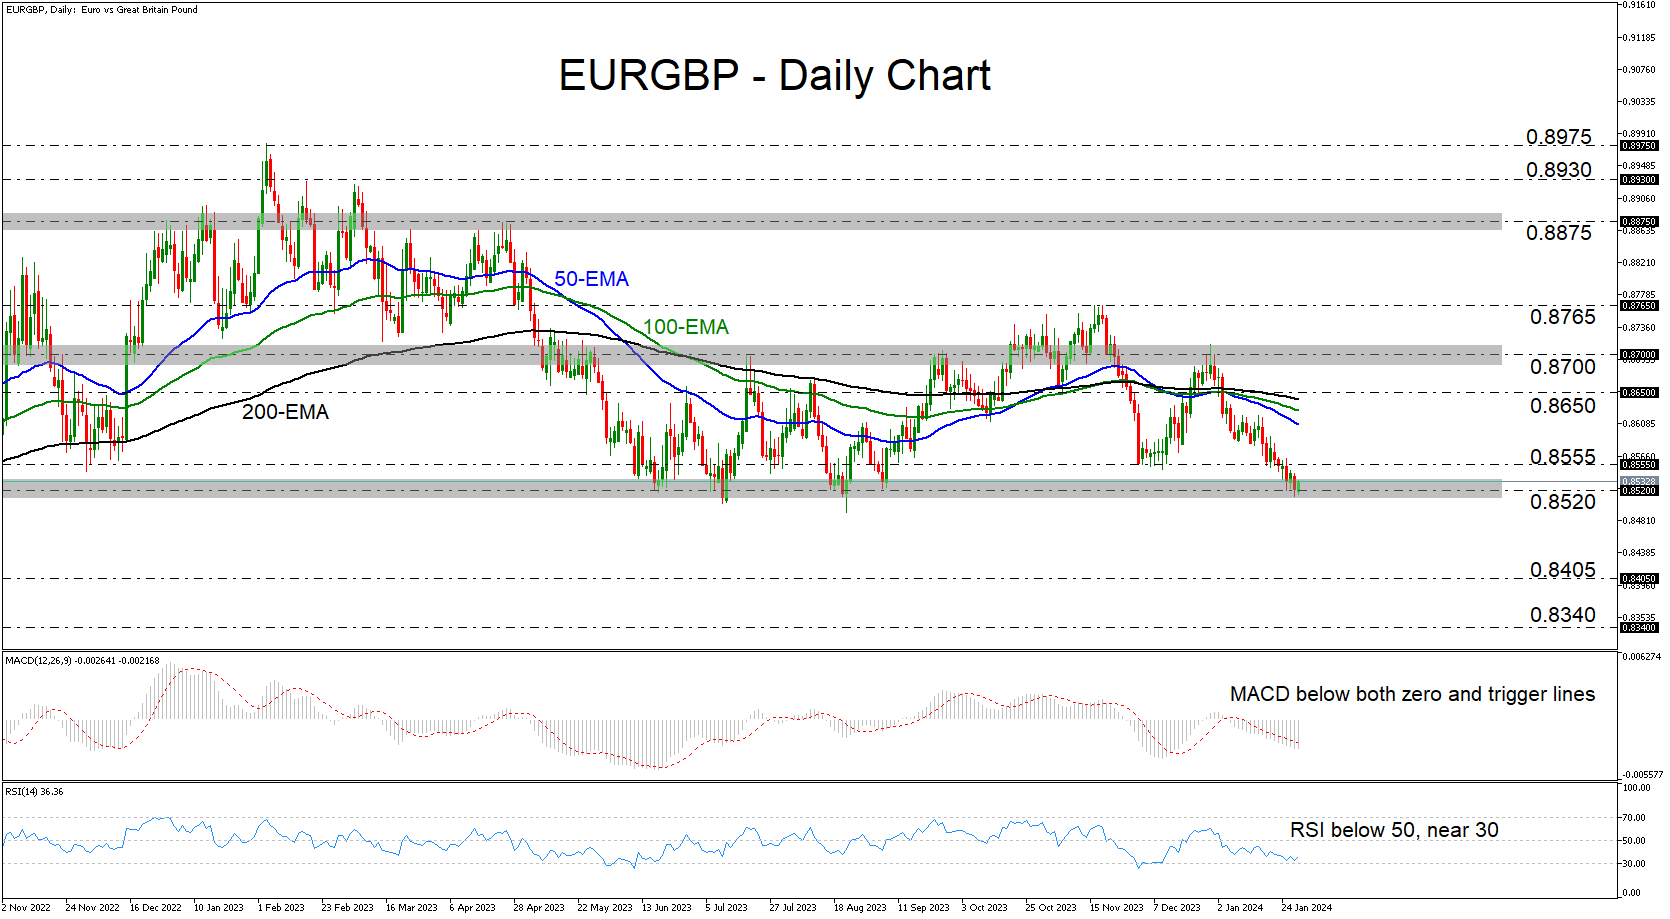
EURGBP entered a sliding mode on December 28, after hitting resistance slightly above 0.8700, the upper boundary of the broader sideways range that’s been containing most of the price action since the beginning of May 2023. That said, the slide was paused yesterday near the lower end of the range at around 0.8520, and today the pair is recovering somewhat.
The move confirming that the bears have regained full control and that the bigger picture has darkened, could be a decisive close below the 0.8520 barrier, which offered support on several occasions last year. Such a dip may allow declines all the way down to the 0.8405 zone, marked by the low of August 24, the break of which could aim for the low of August 2 at around 0.8340.
Both our daily oscillators detect bearish momentum, supporting the notion that, at some point soon, this pair may exit the range to the downside. The MACD lies below both its zero and trigger lines, while the RSI runs below 50, slightly above 30. However, the RSI shows signs of bottoming near 30, which implies that some further recovery may be in the works before the next leg south.
On the upside, a clear break above 0.8555 could signal that traders want to keep the pair range bound for a while longer. They may be willing to pull the price up to the 0.8650 zone, where another break could aim for the range’s upper end at around 0.8700.
To sum up, EURGBP lost notable ground during the first month of the new year, but all the losses were contained within a broader sideways range between 0.8520 and 0.8700. For the outlook to turn negative, a decisive dip below 0.8520 may be needed.
Gold Is Gaining on the Stock Market Narrative
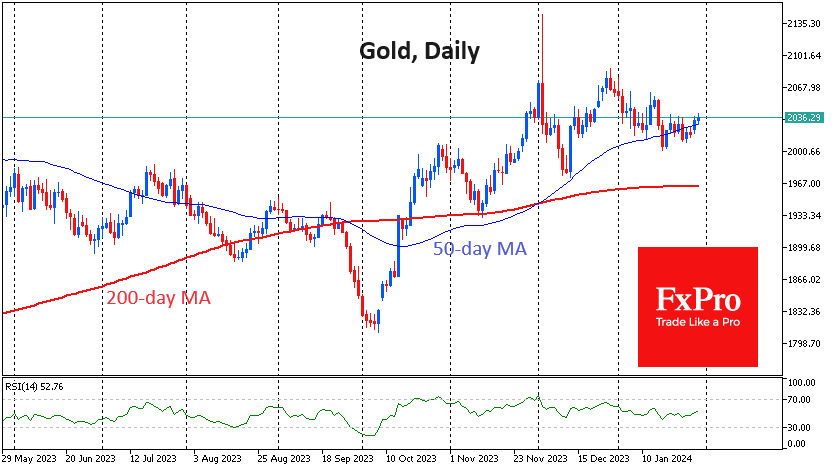
Gold rose to $2,040 per troy ounce on Tuesday morning, a two-week high. The positive momentum is being driven by risk appetite on global platforms. One of the reasons for the increase in demand for the metal could be the strength of the Chinese stock market.
The three main US indices, the S&P500, the Dow Jones Industrial Average and the Nasdaq100, closed at all-time highs on Monday, continuing a run of almost two weeks of gains after a minor correction at the start of the year. The rally was fuelled by reports that the US Treasury had reduced its bond borrowing plans for the coming months. This means that more money that would have been used to buy bonds can be used to buy stocks and commodities.
We are also paying attention to signals from a WSJ journalist who covers Fed policy. He is widely acknowledged to be effective at conveying and interpreting signals that the FOMC can no longer give in the ‘week of silence’ before the meeting. In a recent article, he noted that the ‘sharp drop’ in inflation poses a new risk for the Fed. It’s a sharp reversal from the inflation threat of the past two years. It is a return to the narrative that prevailed after the 2008 crisis when the world’s major central banks worked to raise inflation rather than contain it.
This return of an old theme is reminiscent of gold’s rally from $720 to $1,900 an ounce in 2008-2011 when there was a shift to a zero interest rate policy and the start of QEs.
At the same time, the Chinese market continues to lose investor confidence as a result of the Evergrande bankruptcy and the unimpressive measures taken by regulators to support the markets and the economy. Hong Kong and mainland Chinese stock indices have halted the recovery that began last week and are losing ground for the second trading session, trading near multi-year lows. In this environment, and particularly in China, gold is once again enjoying the status of a defensive asset.
On the other hand, gold has been in a downtrend since the beginning of the year, although it usually starts the year strong. In years where we see early weakness in the first few weeks, the pressure soon builds. And we expect this trend to manifest itself as early as this week.
The price of the troy ounce could correct as low as $1,960, approaching the 200-day moving average, where the battle for the trend will likely intensify. If the bullish scenario comes to fruition, a move above $2,050 by the end of this week will significantly increase the chances of gold testing its all-time highs in the coming weeks.
Aussie Shrugs Off Soft Retail Sales, Inflation Next
The Australian dollar showed little reaction to the release of Australian retail sales earlier today. In the European session, AUD/USD is trading at 0.6600, down o.15%.
Australia’s retail sales sink in December
The markets were braced for a soft December retail sales but the damage was worse than expected. Retail sales fell by 2.7% m/m, following a downwardly revised 1.6% gain in November and much weaker than the consensus estimate of -1%.
This was the steepest decline in retail sales since August 2020, as consumers did their Christmas shopping early and took advantage of Black Friday sales in November. Any hopes that Boxing Day sales in December would ease the pain were dashed, as the November gain came at the expense of December. Retail sales posted a weak gain of 0.8% y/y, the lowest since August 2021. A recession may not be far away and the Reserve Bank of Australia is expected to hold rates at the February 6 meeting. The markets have priced in a 70% probability of a rate cut in August.
The RBA has stressed that upcoming rate decisions will be data-dependent, and Wednesday’s quarterly inflation will be critical. Inflation has been falling and the consensus estimate for the fourth quarter stands at 4.6% y/y, compared to 5.4% in the third quarter. Goods and services inflation and the core inflation rate are moving lower but remain well above the RBA’s target band of 2%-3%. If the inflation rate misses the estimate, the Australian dollar could show volatility.
The US releases key employment data this week, starting with the ADP employment report, which is expected to drop from 164,000 to 145,000. The nonfarm payrolls report will be released on Friday and is expected to decline to 180,000 in December, down from 216,000.
AUD/USD Technical
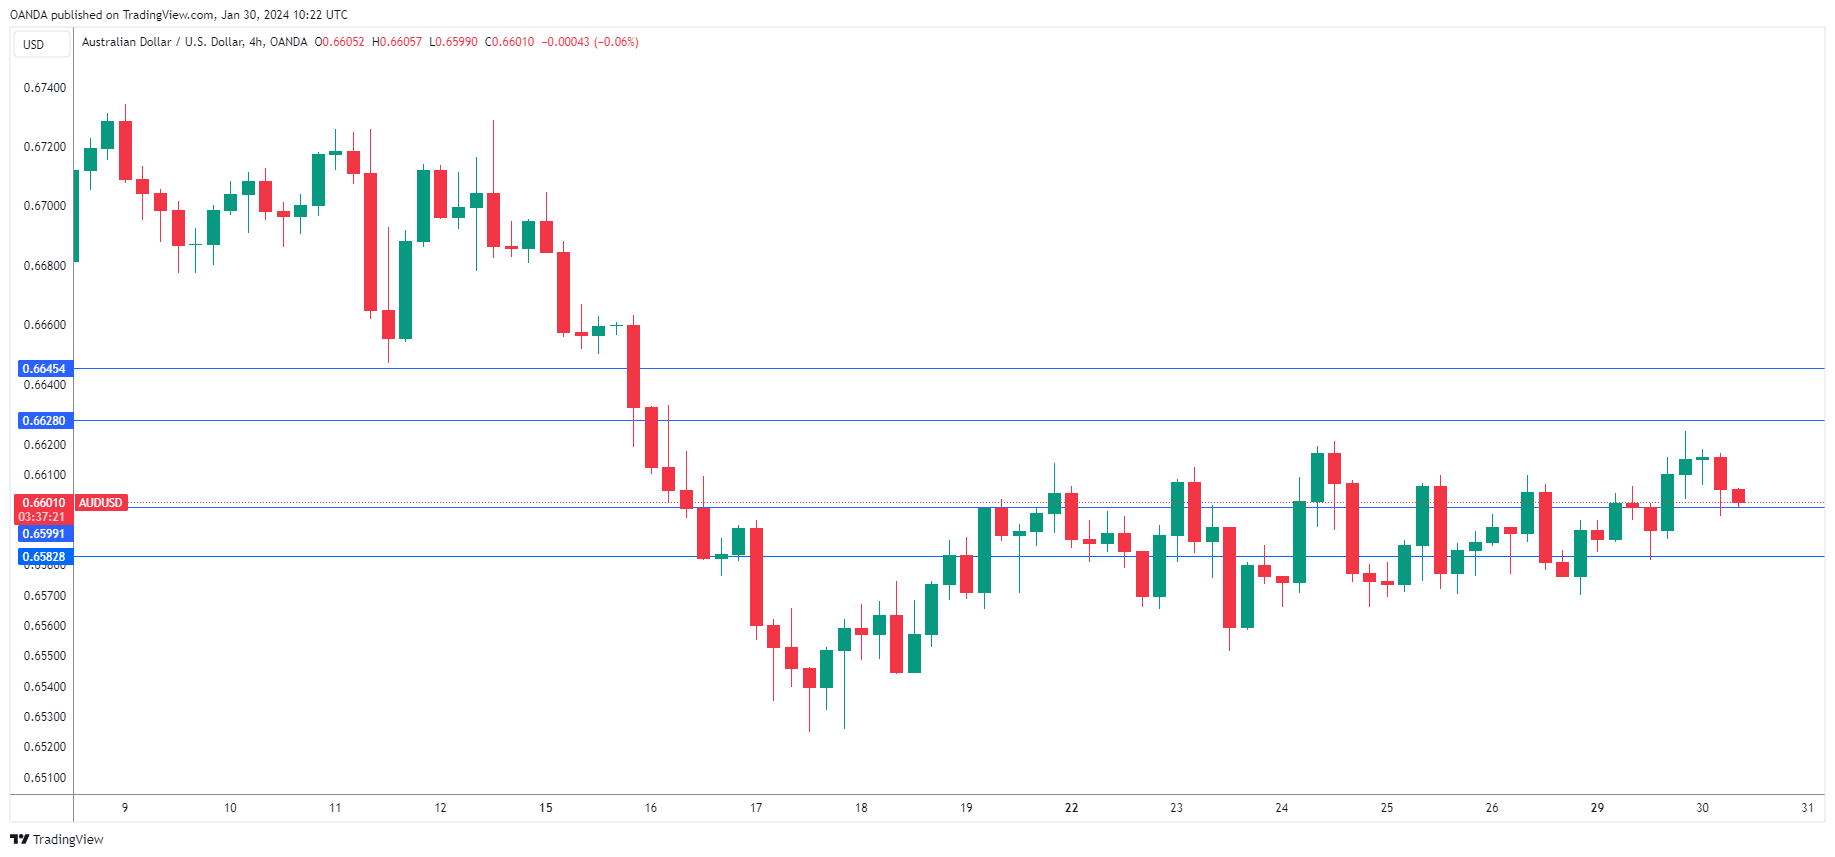
- AUD/USD is testing support at 0.6599. Next, there is support at 0.6582
- There is resistance at 0.6628 and 0.6645
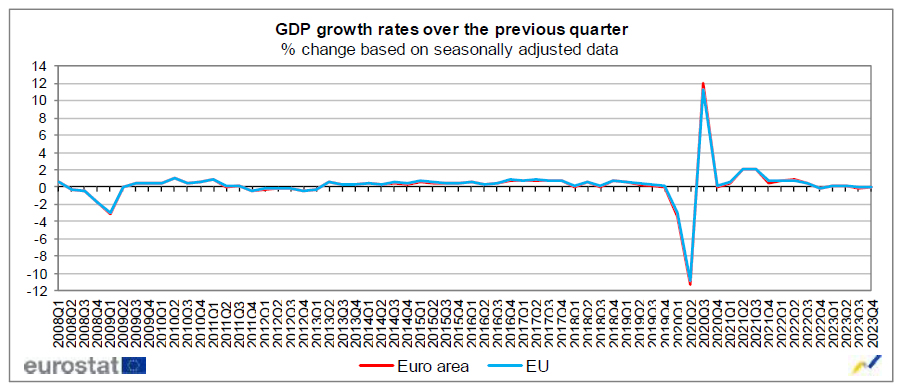
Eurozone GDP stable in Q4, avoids contraction
Eurozone GDP was stable in Q4, better than expectation of -0.1% qoq contraction. Compared with the same quarter of the previous year, GDP increased by 0.1% yoy. EU GDP was also stable in Q4, and increased 0.2% yoy.
Among the Member States for which data are available, Portugal (+0.8%) recorded the highest increase compared to the previous quarter, followed by Spain (+0.6%), Belgium and Latvia (both +0.4%). Declines were recorded in Ireland (-0.7%), Germany and Lithuania (both -0.3%). The year on year growth rates were positive for six countries and negative for five.
Hang Seng Index is Near Important Support
The economy of China is hit by the decision to liquidate the developer Evergrande due to a debt of USD 300 billion. Bloomberg writes that this will have huge consequences for all of China.
While the S&P 500 index rose by more than 3% since the beginning of January, the Hang Seng index fell by more than 8%. JPMorgan and HSBC point to local government debt, non-performing bank loans and negative sentiment in the private sector.
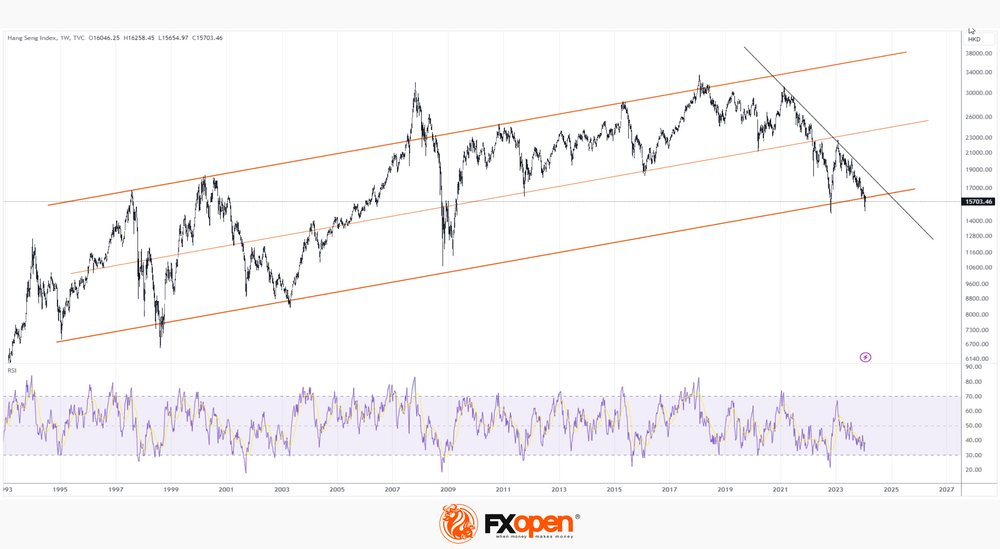
The weekly chart of the stock index Hang Seng (HSI) shows that:
→ The price is in a downward trend, which is shown by the black line.
→ The price dropped close to the 2022 minimum.
→ The RSI indicator is located near the oversold zone.
What is important: the price is near the lower border of the long-term channel (shown by orange lines), from which support can be expected.
Expectations of investors to lower the interest rate from the Fed may increase the appetite for risky assets, which features Chinese stocks.
As Reuters writes, Goldman Sachs noted in its note to clients that hedge funds are actively buying Chinese shares - for the period from January 23 to 25, there was the largest capital inflow in the last 5 years. Perhaps the managers of hedge funds believe that the plans of the Chinese authorities to stimulate the economy for more than $280 billion will become a reality, and the price of the Hang Seng index will make a jump from the lower border of the long-term channel, breaking the black line of the downward trend.
This article represents the opinion of the Companies operating under the FXOpen brand only. It is not to be construed as an offer, solicitation, or recommendation with respect to products and services provided by the Companies operating under the FXOpen brand, nor is it to be considered financial advice.
Major Altcoins Leading Crypto Recovery
Market picture
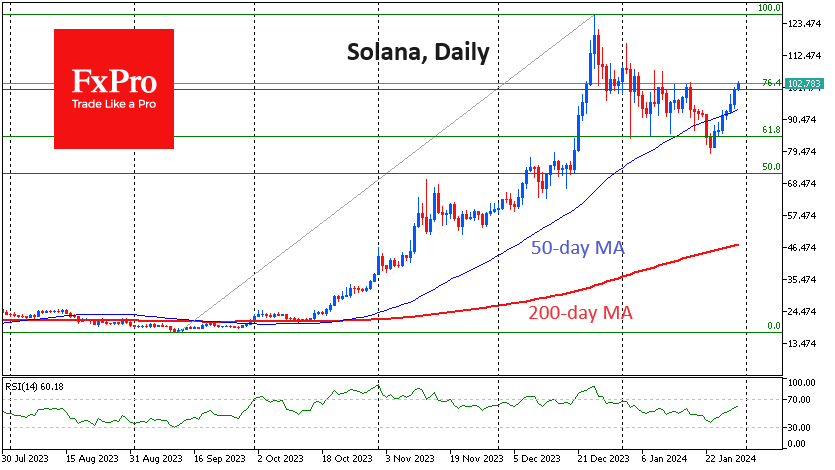
The cryptocurrency market has added over 2% in the last 24 hours. Bitcoin gained 3% during this time, Ethereum rose 1.75%, while Solana and Cardano outperformed the market, adding 5.7% and 8.3%, respectively. The outperformance in major altcoins points to a broadening of participant interest beyond the two largest coins. But don’t expect sustained demand for smaller altcoins or meme coins this year – it usually happens after a prolonged bull market.
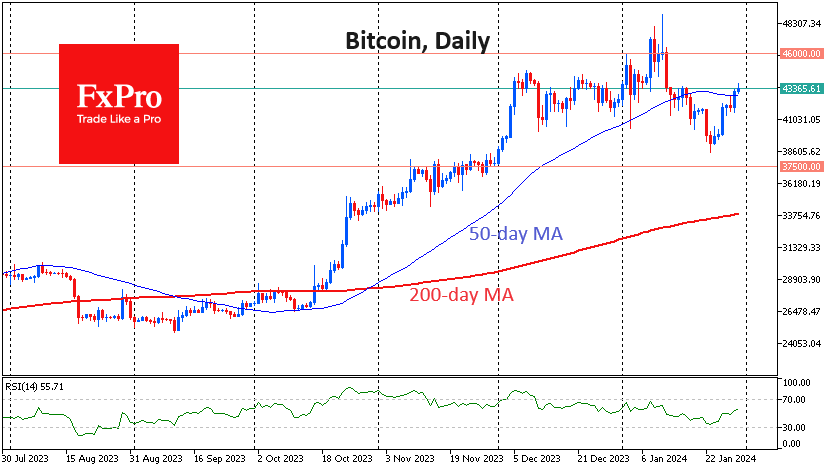
Bitcoin has exceeded its 50-day moving average, climbing above $43.3K. This is important but not yet solid evidence of a bullish trend. However, the altcoins’ consistently positive performance over the past six days is setting up optimism, setting up Bitcoin for a test of $46K.
According to CoinShares data, bitcoin investments decreased by $479 million, Ethereum – by $39 million, and Solana – by $3 million. Investments in funds allowing to open bitcoin shorts increased by $11 million.
Despite significant outflows from the “old” Grayscale fund (totalling $5bn since 11 January), the pace of withdrawals slowed throughout the week. In contrast, recently launched US ETFs saw inflows of $1.8bn, with inflows totalling $5.94bn since launching on 11 January, CoinShares noted.
News background
The Hong Kong unit of Chinese investment firm Harvest Fund Management has submitted a proposal to the Hong Kong Securities and Futures Commission to launch a spot bitcoin ETF. According to Tencent News, the regulator may allow product listing after the Lunar New Year holiday on 15 February.
According to Stand With Crypto Alliance, a non-profit advocacy organisation founded by Coinbase, a robust cryptocurrency lobby has formed in the US Senate. At least 18 senators in the US are actively in favour of the crypto industry.
Bitcoin will at least fall into the $30K-36K range before likely hitting a local bottom around the $20K level. This is the forecast given by Placeholder partner Chris Burniske. That said, he sees the long-term trend as positive.
According to IntoTheBlock, crypto whales added 76,000 bitcoins to their holdings in January, totalling about $3 billion.
According to PeckShield, the cryptocurrency industry has lost $2.61bn to hacker attacks and fraud cases through 2023. Projects managed to recover $674.9 million (25.9 per cent). Attackers continued to focus on DeFi protocols (about 67% of total damage).
According to a survey conducted by Binance, 73% of Europeans they expressed confidence in the favourable outlook for cryptocurrencies.
Ifo: German economy to contract -0.2% in Q1, restrictive monetary policy taking full effect
Germany's economy is bracing for a challenging first quarter, with ifo Institute projecting a contraction in GDP by -0.2%. Timo Wollmershäuser, Head of Forecasts at ifo, indicated that this decline would "tip the German economy into recession."
Wollmershäuser explainsed, "Companies in almost all sectors of the economy are complaining about falling demand". In the manufacturing and construction sectors, where once robust order backlogs have significantly "melted away". A concerning trend of decreasing incoming orders has been observed for several months, with residential construction experiencing a notable surge in cancellations.
"It appears that restrictive monetary policy in Europe and North America, with its aim of stabilizing prices through sharp rises in key interest rates, is now taking full effect," Wollmershäuser added
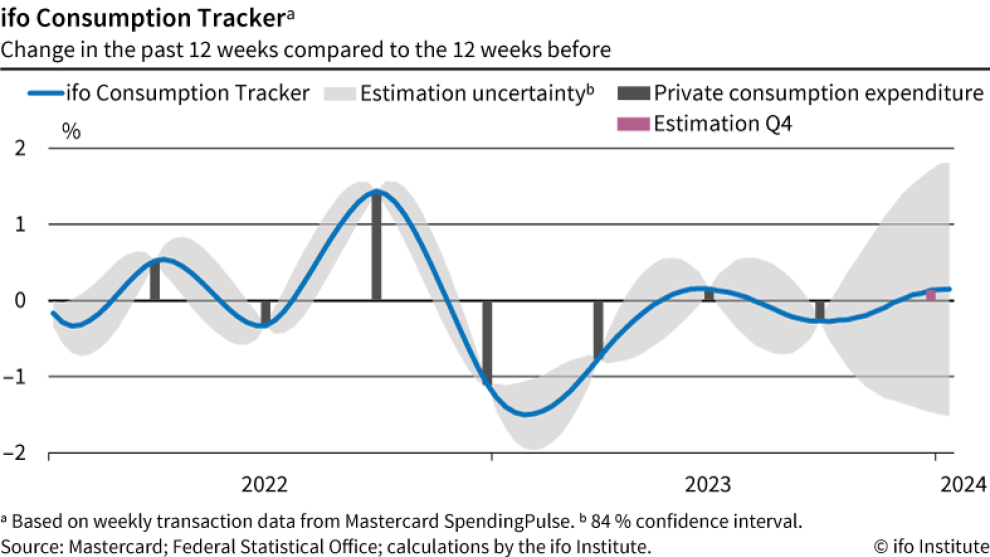
Unique factors further aggravate the situation. Wollmershäuser notes, "High illness levels, rail strikes at Deutsche Bahn, and an unusually cold and snowy January," are additional burdens on the economy. Despite these factors, he finds a silver lining in private consumption, which shows some positive trends.
Swiss KOF rises to 101.5, signaling imminent economic recovery
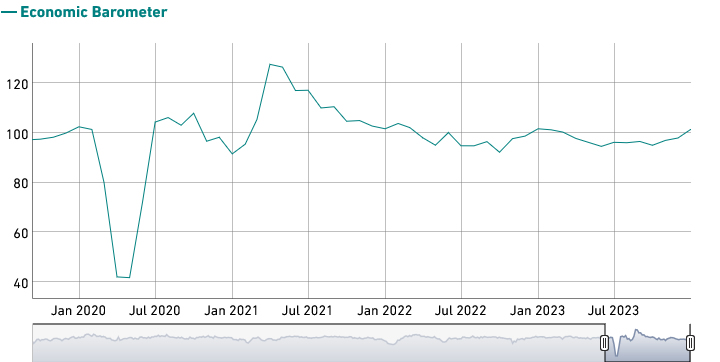
Swiss KOF Economic Barometer rose from 98.0 to 101.5 in January, above expectation of 98.2. That was the third consecutive month of increase, and the first instance since March of the previous year that the barometer has exceeded its medium-term average. This development is being interpreted as "increasing signs that the Swiss economy will soon recover".
The improvement is particularly noticeable in the accommodation industry and other service sectors. The combined indicators for manufacturing, construction, and foreign demand are also "develop slightly positive". Consumer demand, however, is "virtually unchanged". The only sector that appears to be facing challenges is the financial and insurance activities, where the outlook has deteriorated.
EURUSD Slips Further After the Fall Below 200-day SMA
- EURUSD touched 1.0800 but returned higher
- Price moves within bearish triangle
- MACD and RSI suggest negative bias
EURUSD tumbled below the crucial 1.0845 restricted zone, generating concerns that the decline from the 200-day simple moving average (SMA) may continue. Also, the market declined slightly below the 1.0800 round number during Monday’s session, meeting the lower boundary of the bearish triangle but it returned quickly above the 1.0815 barrier.
Prior to resuming their efforts, the bulls might attempt to close above the 200-day SMA at 1.0845. They could then contend for a channel breakout above 1.0870 ahead of the bearish crossover between the 20- and the 50-day SMAs at 1.0915. Beyond that region, the psychological threshold of 1.1000 may present a substantial obstacle.
In the most favourable scenario, more losses could open the door for the 1.0725 support level before touching the 1.0655 support, shifting the outlook to a strongly bearish one.
From a technical standpoint, the RSI is positioned below 50 and exhibits a southward bias, whereas the MACD is continuing its bearish trajectory beneath its zero and trigger lines. Both indicators point to a bearish momentum.
In summary, EURUSD may be poised to extend its latest slide, especially after the dive beneath the 200-day SMA and the medium-term ascending trend line.
