Sample Category Title
NZ ANZ business confidence rises to 36.6, inflation expectations lowest since Nov 2021
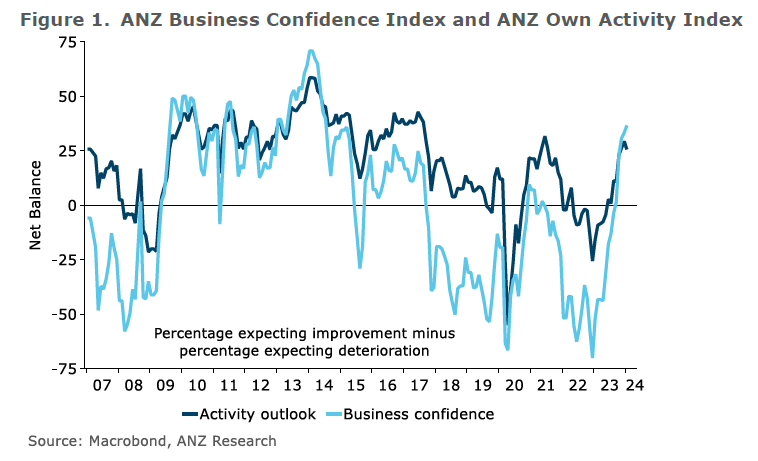
New Zealand ANZ Business Confidence rose from 33.2 to 36.6 in January. However, Own Activity Outlook fell from 29.3 to 25.6.
In a significant development, inflation expectations decreased from 4.61% to 4.28%, reaching their lowest point since November 2021. Despite this decline in inflation expectations, a high number of firms still plan to increase their prices, with the pricing intentions index only marginally decreasing from 50.2 to 49.7. Cost expectations also saw a slight reduction, moving from 76.2 to 75.6, but they remain at elevated levels.
ANZ's commentary on the situation pointed out that the New Zealand economy is at a critical point, expressing a cautiously optimistic outlook. They anticipate that RBNZ has implemented sufficient tightening measures and expect a gradual realization of their impact, leading to a possible initiation of "a steady stream of OCR cuts" by August.
Japan’s industrial production rises 1.8% mom in Dec, a bounce in seesawing pattern
Japan's industrial production rose 1.8% mom in December, rebounding from prior month's -0.9% mom contraction, but missed expectation of 2.4% mom.
Manufacturers have tempered expectations for the coming months, predicting a -6.2% mom drop in production in January, followed by a modest 2.2% mom increase in February. The Ministry of Economy, Trade and Industry maintains its assessment of "seesawing" on production.
As an METI official indicated, the recent Noto Peninsula earthquake's impact on manufacturing appears minimal for January. However, production forecasts are clouded by the suspension of operations at Daihatsu due to issues with collision-safety test irregularities.
"Although we believe that the production sentiment of companies is gradually getting out of the bearish phase, for the time being, we need to pay attention to the impact of the suspension of auto manufacturers' operation," the official said.
In separate release, retail sales grew 2.1% yoy in December, well below expectation of 5.0% yoy.
GBP/USD Eyes Fresh Increase, Fed Rate Decision Next
Key Highlights
- GBP/USD is holding the 1.2620 and 1.2600 support levels.
- A key declining channel is forming with resistance near 1.2700 on the 4-hour chart.
- EUR/USD extended losses toward 1.0800 and remains at risk of more downsides.
- The Fed interest rate decision is scheduled today (forecast 5.5%, versus 5.5% previous).
GBP/USD Technical Analysis
The British Pound started a fresh decline after it faced sellers near 1.2775 against the US Dollar. GBP/USD is now holding the 1.2600 support and might start a fresh increase.
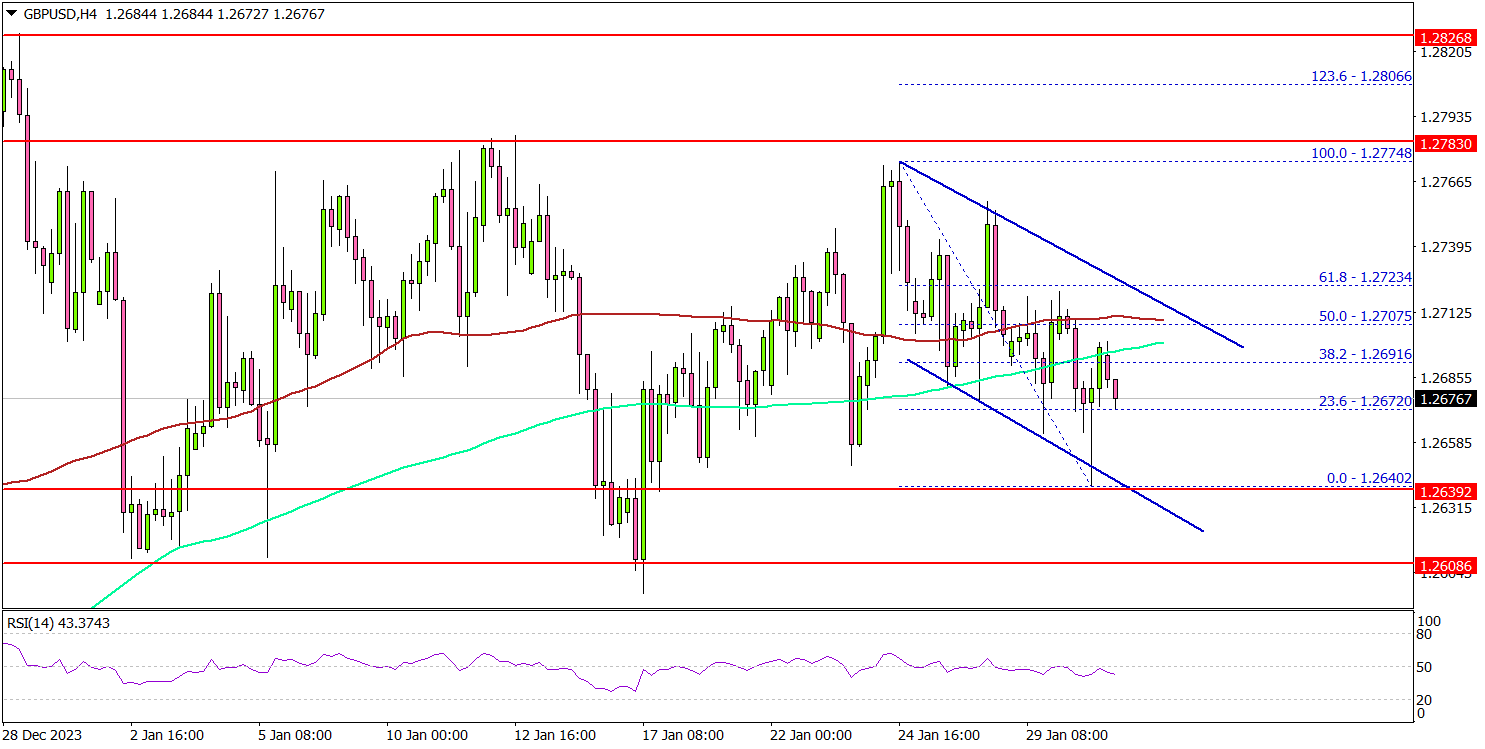
Looking at the 4-hour chart, the pair is showing a few positive signs from the 1.2640 support. The bulls are now attempting a fresh increase above the 1.2665 level. On the upside, the bulls are facing hurdles near the 1.2700 level.
There is also a key declining channel forming with resistance near 1.2700 on the same chart. It is close to the 100 simple moving average (red, 4 hours) and the 200 simple moving average (green, 4 hours).
The next key resistance is near the 1.2740 level. A close above the 1.2740 zone could open the doors for more upsides. The next stop for the bulls might be 1.2780. Any more gains might send EUR/USD toward the 1.2850 level.
If there is another decline, the pair might find bids near the 1.2640 level. The main support sits near the 1.2600 level. If there is a downside break below the 1.2600 level, the pair could even dive below 1.2565. The next major support is 1.2520. Any more losses might call for a drop toward the 1.2440 support.
Looking at EUR/USD, the pair is showing bearish and there is still a risk of more downsides below the 1.0800 support zone.
Economic Releases
- US ADP Employment Change for Jan 2023 - Forecast 145K, versus 164K previous.
- Fed Interest Rate Decision - Forecast 5.5%, versus 5.5% previous.
BoJ summary of opinions suggests rate hike within reach
The Summary of Opinions from BoJ's meeting on January 22-23 signaled the central bank's intensified focus on initiating its first rate hike since 2007 and moving away from its long-standing negative interest rate policy. The deliberations, however, stopped short of providing a clear timeline for these policy shifts.
A notable hawkish sentiment within BoJ pointed to the "growing possibility" of significant wage revisions in the upcoming spring, at "relatively higher levels" than in the past. This perspective is underpinned by the recognition of "improving trend" in both economic activities and price. Such developments suggest that the necessary conditions for revising monetary policy, including ending the negative interest rate regime, are increasingly "being met".
Concurrently, the impact of Noto Peninsula Earthquake on is a key factor under close observation. One opinion suggested that, after a thorough assessment of the earthquake's effects over "the next one or two months", BoJ is "highly likely to reach a point where it can normalize monetary policy".
On the other side of the spectrum, a more cautious stance was also expressed. While acknowledging that the probability of achieving the BoJ's 2 percent price stability target is becoming "more realistic", it was noted that certainty in reaching this goal is not yet fully established. However, this view also supports the initiation of discussions regarding the exit from the current monetary policy stance.
ECB’s Lagarde emphasizes wage growth as key determinant for rate cut decision
ECB President Christine Lagarde emphasized that the central bank is not yet ready to initiate rate cuts, underscoring the need for comprehensive data analysis
In a CNN interview overnight, she stated, "We are not there yet," added that the decision to loosen monetary policy hinges on "all sorts of data". She also singled out the significance of wage data as "critically important."
Despite acknowledging a clear disinflationary trend, Lagarde noted that ECB requires a deeper understanding and progression into this trend to make a well-informed decision. "We are on a disinflationary trend — no question about it," she confirmed, "But we need to be further into that process."
Lagarde's remarks also touched upon the consensus within the ECB regarding the direction of the next policy move. "I think we all agree that the next move" will be a cut, she said, aligning with the general anticipation of eventual rate reductions. However, the timing remains uncertain and subject to thorough examination of upcoming economic data.
A key factor in the timeline for interest rate cuts is the availability of wage growth data, which is not expected until after ECB's April meeting. This positions the June meeting as a more likely juncture for the consideration of rate cuts.
What To Trade In February
Major currency pairs like USD/JPY and USD/CHF face potential shifts in trends as central banks reevaluate interest rates. The Euro and British Pound are poised for nuanced movements based on economic conditions and rate decisions. Meanwhile, the Australian and New Zealand Dollars grapple with changing interest rate differentials and economic uncertainties. For now though, let’s look at a few trading opportunities for the month of February.
AUDUSD - D1 Timeframe
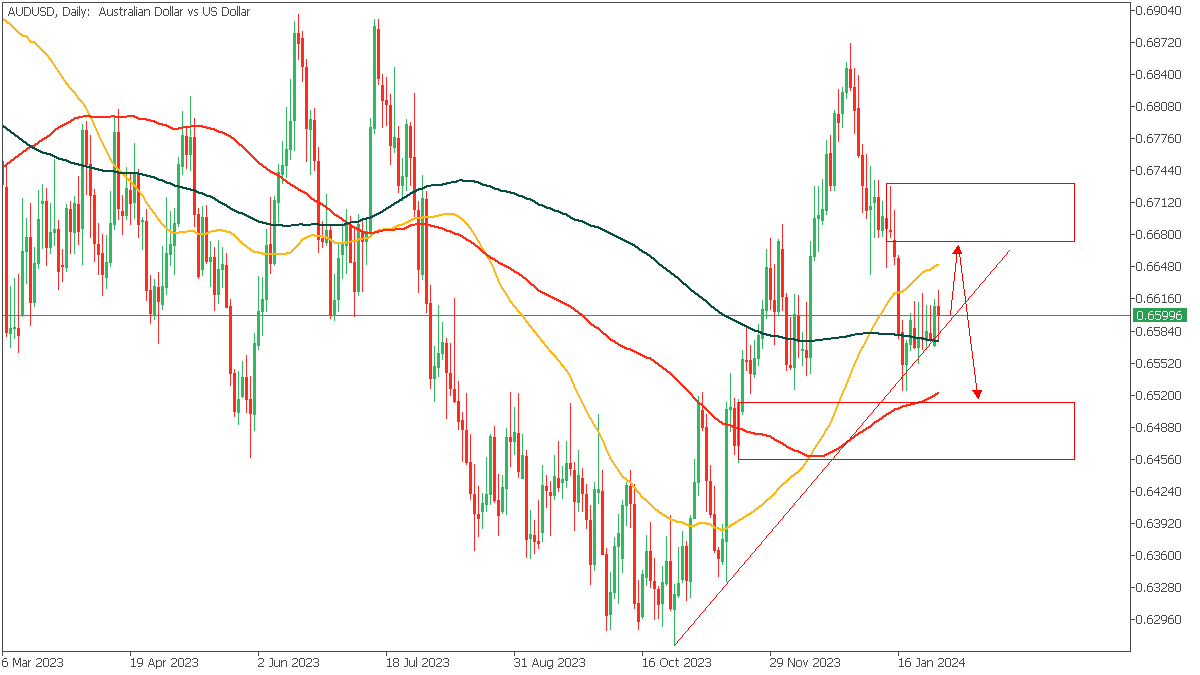
AUDUSD seems to be under a lot of bullish pressure from the trendline support and the 100-day moving average, both of which seem to be preventing prices from going any lower than they already are. This means we could get to see price scale up slightly to shake off some of the pressure, before sliding much lower to break the trendline and reach the 200-day moving average target below.
Analyst’s Expectations:
- Direction: Bearish
- Target: 0.65159
- Invalidation: 0.67356
GBPJPY - D1 Timeframe
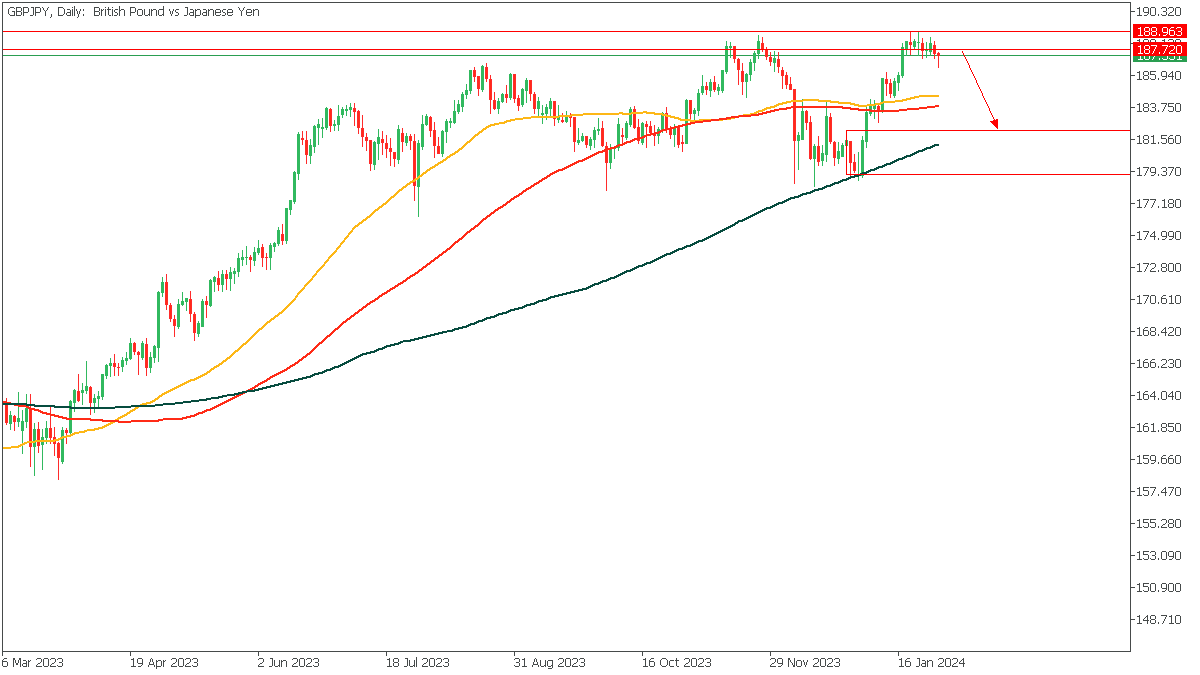
GBPJPY has been sulking around the weekly supply zone, with a very sluggish price action that indicates slowing momentum from the buyers. This simply means that with the advent of new selling pressure, we can expect to see GBPJPY slide much lower towards the 200-day moving average as a target.
Analyst’s Expectations:
- Direction: Bearish
- Target: 184.047
- Invalidation: 188.700
EURAUD - D1 Timeframe
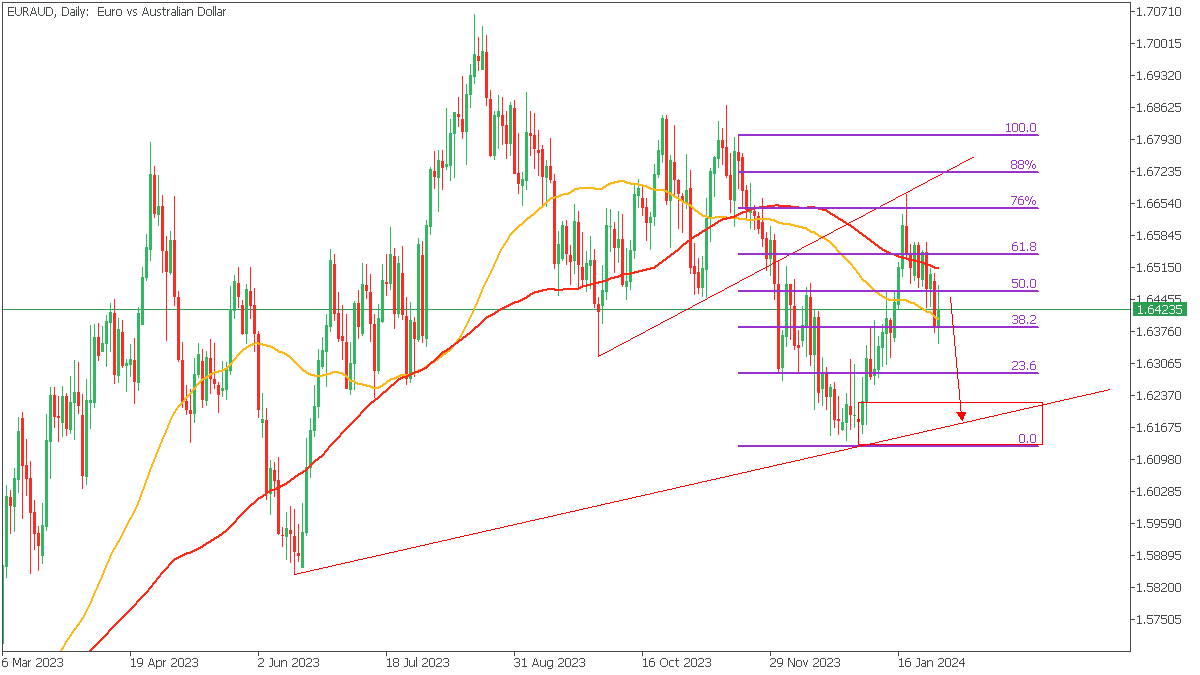
EURAUD as seen on the chart recently got rejected from the intersection of the trendline resistance, and the 76% Fibonacci retracement level. The bearish array of the 100 and 50-day moving averages is another confluence in favour of the bearish sentiment. In this case, though, my target is not a moving average, rather, it is the demand zone that is seen overlapping the trendline support in the attached chart image.
Analyst’s Expectations:
- Direction: Bearish
- Target: 1.62309
- Invalidation: 1.65113
CONCLUSION
The trading of CFDs comes at a risk. Thus, to succeed, you have to manage risks properly. To avoid costly mistakes while you look to trade these opportunities, be sure to do your due diligence and manage your risk appropriately.
EURJPY: With Bullish Reversal and Target at Breakout of 161.00
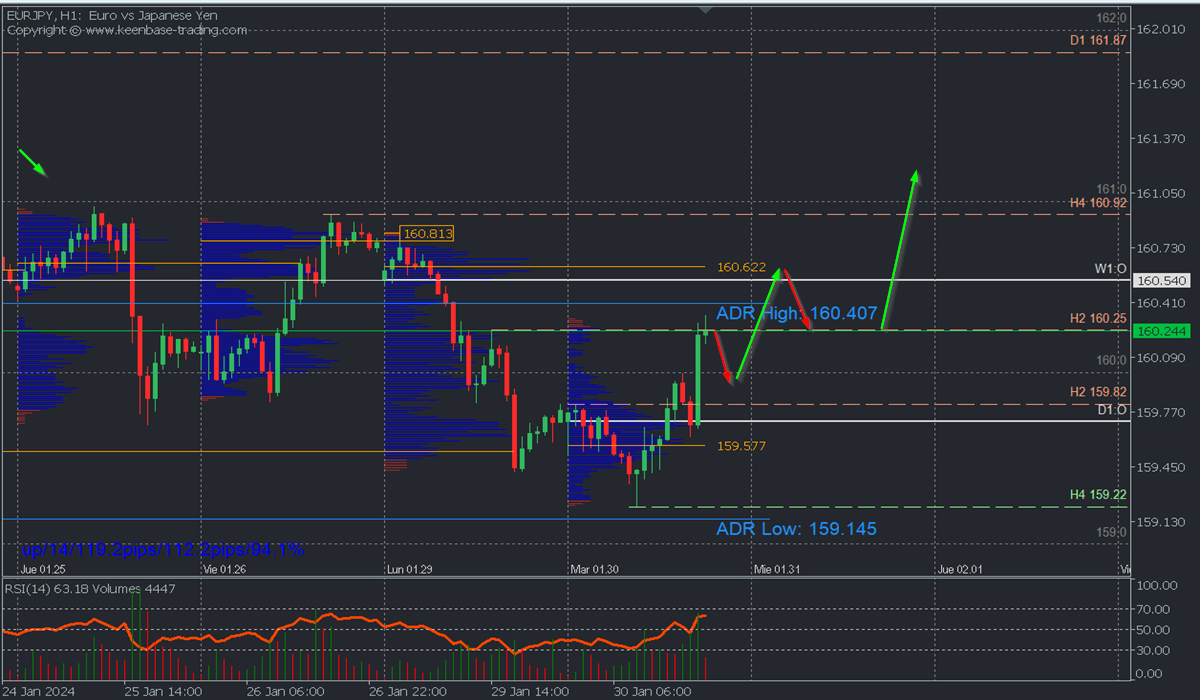
Bullish Scenario: Buying above 160.00 (expecting a pullback to this zone) with TP1: 160.62 (uncovered POC*), TP2: 160.81, and TP3: 161.00 on an intraday basis. It is recommended to set a stop loss (S.L.) below 159.82 or at least 1% of the account capital**.
Bearish Scenario: Selling below 160.25 with TP1: 160.00, TP2: 159.82, and upon its breakout TP3: 159.63. It is recommended to place a stop loss above 160.42, at least 1% of the account capital**. A trailing stop can be used.
Analysis from a daily chart. Volume Profile and Structure.
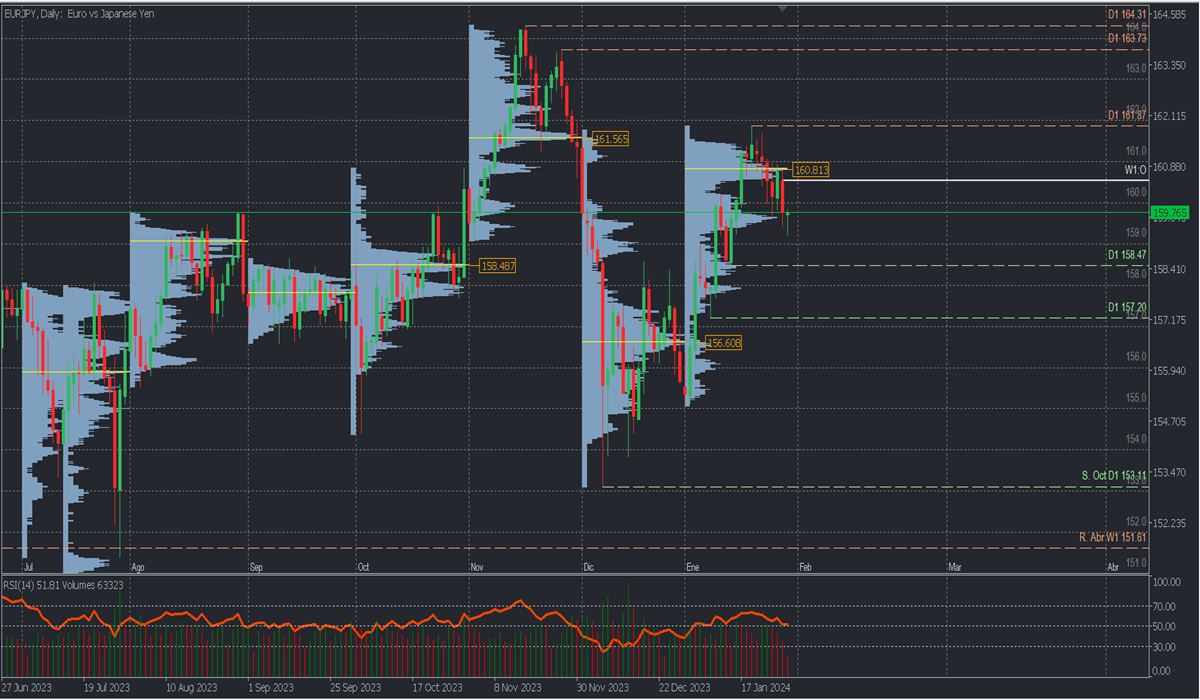
EURJPY is one of the pairs that best reflects market risk sentiment, and we have seen the recovery throughout January, rising from the December buying zone between 155.00 and 156.60 to the November selling zone around 161.56.
Now, we observe that January is leaving an uncovered POC* at 160.81, which triggered the current downward movement to the next high-volume node at approximately 159.70. Thus, it can be expected that the next bullish retracement will return to the monthly POC, with two possible outcomes:
- The most likely scenario is a bullish breakout above 161, considering it would be the second time, following the rebound on Friday, January 26, indicating the possibility of prices renewing purchases, aiming to break January's resistance at 161.87 and continue bullish towards 163.00. This scenario seems more likely as the RSI stays positive, and bounces from 50, indicating a possible rebound, and the vertical volume has decreased during the last descent.
- The second scenario will be activated after a new price rebound from January's POC at 160.81 with a more extended correction to challenge the last significant support at 158.47, whose confirmed breakout will reverse the month's bullish trend. The bullish trend will remain active as long as this support is not broken.
Scenario from an H1 chart:
Prices show a bullish reversal pattern for the day, leaving support at 159.22 and a confirmed breakout with a second bullish movement from resistance at 159.82. Intraday buying targets of this reversal have been reached. Still, further bullish continuation can be expected in the coming days after the retracement towards 160.00 and 159.82, with a new surge towards the next selling zone at the uncovered POC* 160.62. Its breakout on a second touch brings us closer to January's macro POC at the macro selling zone of January, with the possibility of being broken and extending the advance above 161.00, confirming the bullish scenario proposed in the daily chart.
This bullish perspective will remain valid as long as the retracement does not break the buying zone that originated the intraday bullish reversal around 159.57, very close to the last significant support at 159.63. In that case, selling will be resumed.
*Uncovered POC: POC = Point of Control: It is the level or zone where the highest volume concentration occurred. If there was a downward movement from it previously, it is considered a selling zone and forms a resistance zone. Conversely, if there was a bullish impulse previously, it is considered a buying zone, usually located at lows, forming support zones.
**Consider this risk management suggestion
**It is very important that risk management is based on capital and traded volume. Therefore, a maximum risk of 1% of the capital is recommended. It is suggested to use risk management indicators like the Easy Order.
XAUUSD: Review of Recent Price Action
Gold prices, stable above $2,000 per ounce, commenced the week on an uptrend driven by a rallying US dollar and anticipation surrounding the upcoming Federal Reserve meeting. Analysts highlight that the market is keen on the Fed's signals for the coming months rather than immediate announcements. Gold touched $2,037 per ounce, holding near this level into Tuesday's session. Until the US jobs report, gold prices are likely to be influenced by the US dollar's performance and Treasury market movements. The US Dollar Index (DXY) reached 103.63, up 2.3% for the year. The strong dollar traditionally exerts downward pressure on dollar-denominated commodities.
XAUUSD - D1 Timeframe
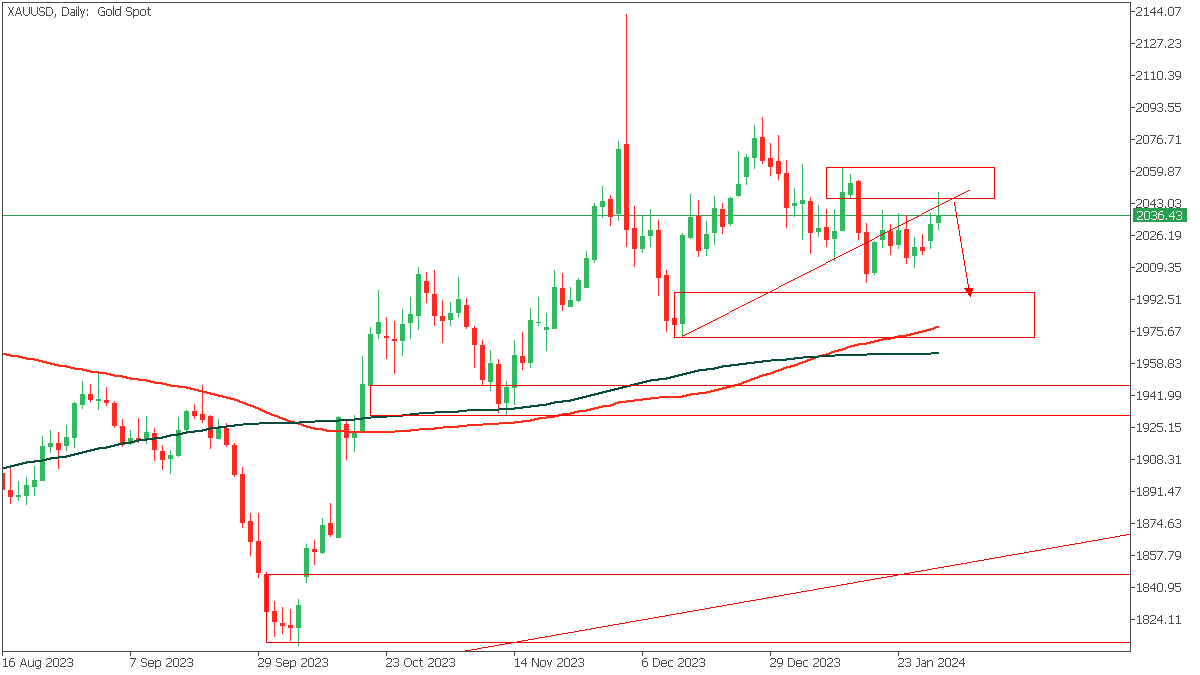
The last time we looked at XAUUSD, I mentioned that we were to wait for a break and retest of the trendline before picking a side; that seems to be happening right now. As seen on the chart, price broke below the trendline, then reached back up to retest the supply zone. Following such a move, price usually tends to continue in the direction of the breakout, so let’s see if the lower timeframe agrees with this sentiment.
XAUUSD - H4 Timeframe
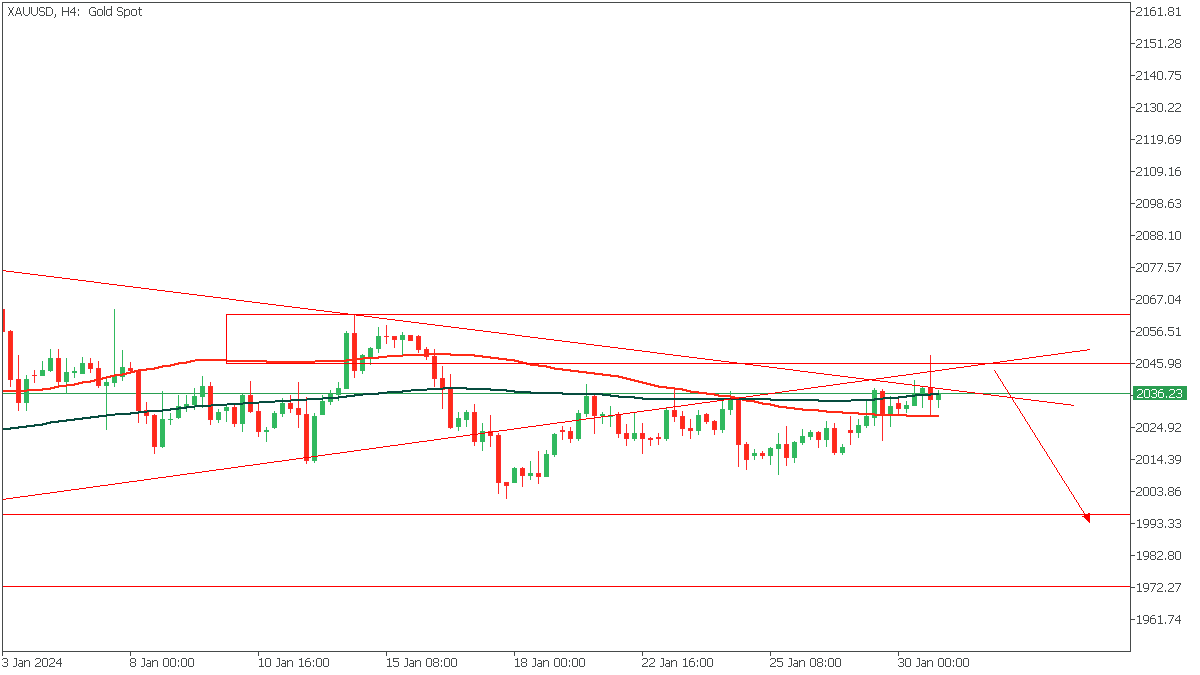
On the 4-hour timeframe of XAUUSD, price seems to have been rejected from the intersection of the two trendlines, as well as the supply zone. This means we have a total of 4 confluences if we include the bearish array of the moving averages. In line with the technical factors, my sentiment is bearish, until price presents a conflicting argument.
Analyst’s Expectations:
- Direction: Bearish
- Target: $1997.55
- Invalidation: $2045
CONCLUSION
The trading of CFDs comes at a risk. Thus, to succeed, you have to manage risks properly. To avoid costly mistakes while you look to trade these opportunities, be sure to do your due diligence and manage your risk appropriately.
Gold Wave Analysis
- Gold reversed from resistance level 2016.00
- Likely to rise to resistance level 2085.00
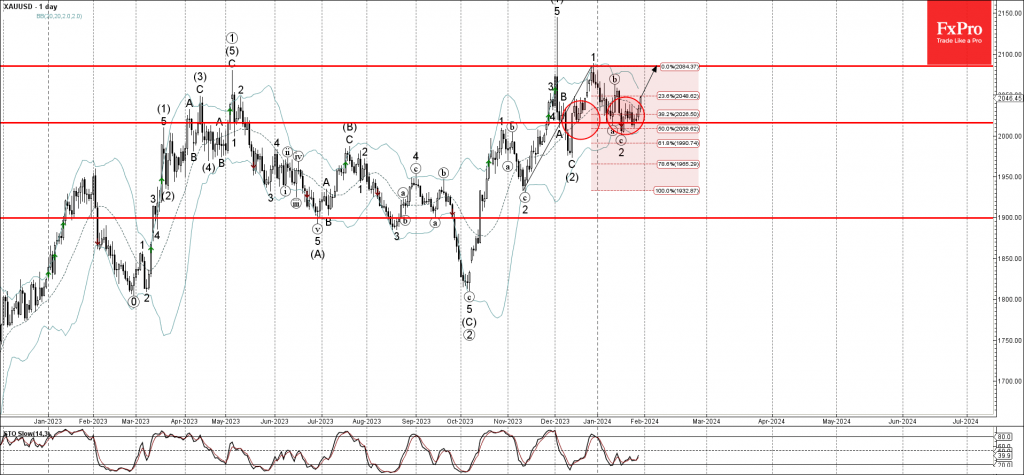
Gold recently reversed up from the key resistance level 2016.00, which stopped the previous corrections (a) and 2.
The resistance level 2016.00 was strengthened by the lower daily Bollinger Band and by the 50% Fibonacci correction of the upward impulse from November.
Given the clear daily uptrend, Gold can be expected to rise further to the next resistance level 2085.00 (top of the previous impulse wave 1 from the end of December).
GBPJPY Wave Analysis
- GBPJPY reversed from resistance level 79.15
- Likely to fall to support level 184.50
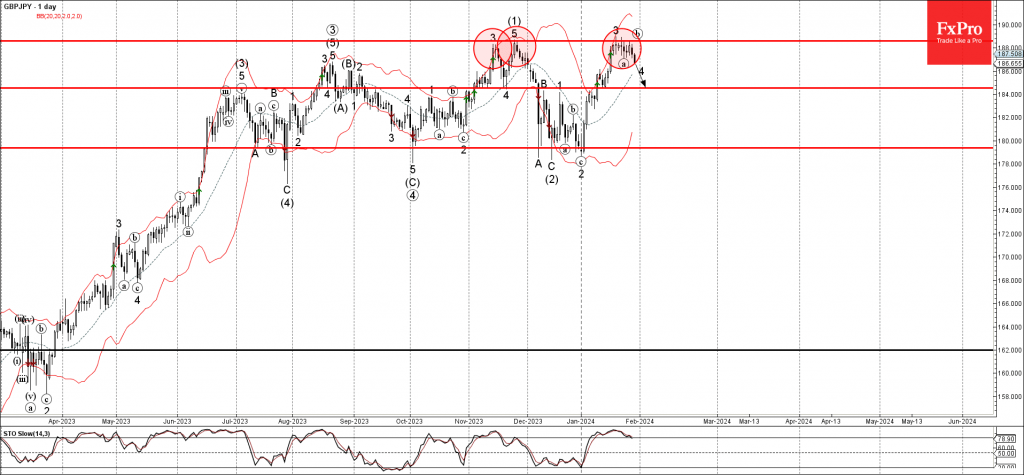
GBPJPY currency pair recently reversed down from the key resistance level 188.55 which has been reversing the price from November, as can be seen below.
The downward reversal from the resistance level 188.55 started the active short term impulse wave c.
Given the strength of the resistance level 188.55 and the strong sterling sales seen across the FX markets today, GBPJPY currency pair can be expected to fall further to the next support level 184.50.