Sample Category Title
RBNZ’s Conway: We still have a way to go on inflation
RBNZ Chief Economist Paul Conway struck a hawkish tone in a speech today, tempering market expectations for imminent policy easing. Conway acknowledged the effectiveness of current monetary policy in slowing the economy and reducing inflation. But he emphasized noted that the journey to achieving the target midpoint is far from over. His remarks also indicated that recent weaker GDP data would not automatically lead to a dovish shift in RBNZ's approach.
Conway stated, "Monetary policy is working, with the economy slowing and inflation falling. But we still have a way to go to get inflation back to the target midpoint." He added that the upcoming February Statement would offer more insights, grounded in comprehensive data analysis.
Furthermore, Conway pointed out recent GDP revisions don't necessarily imply a significant reduction in the economy's capacity pressures. He highlighted that private demand, which is more responsive to interest rate changes, has seen upward revisions, particularly in consumption and business investment.
Conway also pointed out that annual non-tradable inflation at 5.9% was higher than RBNZ's forecasts, even though headline CPI slowed to 4.7% in Q4 while core inflation have also fallen.
WTI Wave Analysis
- WTI crude oil reversed from resistance level 79.15
- Likely to fall to support level 75.00
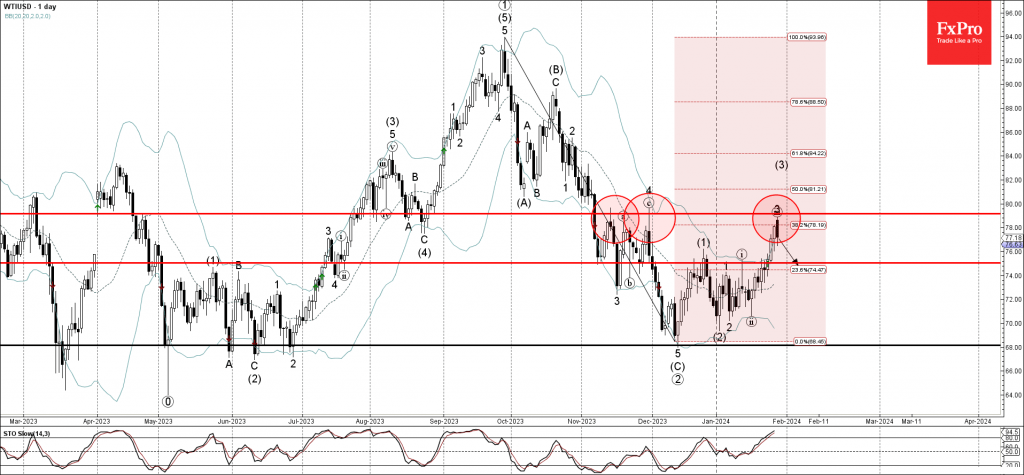
WTI crude oil recently reversed down from the key resistance level 79.15, which has been reversing the price from November, as can be seen below.
The resistance level 79.15 was strengthened by the upper daily Bollinger Band and by the 38.2% Fibonacci correction of the downward impulse from September.
Given the overbought daily Stochastic, WTI crude oil can be expected to fall further to the next support level 75.00 (former top of wave i from the start of this month).
S&P 500 Wave Analysis
- S&P 500 rising strongly
- Likely to rise to resistance level 5000.00
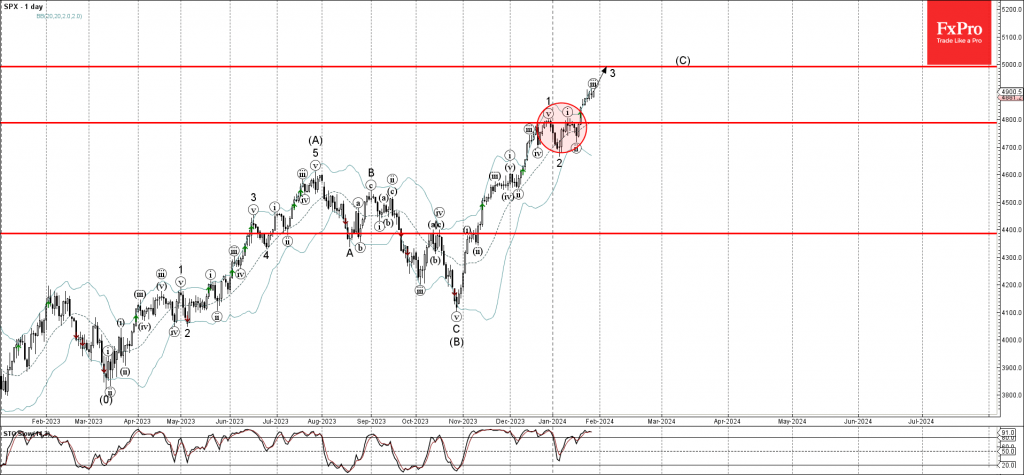
S&P 500 index rising strongly after the price broke above the resistance level 4800.00 (which stopped the previous impulse waves 1 and i, as can be seen below).
The breakout of the resistance level 4800.00 accelerated the active minor impulse wave 3 of the intermediate impulse wave (C) from the end of October.
Given the clear daily uptrend, S&P 500 index can be expected to rise further to the next round resistance level 5000.00, target for the completion of the active impulse wave (C).
EUR Weakness May Endure In February
EURUSD, a major indicator of Euro’s strength, finds itself in a state of indecision, with sideways movement near 1.0850 following two consecutive weeks in negative territory. The absence of clear recovery signals in the near-term technical outlook reflects the cautious stance of market participants. As the pair navigates this period of uncertainty, all eyes are on the upcoming Federal Reserve policy meeting and high-tier macroeconomic data releases, which have the potential to spark significant movements and set the tone for EURUSD in the near future. Traders should remain vigilant and adaptable to swiftly respond to emerging market dynamics.
EURAUD - D1 Timeframe
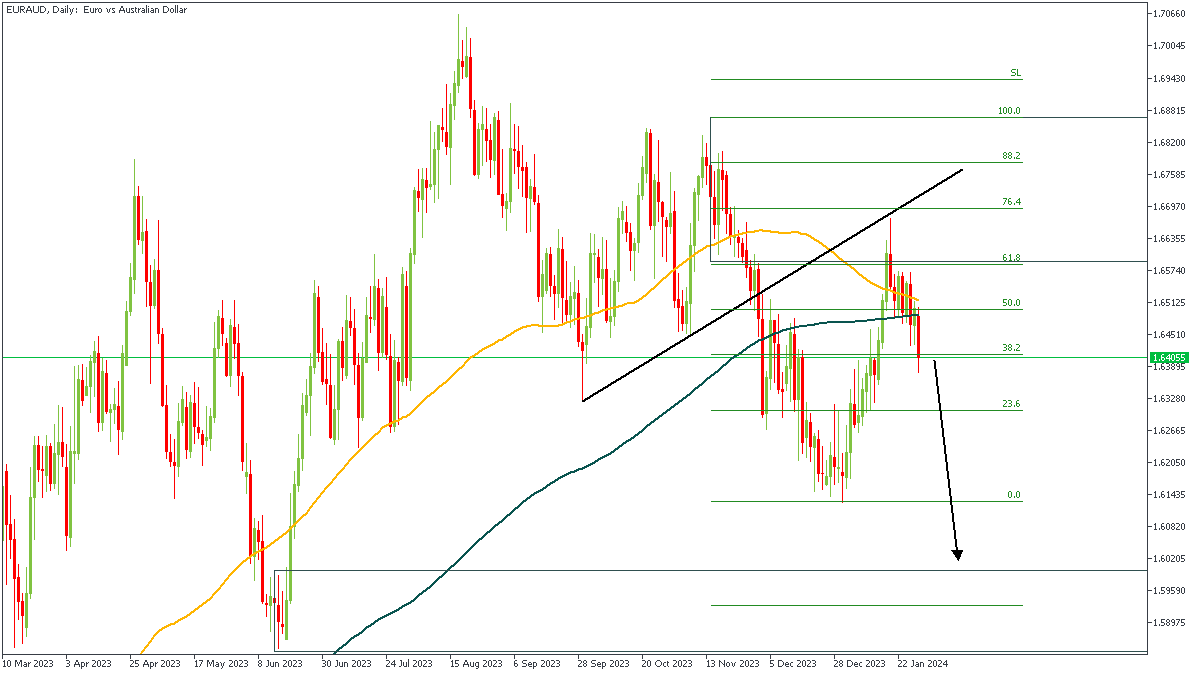
EURAUD has maintained a steady decline on the Daily timeframe after being rejected from the resistance trendline and the 76% of the Fibonacci retracement. What this often implies is the likelihood of price to create a new lower low. My overall target on this EURAUD idea is the highlighted demand zone, though my initial TP is the previous low.
Analyst’s Expectations:
- Direction: Bearish
- Target: 1.62962
- Invalidation: 1.64750
EURNZD - D1 Timeframe
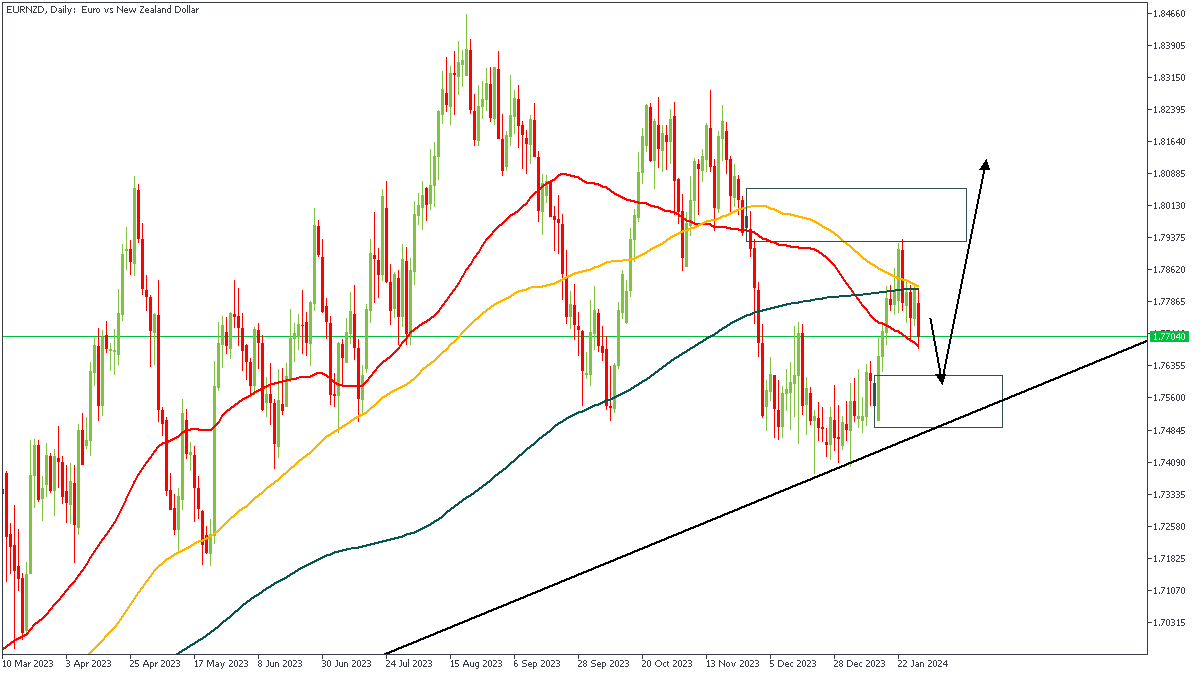
EURNZD has been rejected from the supply zone as shown and could very well be heading towards the demand zone in hopes of making a bullish recovery. The trendline support overlapping the demand zone could incline price to return higher, however, the bearish direction is expected to play out first.
Analyst’s Expectations:
- Direction: Bearish
- Target: 1.76540
- Invalidation: 1.77701
EURJPY - D1 Timeframe
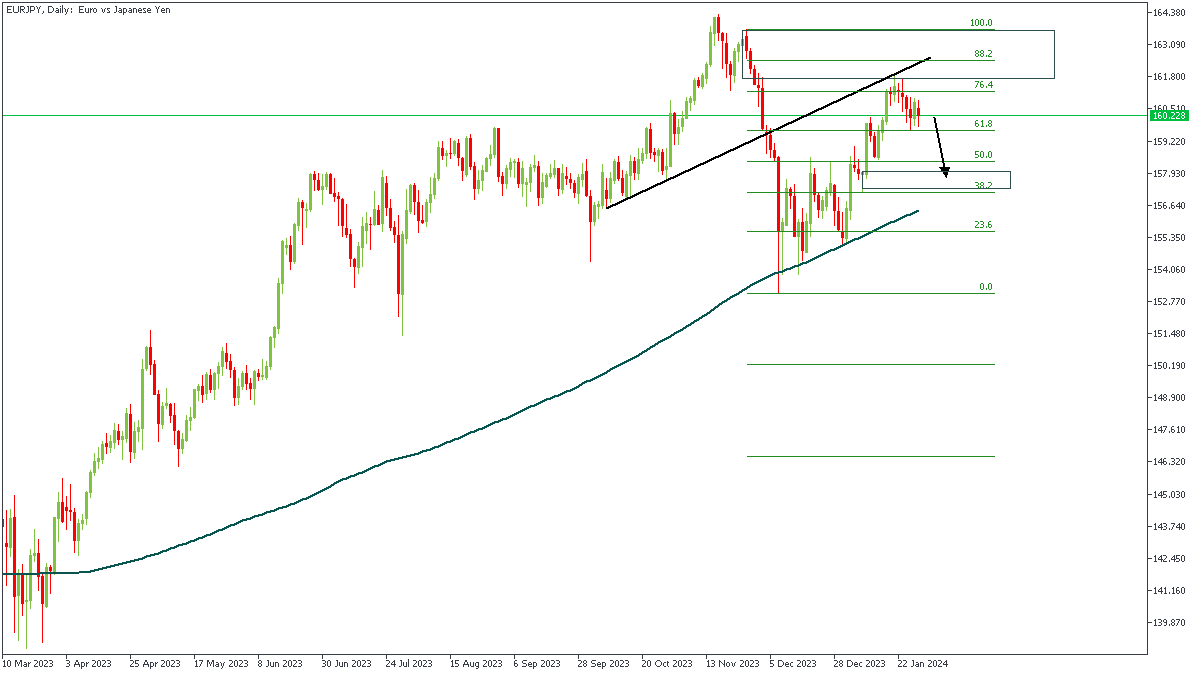
After breaking below the trendline support, the price action on EURJPY got rejected from the trendline and the 76% of the Fibonacci retracement. Based on the confluence from the supply zone, the FIbonacci levels, and the trendline resistance, I will position my entry for a sell with a target around the previous low of the market structure.
Analyst’s Expectations:
- Direction: Bearish
- Target: 158.127
- Invalidation: 160.756
CONCLUSION
The trading of CFDs comes at a risk. Thus, to succeed, you have to manage risks properly. To avoid costly mistakes while you look to trade these opportunities, be sure to do your due diligence and manage your risk appropriately.
USD in Limbo as Market Anticipates Fed’s Decision
The EUR/USD currency pair is experiencing minimal fluctuations as it consolidates around 1.0840 this Monday. The focus of market players is squarely on the upcoming meeting of the US Federal Reserve System, which is poised to be the week's pivotal event. The outcome of this meeting is highly anticipated, as the Fed will disclose whether it plans to lower interest rates in March or opt for a more cautious approach, delaying any changes until May.
This meeting is significant as the Federal Reserve is expected to be the first major central bank in this cycle of stringent policies to initiate a softening of monetary conditions. This prospect has injected a sense of heightened anticipation into the currency markets.
Later in the week, additional attention will be on the release of US labor market statistics for January. Key indicators to watch include the Nonfarm Payrolls (NFP), forecasted to show a rise of 173 thousand – a slowdown from the previous 216 thousand. Additionally, average hourly earnings are projected to exhibit a 0.3% month-over-month increase, slightly down from the prior 0.4% increase.
EUR/USD Technical Analysis
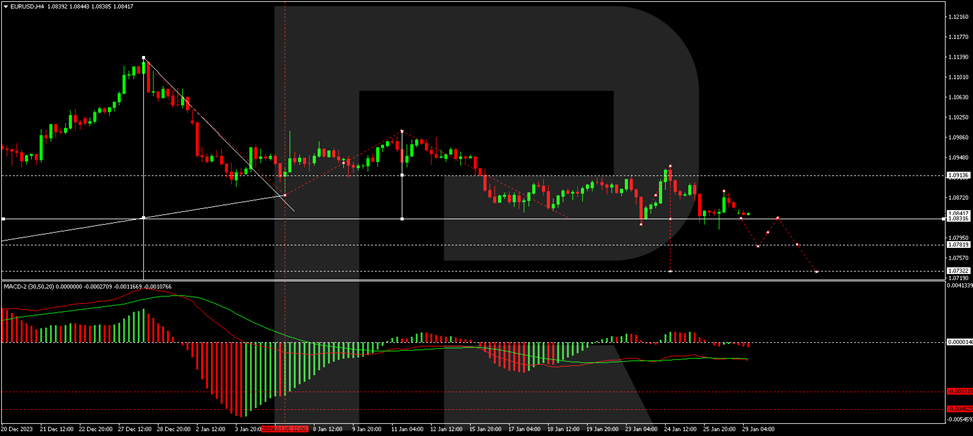
On the H4 chart of EUR/USD, a downward trend towards 1.0793 is emerging. Following this target, a corrective move to 1.0833, testing from below, is possible before a further decline to 1.0737. The MACD indicator supports this outlook, with its signal line below zero and pointing downwards.
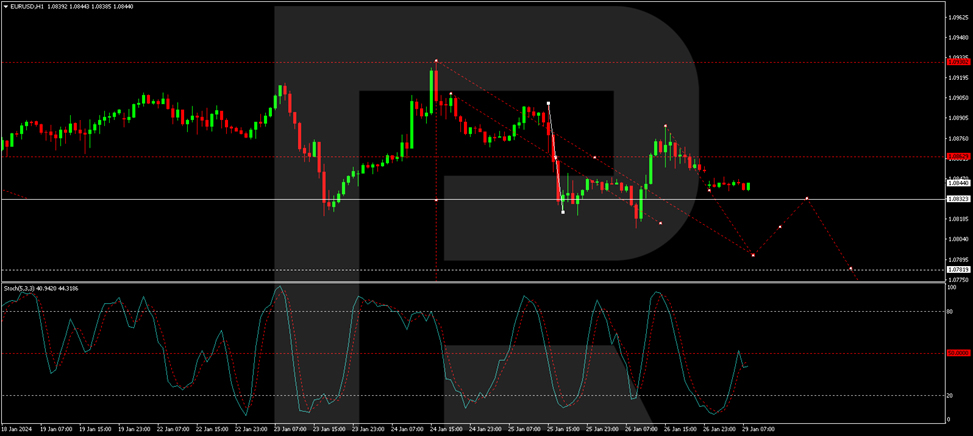
In the H1 chart analysis, the pair has completed a correction to 1.0884 and has started a new downward movement towards 1.0839. A consolidation range is expected to form around this level. If the pair breaks below this range, the decline could continue to 1.0803. The Stochastic oscillator, currently at the 50 mark, indicates a potential drop to 20, aligning with this downward trend scenario.
Sunset Market Commentary
Markets
There were few data to inspire global trading today. With policy meetings scheduled on Wednesday and on Thursday, Fed and BoE MPC members currently also abstain from comments on monetary policy. Luckily, ECB governors are again free to speak and temporarily have some kind of monopoly in setting sentiment. Looking at the comments post last week’s ECB meeting, it probably will take some diplomacy for ECB chair Lagarde to reach a consensus on the timing of a first rate cut. Of course, Lagarde’s assessment on Thursday that the ECB is data driven and not calendar driven, wasn’t the best way to reinforce/clarify the message from Davos that it probably will take until summer for the ECB to see the conditions being fulfilled for first rate cut. Hawkish members on Friday and this weekend maintained the view that the ECB needs to be sure that wage rises are again in line with the 2.0% target and that this confirmation won’t be available in March or April. Other more neutral/dovish oriented ECB governors use the idea that the ECB is not calendar but data driven to keep the door open for an early rate hike. In this respect, ECB’s de Guindos indicated that there has been good news on inflation recently and that this will end up being reflected in monetary policy. Markets also still felt confirmed in their dovish positioning by comments from ECB’s Villeroy this weekend as he said that, in a data dependent approach, the ECB could cut rates at any meeting this year. German yields continue their post-ECB decline easing between 7 bps (5-y) and 3.5 bps (30-y). US yields show a similar, slightly less outspoken pattern, ceding between 1.5 bps (2-y) and 4.0 bps (10-y). The prospect of/hope for a further easing of monetary conditions today didn’t trigger additional gains in equities. However, losses remain negligible, keeping recent all-time highs (S&P500; opening little changed) or cycle peak levels (Eurostoxx50, -0.1%) within reach. Brent oil opened north of $84 p/b in Asia on rising tensions between the US and Iran, but didn’t maintain the gains ($83 p/b currently). On FX markets, ongoing market speculation on an ‘early’ ECB rate cut and a more balanced risk sentiment causes euro underperformance. EUR/USD is setting a now 2024 low near 1.081. EUR/GBP (0.852) is coming ever closer to the 0.8493 2023 low. Even EUR/ bove the 160 barrier.Tomorrow, the calendar contains US consumer confidence (Conference board), the JOLTS job openings, EMU economic confidence and the first estimate of the EMU Q4 GDP. Spain and Belgium will already publish first January CPI data. We also look out whether the National Bank of Hungary will step up the pace of rate cuts from 75 bps to 100 bps.
News & Views
Belgian GDP grew by 0.4% in volume terms in the fourth quarter of 2023 compared with the previous quarter, the National Bank of Belgium said in its initial estimate. In year-on-year terms, the economy today is 1.6% larger than in Q4 of 2022. The first NBB calculations only entail a sectoral breakdown. Industry weighed on the activity. Value added in the sector shrank by 0.6% q/q. Services (+0.7%) and especially construction (+1%) reported positive growth. For 2023 as a whole, GDP grew by 1.5%. Value added fell by 3.1% in industry. Value added was up by 1.9% in construction and 2.6% in services.
Sweden’s monthly GDP indicator showed activity shrank in December of last year at -0.3% m/m. This follows a downward revision to November from +0.2% to -0.2%. The preliminary December reading resulted in a first estimate of the quarterly dynamics. Growth in that period amounted to 0.1%, less than the 0.3% analysts were expecting. The economy stagnated on a yearly basis, defying expectations for a 0.4% contraction. The series offer an early glimpse on the economy but differ from the regular quarterly publications as they are based on a limited set of data. If the Q4 data gets confirmed by the official reading end next month, it marks an escape from a (technical) recession where growth shrank 0.8% and 0.3% q/q in the previous two quarters. Sweden Statistics said that “weaker figures for domestic use were weighed up by a strengthening of net exports.” Signs of weak consumer spending indeed can be found in a separate release of the December retail sales in Sweden. Monthly sales fell by 0.2%, similar to November. The yearly figure came in at -2.2%, marking the 20th sub-zero reading. The Swedish krone reacted stoic. EUR/SEK is holding steady around 11.35.
JP 225 Stock Index Eyes 161.8% Fibo After Pullback from 34-year High
- Japan’s benchmark index attempts to regain positive footing
- 37,000 level is still in sight
- But bullish momentum may not be strong enough
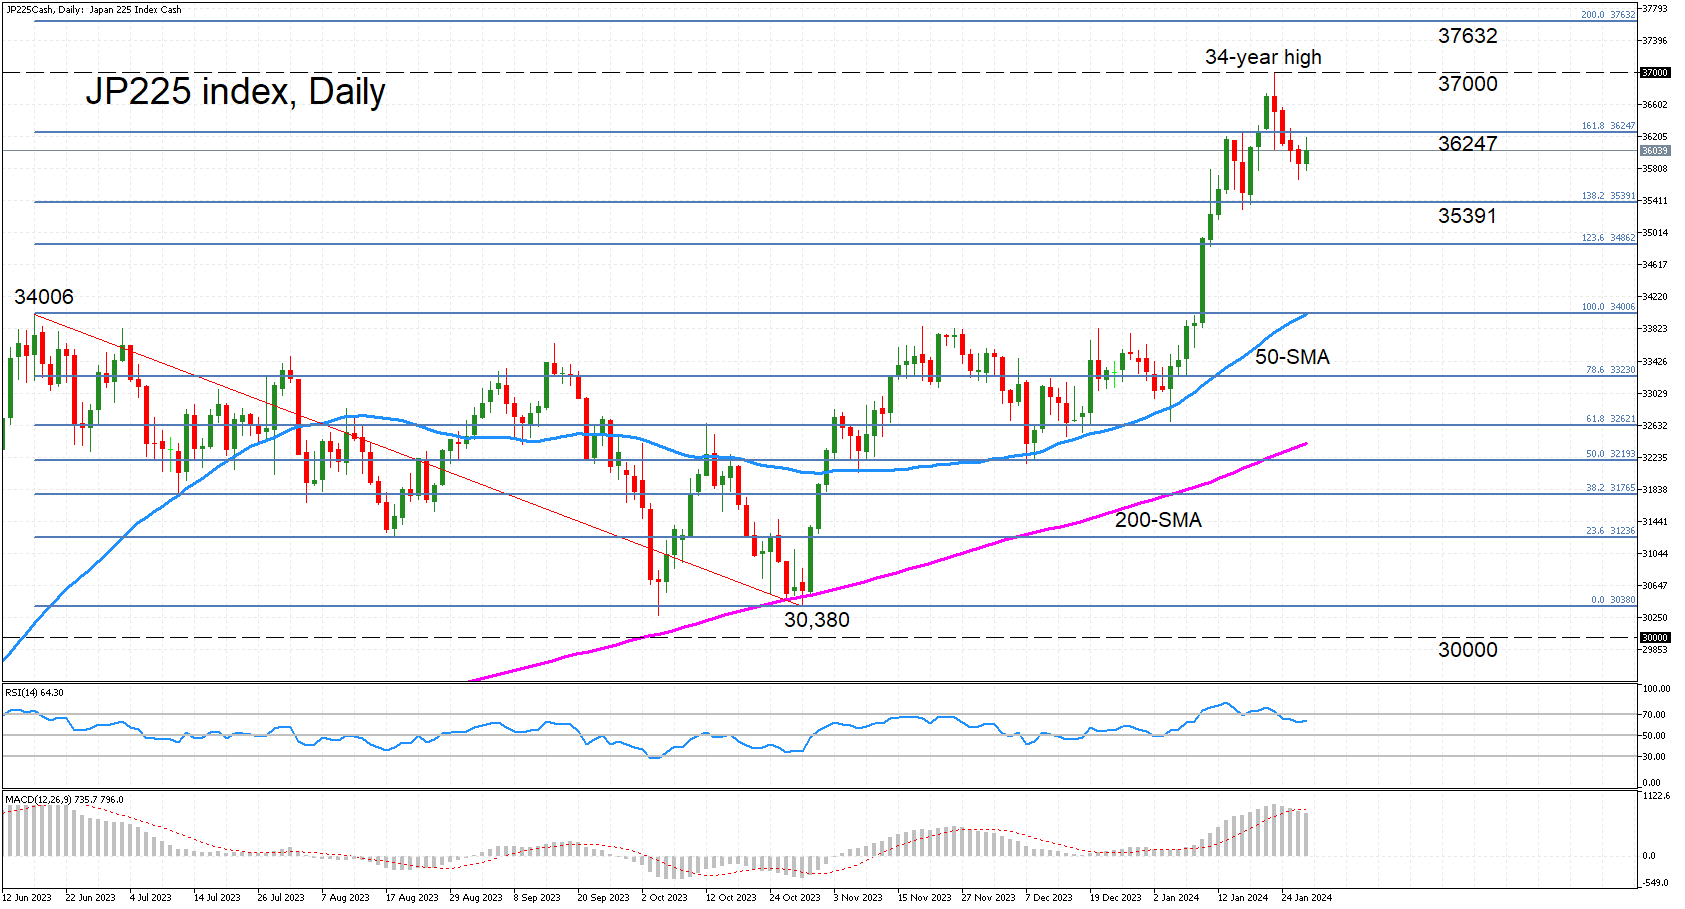
The Japan 225 stock market index (cash) edged up on Monday, heading towards the 161.8% Fibonacci extension of the June-October 2023 downtrend at 36,247. Overcoming this barrier is crucial to being able to have another go at reclaiming the 37,000 level after coming just shy of it last week when it briefly hit a 34-year high of 36,991.
The positive momentum has waned following the pullback from that top, but the bulls have not given up yet. The RSI is ticking higher today just below the 70 level, while the MACD appears to be stabilizing slightly below its red signal line and remains not too far from last week’s peak.
If the price is able to jump above the 161.8% Fibonacci, the 37,000 mark is bound to be the next target on the upside. A climb above it would reinforce the medium-term uptrend, bringing into scope the 200% Fibonacci extension of 37,632.
However, if today’s rebound falters, the bears are likely to regain the upper hand, pulling the price down to the 138.2% Fibonacci extension of 35,391 initially. Should this support fail, the focus would probably turn to the 50-day simple moving average (SMA) in the 34,000 area. Any further decline that takes the price below the 50-day SMA would risk shifting the positive outlook to neutral.
In brief, there is some hope that a fresh 34-year high can still be achieved in the near term if the index can recover above the 161.8%. Otherwise, the downside correction may extend until the 50-day SMA, endangering the bullish structure.
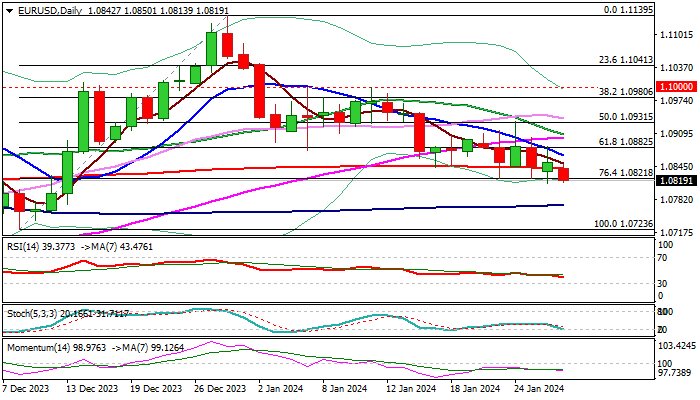
EURUSD – Repeated Probe Through Pivotal Supports Adds to Negative Near-term Bias
Bearish pressure rises on break below 200DMA (1.0841) and probe through 1.0821 Fibo support (76.4% retracement of 1.0723/1.1139 upleg), as fresh bears also violate the floor of four-day congestion.
Firm break lower to signal continuation of short-term downtrend from 1.1139 (Dec 28 peak) and expose targets at 1.0771 / 56 (100DMA / daily cloud base) and 1.0723/12 (Dec 8 higher low / Fibo 61.8% of 1.0448/1.1139 ascend).
Near-term bearish bias is reinforced by negative momentum and daily MA’s in bearish setup, though close below 1.0821 pivot is required to keep bears in play.
Res: 1.0841; 1.0867; 1.0882; 1.0905
Sup: 1.0812; 1.0771; 1.0756; 1.0723
Bitcoin – Recovery Faces Increased Headwinds at Key Resistance Zone
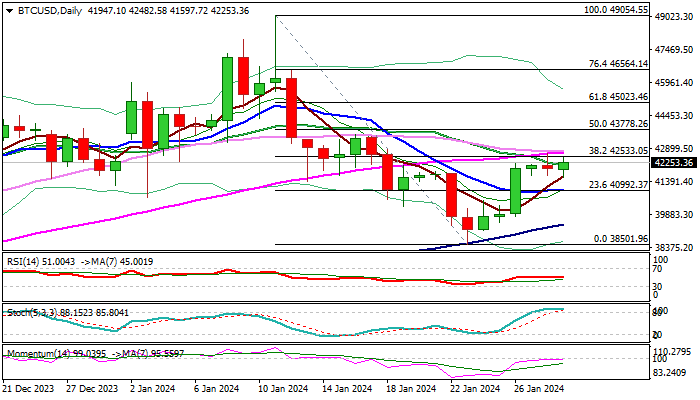
Narrow sideways mode extends into third consecutive day after recovery from two-month low (38501 of Jan 23) showed signs of stall at key resistance zone (42500).
The price action is on track to form the third straight daily Doji candle which points to strong indecision and contributes to signals that corrective phase might be over.
Daily studies remain bearishly aligned as 14-d momentum is still in negative territory, stochastic turned south in overbought zone, though MA’s are in mixed setup.
However, more evidence is needed to signal fresh direction, with dip and close below 10DMA (41036) to generate reversal signal and shift focus to the downside foe renewed probe through key supports at 40000/39000 zone.
Alternatively, sustained break of 42500/42700 zone would signal bullish continuation, which will be confirmed on lift and close above daily cloud top (43173).
Res: 42533; 42754; 43173; 43778
Sup: 41597; 40992; 40000; 39392