

Sample Category Title
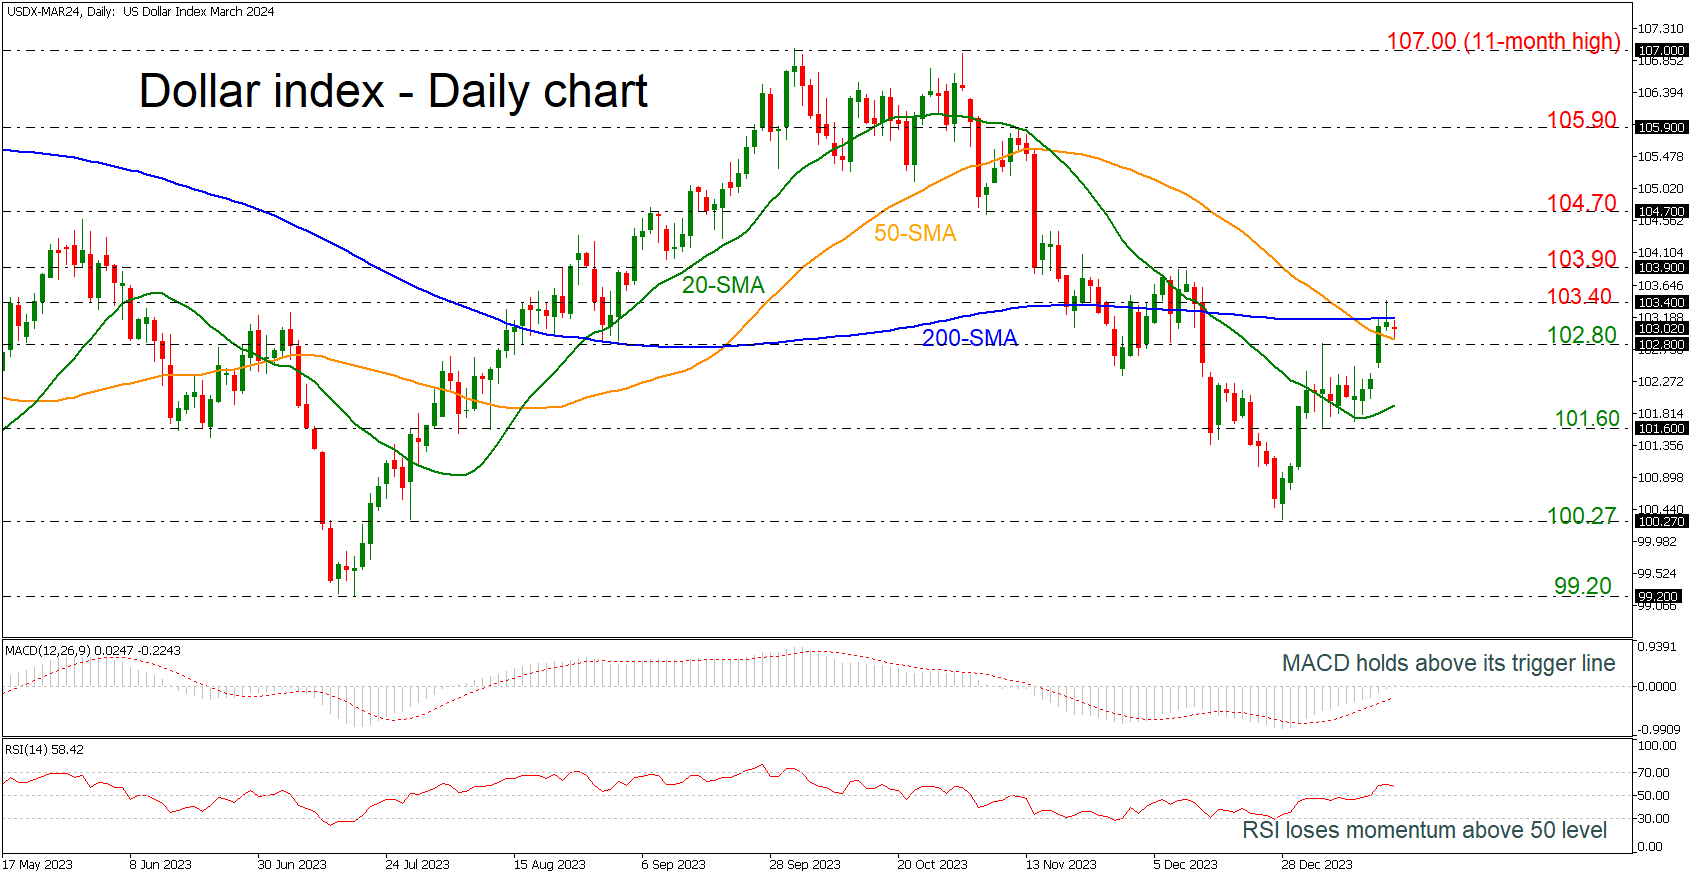
US Dollar Index Battles With SMAs Near 103.00
- US dollar index fails to extend upside move from 100.27
- 200-day SMA acts as important resistance
- RSI weakens above 50
The US dollar index is currently struggling to surpass the significant 200-day simple moving average (SMA), which stands near the 103.20 barrier. The market is moving back and forth of the 50- and the 200-day SMAs after the rebound off the 100.27 support level.
The RSI is above its 50 neutral mark, although weaker, and the MACD is keeping its footing above its trigger line and near the positive area, both reflecting that buyers are still active.
If buyers stay in play, the door will open for the 103.40 resistance and the 103.90 mark. Running higher, the index will have to face the inside swing low of 104.70, registered back in November.
Should the bears push the price below 102.80, the 20-day SMA at 101.90 may prevent a downfall towards the 101.60 support. If the latter gives way too, the decline could continue towards the 100.27 bottom, achieved on December 28.
In a nutshell, despite the latest exciting rebound in dollar index, there are some obstacles to consider before a real bullish trend reversal takes place.
US SPX 500: Bulls Getting Lethargic, and At Risk of a Minor Corrective Decline
- The US 10-year Treasury yield has pierced above 4.06% & its 200-day moving average; a sign that recent easing liquidity conditions have started to abate.
- A 3-year low seen in the implied correlation among S&P 500 constituents may trigger an imminent spike in the VIX.
- The S&P 500 is now at risk of forming a short-term top below 4,820 resistance.
After stellar Q4 quarterly and 2023 annual performances of 11.24% and 24.23% respectively, the US S&P 500 has started 2024 on a lacklustre footing, in the past two and half weeks, it has recorded an accumulated loss of -0.64% at this time of the writing after missing just a whisker to retest its all-time high of 4,818 set on 4 January 2022 with an intraday high of 4,802 printed on last Friday, 12 January 2024.
In the past week, the prior bullish tone seen in Q4 2023 for the other major US stock indices has also tapered off; with current 2024 year-to-date losses seen in the Nasdaq 100 (-0.53%), Dow Jones Industrial Average (-1.12%), and Russell 2000 (-5.62%).
The primary driver that caused the current state of lethargic behaviour seen in the US stock indices has been a snap-back of the major easing liquidity conditions that have taken form since late October 2023.
Several Federal Reserve officials have attempted to “talk down” the current state of optimism being priced by the interest rates futures market on the magnitude and pace of the expected Fed funds rate cut cycle in 2024. In the past two months, a chance of 70% to 80% was being priced by market participants for the first rate cut of 25 basis points to be enacted on the 20 March FOMC, these odds have been reduced to 59% as of yesterday, 17 January based on data from the CME FedWatch Tool.
Also, yesterday’s upbeat US retail sales data release for December that beat expectations (5% y/y vs. 4% y/y consensus) has trimmed off some of the prior frothy dovish expectations on the pace of the projected US interest rate cut cycle for 2024.
A potential short-term corrective rebound unfolding in US 10-year Treasury yield
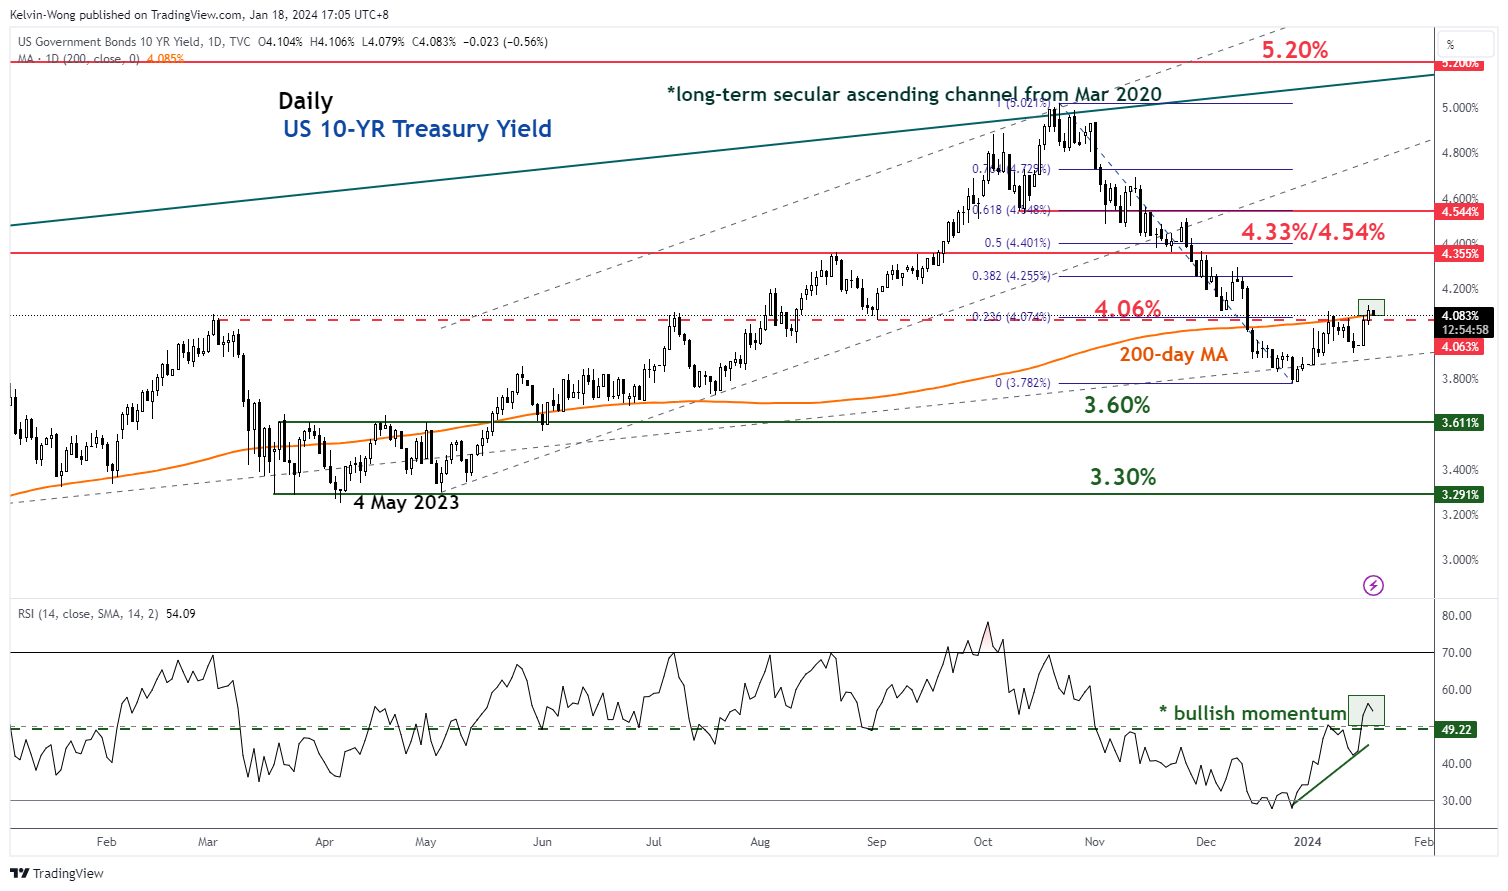
Fig 1: US Treasury 10-year yield medium-term trend as of 18 Jan 2024 (Source: TradingView, click to enlarge chart)
All in all, these factors have triggered a potential mean reversion corrective rebound phase in the US 10-year Treasury yield as it surpassed above the 4.06% key intermediate resistance and 200-day moving average.
In addition, its daily RSI momentum indicator has just cleared above the 50 level after a prior oversold condition on 20/27 December 2023 which advocates a further potential push-up in the price actions of the 10-year Treasury yield (see Fig 1).
The next intermediate resistance zone to watch will be at 4.33% to 4.54% (50%/61.8% Fibonacci retracement of the prior medium-term downtrend from 23 October 2023 high to 27 December 2023 low).
Hence, a further corrective rally in the US 10-year Treasury yield is likely to imply a tightening of liquidity conditions in the short term that can translate into a potential short-term correct decline sequence on the major US stock indices.
Current low correlation among S&P 500 constituents may lead to a spike in implied volatility
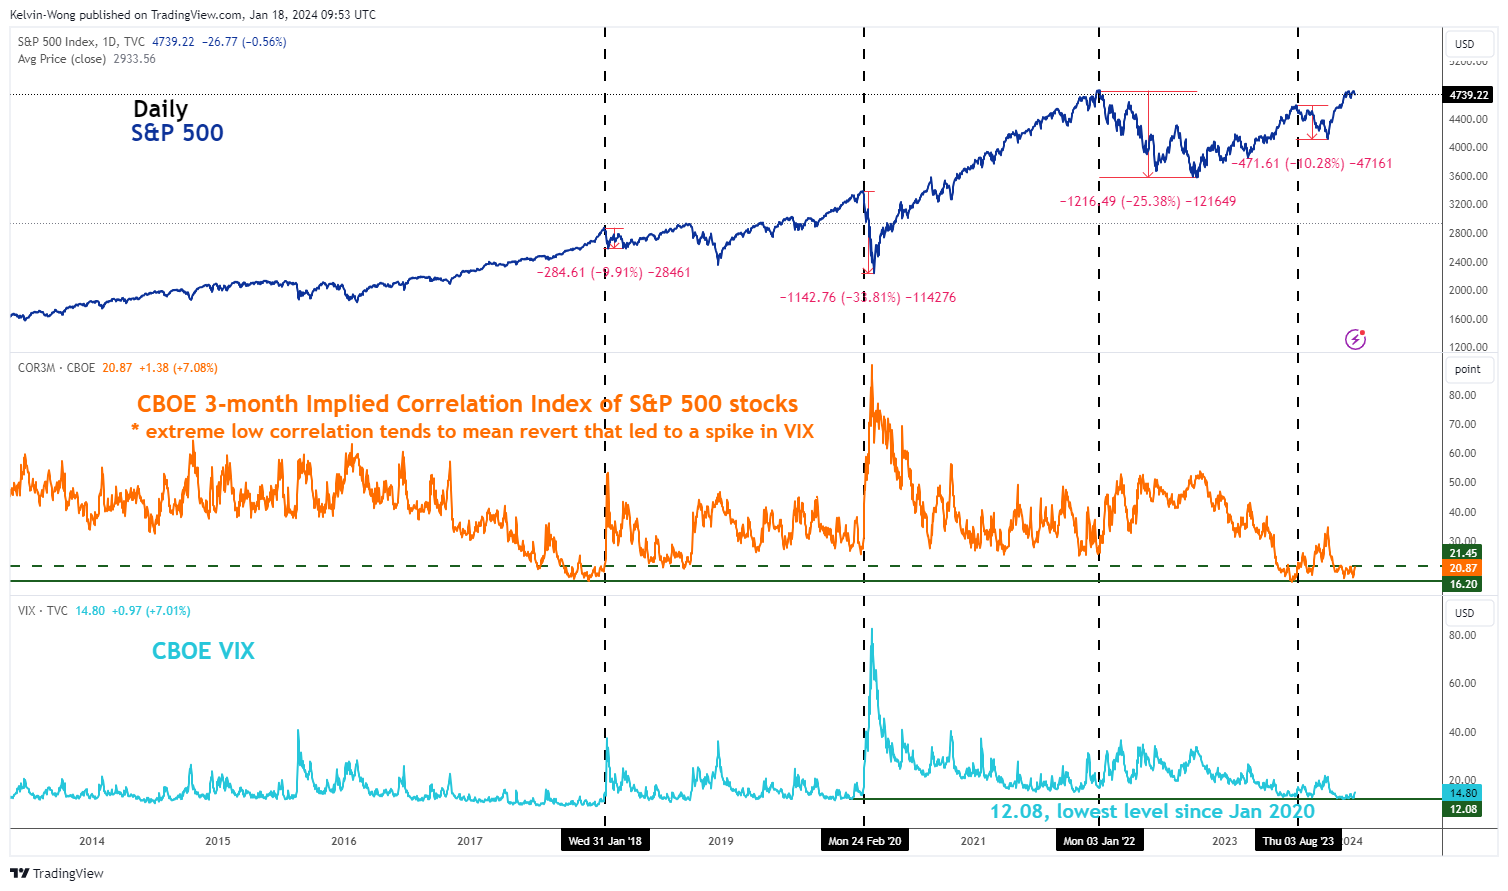
Fig 2: CBOE VIX & 3-month implied correlation index of S&P 500 constituents as of 17 Jan 2024 (Source: TradingView, click to enlarge chart)
Another interesting point to note is the recent plunge in the VIX (implied volatility of the S&P) to a 3-year low of 12.08 on 12 December 2023 which in turn has coincided with market participants’ perceptions of future low correlation readings (higher dispersion of returns on the average) of the US S&P 500 index constituents.
The CBOE 3-month Implied Correlation Index measures the 3-month expected correlation across the top 50 value-weighted S&P 500 constituents which has slipped to a low reading of 17.10 on 13 December 2023 which is close to a 6-year low of 16.20 that was met recently on 18 July 2023 (see Fig 2).
A relative “low calm” level of the CBOE 3-month Implied Correlation Index is likely not going to last forever. Based on past occurrences, a break above 21.45 on the CBOE 3-month Implied Correlation Index after a prior low depressed level has led to a spike in the VIX which in turn saw a decline of -10% in the S&P 500 from January 2018 to March 2018 and most recently a loss of -10.3% from August 2023 to October 2023.
S&P 500 may have formed a short-term top below 4,820
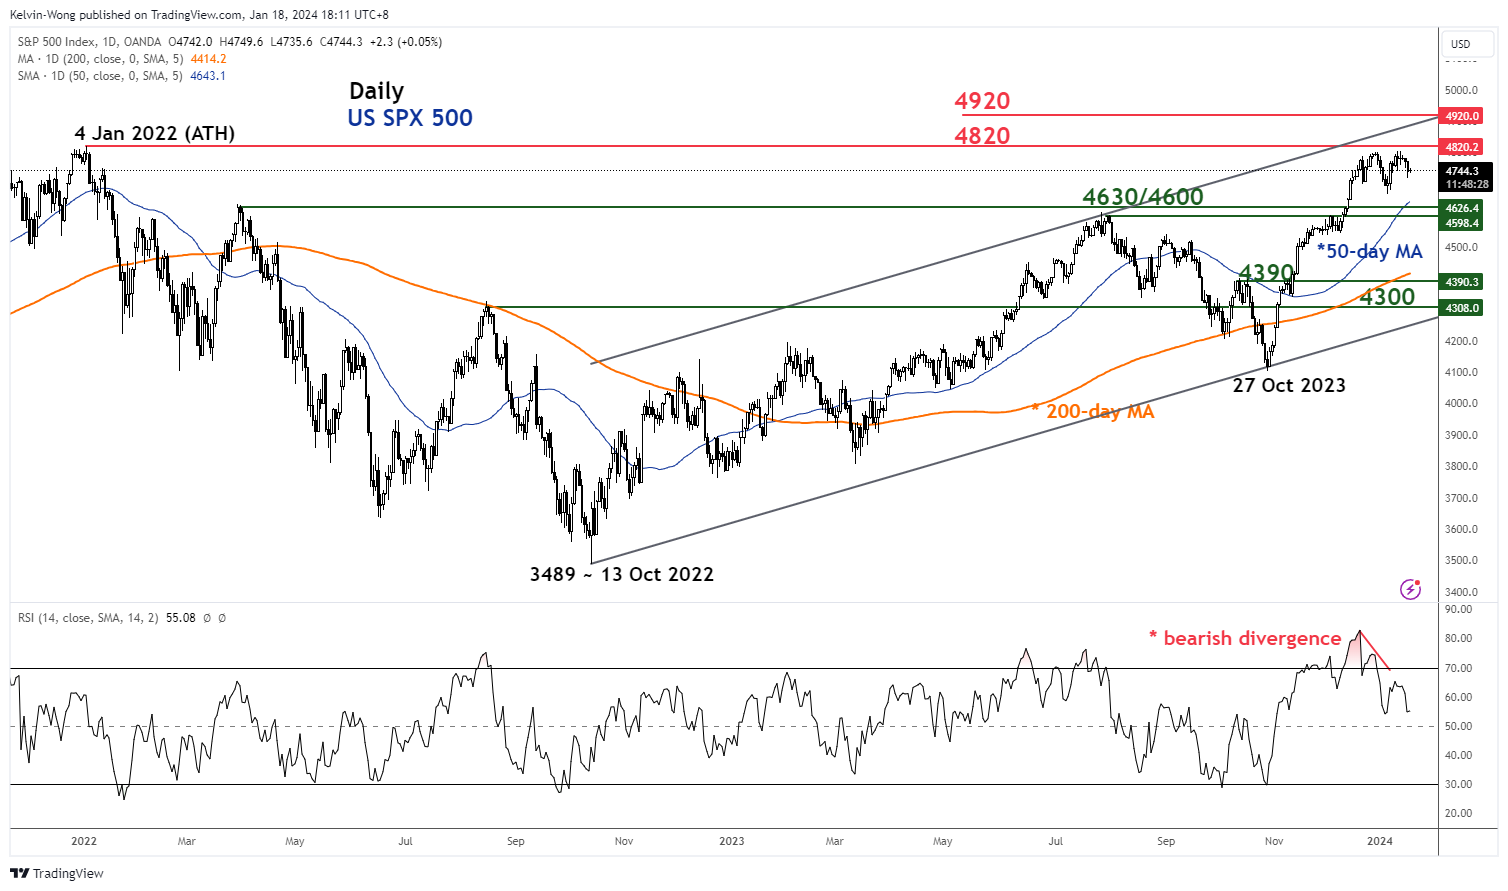
Fig 3: US SPX 500 medium-term & major trends as of 18 Jan 2024 (Source: TradingView, click to enlarge chart)
The bullish momentum of the S&P 500 from the end of October 2023 may have lost its inertia to support higher price actions of the S&P 500 going forward at this juncture.
The daily RSI momentum indicator has traced out a bearish divergence condition on 28 December 2023 and exited its overbought region which suggests that the S&P 500 is vulnerable to at least a short-term corrective decline to retrace a portion of the recent medium-term uptrend phase from 27 October 2023 low to 12 January 2024 high (see Fig 3).
The medium-term support zone to watch for the potential corrective decline will be at 4,630/4,600 which also confluences with the upward sloping 50-day moving average.
On the other flip side, a clearance above 4,820 is likely to revive the bullish tone to see the first major resistance coming in at 4,920 (a cluster of Fibonacci extension levels and the upper boundary of the major ascending channel from 13 October 2022 low).
Aussie Stems the Bleeding
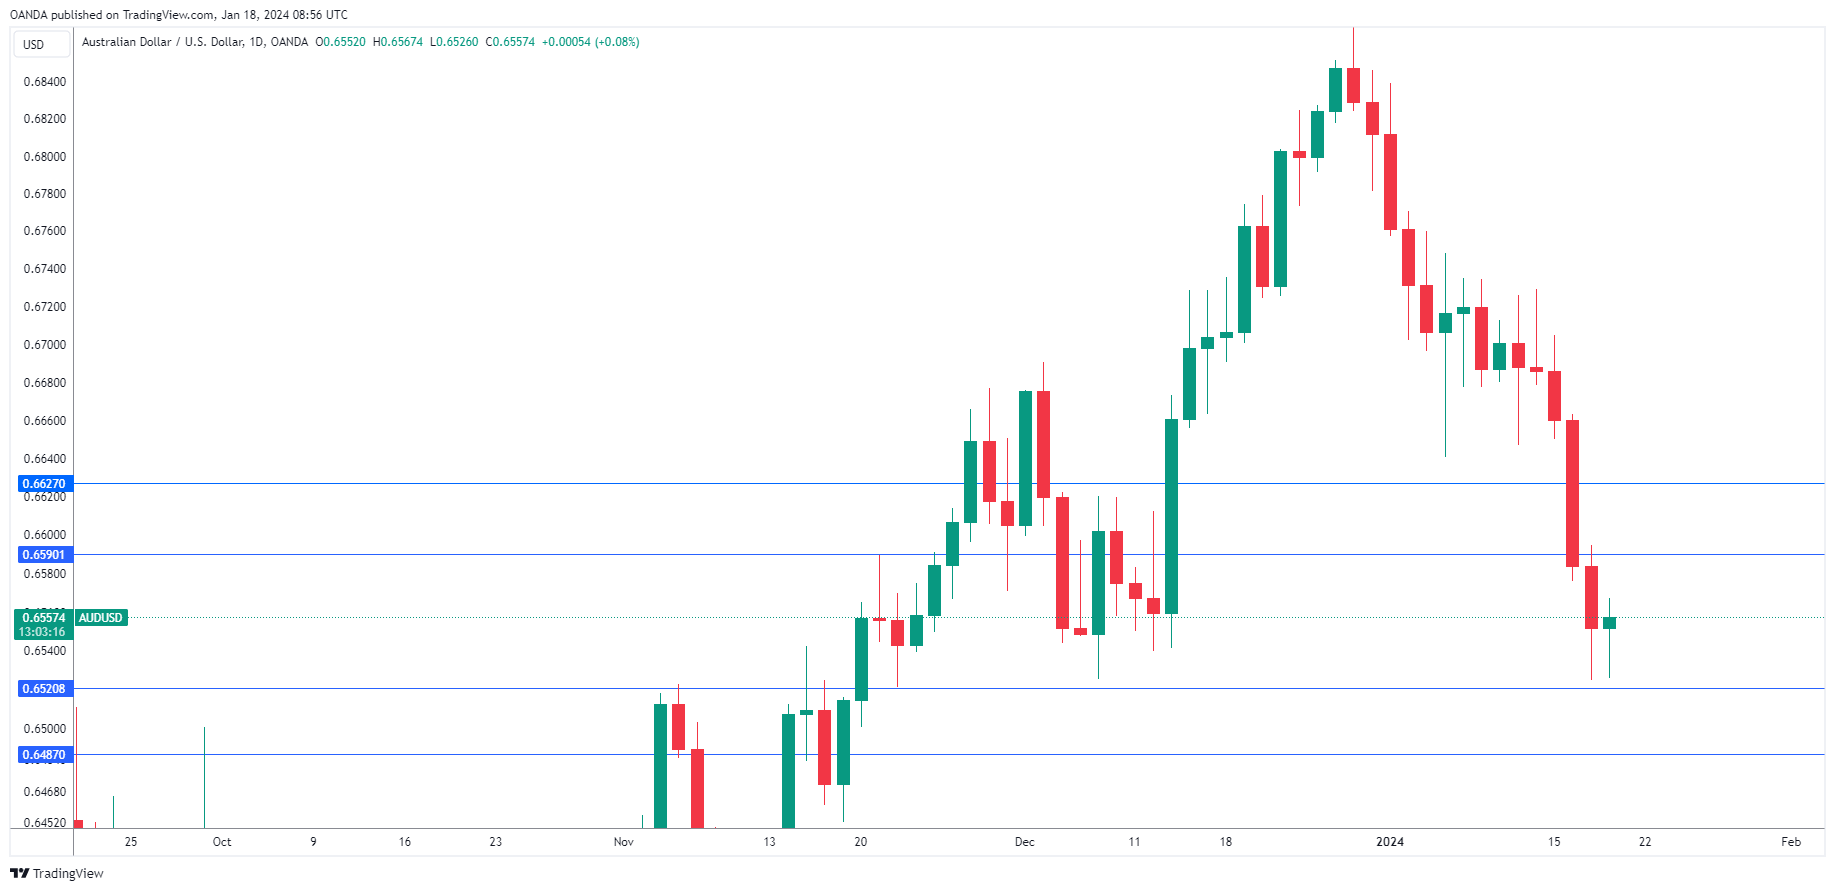
The Australian dollar has stablilized after a nasty tumble this week. In the European session, AUD/USD is trading at 0.6555, up 0.06%. The Aussie ignored a weak employment report which showed job growth plunged by 65,100 in December. The unemployment rate remained steady at 3.9%.
Risk appetite, China weighing on Aussie
The US dollar looked dead in the water in the final two months of 2023 but has jumped out of the gates early in 2024. The Australian dollar has plunged 3.8% in January. Risk currencies like the Australian dollar have been hit hard, as nervous investors are showing less appetite for risk, for two main reasons.
First, the Federal Reserve remains cautious and continues to push back against market expectations for a rate cut in March. Fed members have dampened these expectations and signalled that the Fed is unlikely to cut in March.
Second, a batch of strong US data indicates that the US economy remains resilient, which means that the Fed is in no rush to start chopping rates. Fed Atlanta President Bostic said this week that there was the danger of inflation could “see-saw” if the Fed began lower rates too soon. The markets have responded by lowering their odds for a March rate cut. Just a few weeks ago, the probability of a March cut was above 80% but has dropped to 63%, according to CME’s FedWatch tool.
China’s economy continues to struggle and that is not good news for Australia. China is Australia’s largest trading partner and the Australian dollar is sensitive to Chinese releases. This was evident on Wednesday as soft Chinese data sent the Australian dollar lower to a five-week low.
China’s economy grew by 5.2% in the fourth quarter, a low rate of growth considering that the economy was expanding above 8% prior to the Covid pandemic in 2021. The real estate crisis continues to fester, weak domestic demand has resulted in deflation and the country’s population is decreasing. China is practically defined by its export sector, yet exports declined by 4.6% y/y in 2023, the first decline since 2016. The World Bank has projected that the economy will slow to 4.5% in 2024, pointing to further difficulties for the world’s second-largest economy.
AUD/USD Technical
- AUD/USD is putting pressure on support at 0.6520, which has held since mid-November. The next support level is at 0.6487
- There is resistance at 0.6590 and 0.6627
OPEC Forecasts an Increase in Oil Demand in 2024
Yesterday, the monthly oil market review was published:
→ OPEC expects global oil demand to increase by 2.25 million barrels per day (b/d) in 2024, representing a 2.2% increase compared to 2023.
→ In 2025, OPEC predicts a demand increase of 1.85 million barrels per day, reaching 106.21 million barrels per day. It is anticipated that the growth in oil consumption in 2025 will be driven by China, the Middle East, and India.
This aligns with Occidental Petroleum's perspective, where they anticipate a global oil shortage starting in 2025, as the pace of global oil demand growth is roughly four times higher than the volumes of new reserves.
However, according to Citi analysts, the price of Brent crude oil in 2025 is expected to be $60 per barrel due to oversupply.
As of today, the price of Brent crude oil is fluctuating in the consolidation zone around $77 per barrel. Market participants are closely monitoring the potential for an increase in the Brent oil price due to geopolitical tensions. For instance, Maersk has reported that escalation in the Red Sea and the Gulf of Aden will lead to disruptions in global logistics.
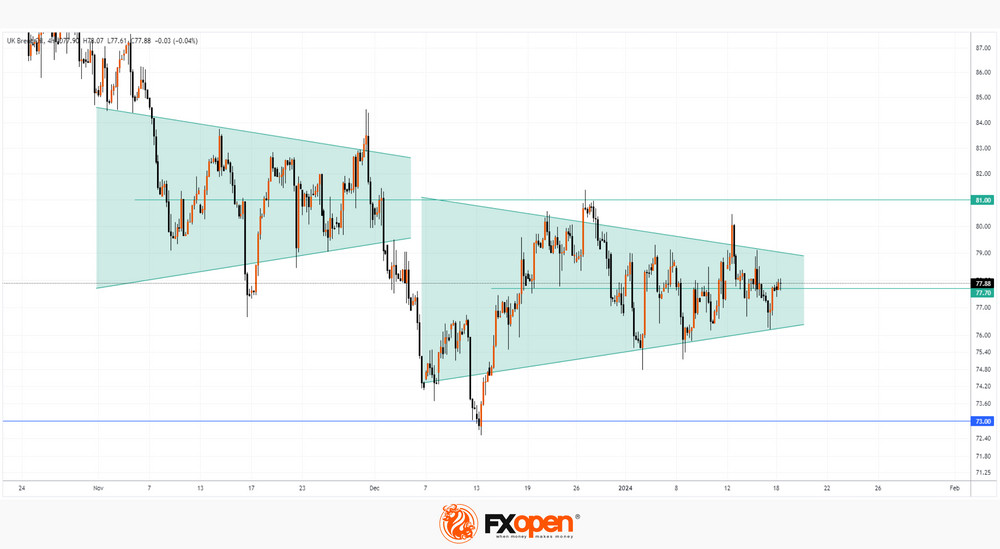
The Brent crude oil price chart indicates that
→ the new consolidation zone is lower than the previous one when the Brent price hovered around $81.
→ the price is near the crucial level of $73, which provided market support in 2023. At that time, OPEC+ countries announced a production cut to prevent further price decline. It is possible that they will take similar measures in 2024.
→ the rapid recovery of the price from December lows indicates the strength of demand for Brent oil below $74.
Given the provided information, if the Brent price falls below $74, it may lead to its subsequent increase.
This article represents the opinion of the Companies operating under the FXOpen brand only. It is not to be construed as an offer, solicitation, or recommendation with respect to products and services provided by the Companies operating under the FXOpen brand, nor is it to be considered financial advice.
EURUSD Finds Support at the 200-day SMA
- EURUSD had been rangebound before sliding lower
- But the retreat ceases at the 200-day SMA
- Momentum indicators remain tilted to the downside
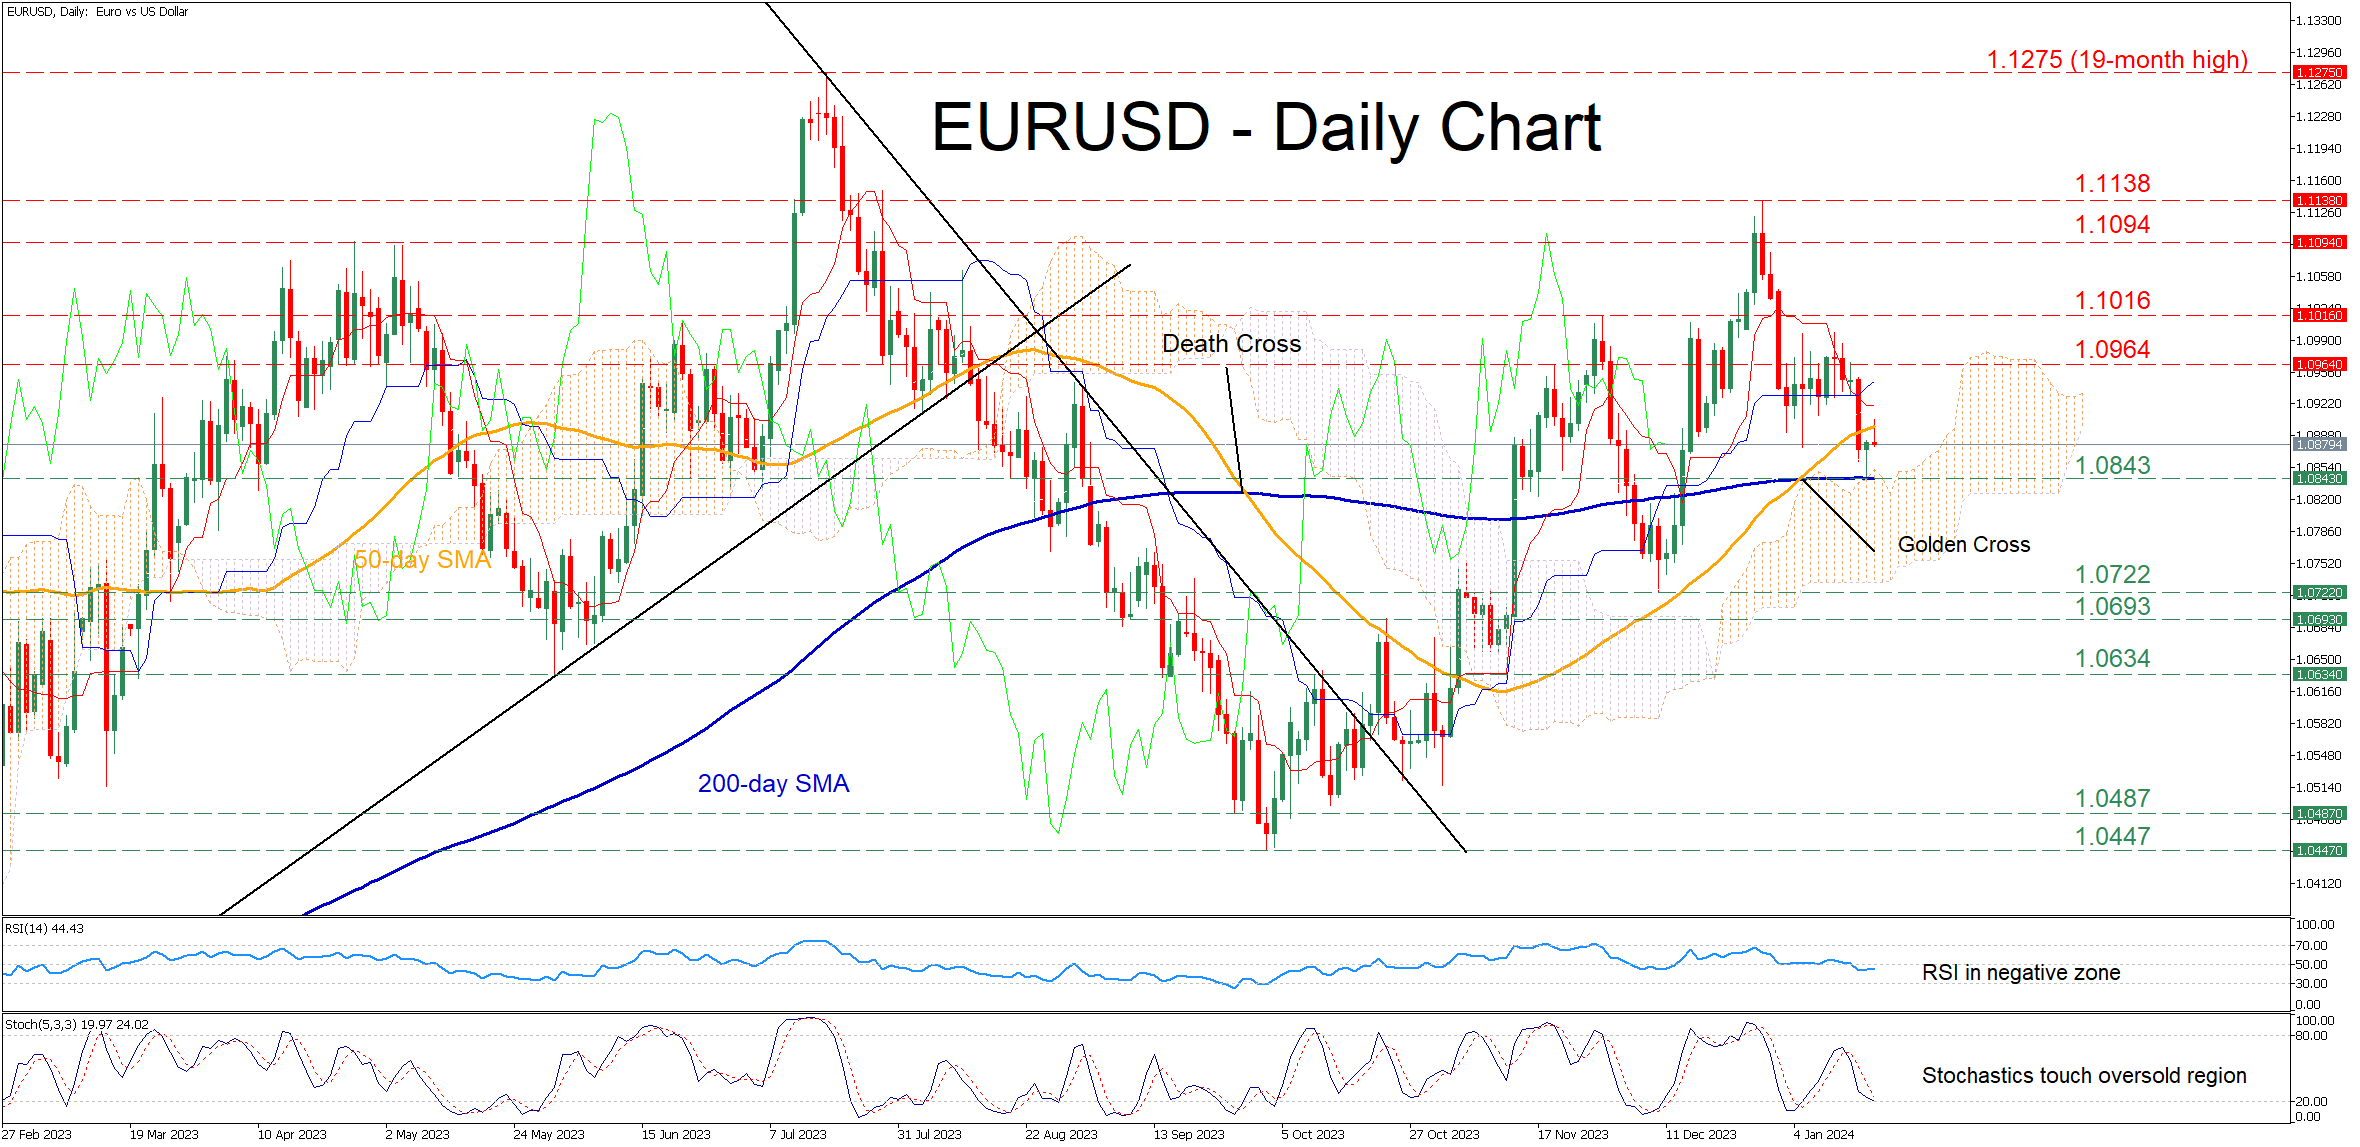
EURUSD had been trading sideways since the beginning of the year following its pullback from the December high of 1.1138. The pair spiked lower on Tuesday, but the congested region that includes the 200-day simple moving average (SMA) and the top of the Ichimoku cloud rejected further retreats.
Considering that both the RSI and stochastics are deep in their negative zones, the price could revisit its recent support of 1.0843, which overlaps with the 200-day SMA. Piercing through that wall, the pair may challenge the December bottom of 1.0722. Even lower, the 1.0634 barricade could provide downside protection.
On the flipside, should the pair rotate higher, the November resistance of 1.0964 could prove to be the first barrier for the bulls to overcome. A violation of that territory could pave the way for the November high of 1.1016. Further advances may then encounter resistance at the April peak of 1.1094.
In brief, EURUSD has lost some ground in the short term, but the 200-day SMA prevented a steep decline for now. Therefore, the bulls could continue to hope for a recovery as long as the latter holds its ground.
AUDUSD Edges Higher After 2-Month Low
- AUDUSD remains beneath uptrend line and 200-day SMA
- Bearish wave on the cards
- RSI and stochastic suggest upside recovery
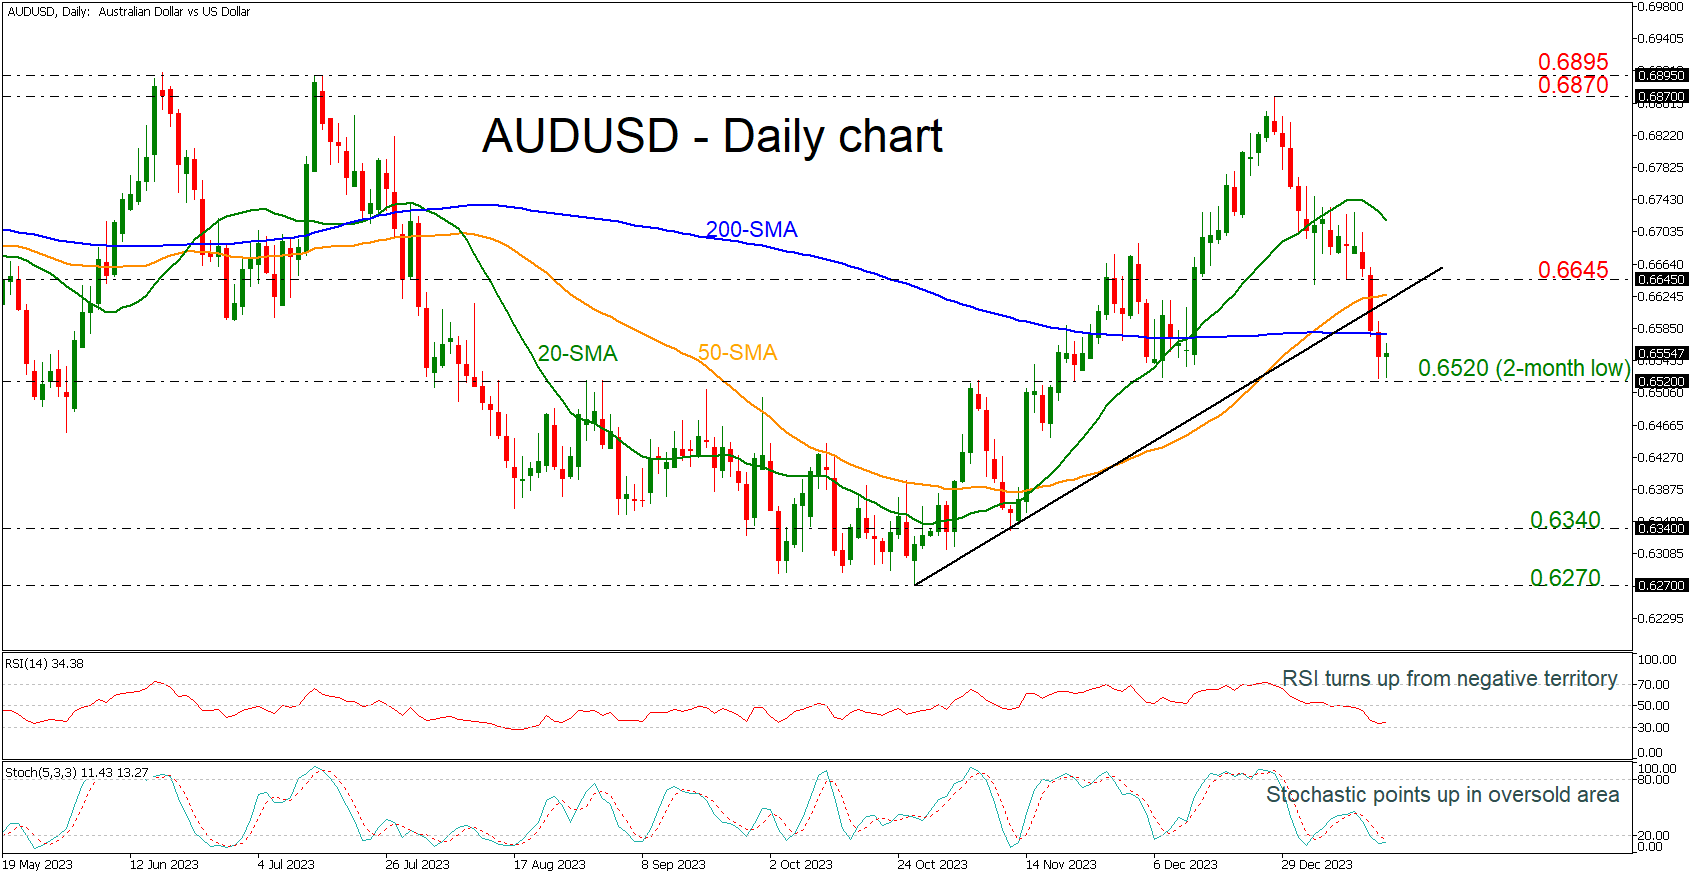
AUDUSD is recouping some losses today after the aggressive sell-off of the preceding three days, posting a new two-month low near 0.6520. The pair slipped beneath the medium-term ascending trend line and the 200-day simple moving average (SMA), shifting the outlook to bearish.
However, the technical oscillators are showing some signs of recovery. The RSI is ticking upwards in the bearish territory, while the stochastic is pointing up in the oversold zone, indicating a possible end to the end of the selling interest in the market.
In the event of an uptrend resumption above the 200-day SMA, the bulls might take a breather near the 50-day SMA and the 0.6645 resistance level. The broken ascending line from the March low might attract attention in the same region. Should it give way, the door will open for the 20-day SMA at 0.6720 ahead of the 0.6870 resistance.
Nevertheless, the pair has key levels underneath for protection against selling forces. The 0.6520 has been limiting downside movements, while a drop below it could take the market until the next support of 0.6340.
In brief, AUDUSD buyers are holding back after the latest bullish trendline breakout. On the other hand, sellers cannot head up either, as important support levels remain intact.
WTI Oil Futures Swing Within Neutral Triangle
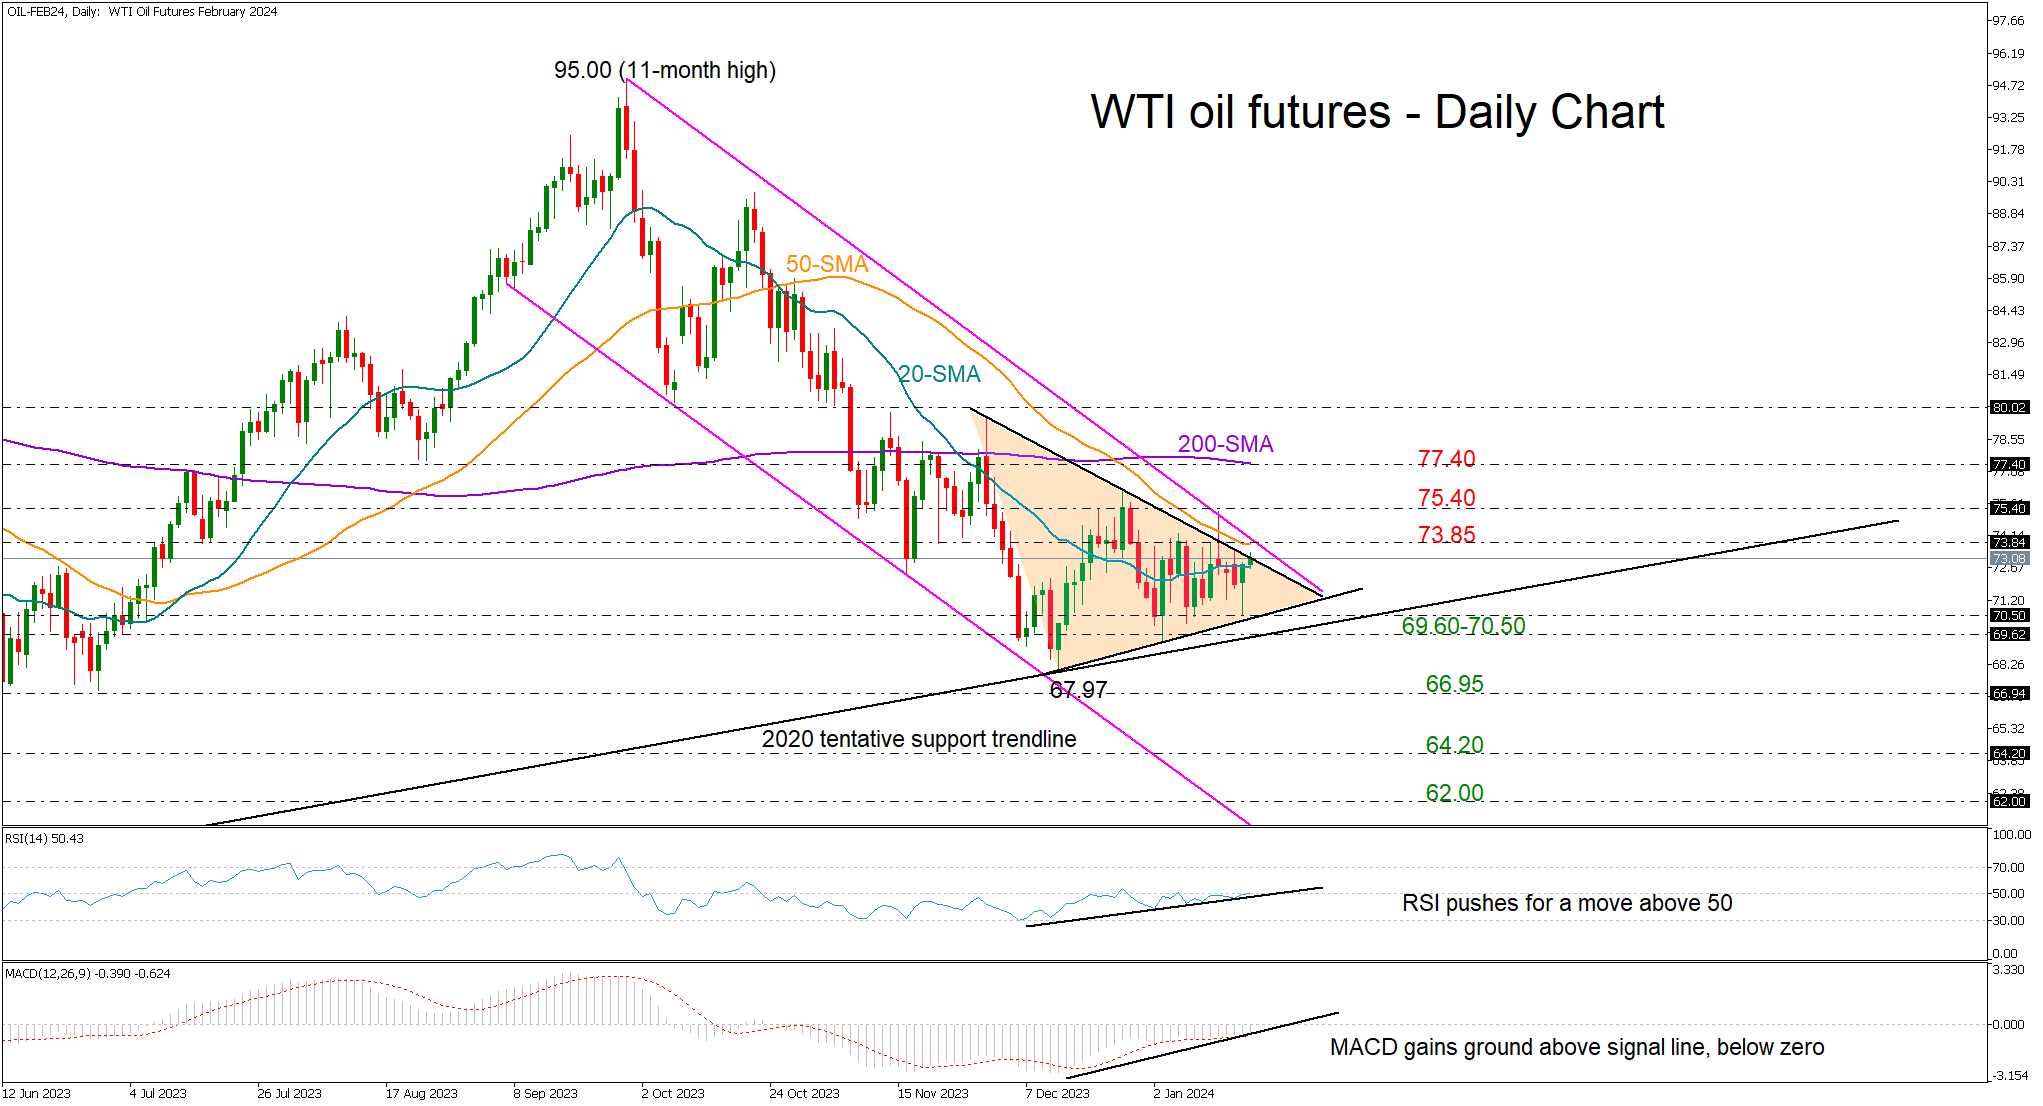
- WTI oil futures extend horizontal move
- Resistance at 73.85; support at 69.60
WTI oil futures (February delivery) have been in a range so far in January, printing a neutral triangle pattern at the bottom of the broad bearish channel.
Given the RSI’s continuous efforts to climb above its 50 neutral mark and the improvement in the MACD, there is a ray of hope for a bullish breakout.
Practically though, the price will have to overcome a few obstacles before the outlook shifts to the bullish side. Specifically, it will first need to climb above the upper band of the downward-sloping channel at 73.85, where the 50-day simple moving average (SMA) is positioned. Then, a close above the 75.40 constraining zone would violate the short-term neutral trajectory, opening the door for the flattening 200-day SMA at 77.40. A decisive extension above the latter would brighten the outlook, clearing the way towards the 80.00 round level.
In the event the price pulls lower, it may retest the triangle’s lower band at 70.50 and perhaps touch the tentative ascending line from the 2020 low seen at 69.60. Failure to bounce there could prompt a fast decline towards the May-June floor of 66.95. If selling forces persist, the downtrend could reach the 2023 bottom of 64.20 and then the 62.00 mark.
In brief, WTI oil futures provide no clear signals about the next move in the price as long as they fluctuate within the 69.60-73.85 region.
Markets Scaled Back Expectations for March Fed Rate Cut to About 50%
Markets
Yesterday’s, the news flow unidirectionally supported recent central bankers’ mantra that there is no case to rush for early and/or outsized rate cuts any time soon. UK inflation unexpectedly rebounded with both core inflation (5.1%) and services inflation (6.4%) making no progress towards the 2.0% target. US retail sales came out much stronger than expected. This perfectly illustrated Fed Waller’s assessment earlier this week that US economic activity remains in good enough shape for the Fed to take a cautious approach both on the start and the pace of the easing cycle. ECB’s Lagarde in Davos indicated that it will take till the summer before the ECB will be in a position to be sure that inflation is back on a path to sustainably move the bank’s inflation target. Yields curves in the US, EMU and the UK staged an impressive bear flattening/inversion move. US yields changed between 14.1 bps (2-y), and 1.7 bps (30-y). Markets scaled back expectations for a March Fed rate cut to about 50%. Later in the session, the Fed Beige book indicated that there was little change in economic activity. At the same time, holiday sales held up well and contact indicated that the prospect of Fed rate cuts is a source of optimism going forward. German yields added between 9.8 bps (2-y) and 0.4%(30-y). Moves in the UK were even more impressive with the 2-y jumping 21.5 bps higher while the 30-y still added 15.5 bps. The prospect of a less aggressive scaling back of policy tightening weighted on equities (Eurostroxx 50 -0.98%, S&P 500 -0.56%). The congruent rise in yields across major markets prevented the dollar to fully profit from its safe haven status. DXY gained modestly (103.45). EUR/USD briefly dropped below the 1.0875/65 support area, but reversed the intraday decline closing even marginally higher at 1.0883). The yen understandably underperformed with USD/JPY closing north of 148.
This morning, Asian equity markets are trading mixed, despite yesterday’s WS setback. US yields decline 1-3 bps. After yesterday’s ‘unconvincing’ gains, the dollar this morning ceding some ground (DXY 103.18, EUR/USD 1.09). Today, the calendar is less inspirational than was the case yesterday. In the US, building permits, housing starts and jobless claims will be published. No key eco data in EMU. ECB governors also enter the black-out period ahead of next week’s policy meeting. Fed’s Bostic speak on the economy. Even so, today’s calm calendar still might give some indication whether the bottoming out process especially in ST yields (US and EMU) is getting stronger footing. The US 2-y rebounding above 4.39% (23% retracement since top October) would give some more comfort. In FX, the dollar couldn’t maintain recent upside momentum. EUR/USD failed to sustainably break below the 1.0775/65 support area, indicating no clear directional moment for now.
News & Views
Australian employment last December fell by the most since the pandemic months. The economy shed some 65.1k jobs. An even bigger setback in full-time employment (-106.6k) was partially offset by a rise in part-time jobs (+41.4k). Australia’s Bureau of Statistics signals, however, that the fall comes after a strong October and November growth. The unemployment rate stayed at 3.9% and the participation rate holds near historic highs even as it dropped a little (to 66.8%), suggesting ongoing tightness on the labour market. In a sign of some relieve, hours worked continued its gentle (but choppy) downward trend since April 2023. Australian swap yields dipped on the release before recouping several bps shortly thereafter. Current changes amount to less than 1.5 bp across the curve. Money markets still bank on a first rate cut no sooner than September. The Aussie dollar followed yields, dropping at first before trading higher on the day. AUD/USD is currently changing hands around 0.656.
UK Prime Minister survived a key vote on his immigration plan in Parliament late yesterday. Earlier this week, almost 60 Tory rebels revolted against what they considered a not tough enough bill to tackle illegal immigration. The open backlash weakened the PM’s position in an election year and at a time the Tory party is trailing Labour Party in opinion polls. In the end, only 11 voted against the legislation in the Lower House with many of the others fearing that doing so would topple the government, triggering early elections. Sunak didn’t want to give in to the hardliners, fearing that the UK would break international law otherwise. In its current form, migrants who arrive illegally in Britain, face being sent to Rwanda to have their asylum claims processed. The saga isn’t over yet as the House of Lords has yet to vote on the matter..
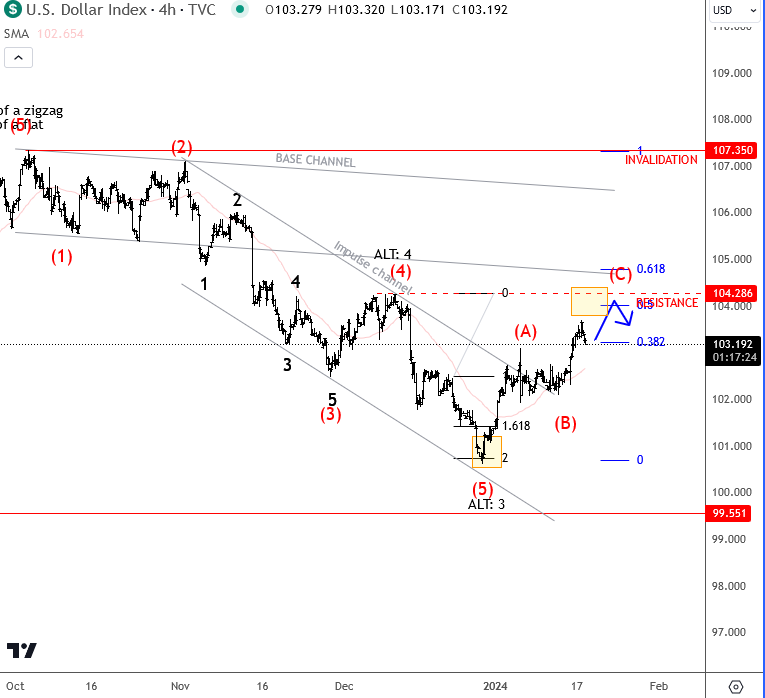
Elliott Wave Analysis: Dollar Index Approaching Resistance at 104
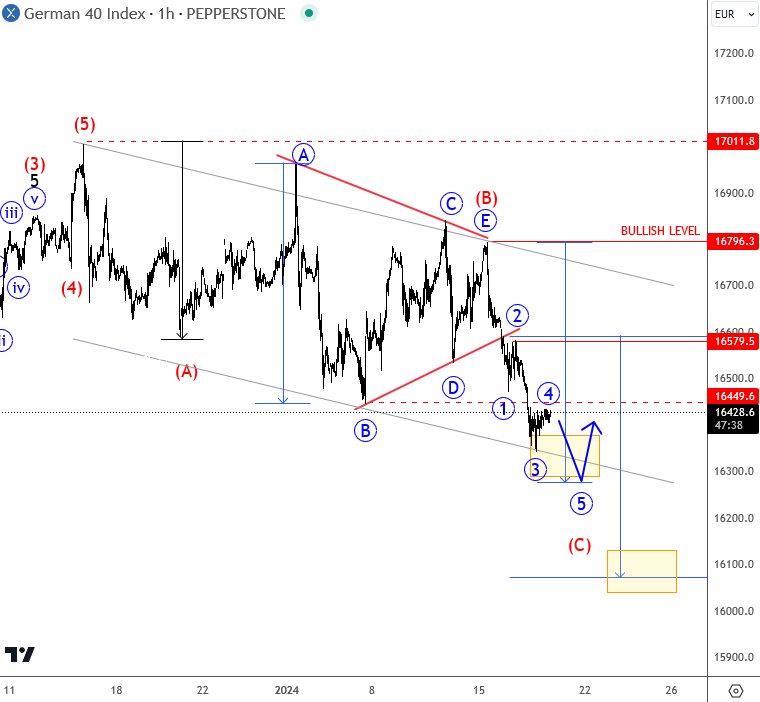
Markets are sideways but volatility can step in if there will be any major news out from the World Economic Forum in Davos, Switzerland. There are a number European central bank officials who noted that markets went to far regarding cut expectations, so it will be interesting to listed ECB President Lagarde later at 16:15CET. Regarding the markets, we are seeing USD strong this week., but can be now already in late stages of a corrective ally when looking at DXY. I see some nice resistance for A-B-C move around 104, from where we may see a new sell-off still this month.
At the same time we have seen some pullback on stocks, but nothing significant, its a normal correction I think. DAX is also at the potential support.
Lagarde Pushes Back Against a Springtime Cut
In focus today
Today focus in the euro area will be on minutes from the December ECB meeting.
As for data releases Thursday looks rather light, however in the US the Philly Fed Manufacturing Index comes out. Consensus expects an improvement.
A few central bankers are scheduled to speak today with SNB chairman Jordan speaking at 11:30 CET, Fed's Bostic speaking both at 13:30 CET and 17:30 CET. Riksbank Governor Thedeén is also speaking, as he gives his view on the new Riksbank law in a speech at 16:30 CET. The speech is published on the Riksbank web page. Finally, ECB President Lagarde speaks again today at 16:30 CET, but as the ECB has entered the 'quiet period' today, markets should not hold out for any clues for the Monetary Policy Meeting next week (25 January).
Overnight we get nationwide December inflation data out of Japan. Tokyo December inflation declined and indicated price pressures were quite muted for the second month in a row. Spring wage negotiations remain key to the Japanese inflation outlook.
Economic and market news
What happened overnight
Market narrative of early springtime rate cuts got challenged yesterday by both strong data points and comments from central bankers (more on both below). As of this morning Asian markets are a mixed bag.
In the commodity space oil prices are up reversing some of the slide from yesterday with Brent spot trading at USD78.10/barrel at 06:00 CET this morning.
What happened yesterday
ECB President Lagarde said it is likely the ECB could begin to cut interest rates in the summer. She emphasised however the importance of data coming in late spring, thus reiterating the views of Chief Economist Philip Lane who spoke of the need for Q1 wage data that would not be available until end of April, thus only come in time for the Governing Council meeting in June. GC member Knot also pushed back against springtime rate cuts and market pricing stating, "markets are getting ahead of themselves on cuts".
Fed's Waller commented that the Fed should not cut rates too fast, saying he and fellow central bankers should "take our time to make sure we do this right".
In the UK inflation data for December surprised to the topside. Headline CPI stood at 4.0% y/y, above expectations and up from November's 3.9% y/y. Core CPI was unchanged at 5.1% y/y, also above expectations.
In the US retail sales for December came out at 0.6% m/m up from 0.3% m/m in November. According to a Reuters poll analysts had expected 0.4% m/m. The 'control group' measure that strips out the most volatile parts also exceeded expectations coming in at 0.8% SA m/m, vs. 0.2% expected.
In the Red Sea the US military conducted yet another strike against Houthi missile capabilities. This came after another dry bulk carrier ship was attacked by the Houthis, just hours after the US had redesignated the Houthi movement an international terrorist organisation.
Equities: Global equities were lower yesterday as the central bank repricing continued, partly for the right reasons partly for the wrong reasons. The combination of both macro and inflation coming out on the high/strong side pushed yields higher and equities lower. Some of the late summer dynamics came back with utilities and REITs underperforming together on days when markets are lower and we not seeing a defensive rotation. Hence, this is not fuelling the recession risk but rather the higher-for-longer, which in our opinion is not so bad for equities looking 3-6 months down the road. In US yesterday Dow -0.3%, S&P 500 -0.6%, Nasdaq -0.6% and Russell 2000 -0.7%. Asian markets are a bit more positive today after the heavy sell-off yesterday. US and European futures are marginally lower.
FI: Yesterday, markets started on a weak footing from the front end, on the back of ECB's Lagarde and Knot's push-back on the rate expectations relative to markets. While Lagarde noted that a summer rate cut was likely, Knot said that the market pricing can be self-defeating and that he expects markets to correct to the ECB's inflation outlook. Markets took 15bp out of the rate cut pricing for 2024, albeit with some volatility along the way, to now stand at 135bp priced for this year. The ECB governing council members have now entered the silent period. Later today, we also get the ECB minutes for the December meeting. Yesterday's 13bn USD supply of 20y UST was well received, albeit with marginally lower bid-to-cover and no market reaction to the announcement.
FX: The USD continues to trade on a strong footing due to rising yields, spurring general risk-off sentiment in markets. However, since the EUR is also performing decently in the G10 space, EUR/USD remains just below 1.09. Besides the USD, the GBP also had a strong session on the back of the upward surprise in UK December CPI. On the other side of the spectrum, the Scandies and the JPY have been weak this week due to rising yields and risk-off sentiment. USD/JPY rose above the 148 mark, while both EUR/NOK and EUR/SEK drifted higher. Additionally, CHF proved to be one of yesterday's biggest losers following remarks from SNB President Jordan.