

Sample Category Title
Bitcoin Tests the Strength of an Uptrend
Market picture
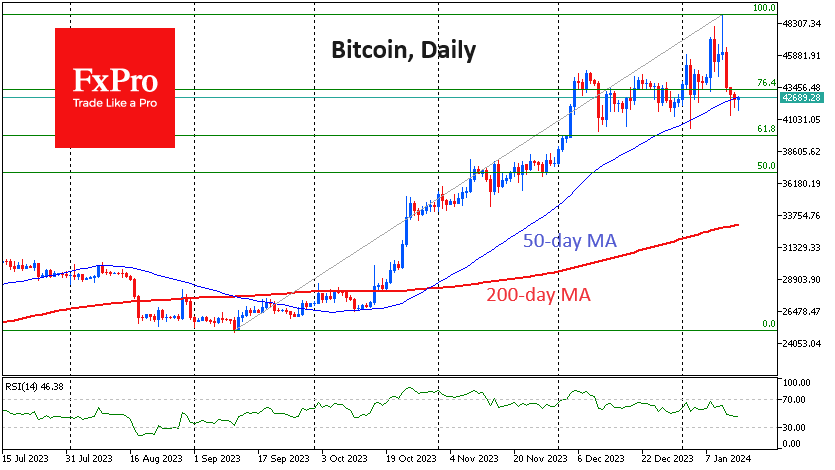
Last week saw the launch of 11 spot bitcoin ETFs in the US. On Thursday, the first day of trading, the total volume traded in these ETFs was $4.6 billion, and the price of bitcoin reached a multi-month high near $49000.
The “sell the facts” pattern was already evident on Friday and continued throughout the weekend. On Saturday, the price fell to $41350, but apart from impulsive drawdowns, the price has spent most of its time around $42600. The 50-day moving average is close to this level, and the bulls are clearly trying to keep the price above this important trend indicator, which has been in place since October.
A corrective pullback in bitcoin to $39-40K would be within the bounds of typical corrections. A drop to an important round level may increase the medium-term attractiveness of the first cryptocurrency.
News background
Several applications for Ethereum spot ETFs are pending with the SEC. However, JPMorgan doesn’t expect such funds to appear in the near future. For that to happen, the SEC would have to recognise ETH as a commodity (like bitcoin) – but the regulator has repeatedly said it considers all cryptocurrencies except BTC to be securities.
Ethereum developers have proposed changes to the ERC-4337 specification to reduce the price of gas for smart account transactions. The main changes in the document concern the structure of smart account transactions.
Cryptocurrency company Ripple Labs has completely abandoned plans for an IPO and is buying back 6% of its shares from employees and early investors for a total of around $285 million.
In a bullish scenario, bitcoin could rise to $1.5 million by 2030, said Katie Wood, CEO of ARK Invest. Even in a bearish scenario, the digital gold exchange rate would rise to $258,500. A conservative estimate suggests a rise to $682,800. Fundstrat previously predicted that BTC would reach $500,000 within the next five years.
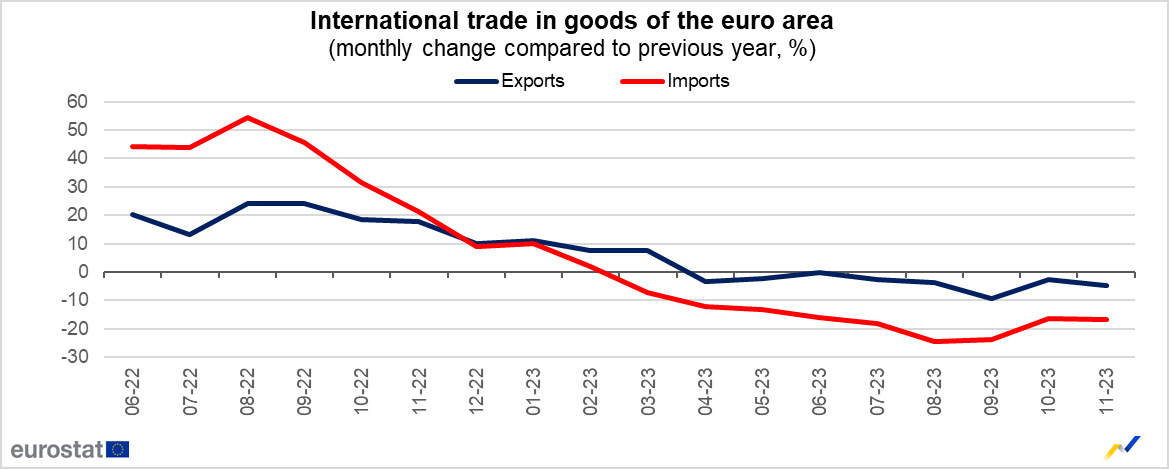
Eurozone goods exports fell -4.7% yoy in Nov, imports down -16.7% yoy
Eurozone goods exports to the rest of the world fell -4.7% yoy to EUR 252.5B in November. Goods imports fell -16.7% yoy. A EUR 20.3B goods trade surplus was recorded. Intra-Eurozone trade fell -9.4% yoy to EUR 227.2B.
In seasonally adjusted term, goods exports rose 1.0% mom to EUR 236.8B. Imports fell -0.6% mom to EUR 222.1B. Trade surplus widened from prior month's EUR 11.1B to EUR 14.8B, above expectation of EUR 11.2B.
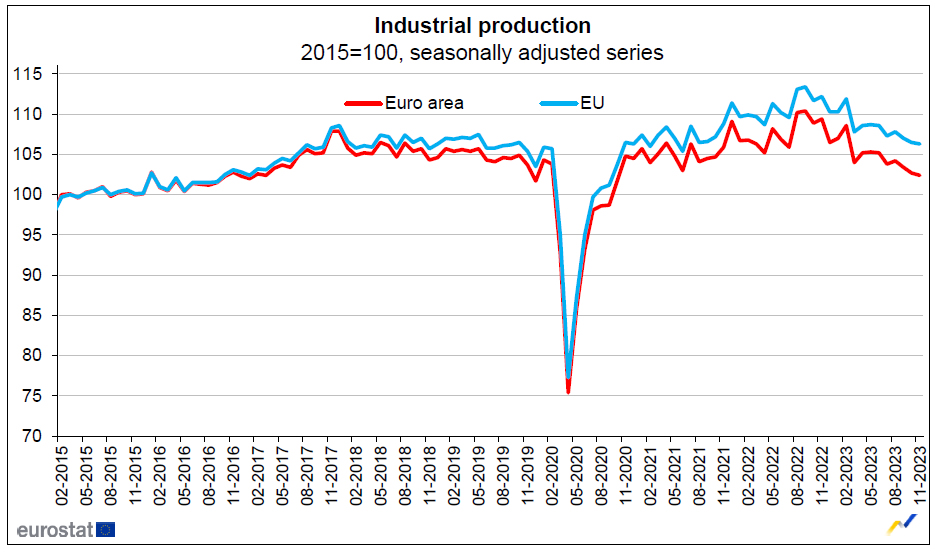
Eurozone industrial production down -0.3% mom in Nov, EU down -0.2% mom
Eurozone industrial production fell -0.3% mom in November, match expectations. Industrial production fell by -2.0% mom for durable consumer goods, by -0.8% mom for capital goods and by -0.6% mom for intermediate goods, while production grew by 0.9% mom for energy and by 1.2% mom for non-durable consumer goods.
EU industrial production fell -0.2% mom. Among Member States for which data are available, the largest monthly decreases were registered in Greece (-4.1%), Slovakia (-4.0%) and Belgium (-3.8%). The highest increases were observed in Denmark (+9.1%), Slovenia (+3.7%) and Portugal (+3.4%).
Dollar Stalls, Turns to US Retail Sales for Direction
- US retail sales expected to have risen again in December
- Strong dataset could dampen speculation of rapid Fed rate cuts
- Data due at 13:30 GMT Wednesday, crucial for dollar's path
Waiting for Fed rate cuts
The US economy put in a stellar performance last year. Real economic growth remained around 3%, fueled by resilient consumer spending, a tight labor market, and an enormous government deficit.
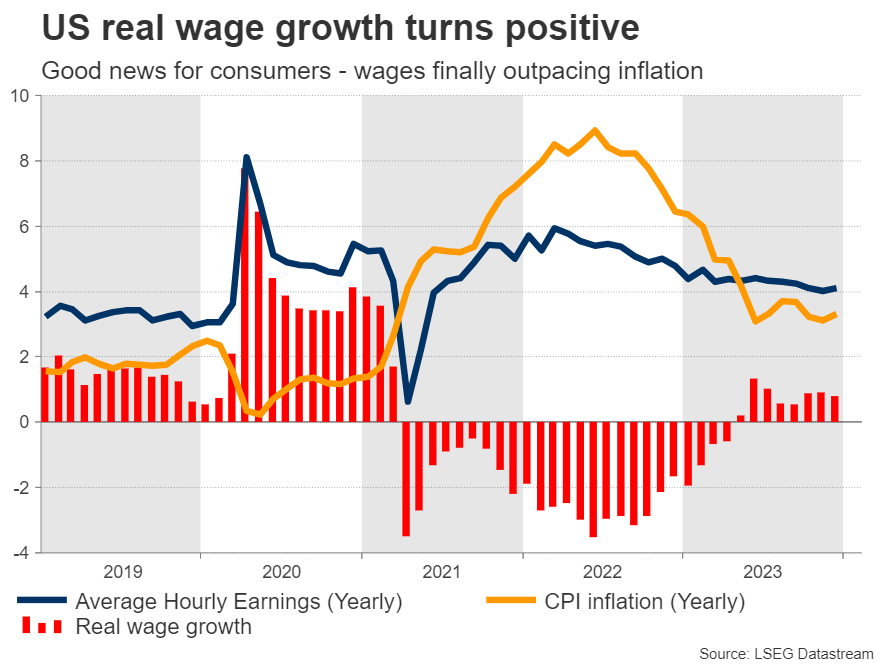
Meanwhile, inflation has declined at a steady pace, with some help from falling energy prices. That's great news for American consumers, who are finally seeing their wages rise faster than prices. In other words, real income growth has finally turned positive.
With inflation cooling, markets have become increasingly confident that the Federal Reserve will soon begin to cut interest rates. The implied probability for a rate cut in March currently stands at 70%, while for the entire year, investors expect more than six rate cuts in total.
As such, the upcoming data releases will be crucial as they will either validate this narrative or push against it, driving the US dollar accordingly. Strong economic data generally dampen speculation for rate cuts and boost the dollar. The opposite is true as well.
Did retail sales jump during the holidays?
The most important release of the week will come on Wednesday with the latest edition of retail sales, which are considered a proxy for consumption. Forecasts suggest that both headline and core retail sales rose in December, by 0.3% and 0.2% respectively, in monthly terms.
It therefore appears that the holiday shopping season was a successful one, something corroborated by monthly credit card spending data released by Mastercard as well as the newly-released CNBC/NRF retail sales monitor, which attempts to track official retail sales.
This tracker pointed to a monthly retail sales increase of 0.44% in December, which is above the consensus forecast of 0.3% that economists have penciled in. As such, the risks seem tilted towards a positive surprise in this dataset, rather than a disappointment.
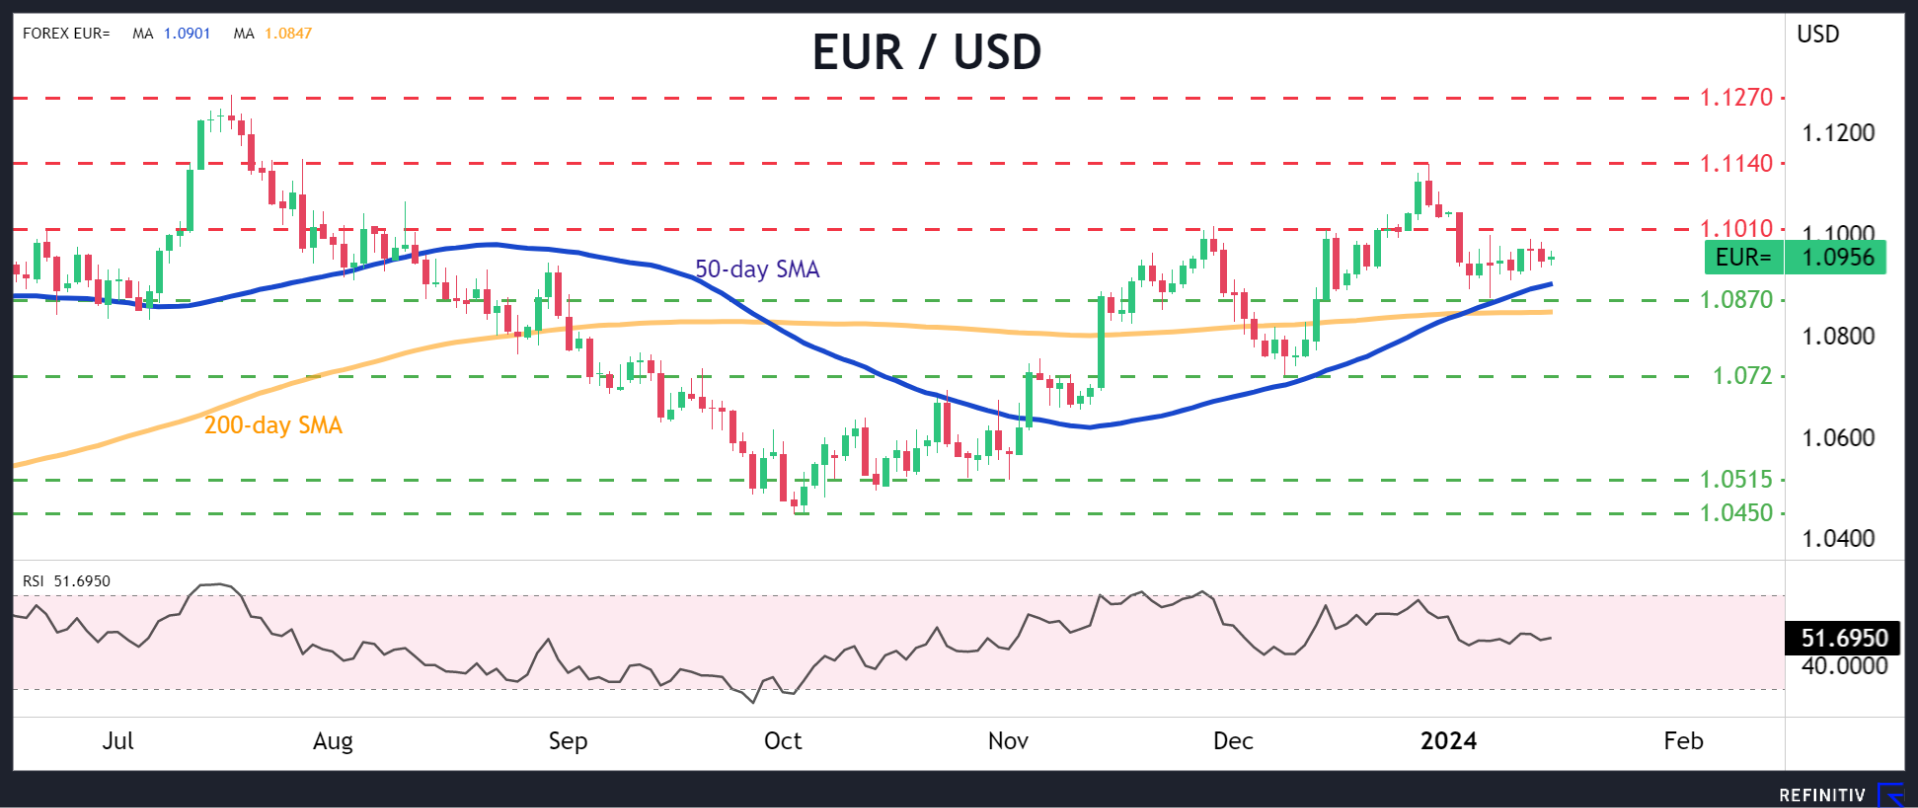
Coming on top of a hotter-than-expected inflation report last week, another upside surprise in retail sales could help dampen speculation about imminent Fed rate cuts and by extension, help the dollar regain some momentum.
Looking at the euro/dollar chart, the 1.0870 zone could provide initial support to any declines. On the flipside, a disappointment in this dataset could send the pair higher, perhaps towards the 1.1010 region.
What's next for the USD?
In the FX market, the dollar has struggled in recent months as the market priced in heavier rate cuts by the Federal Reserve for this year. The huge rally in the stock market was another reason for the dollar's underperformance, as the cheerful sentiment diminished demand for safe haven assets.
Now, the question is whether this trend will continue or reverse moving forward. In this sense, there is some scope for the dollar to stage a comeback in the coming months. The US economy is still in good shape, which makes the market pricing for more than six Fed rate cuts this year appear excessive.
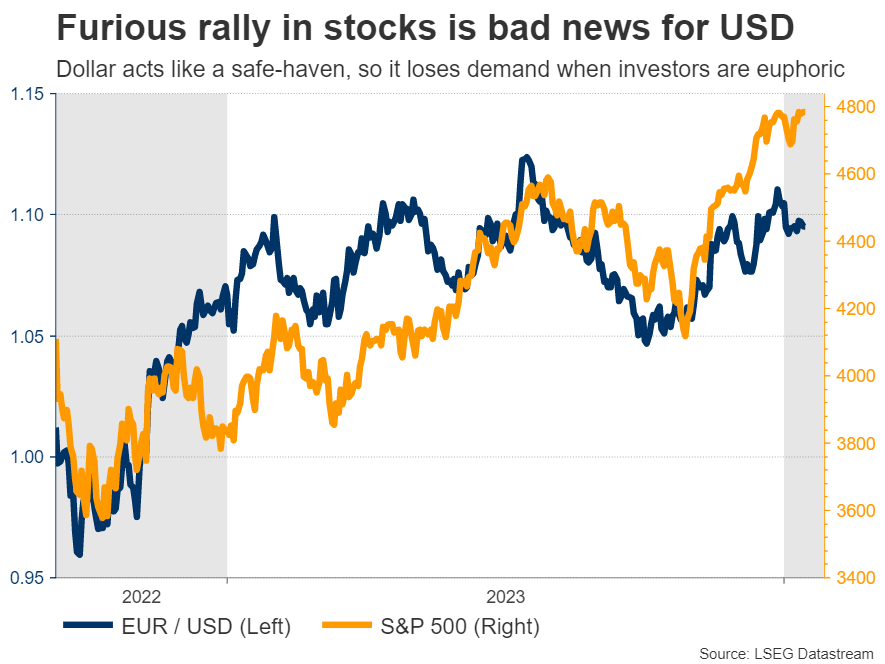
If incoming data remains resilient, leading traders to unwind some of those rate-cut bets, the dollar could benefit. Similarly, the outlook for the euro area economy is rather dark, making it difficult for the euro to sustain any advances.
In this sense, the upside risks surrounding the dollar seem to outweigh the downside risks, although the evolution of global risk appetite in the markets and geopolitical events will also play a crucial role.
GBP/USD Eyes UK Wage Growth
- UK wage growth expected to drop to 6.8%
- UK GDP rises 0.3%, but risk of recession remains
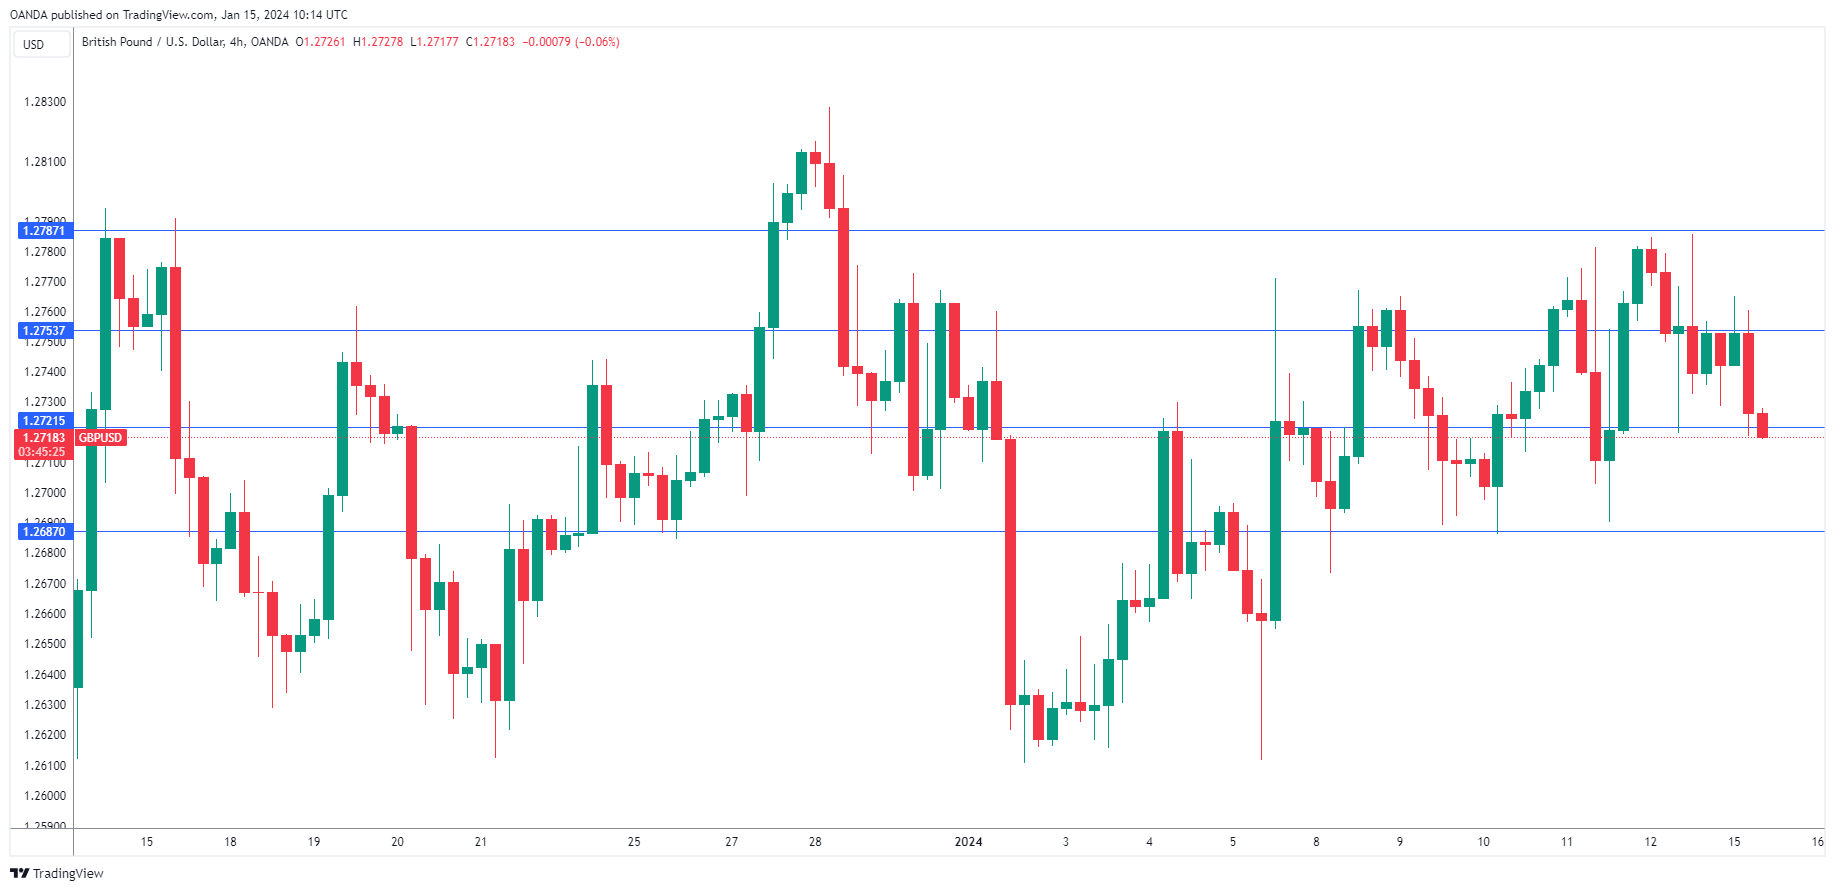
The British pound has started the week with slight losses. In the European session, GBP/USD is trading at 1.2725, down 0.21%.
Wage growth expected to continue falling
The UK will release employment data on Tuesday and the spotlight will be on wage growth. Over the past few months, wages have been falling and the Bank of England would like to see that trend continue as wages have been driving inflation. Average earnings including bonuses dropped to 7.2% in the three months to September, down from 7.7% in the previous release. The market estimate stands at 6.8% for the three months to October.
The UK economy is in trouble, although there was some good news on Friday, as November GDP rebounded with a gain of 0.3% m/m after a 0.3% decline in October. Retail sales drove the gain as shoppers took advantage of Black Friday sales late in November. Still, the probability of a recession, which is defined as two consecutive quarters of negative growth, remains high. The economy declined by 0.1% in the third quarter and a fourth quarter of negative growth would mean that the economy is technically in a recession. Even if a recession is avoided, the economy has flatlined and isn’t showing any growth.
The lack of economic growth puts the Bank of England in a dilemma. The central bank has sharply raised interest rates in order to curb high inflation and significant progress has been made. A year ago, inflation was in double digits, galloping at a 10.1% clip. Inflation has fallen to 3.9%, which is still double the 2% target. Governor Bailey has pushed back against rate cuts and insisted that the BoE would maintain a ‘higher for lower’ rate path, but lowering rates would increase economic activity and lessen the likelihood of a recession. The BoE has maintained the cash rate at 5.25% three straight times and meets next on February 1.
GBP/USD Technical
- GBP/USD is testing support at 1.2721. Below, there is support at 1.2687
- There is resistance at 1.2753 and 1.2787
BTC/USD Price and “Three Black Crows” Pattern
On January 11, the highly publicized Bitcoin ETF began trading after it was officially approved by the SEC. On this day, the price of Bitcoin exceeded USD 48,800, as shown by the chart. Bloomberg writes that new US spot funds achieved net inflows of USD 819 million in the first two days of trading.
However, from the high on January 11, a dizzying fall began, and already at the low on January 12, Bitcoin was worth less than USD 41,800. This dynamic may illustrate the “buy the rumors, sell the facts” strategy, which we wrote about on January 3 when predicting the price of Bitcoin in 2024.
News of the ETF's approval sent the ATR above 1,100 on the 4-hour chart, the last time it did so was in mid-June 2022. The market was overly active, and what is important is that three bearish candles (marked with an arrow) summed up this activity. They can be interpreted as the three black crows pattern.
According to statistics from Tim Bulkowski, this pattern works in 78% of cases and means a trend change from bullish to bearish. According to CandleScanner statistics for 20 years, collected on the S&P 500 index market, the pattern turned out to be false only in 18.6% of cases out of 543 occurrences.
Does this mean that the statistics will work on the Bitcoin price chart?
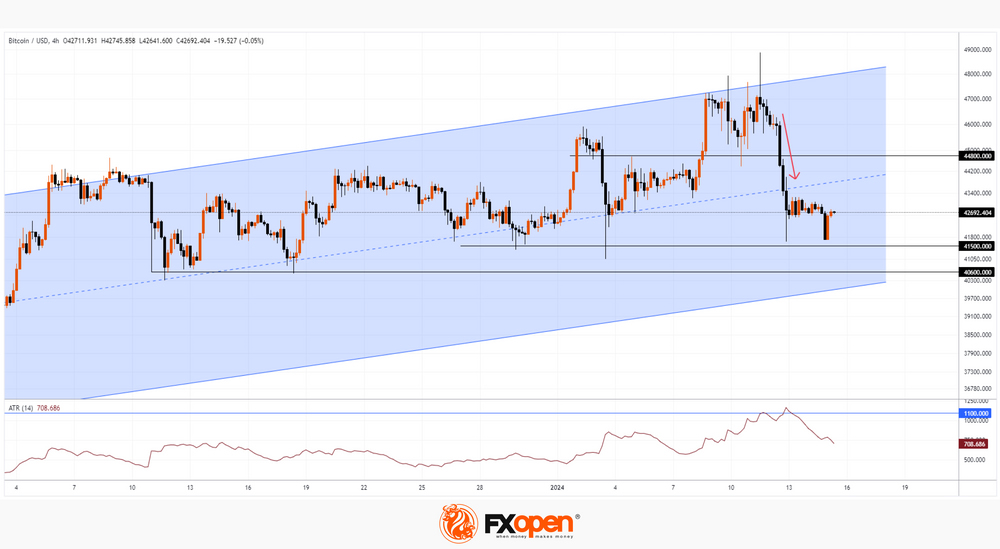
So far, the price is still within the bullish trend (shown as a channel).
The nearest support levels: 41,500, 40,600, the lower border of the channel.
The nearest resistance levels: 44,800, the median line of the channel.
Let’s assume that the beginning of the week will show a continued influx of capital into the Bitcoin ETF. At the same time, it is possible that the price will form a rebound from one of the support lines. But what if these investors also fall into the trap that those who bought Bitcoin on January 11-12 are now in? Then we may witness a breakdown of the lower border of the blue channel, which will confirm the importance of the three black crows pattern.
This article represents the opinion of the Companies operating under the FXOpen brand only. It is not to be construed as an offer, solicitation, or recommendation with respect to products and services provided by the Companies operating under the FXOpen brand, nor is it to be considered financial advice.
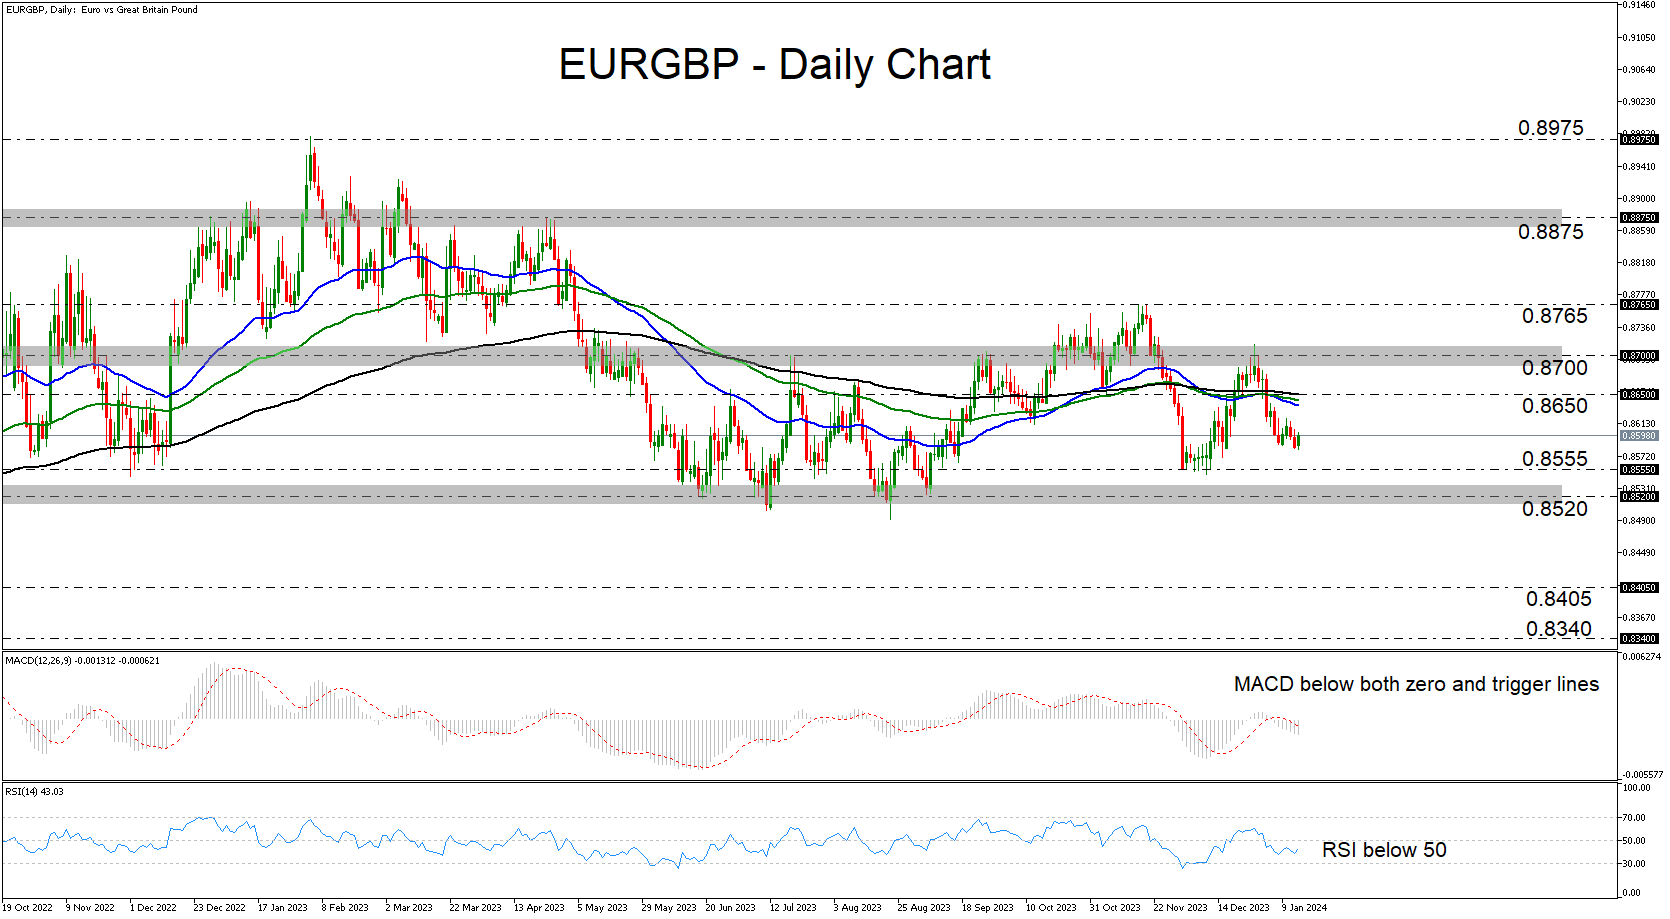
EURGBP Continues to Oscillate Within a Range
- EURGBP slides but remains within a range
- MACD and RSI detect negative momentum
- A dip below 0.8520 could turn the outlook bearish
EURGBP has been drifting south recently, after it hit resistance slightly above the 0.8700 territory. That said, although the pair is currently trading below all three of the plotted exponential moving averages (EMAs) on the daily chart, it is still stuck within the sideways range between 0.8520 and 0.8700. That range has been containing most of the price action since May.
Our short-term oscillators detect negative momentum. The MACD runs below both its zero and trigger lines, while the RSI, although it ticked up somewhat, remains below its equilibrium 50 line. These indicators suggest that some further declines may be on the cards, perhaps until the lower end of the range at around 0.8520.
For the outlook to turn bearish, a decisive dip below that hurdle may be needed. Such a move may encourage the bears to dive all the way down to the low of August 24, 2022, the break of which could carry extensions towards the low of August 4 of that year.
The picture may start brightening only upon a recovery above the upper end of the range at around 0.8700. This could allow advances towards the peak of November 20, where another breach could carry larger bullish implications, perhaps paving the way towards the 0.8875 zone, defined as resistance by the peak of April 25.
To sum up, EURGBP lost some ground recently, but remained within a broader trendless path. The move signaling that the bears have stolen all the bulls’ swords may be a dip below the 0.8520 barrier.
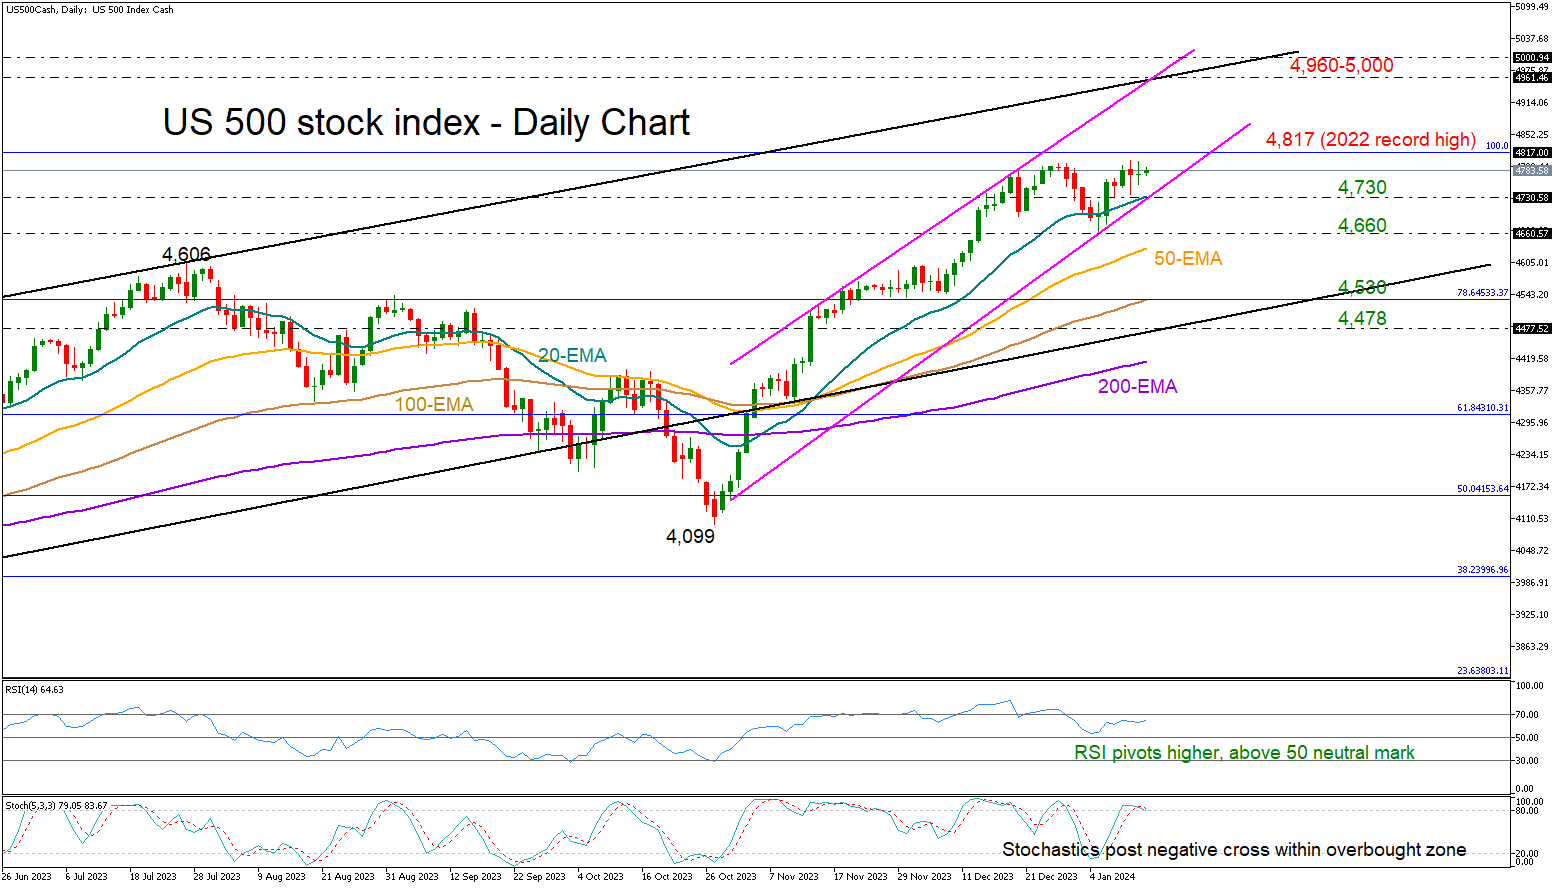
Will US 500 Index Sail to Record Highs?
- The US 500 index flirts with its 2022 record high
- Lacks momentum, but its trend remains positive above 4,660
The US 500 stock index (cash) recovered its latest pullback, rising swiftly back above its 20-day exponential moving average (EMA) and closer to its record high of 4,817 registered in January 2022.
There is some skepticism in the market as the stochastic oscillator is looking for a negative reversal slightly above its 80 overbought level. That said, the RSI is still sloping upwards comfortably above its 50 neutral mark, leaving a ray of hope that the bulls could stay in charge.
Besides, the positive trend that began at the end of October 2023 remains intact. A break below the 20-day EMA at 4,730 would push the price out of the bullish channel, while a dip below the previous low of 4,660 would confirm a double top pattern, signaling a negative trend reversal.
If the bearish scenario unfolds, the price could decline towards the 4,530 region, unless the 50-day EMA comes to the rescue around 4,630. Slightly lower, selling pressures could retest the ascending line from October 2022 at 4,480, which acted as support several times previously.
In the opposite case, where the index sails into uncharted waters above the 4,817 record high, all the attention will fall to the 4,960 region. Strikingly, the resistance line, which joins all the highs from December 2022 and July 2023, is intersecting the upper band of the bullish channel around the same location. The 5,000 psychological mark will be closely watched too. A sustainable break higher would strengthen the long-term positive outlook.
Theoretically, it is said that traders tend to create new demand for stocks, leading to the January positive effect.
All in all, the loose momentum in the US 500 stock index is currently reflecting weak buying forces. Still, any declines may not raise serious concerns unless the price dives below 4,660-4,730.
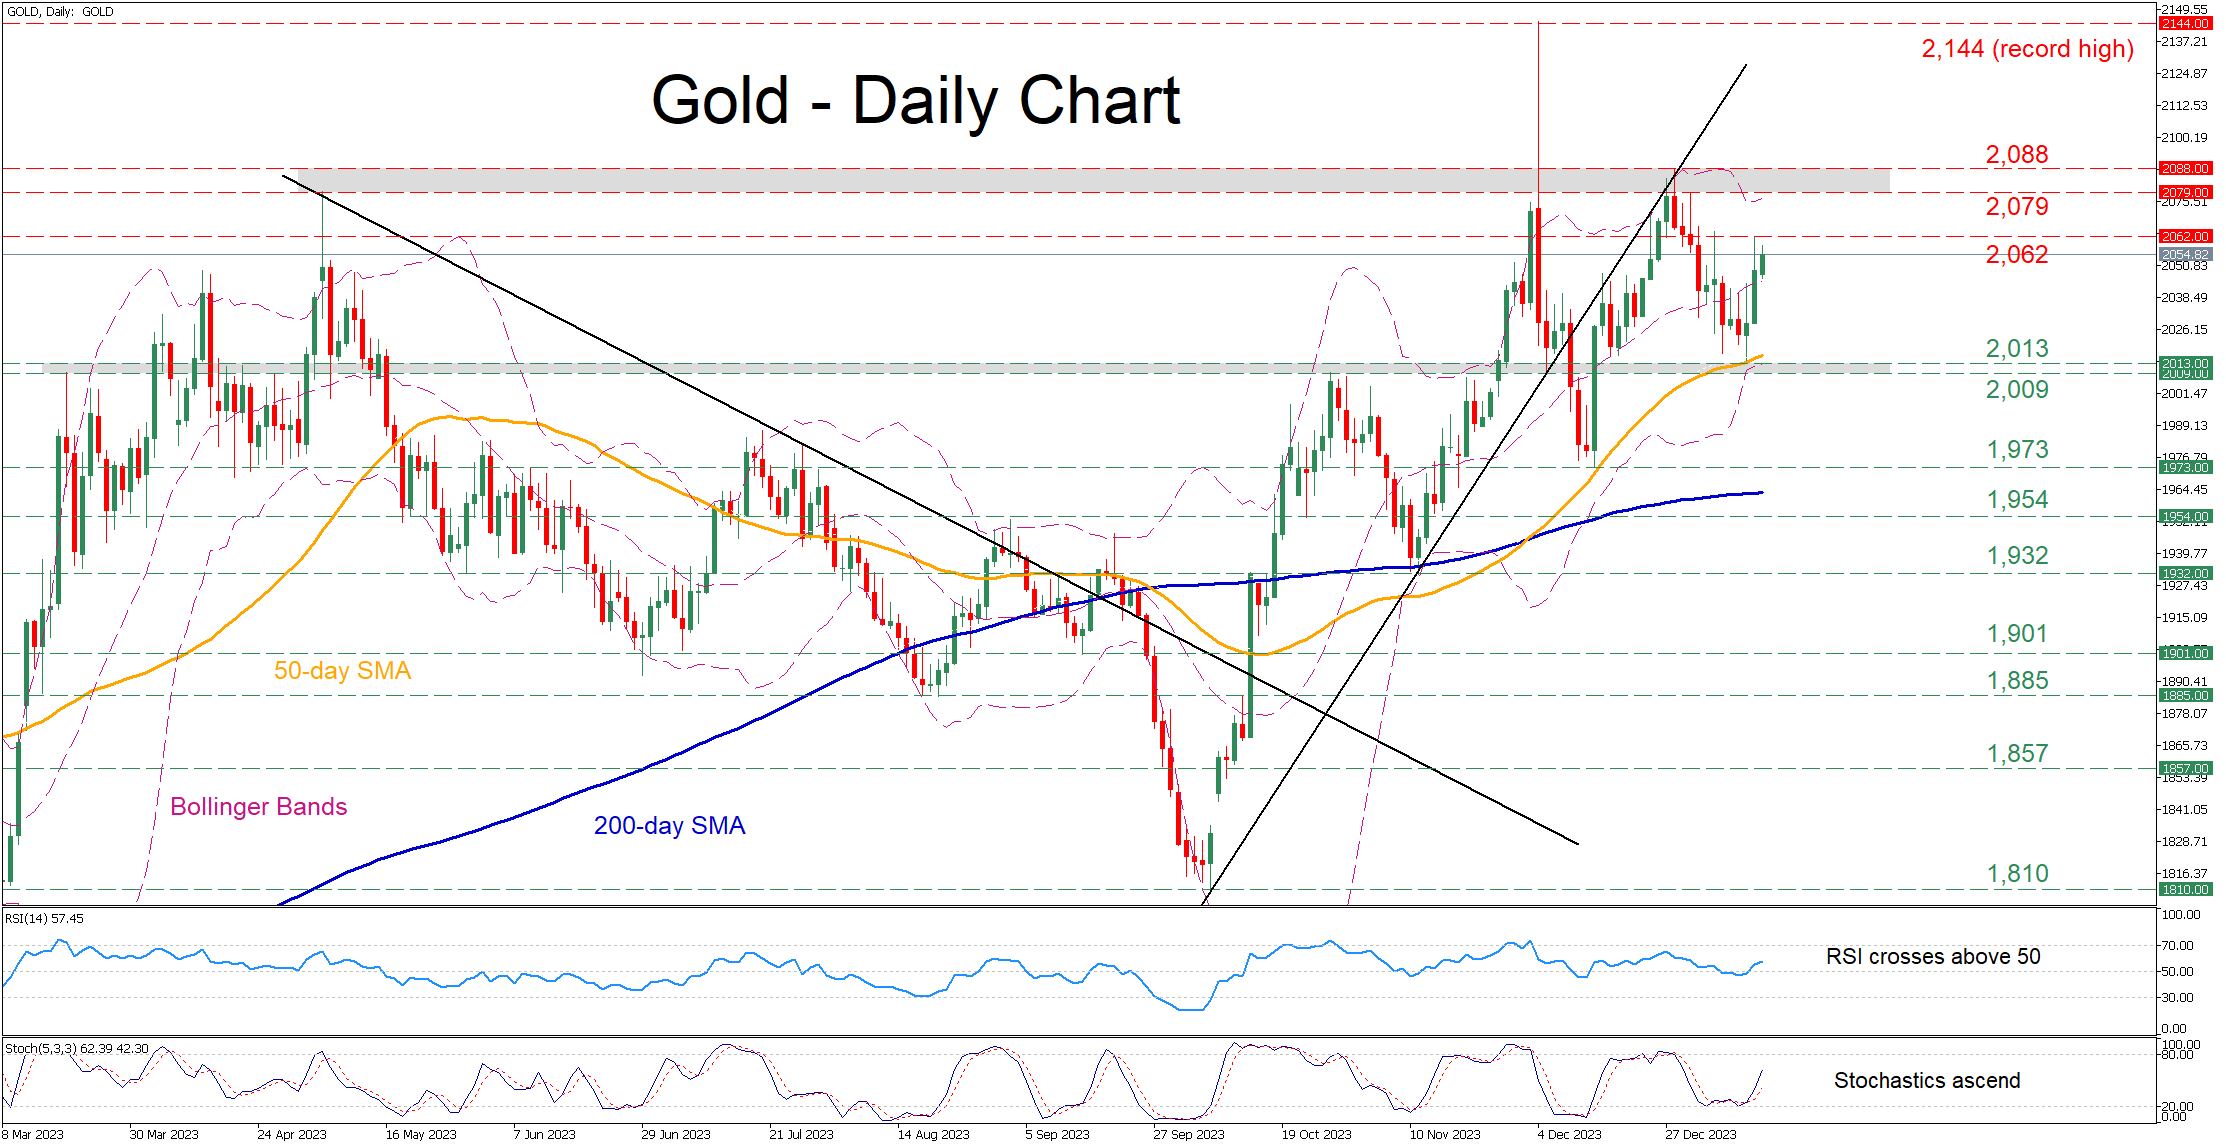
Gold Edges Higher After Hitting 50-day SMA
- Gold finds its feet at the 50-day SMA
- Clocks a positive session but does not yet erase recent drop
- Momentum indicators suggest that positive momentum is strengthening
Gold had been undergoing a downside correction after attempting to break above an upward sloping trendline drawn from its October lows. However, the price bounced off its 50-day simple moving average (SMA) and recouped some losses, with the short-term oscillators suggesting improving positive bias.
Should the bulls attempt to push the price even higher, the recent resistance of 2,062 could be the first barrier in their way. A violation of that zone could open the door for the crucial 2,079-2,088 range. Failing to halt there, the price may challenge the record high of 2,144.
On the flipside, bearish actions could send the price lower towards the 2,009-2,013 range defined by the October resistance territory and January low. If that barricade fails, the bears may attack the December bottom of 1,973. Even lower, the October support of 1,954 may provide downside protection.
In brief, gold has regained traction following its rebound from the 50-day SMA. Nevertheless, a fresh higher high is needed for the latest advance to become more convincing.
Forex and Cryptocurrencies Forecast
EUR/USD: Market Anticipates Federal Reserve Rate Cut
We published our global forecast for EUR/USD for the upcoming year in the last week of 2023. Now, moving from long-term projections, we return to our traditional weekly reviews, which have been conducted by the NordFX analytical group for over a decade.
The main event of the past week was undoubtedly the U.S. inflation data. The figures released on Thursday, January 11, showed that the Consumer Price Index (CPI) rose by 3.4% year-on-year, compared to a consensus forecast of 3.2% and a previous value of 3.1%. On a monthly basis, consumer inflation also increased, registering 0.3% against a forecast of 0.2% and a previous figure of 0.1%. On the other hand, the core CPI, which excludes volatile food and oil prices, decreased to 3.9% from a previous value of 4.0% (year-on-year).
Recall that with his dovish remarks at the December press conference, Federal Reserve Chairman Jerome Powell created the impression that he is no longer the staunch inflation fighter he appeared to be earlier. This suggests that the U.S. monetary authorities will now respond more flexibly to changes in this indicator. Consequently, the mixed CPI data further convinced market participants that the Fed will begin to ease its policy by the end of Q1 2024. According to CME Fedwatch, the likelihood of a 25 basis point rate cut in March increased to 68% from 61% prior to the release of the statistics. Meanwhile, strategists at the largest banking group of the Netherlands, ING, expect a significant weakening of the dollar towards the end of Q2: that's when they anticipate EUR/USD will start its rally to 1.1500. Until then, in their view, the currency market will remain quite unstable.
Regarding the Eurozone, statistics released on Monday, January 8, indicated that the situation in the consumer market is bad, but not as dire as expected. Retail sales showed a decline of -1.1% year-on-year. This figure, although higher than the previous value of -0.8%, was significantly below the forecast of -1.5%.
In this context, the statement by European Central Bank (ECB) board member Isabel Schnabel appeared rather hawkish. She opined that economic sentiment indicators in the Eurozone have likely reached their nadir, while the labour market remains stable. Schnabel also did not rule out the possibility of a soft landing for the European economy and a return to the inflation target of 2.0% by the end of 2024. According to her, this is still achievable, but it would require the ECB to maintain a high interest rate. This contrast between the hawkish stance of the pan-European mega-regulator and the dovish comments of its overseas colleagues supported the euro, preventing EUR/USD from falling below 1.0900.
Data on industrial inflation in the U.S., released at the end of the workweek on Friday, January 12, also showed a decline in this indicator, but it did not have a strong impact on the quotes. The Producer Price Index (PPI) was 1.8% year-on-year (forecast 1.9%, previous value 2.0%), and the monthly PPI, like in November, recorded a decrease of -0.1% (forecast +0.1%).
Following the release of this data, EUR/USD closed the workweek at 1.0950.
Currently, experts' opinions regarding the near future of the pair provide no clear direction, as they are evenly split: 50% voted for a strengthening of the dollar, and 50% sided with the euro. Technical analysis indicators also appear quite neutral. Among trend indicators on D1, the balance of power between red and green is 50% to 50%. Among oscillators, 25% have turned green, another 35% are in a neutral grey, and the remaining 40% are red, with a quarter of them signalling that the pair is oversold. The nearest support for the pair is in the zone of 1.0890-1.0925, followed by 1.0865, 1.0725-1.0740, 1.0620-1.0640, 1.0500-1.0515, 1.0450. Bulls will encounter resistance in the areas of 1.0985-1.1015, 1.1185-1.1140, 1.1230-1.1275, 1.1350, and 1.1475.
Next week, notable economic events include the release of Consumer Price Index (CPI) data for Germany on Tuesday, January 16, and for the Eurozone on Wednesday, January 17. Additionally, Wednesday will bring statistics on the state of the U.S. retail market. On Thursday, January 18, the usual figures for initial jobless claims in the United States will be released. The same day, we will learn the value of the Philadelphia Federal Reserve's Manufacturing Business Outlook Survey, and on Friday, the University of Michigan's Consumer Sentiment Index will be published. Furthermore, traders should be aware that Monday, January 15, is a public holiday in the U.S. as the country celebrates Martin Luther King Jr. Day.
GBP/USD: Pound Retains Potential for Growth
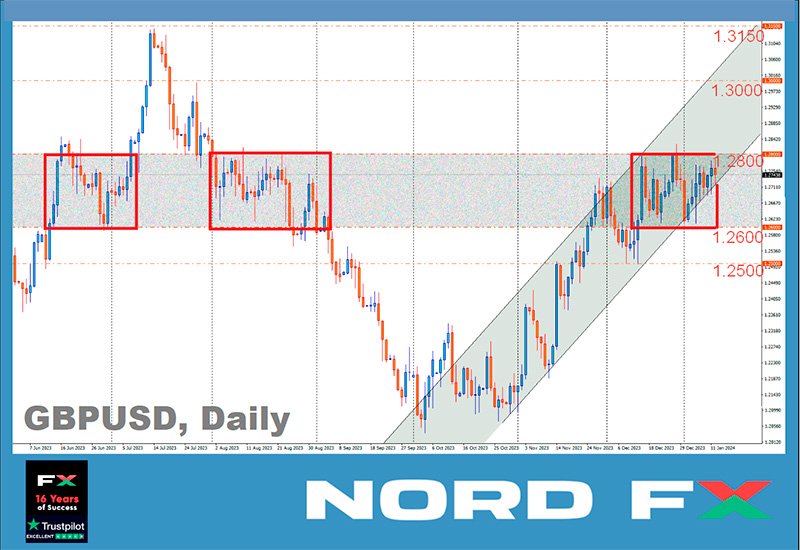
Before the New Year holidays, GBP/USD reached its highest level since August 2023, touching 1.2827. It then fell by more than 200 points to the lower line of the ascending channel and, bouncing off it, began to rise again. At the time of writing this forecast, it is difficult to confidently say that the pound has returned to a firm upward trend. The dynamics of the last four weeks can be interpreted as a sideways trend. A similar pattern, specifically in the 1.2600-1.2800 zone, was observed in August. Back then, it was merely a temporary respite before the pair's fall continued with renewed vigour. It's possible that we are witnessing a similar scenario now, but with a positive sign instead of a negative one. If this is the case, we could see GBP/USD in the 1.3000-1.3150 zone during the first quarter.
Last week, the British currency was bolstered by data on inflation in the U.S. and forecasts regarding a dovish pivot by the Federal Reserve. The UK's Office for National Statistics (ONS) also supported the pound, reporting on Friday, January 12, that the country's GDP in November grew by 0.3% month-on-month, against a forecast of 0.2% and a decrease of -0.3% recorded in October. Additionally, the volume of manufacturing output rose by 0.4% month-on-month in November (forecast 0.3%, previous value – a decline of -1.2%). At the same time, the British FTSE 100 index rose by 0.8%, reflecting the market's optimistic mood and its participants' appetite for risk.
GBP/USD concluded the week at 1.2753. According to economists at Scotiabank, for the pound to maintain its bullish momentum, it needs to confidently overcome resistance in the 1.2800-1.2820 zone. "However," they write, "the absence of a breakthrough in the 1.2800 area may begin to weary [market participants], and the price actions over the last month are still shaping up as potentially bearish."
Despite the pound retaining potential for growth in the medium term, the experts' forecast for the coming days leans towards the dollar. 60% of them voted for a fall in the pair, 25% for its rise, and 15% preferred to remain neutral. In contrast to the specialists, the indicators almost unanimously favour the British currency: among the oscillators on D1, 90% are on the side of the pound (with 10% neutral), and among trend indicators, all 100% are pointing upwards. If the pair moves south, it will encounter support levels and zones at 1.2720, 1.2650, 1.2600-1.2610, 1.2500-1.2515, 1.2450, 1.2330, 1.2210, 1.2070-1.2085. In the event of a rise, it will face resistance at levels 1.2785-1.2820, 1.2940, 1.3000, and 1.3140-1.3150.
For the upcoming week, notable dates include Tuesday, January 16, when a significant batch of labour market data from the United Kingdom will be released. Consumer Price Index (CPI) data will be published on Wednesday, January 17, and retail sales figures in the UK will be available on Friday, January 19.
USD/JPY: U.S. CPI Outperforms Japan's CPI
The Bank of Japan (BoJ) is considering lowering its inflation forecast for the 2024 fiscal year to around the mid-2% range in its upcoming quarterly report, set to be published on January 23. This news was reported by the Jiji agency, citing Reuters, on Thursday, January 11. Japan's real wages fell by 3.0%. With a sharp slowdown in wage growth, Tokyo's Consumer Price Index (CPI) was below forecasts, dropping from 2.7% to 2.4%. Interpreting these data, analysts have begun to speculate that the Bank of Japan might delay tightening its ultra-loose monetary policy. Following this logic, traders were advised to open long positions in the USD/JPY pair.
However, after reaching a peak of 146.41 on January 11, the pair reversed and began to decline: the decrease in U.S. inflation turned out to be much more significant for market participants than the decrease in Japan's inflation. The fact that the interest rate on the yen will remain at a negative level of -0.1% is not so crucial. What is more important is that the rate on the dollar could soon drop by 0.25%.
Mathias Cormann, the Secretary-General of The Organisation for Economic Co-operation and Development (OECD), recently stated that "the Bank of Japan has opportunities to further consider the level of tightening of its monetary policy." However, we have already heard many such vague statements and opinions. In our view, it is much more interesting to present the technical analysis of the current situation performed by economists at the French bank Societe Generale.
"They write that USD/JPY sharply recovered after forming an intermediate low around 140.20 at the end of last month. It has returned to the 200-Day Moving Average (200-DMA) and approached the October low of 146.60-147.40, which acts as an intermediate resistance zone. After an unsuccessful attempt to break through the 50-day moving average at the level of 146.41 on Thursday, January 11, the pair is retreating, indicating the start of an initial pullback. "It will be interesting to see if the pair can hold the 200-DMA around 143.40. Failure would mean the risk of another decline towards 140.20-139.60. A breakthrough above 146.60-147.40 is necessary to confirm the continuation of the rebound [upwards]," they believe at Societe Generale.
USD/JPY ended last week at 144.90. (Interestingly, the current dynamics fully align with the wave analysis we discussed in our previous review). In the near term, 40% of experts anticipate further strengthening of the yen, another 40% are in favour of the dollar, and 20% hold a neutral position. Regarding the trend indicators on D1, 60% are pointing north, while the remaining 40% are looking south. Among the oscillators, 70% are coloured green (with 15% in the overbought zone), 15% are red, and the remaining 15% are neutral grey. The nearest support level is in the zone of 143.75-144.05, followed by 142.20, 141.50, 140.25-140.60, 138.75-139.05, 137.25-137.50, and 136.00. Resistance levels are located at 145.30, 146.00, 146.90, 147.50, 148.40, 149.80-150.00, 150.80, and 151.70-151.90.
No significant events concerning the Japanese economy are expected in the coming week
CRYPTOCURRENCIES: Day X Has Arrived. What's Next?
What many have long talked about and dreamed of has finally come to pass. As expected, on January 10, the U.S. Securities and Exchange Commission (SEC) approved a batch of 11 applications from investment companies to launch spot exchange-traded funds (ETFs) based on Bitcoin. As a result, ETFs from Grayscale, as well as from Bitwise and Hashdex, were admitted to the NYSE Arca stock exchange. BlackRock and Valkyrie funds are being launched on Nasdaq. CBOE will host ETFs from VanEck, Wisdom Tree, Fidelity, Franklin Templeton, as well as joint funds from ARK Invest/21 Shares and Invesco/Galaxy.
Contrary to expectations, immediately after the approval, the BTC/USD pair's rate rose only to $47,652 instead of a jubilant surge. The reason for such a tepid reaction is that the market had already priced in this event. Moreover, the day before, hackers breached the SEC's account on social network X (formerly Twitter) and published a fake tweet about the approval of the long-awaited BTC-ETFs. The market then reacted to this false statement with a rise in the main cryptocurrency to the $48,000 mark. After the refutation, the price fell back down, and on January 10, it merely repeated what had happened the day before.
It's important to note that the SEC was not particularly pleased with its decision to approve the applications. The first application for a spot ETF was filed back in 2013 by the Winklevoss brothers (Cameron & Tyler Winklevoss) and was rejected in 2017. Approximately six years have passed since then, but the regulator's aversion to cryptocurrencies remained, and the current approval was granted somewhat reluctantly and under pressure. According to a press release by the agency's chair Gary Gensler, the Commission's decision was based on a ruling by the appellate court in Grayscale's lawsuit regarding the transformation of a trust fund into a spot ETF. The court ruled in favour of Grayscale, stating that the SEC "failed to adequately justify its reasons for refusal." After this, delaying the approval of similar products was no longer sensible.
However, on January 10, Gensler did not hold back in his negative assessment. "Despite the approval of spot BTC-ETFs," he noted in the press release, "we do not endorse bitcoin. Investors should consider the numerous risks associated with Bitcoin and products whose value is tied to the cryptocurrency. Bitcoin is primarily a speculative, volatile asset that is also used for illegal activities, including ransomware, money laundering, evasion of sanctions, and financing of terrorism. Today, we approved the listing and trading of certain ETP spot bitcoin shares, but we did not approve Bitcoin," concluded the SEC head, making it clear that the battle with digital assets is far from over.
Discussing the short-term perspective, many analysts did not anticipate a significant rally, pointing to $48,500 as a key resistance level. They proved correct: after BTC/USD breached this level on September 11, a "sell the news" phenomenon ensued – a mass closure of buy-orders and profit-taking. Consequently, the price sharply retraced. According to Coinglass, the total sum of liquidations for all cryptocurrency positions was approximately $209 million.
Regarding the long-term impact of the launch of spot bitcoin ETFs, time is needed for a full assessment. About a week is necessary for the funds to commence operations on exchanges, with investment volume data expected around mid-February. If we compare with ETFs for other products, approximately $1.2 trillion has been invested in them over the past two years. Seven years after the 2004 launch of physical gold ETFs, the price of this metal quadrupled, and now over $100 billion is held in gold ETFs.
Concerning digital gold, analysts at Standard Chartered bank consider the approval of bitcoin ETFs a pivotal moment for the asset's acceptance. "Bitcoin will likely see growth akin to gold-linked exchange-traded products," they write. "But this is expected to materialize over a shorter period: not in seven to eight years, as was the case with gold, but within one to two years, considering the swift evolution of the crypto market." The bank forecasts bitcoin's price potentially reaching $200,000 by the end of 2025. Standard Chartered estimates that by the end of 2024, exchange-traded funds could hold between 437,000 BTC and 1.32 million BTC, equating to a market inflow of $50-100 billion, creating a significant price impulse for the primary cryptocurrency.
Venture investor Chamath Palihapitiya also expresses a comparable sentiment. He believes that 2024 could emerge as a landmark year for bitcoin. The billionaire highlighted that the approval of numerous spot exchange-traded ETFs is likely to "revolutionize BTC," potentially leading to its widespread adoption. Palihapitiya remarked that in such a scenario, by the end of 2024, bitcoin could become a staple in traditional financial parlance.
According to CoinDesk data, the 40-day correlation between digital gold and the Nasdaq 100 technology index has dropped to zero. Over the past four years, this price correlation has been positive, varying from moderate (0.15) to strong (0.8), reaching its peak during the bear market of 2022. Now, bitcoin has completely "decoupled" from Nasdaq. This correlation reset may signify bitcoin's potential as an attractive diversification tool for investment portfolios, thereby enhancing its value.
Macro-strategist Henrik Zeberg also anticipates a phenomenal bull market in 2024. He expects the dynamics of digital assets this year, driven by the entry of new players, to be "parabolic." "[Bitcoin] is going to be absolutely explosive – it will shoot up vertically. I think we will reach at least $115,000. That's my most conservative forecast. The $150,000 level is also feasible, and I see the potential for $250,000," the economist notes.
Zeberg added that the first four months of 2024 could be "incredibly impressive" for the crypto market, thanks to institutional and traditional investors entering after the approval of spot bitcoin ETFs. Those who missed out on the first or second bull cycle will now say, "Oh, I missed the first two times, but I'll be in this one." However, he believes that traditional markets are facing "the worst crash since 1929," when the Great Depression began in the U.S.
Renowned analyst known as PlanB believes that the price of bitcoin could soon reach between $100,000 and 1 million. He explains that he doesn't expect a BTC price drop, as its adoption level is currently only 2-3%. According to the logistic S-curve of organizational development and Metcalfe's law, a decrease in asset profitability should not be expected while the adoption level is below 50%. Therefore, the analyst opines, "the main cryptocurrency is set for exponential growth for a couple more years."
Indeed, alongside the optimists, there are many who forecast a downward trend. We discussed some of these views two weeks ago in a special review titled "Forecast 2024: Bitcoin Yesterday, Tomorrow, and the Day After." Currently, it's worth noting the recent statement from TV host and founder of hedge fund Cramer & Co., Jim Cramer. He asserted that bitcoin has reached its peak and further growth should not be expected. This statement was made as bitcoin surpassed the $47,000 mark. Observing bitcoin's performance on January 11-12, it raises the question: "Could Jim Cramer be right?"
As of the evening of January 12, when this review was written, BTC/USD is experiencing a significant drop, trading around $43,000. The total market capitalization of the crypto market is at $1.70 trillion, up from $1.67 trillion a week ago. The Bitcoin Fear & Greed Index over the week has decreased from 72 to 71 points and remains in the Greed zone.
Contrary to bitcoin's performance, the leading altcoin exhibited a much more impressive growth last week. Starting from a level of $2,334 on January 10, ETH/USD reached a weekly high of $2,711 on January 12, showcasing a 16% increase. Interestingly, this surge occurred after the SEC Chairman's statement emphasizing that the regulator's positive decision exclusively pertained to exchange-traded products based on bitcoin. Gary Gensler clarified that this decision "in no way signals readiness to approve listing standards for crypto assets that are securities." It's worth noting that the regulator still regards only bitcoin as a commodity, while considering "the overwhelming majority of crypto assets as investment contracts (i.e., securities)." Therefore, the hope for the imminent arrival of spot ETFs with Ethereum and other altcoins is unfounded.
Yet, against this rather grim backdrop, ETH suddenly soared. The market's reaction is indeed inscrutable. However, towards the end of Friday, January 12, Ethereum followed bitcoin in a downturn, welcoming Saturday in the $2,500 zone.