

Sample Category Title
AUD/USD Daily Report
Daily Pivots: (S1) 0.6666; (P) 0.6698; (R1) 0.6717; More...
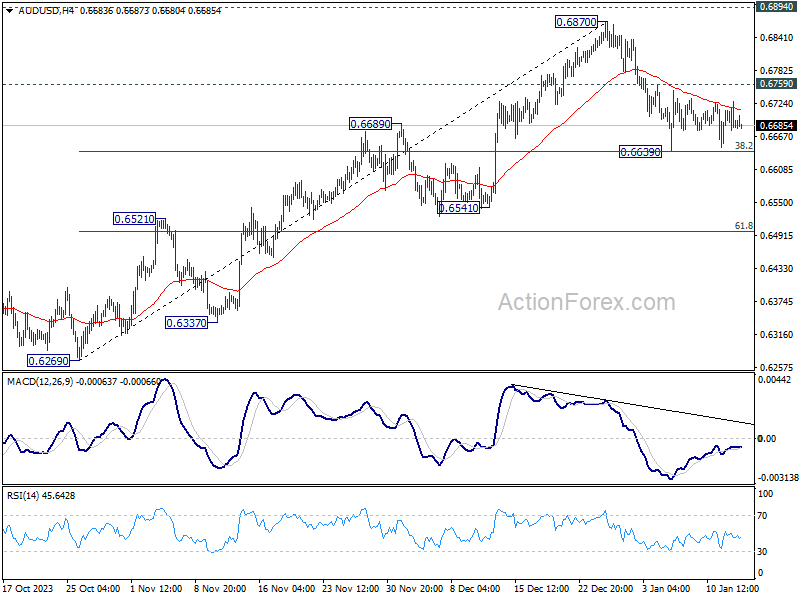
Intraday bias in AUD/USD remains neutral at this point. Further decline is expected as long as 0.6759 minor resistance holds. Firm break of 0.6639 will resume the fall from 0.6870 to 61.8% retracement of 0.6269 to 0.6870 at 0.6497 next. On the upside, break of 0.6759 will bring retest of 0.6870 resistance instead.
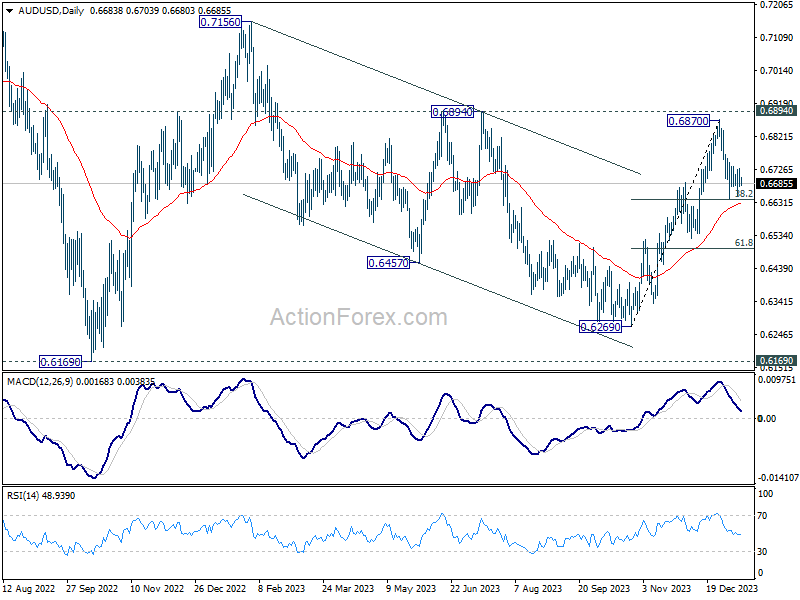
In the bigger picture, price actions from 0.6169 (2022 low) could be just a medium term corrective pattern to the down trend from 0.8006 (2021 high). Rise from 0.6269 is seen as the third leg of the pattern that could target 0.7156 on break of 0.6894 resistance. For now, range trading should be seen between 0.6169 and 0.7156 (2023 high), until further developments.
USD/JPY Daily Outlook
Daily Pivots: (S1) 144.32; (P) 144.95; (R1) 145.54; More...
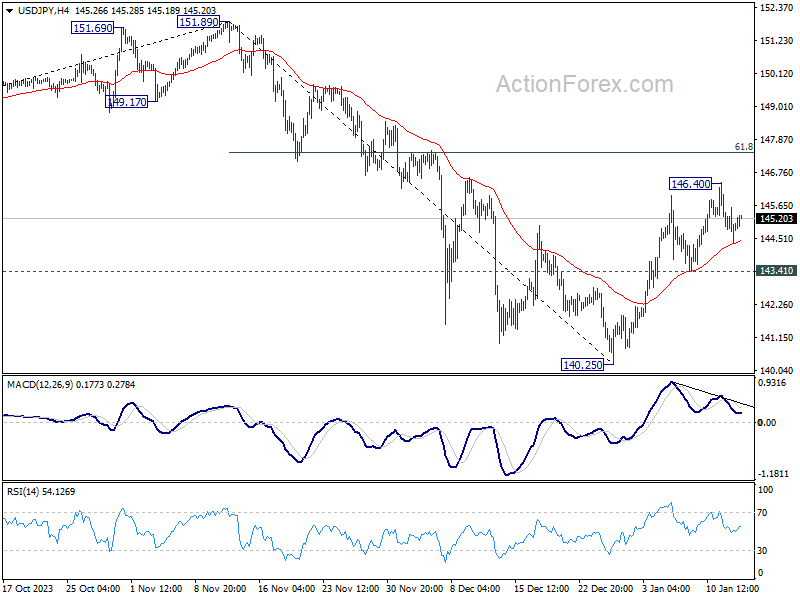
Intraday bias in USD/JPY remains neutral at this point. Rebound from 140.25 could extend through 146.40, but upside should be limited by 61.8% retracement of 151.89 to 140.25 at 147.44. On the downside, break of 143.41 will turn bias back to the downside for retesting 140.25 low.
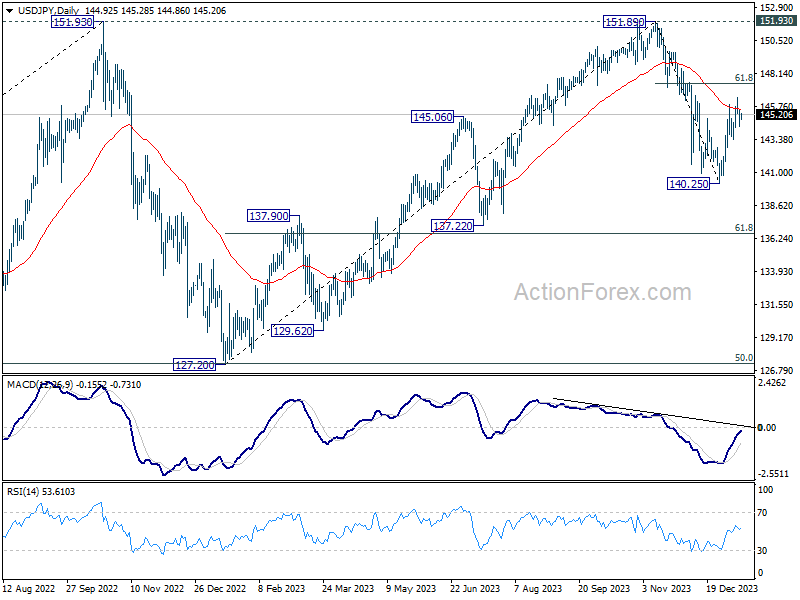
In the bigger picture, for now, fall from 151.89 is still seen as the third leg of the corrective pattern from 151.89. Another decline through 140.25 will target 61.8% retracement of 127.20 to 151.89 at 136.63. Sustained break there will pave the way to 127.20 support (2022 low). However, firm break of 147.44 fibonacci resistance will dampen this view and bring retest of 151.89 instead.
USD/CHF Daily Outlook
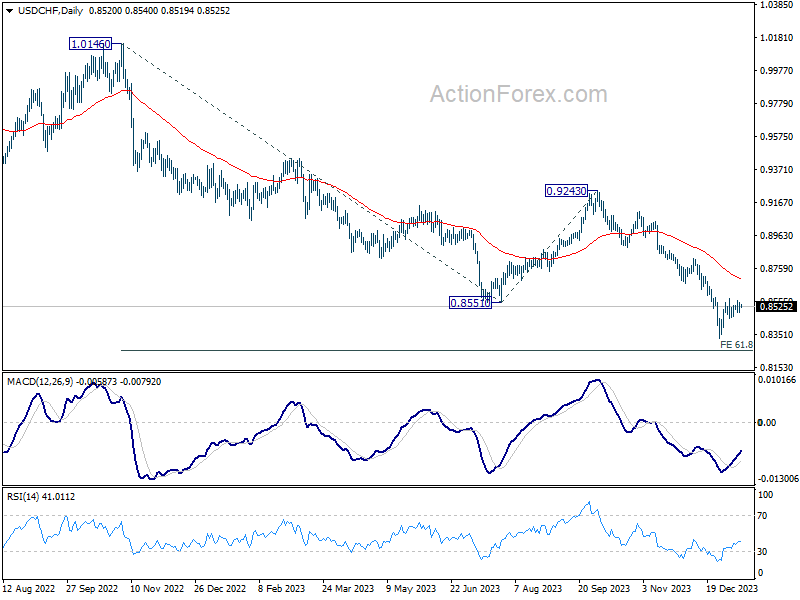
Daily Pivots: (S1) 0.8498; (P) 0.8518; (R1) 0.8528; More....
USD/CHF is extending the consolidation above 0.8332 and intraday bias remains neutral. Also, outlook stays bearish as long as 0.8665 support turned resistance holds. On the downside, break of 0.8332 will resume larger fall from 0.9243 to 0.8257 projection level.
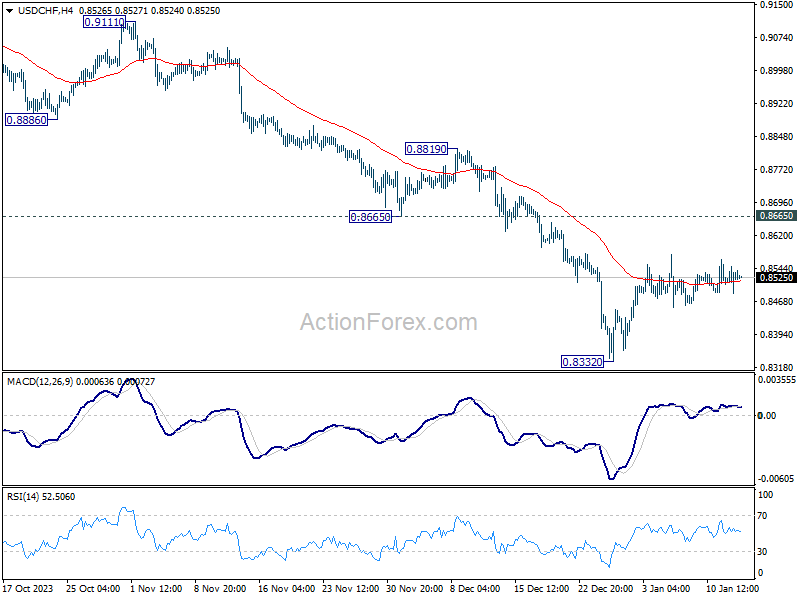
In the bigger picture, down trend from 1.0146 (2022 high) is in progress. Next target is 61.8% retracement of 1.0146 to 0.8551 from 0.9243 at 0.8257. Sustained break there could prompt downside acceleration to 100% projection at 0.7648. This will now remain the favored case as long as 0.8819 resistance holds.
GBP/USD Daily Outlook
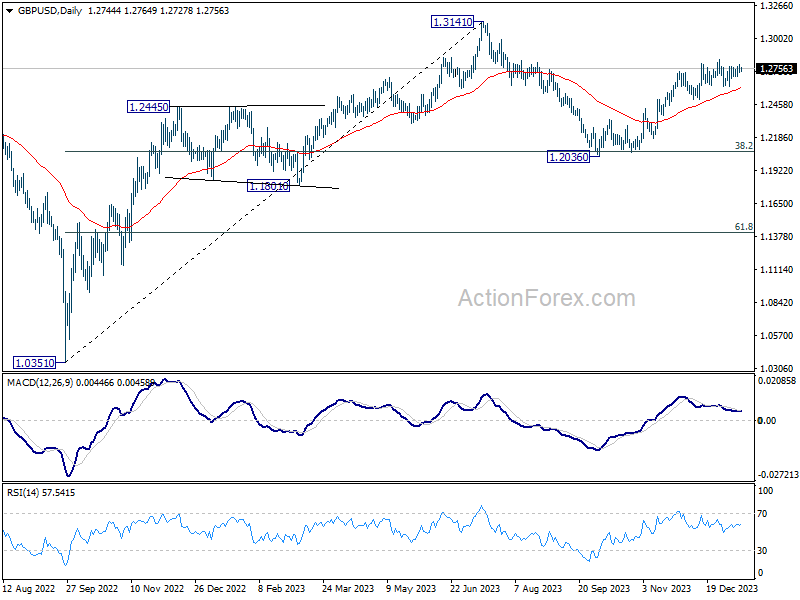
Daily Pivots: (S1) 1.2721; (P) 1.2753; (R1) 1.2787; More...
Intraday bias in GBP/USD remains neutral as it's still bounded in range below 1.2826. More sideway trading could be seen. On the upside, decisive break of 1.2826 will resume whole rally from 1.2036. Nevertheless, another fall and break of 1.2611 will bring deeper correction to 1.2499 support instead.
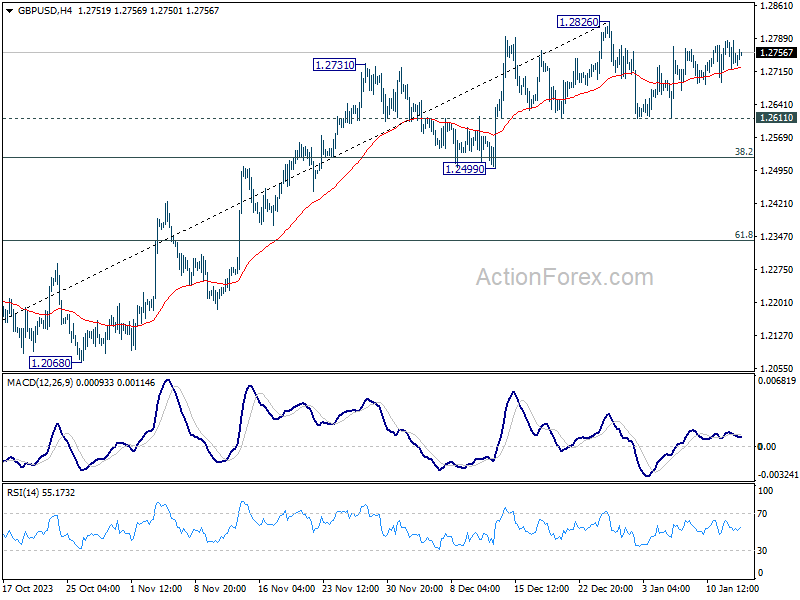
In the bigger picture, price actions from 1.3141 medium term top are seen as a corrective pattern to up trend from 1.0351 (2022 low). Rise from 1.2036 is seen as the second leg that's in progress. Upside should be limited by 1.3141 to bring the third leg of the pattern. Meanwhile, break of 1.2499 support will argue that the third leg has already started for 38.2% retracement of 1.0351 (2022 low) to 1.3141 at 1.2075 again.
Tranquil Opening to a Data-Heavy Week: Major Data from US, UK, Japan Featured
The forex markets commenced the week on a relatively quiet note, despite generally positive risk sentiment. This was highlighted by Japan's Nikkei, which continued its impressive performance, breaking above 35k mark to reach new three-decade highs. The robust momentum could continue until the eagerly awaited BoJ meeting later in the month, where fresh economic forecasts are set to be revealed.
On the other hand, stocks in China and Hong Kong, meanwhile, presented a picture of stability, seemingly unaffected by PBoC's decision to keep the key policy interest rate unchanged. This decision, while unexpected, did not cause significant ripples in the markets, possibly due to a wait-and-see approach among investors in these regions.
Currency markets, meanwhile, displayed a notable lack of dynamism. Major currency pairs and crosses were largely confined within the trading ranges established last Friday. Within this context, Sterling stands out as the month's strongest performer so far, a position followed by Dollar and then Euro. Conversely, Japanese Yen finds itself at the bottom of the performance ladder, with Australian and New Zealand Dollars also underperforming. Swiss Franc and Canadian Dollar are positioned in the middle.
Subdued trading atmosphere is likely to persist through the day, with stock and bond markets closed for Martin Luther King Day. Eurozone's industrial production and trade balance, alongside Canada's manufacturing sales figures, are the main featured which might not trigger much reactions. Nevertheless, the week promises to ramp up in volatility with a barrage of crucial economic data scheduled for release, spanning all major currencies. This includes impactful releases from US, UK, Canada, Australia, Japan, and China.
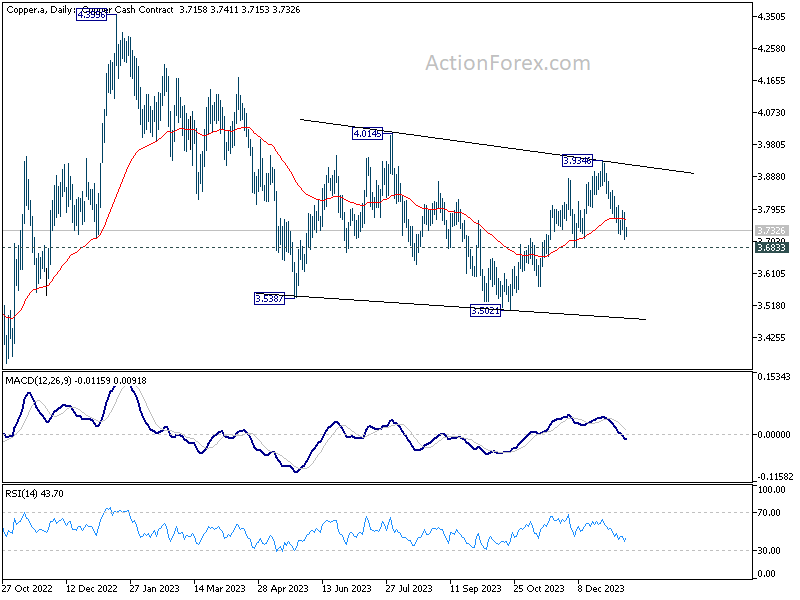
Technically, Copper is worth a watch in the coming days. As fall from 3.9346 extends, immediate focus is now on 3.6833 support. Decisive break there will confirm that whole rebound from 3.5021 has completed at 3.9436. Deeper fall would be seen back to retest 3.5021, even if it's just in sideway consolidation. This development, if realized, could drag AUD/USD through 0.6639 support.
In Asia, at the time of writing, Nikkei is up 0.89%. Hong Kong HSI is down -0.10%. China Shanghai SSE is up 0.19%> Singapore Strait Times is up 0.25%. Japan 10-year JGB yield is down -0.0285 at 0.562.
ECB's Lane: Wage increases as determinants for rate cut timing and extent
In an interview with Corriere della Sera, ECB Chief Economist Philip Lane acknowledged that the December inflation data was "broadly in line with our projections". He highlighted a "continued progress" in easing of core inflation, yet pointed out existing "headwinds to services inflation."
A critical point raised by Lane concerns wage growth, which he notes is still rising well above any kind of long-run equilibrium rate". ECB is expecting "high wage increases" to continue in 2024. "the scale of that will determine the timing and the scale of rate adjustment this year," he added.
Lane also touched upon ECB's reliance on data. He mentioned that while new wage data is received weekly, the "most complete dataset" from Eurostat's national accounts will only be available at the end of April.
This timeline suggests that key policy decisions, especially those pertaining to rate cuts, are likely to be heavily influenced by data available by June meeting.
Finally, Lane's projection of a "significant recovery" in the European economy this year is tempered with caution, as he acknowledges downside risks to their forecasts. The question of whether 2024 will see a recovery or a continuation of the stagnation experienced in 2023 remains a "big data question" for ECB.
Contrary to market expectations, PBoC maintains MLF rate but increases liquidity
Despite the anticipation of a rate cut to bolster the weakening economy, currently grappling with deflation for the past three months, PBoC held firm, keeping the rate on CNY 995B worth of one-year medium-term lending facility loans steady at 2.50%. This decision defied the general expectation of a 0.1% cut to 2.40%.
Opting not to alter the policy rate, the central bank instead chose to enhance liquidity in the banking system. This is seen from the net injection of CNY 216B of fresh funds, following the expiration of CNY 779B worth of MLF loans this month. Moreover, PBoC also infused CNY 89B yuan through seven-day reverse repos, maintaining a stable borrowing cost at 1.80%.
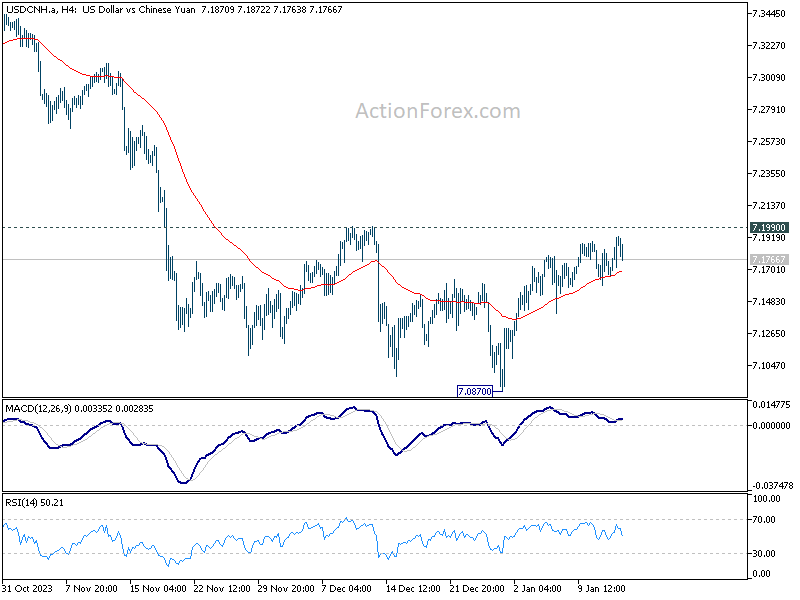
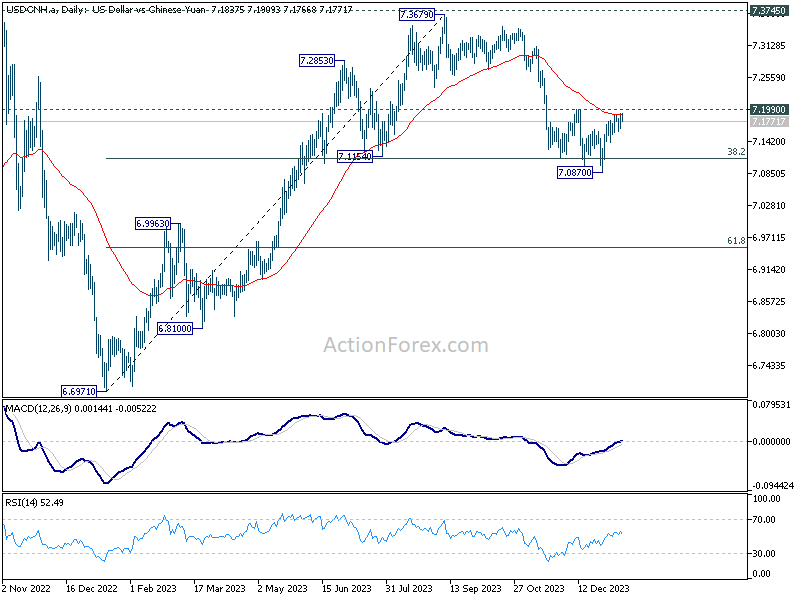
There is little reaction from USD/CNH to PBoC's announcement. Technically, USD/CNH is now at a critical juncture, pressing 55 D EMA, just ahead of 7.199 near term resistance. Near term outlook is staying bearish. Another decline and break of 7.0870 short term bottoming will resume the whole fall from 7.3679 to 61.8% retracement of 6.6971 to 7.3679 at 6.9533.
However, firm break of 7.1990 will argue that the fall from 7.3679 has completed and turn near term outlook bullish for retesting this high.
A hectic week Ahead: Gauging the path of global monetary easing through key economic data
A plethora of crucial economic data sets the stage for volatility in the currency markets this week. The dataset encompasses a wide range from inflation, retail sales, employment, to investor confidence across majorly traded currencies. The pivotal question at this juncture is identifying which data could potentially be the most influential in swaying currency movements.
The year 2024 has unmistakably been earmarked as a period of interest rate reductions, with the exception of BoJ. The primary uncertainties lie in pinpointing the exact timing of the initial rate cut and the subsequent velocity of monetary policy relaxation. Current market pricing appears quite assertive, predicting up to six rate cuts by both Fed and ECB, and five cuts each by BoE and the BoC. This aggressive market stance argues that traders are bracing for potential major economic or financial shocks globally this year.
In a scenario devoid of significant shocks, the response of various currencies to economic data releases is likely to hinge on the particular phase of the disinflation cycle each region is experiencing. For US, Eurozone, and Canada, where substantial disinflationary progress has been made, any data underscoring growth shortfalls could incite speculations of earlier and more rapid policy easing. Conversely, in UK and Australia, where inflation levels remain elevated, surprises on the higher end of inflation data could limit the scope for BoE and RBA in implementing rate cuts.
Hence, the spotlight could be marginally more focused on a few key data points: US retail sales, UK CPI and wage growth figures, Canadian retail sales, and Australian employment. Additionally, Japan's CPI and China's GDP might also contribute to market volatility. In terms of central bank activities, both Fed's Beige Book and meeting accounts from ECB are not anticipated to offer any significant revelations that are not already factored into market expectations.
Here are some highlights for the week:
- Monday: Eurozone industrial production, trade balance; Canada manufacturing sales, wholesale sales, BoC business outlook survey.
- Tuesday; New Zealand NZIER business confidence; Australia Westpac consumer confidence; Japan PPI; Germany CPI final, ZEW economic sentiment; UK employment; Canada CPI, housing starts; US Empire state manufacturing.
- Wednesday: China GDP, industrial production, retail sales, fixed asset investment; UK CPI, PPI; Eurozone CPI final; Canada IPPI and RMPI; US retail sales, import prices, industrial production,business inventories, NAHB housing index, Fed's Beige Book.
- Thursday: Japan machine orders; Australia employment; ECB meeting accounts; US jobless claims, housing starts and building permits, Philly Fed survey.
- Friday: New Zealand BusinessNZ manufacturing; Japan CPI, tertiary industry index; Germany PPI, UK retail sales; Swiss PPI; Canada retail sales; US U of Michigan consumer sentiment, existing home sales
EUR/USD Daily Outlook
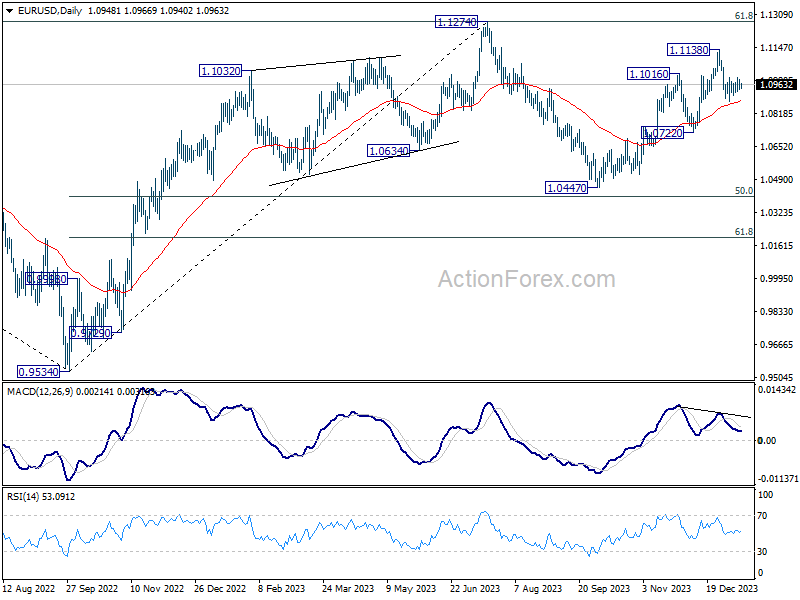
Daily Pivots: (S1) 1.0929; (P) 1.0958; (R1) 1.0980; More...
EUR/USD is still bounded in range trading and intraday bias remains neutral. Further fall is in favor as long as 1.0997 minor resistance intact. Break of 1.0876 will resume the fall from 1.1138 to 1.0722 support next. Nevertheless, firm break of 1.0997 will turn bias back to the upside for retesting 1.1138 high instead.
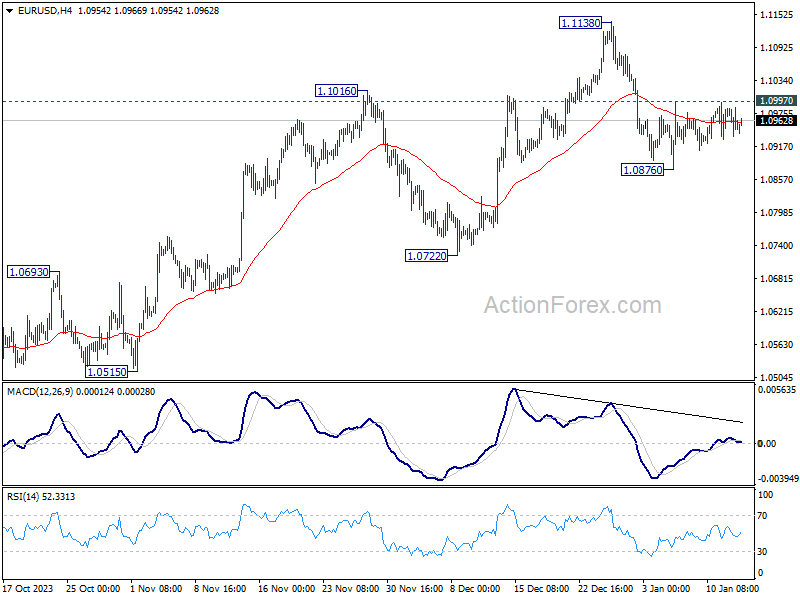
In the bigger picture, price actions from 1.1274 are viewed as a corrective pattern to rise from 0.9534 (2022 low). Rise from 1.0447 is seen as the second leg. While further rally could cannot be ruled out, upside should be limited by 1.1274 to bring the third leg of the pattern. Meanwhile, sustained break of 1.0722 support will argue that the third leg has already started for 1.0447 and below.
Economic Indicators Update
| GMT | Ccy | Events | Actual | Forecast | Previous | Revised |
|---|---|---|---|---|---|---|
| 23:50 | JPY | Money Supply M2+CD Y/Y Dec | 2.30% | 2.20% | 2.30% | |
| 00:00 | AUD | TD Securities Inflation M/M Dec | 1.00% | 0.30% | ||
| 06:00 | JPY | Machine Tool Orders Y/Y Dec | -15.50% | -13.60% | ||
| 10:00 | EUR | Eurozone Industrial Production M/M Nov | -0.30% | -0.70% | ||
| 10:00 | EUR | Eurozone Trade Balance (EUR) Nov | 11.2B | 10.9B | ||
| 13:30 | CAD | Manufacturing Sales M/M Nov | 0.90% |
EUR/USD Daily Outlook
Daily Pivots: (S1) 1.0929; (P) 1.0958; (R1) 1.0980; More...
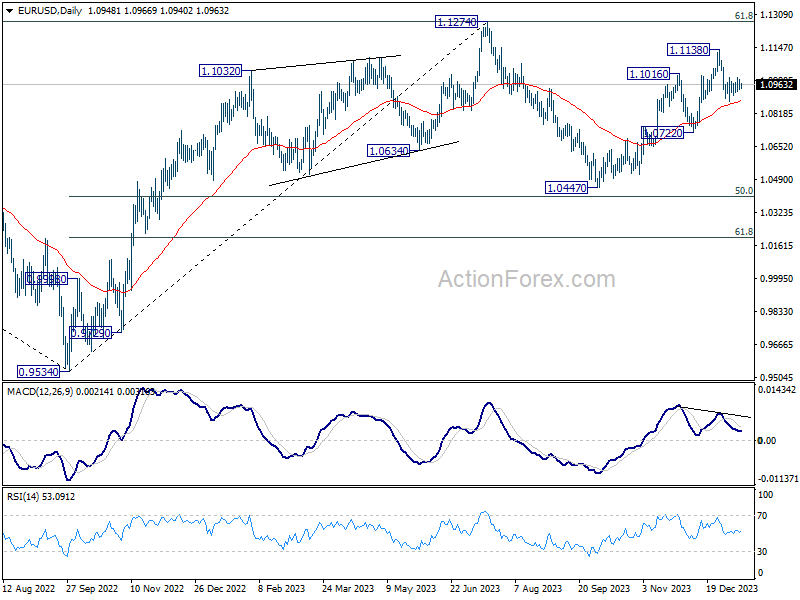
EUR/USD is still bounded in range trading and intraday bias remains neutral. Further fall is in favor as long as 1.0997 minor resistance intact. Break of 1.0876 will resume the fall from 1.1138 to 1.0722 support next. Nevertheless, firm break of 1.0997 will turn bias back to the upside for retesting 1.1138 high instead.
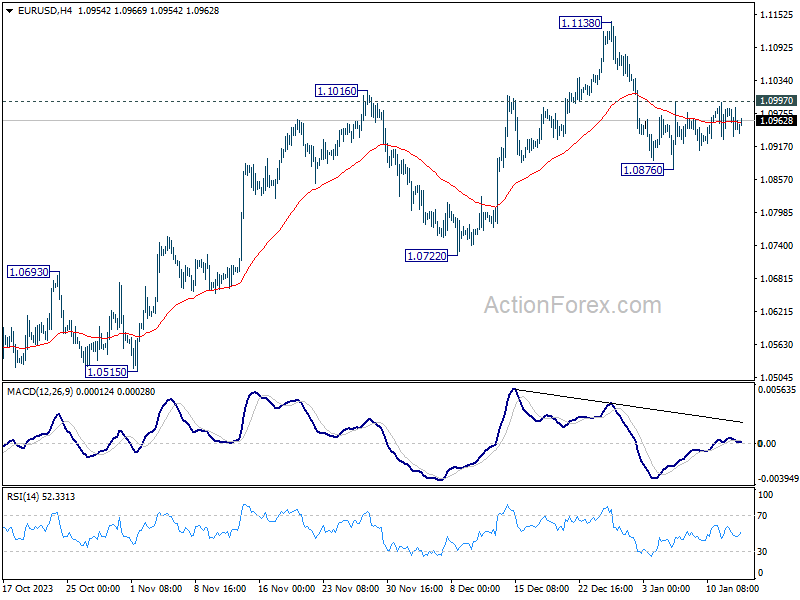
In the bigger picture, price actions from 1.1274 are viewed as a corrective pattern to rise from 0.9534 (2022 low). Rise from 1.0447 is seen as the second leg. While further rally could cannot be ruled out, upside should be limited by 1.1274 to bring the third leg of the pattern. Meanwhile, sustained break of 1.0722 support will argue that the third leg has already started for 1.0447 and below.
Technical Outlook and Review
DXY:
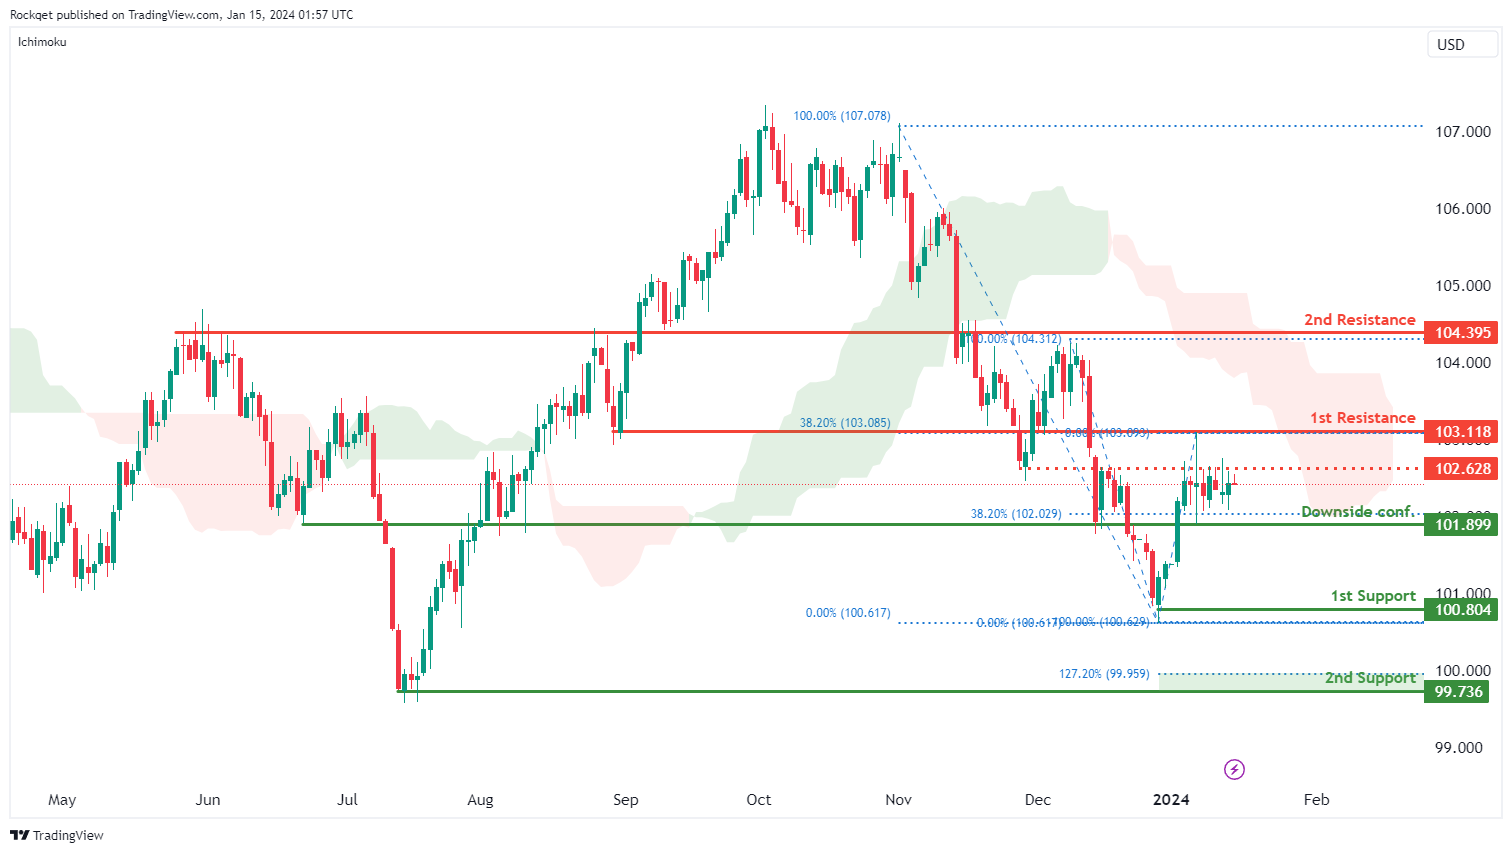
The DXY (US Dollar Index) chart currently exhibits a bearish overall momentum, indicating weakness in the US Dollar. This bearish momentum is further supported by the fact that the price is below the bearish Ichimoku cloud, which is a significant technical indicator.
There is a potential for a bearish continuation towards the 1st support level, which is located at 100.80. This level is identified as a swing low support, and it may serve as a key area where buying interest could emerge, temporarily supporting the US Dollar.
Additionally, there is a 2nd support at 100.73, categorized as an overlap support. This reinforces its significance as a potential support zone, further adding to its importance.
On the resistance side, the 1st resistance at 103.11 is marked as an overlap resistance and aligns with the 38.20% Fibonacci Retracement level. Fibonacci retracement levels are often closely watched by traders, making this resistance level noteworthy.
The 2nd resistance at 104.39 is also categorized as an overlap resistance, potentially acting as a barrier to any further upward price movement.
An intermediate resistance level at 102.62 is identified as an overlap resistance, contributing to the potential significance of this price point.
EUR/USD:
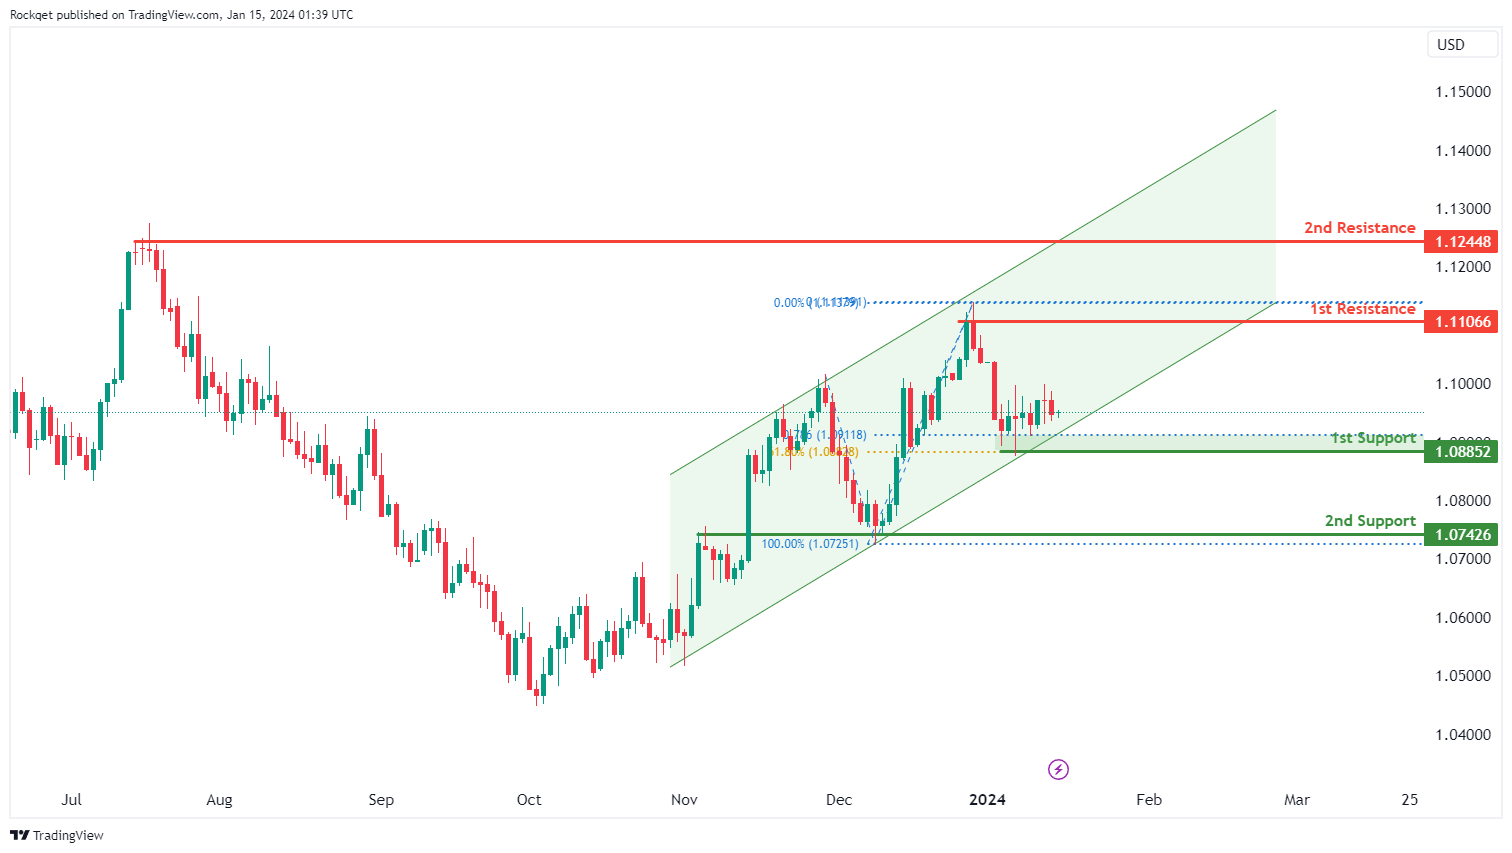
The EUR/USD chart currently has a bullish overall momentum, indicating strength in the Euro relative to the US Dollar. This momentum is supported by the fact that price is within a bullish ascending channel, which is a pattern often associated with upward price movement.
There’s a potential for a bullish continuation towards the 1st resistance level, which is at 1.1106. This level is identified as a swing high resistance, and swing highs often act as points of reversal or resistance in price movement.
The 1st support at 1.0885 is significant for several reasons. It is a swing low support, indicating a level where buying interest may emerge. Additionally, it aligns with the 61.80% Fibonacci Retracement level, adding to its significance. Fibonacci retracement levels are commonly used by traders to identify potential support and resistance areas.
There is also a 2nd support at 1.0742, categorized as an overlap support. This level further reinforces its significance as a potential support area.
On the resistance side, the 2nd resistance at 1.1244 is identified as multi-swing high resistance. These levels often present challenges for further upward price movement.
EUR/JPY:
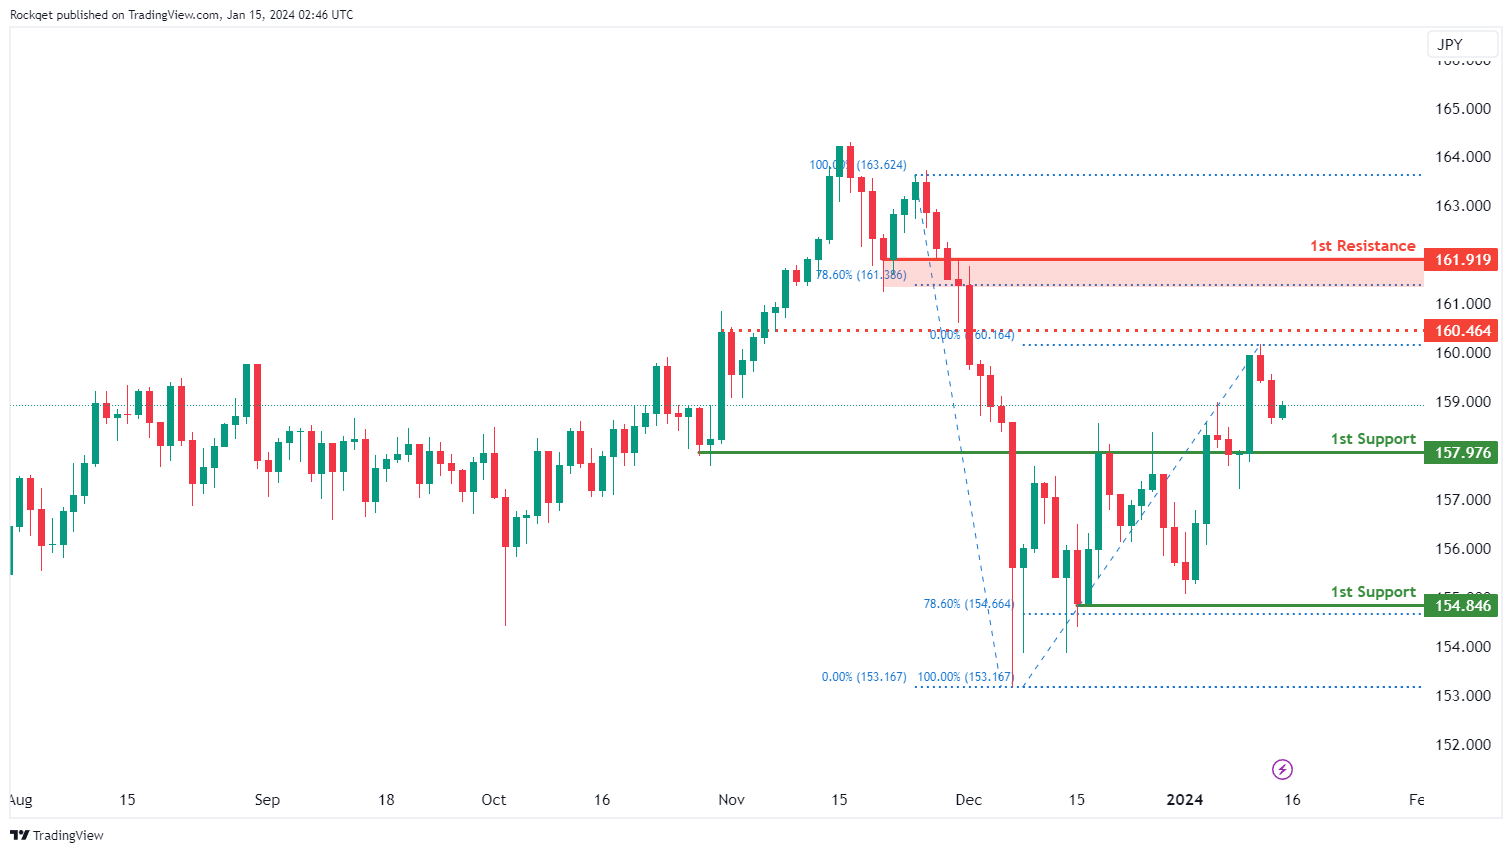
The EUR/JPY chart currently exhibits a bullish overall momentum, indicating strength in the Euro relative to the Japanese Yen. This bullish momentum is supported by the potential for a bullish continuation towards the 1st resistance level.
The 1st support at 157.97 is identified as an overlap support, suggesting a potential area where buying interest may emerge and provide temporary support for EUR/JPY.
The 2nd support at 154.84 is categorized as a swing low support, further reinforcing its significance as a potential support zone.
On the resistance side, 1st resistance at 161.91 is marked as a pullback resistance and aligns with the 78.60% Fibonacci Retracement level. This level suggests a potential area where selling pressure or resistance may be encountered, adding to its significance.
Intermediate resistance at 160.46 is also categorized as a pullback resistance, reinforcing the potential resistance zone.
EUR/GBP:
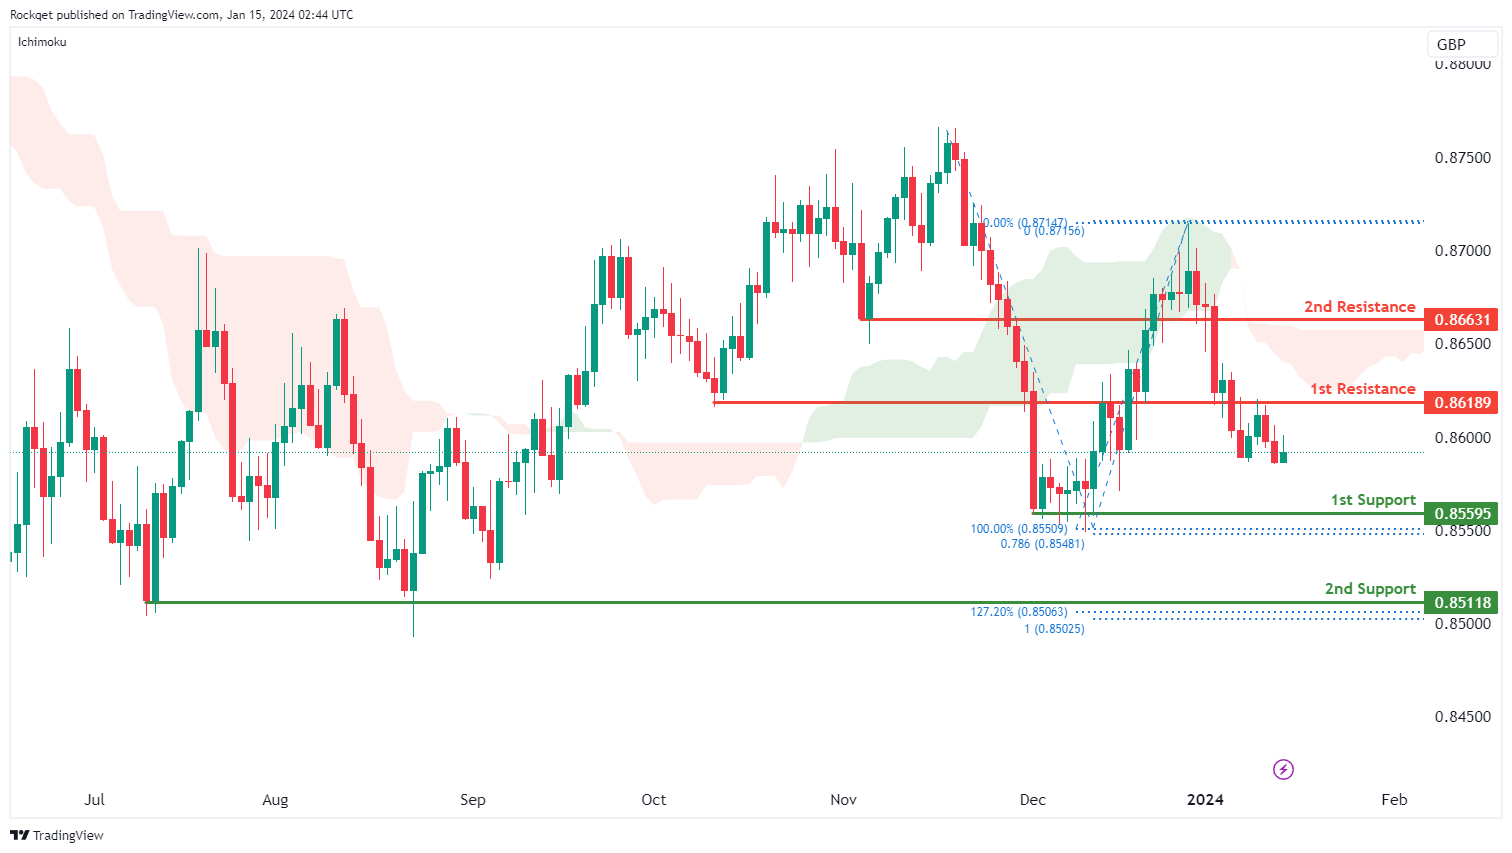
The EUR/GBP chart currently exhibits a bearish overall momentum, indicating weakness in the Euro relative to the British Pound. This bearish momentum is supported by the fact that the price is below the bearish Ichimoku cloud, signifying a potentially bearish trend continuation.
The 1st support at 0.8559 is identified as multi-swing low support, and it aligns with the 78.60% Fibonacci Projection level. This level suggests a potential area where buying interest may emerge, providing temporary support for EUR/GBP.
Additionally, the 2nd support at 0.8511 is categorized as multi-swing low support, and it reinforces its significance with the presence of the 127.20% Fibonacci Extension and 100% Fibonacci Projection, indicating Fibonacci confluence.
On the resistance side, 1st resistance at 0.8618 is marked as an overlap resistance, and it could act as a barrier for any potential upward price movement.
2nd resistance at 0.8663 is categorized as pullback resistance, further strengthening its role as a potential resistance level.
GBP/USD:
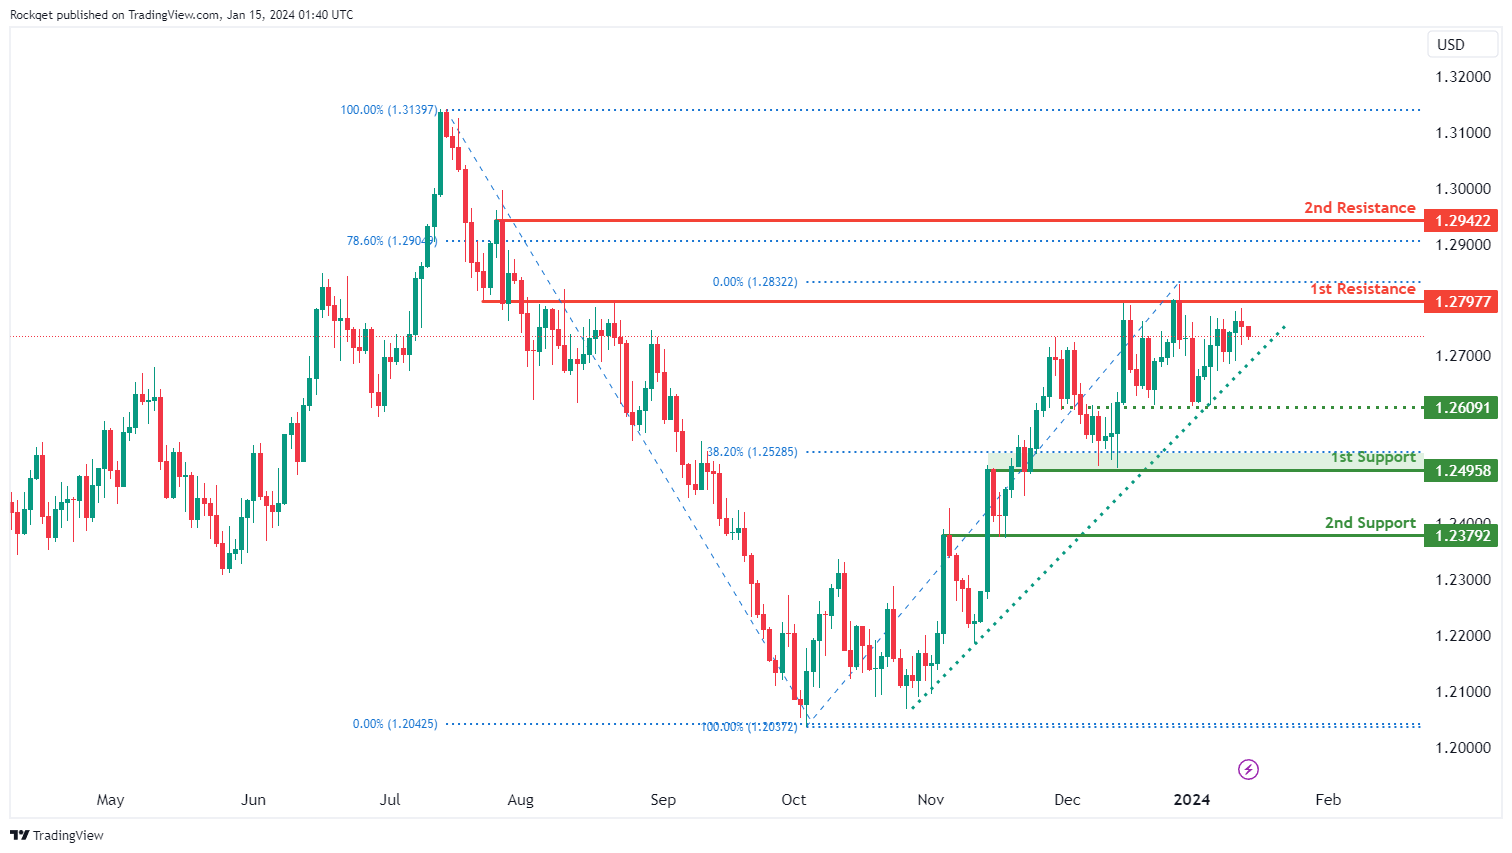
The GBP/USD chart currently exhibits a bullish overall momentum, indicating strength in the British Pound relative to the US Dollar. This momentum is supported by the fact that price is within a bullish ascending channel, a pattern often associated with upward price movement.
There’s a potential for a bullish continuation towards the 1st resistance level at 1.2797. This level is identified as an overlap resistance, suggesting it has acted as a significant price barrier in the past.
The 1st support at 1.2495 is considered a strong support level for several reasons. It is an overlap support, meaning it aligns with previous price levels where buying interest emerged. Additionally, it coincides with the 38.20% Fibonacci Retracement level, adding to its significance. Fibonacci retracement levels are commonly used by traders to identify potential support and resistance zones.
There is also a 2nd support at 1.2379, categorized as an overlap support, which further reinforces its significance as a potential support area.
On the resistance side, the 2nd resistance at 1.2942 is identified as a swing high resistance. Swing highs are often points of reversal or resistance in price movement. Additionally, this level aligns with the 78.60% Fibonacci Retracement, indicating potential Fibonacci confluence.
GBP/JPY:
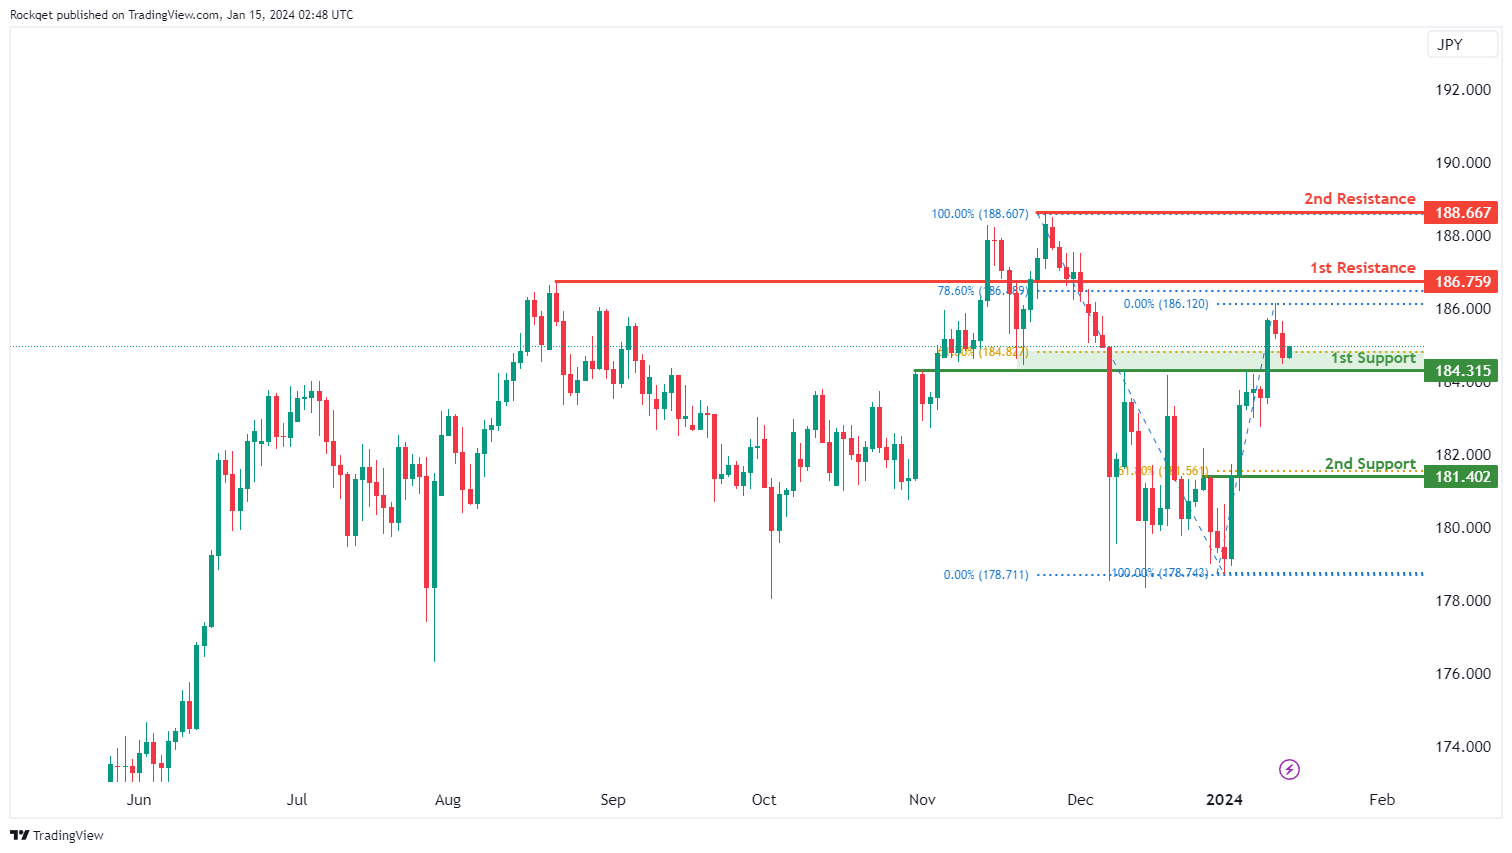
The GBP/JPY chart currently exhibits a bullish bias, indicating strength in the British Pound against the Japanese Yen. This bullish sentiment is supported by the fact that the price has the potential to rebound from the 1st support level and make its way towards the 1st resistance level.
The 1st support at 184.31 is considered a reliable support level as it aligns with the concept of a pullback support, coinciding with the 61.80% Fibonacci Retracement. This level suggests the possibility of a temporary zone where buying interest may emerge, providing a brief period of support for GBP/JPY.
Additionally, the 2nd support at 181.40 shares the characteristics of a pullback support and further strengthens its significance by aligning with the 61.80% Fibonacci Retracement.
On the resistance side, the 1st resistance level at 186.75 is identified as a pullback resistance, closely associated with the 78.60% Fibonacci Retracement. This level could potentially act as a substantial barrier to any potential upward price movement.
Furthermore, the 2nd resistance level at 188.66 is categorized as a swing high resistance, highlighting its potential role as a significant hurdle for GBP/JPY in the future.”
USD/CHF:
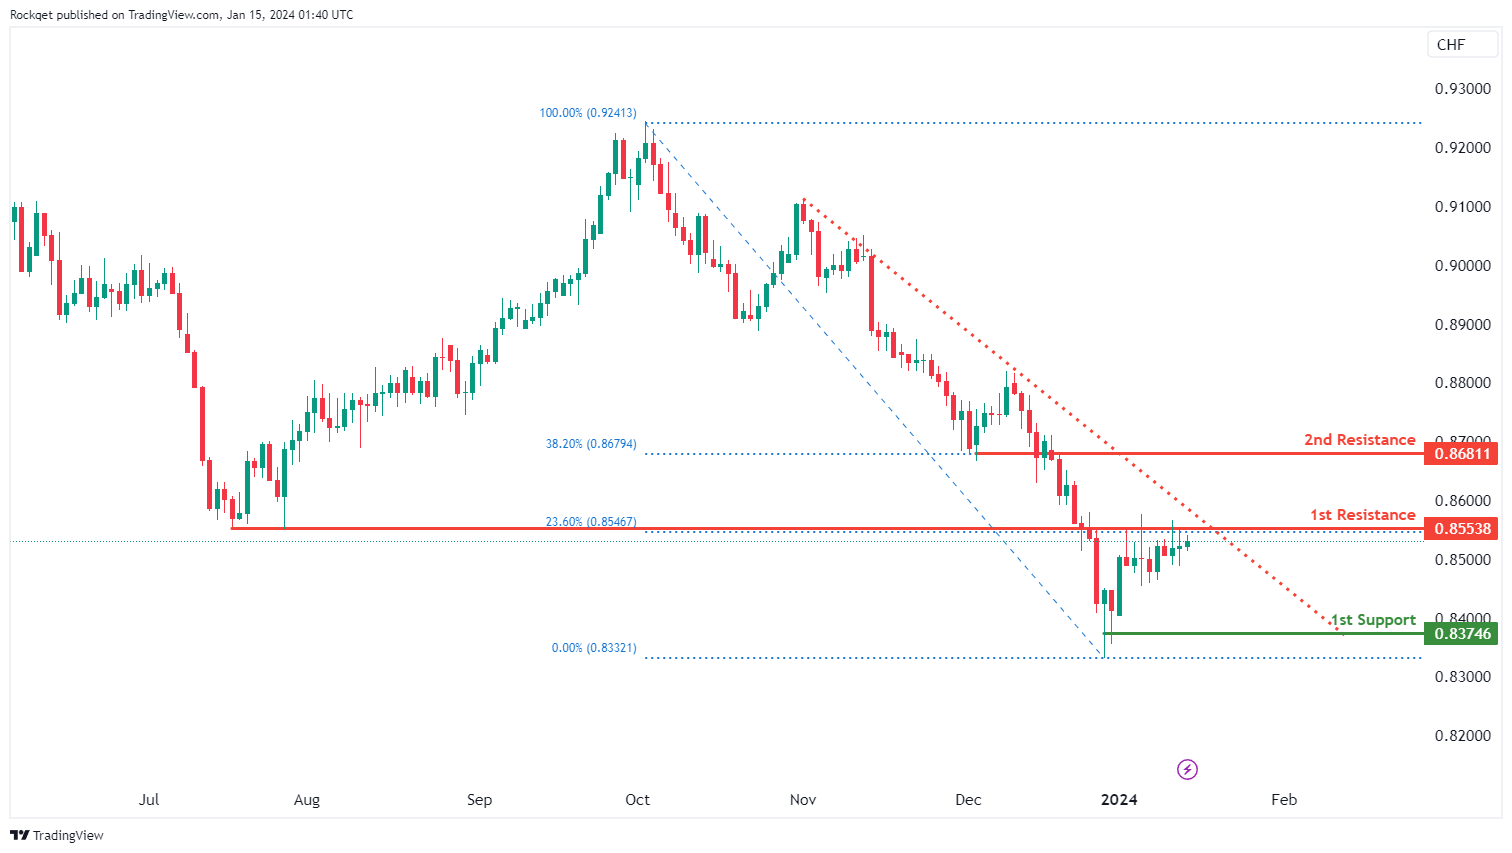
The USD/CHF chart currently has a bearish overall momentum, indicating weakness in the US Dollar relative to the Swiss Franc. This bearish momentum is supported by the fact that price is below a major descending trend line, suggesting that further bearish pressure may be on the horizon.
In the short term, there’s potential for a rise towards the 1st resistance level at 0.8553. This level is identified as an overlap resistance and aligns with the 23.60% Fibonacci Retracement, indicating potential resistance based on both historical price action and Fibonacci analysis.
The 2nd resistance at 0.8681 is categorized as a pullback resistance, further reinforcing its significance as a potential barrier for the price. This level coincides with the 38.20% Fibonacci Retracement, adding to its importance as a potential reversal point.
On the support side, the 1st support at 0.8374 is considered a strong support level as it is a swing low support. Swing lows often act as areas where buying interest can emerge, providing temporary support for the currency pair.
USD/JPY:
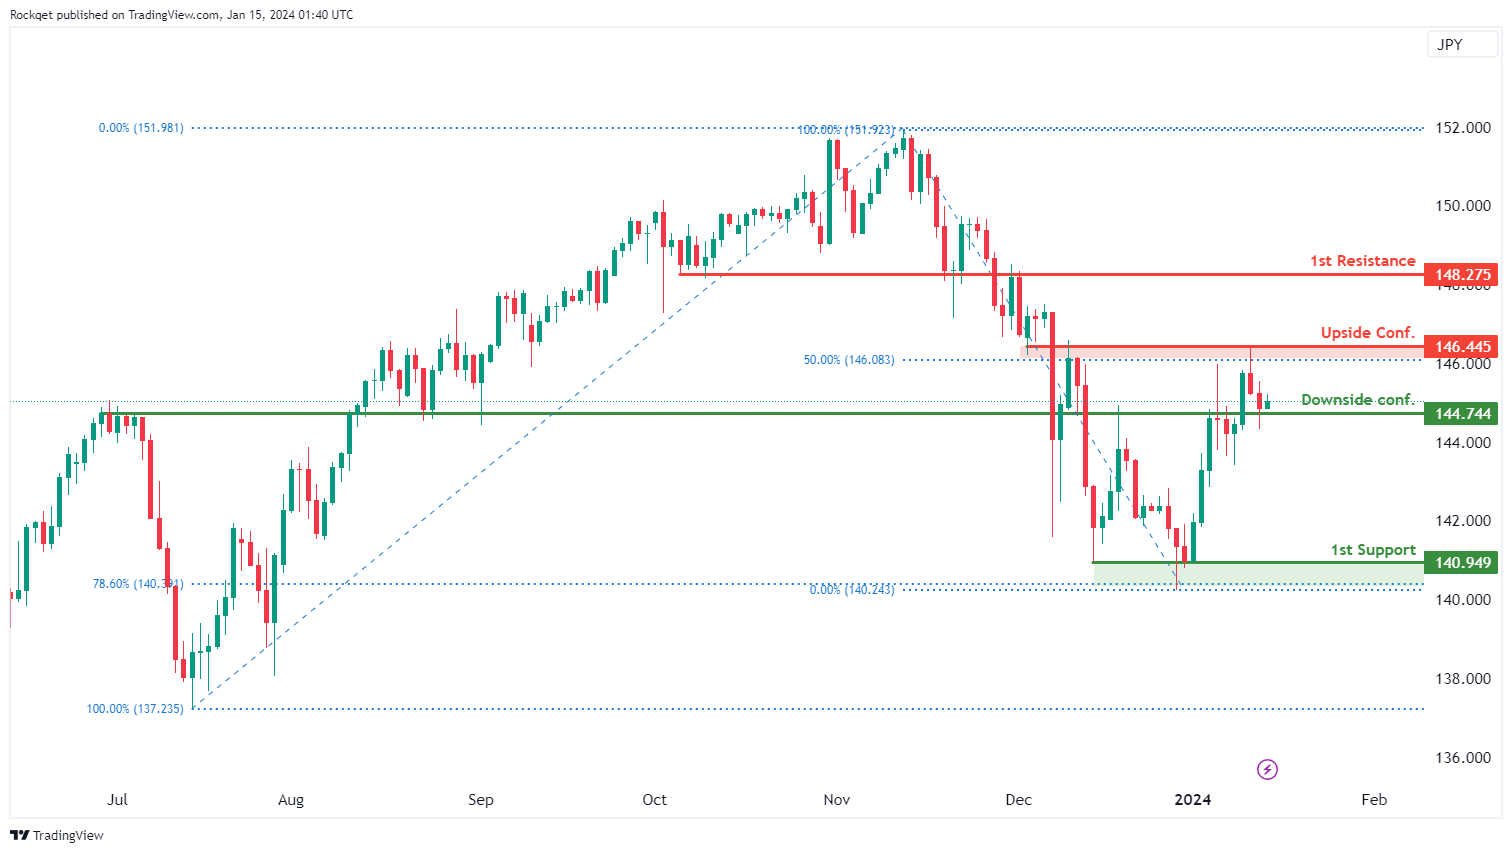
The USD/JPY chart currently exhibits a bearish overall momentum, suggesting weakness in the US Dollar relative to the Japanese Yen. This bearish momentum indicates the potential for a continuation of the downtrend.
The 1st support at 140.94 is significant as it is a multi-swing low support. This level has historically acted as a point where buying interest has emerged, making it a potential area for a temporary pause or reversal in the downtrend.
For downside confirmation, the level at 144.74 is identified as an overlap support. This level aligns with historical price action, adding to its significance as a potential support area.
On the upside, the level at 146.44 is categorized as an overlap resistance. This level also coincides with the 50% Fibonacci Retracement level, indicating potential resistance based on both historical price action and Fibonacci analysis.
The 1st resistance at 148.27 is marked as an overlap resistance, suggesting it could act as a barrier for any potential upward movement.
USD/CAD:
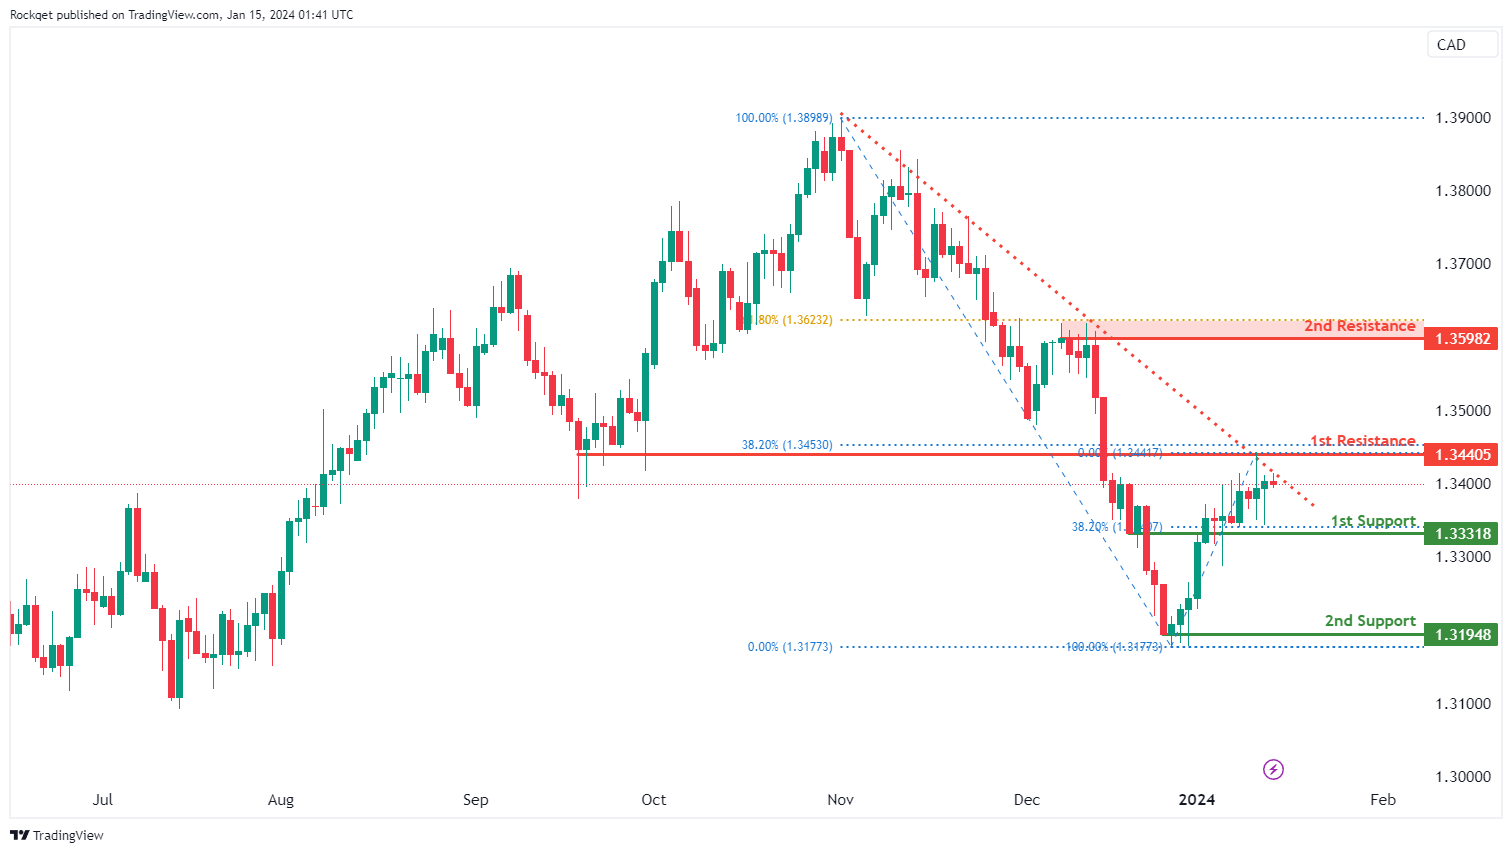
The USD/CAD chart currently shows a bearish overall momentum, indicating a downward trend in the US Dollar relative to the Canadian Dollar. This bearish momentum is supported by the fact that price is within a bearish descending channel, suggesting a potential for further downside movement.
Price could potentially make a bearish continuation towards the 1st support level, which is identified at 1.3331. This level is significant as it coincides with an overlap support and the 38.20% Fibonacci Retracement level, indicating a potential area where buying interest may emerge and provide temporary support for USD/CAD.
The 2nd support at 1.3194 is categorized as a multi-swing low support, further reinforcing its significance as a potential support zone in the bearish scenario.
On the resistance side, 1st resistance at 1.3440 is marked as an overlap resistance and aligns with the 38.20% Fibonacci Retracement level. This level suggests a potential area where selling pressure or resistance may be encountered.
2nd resistance at 1.3598 is identified as an overlap resistance and coincides with the 61.80% Fibonacci Retracement level, adding to its importance as a potential barrier for the price.
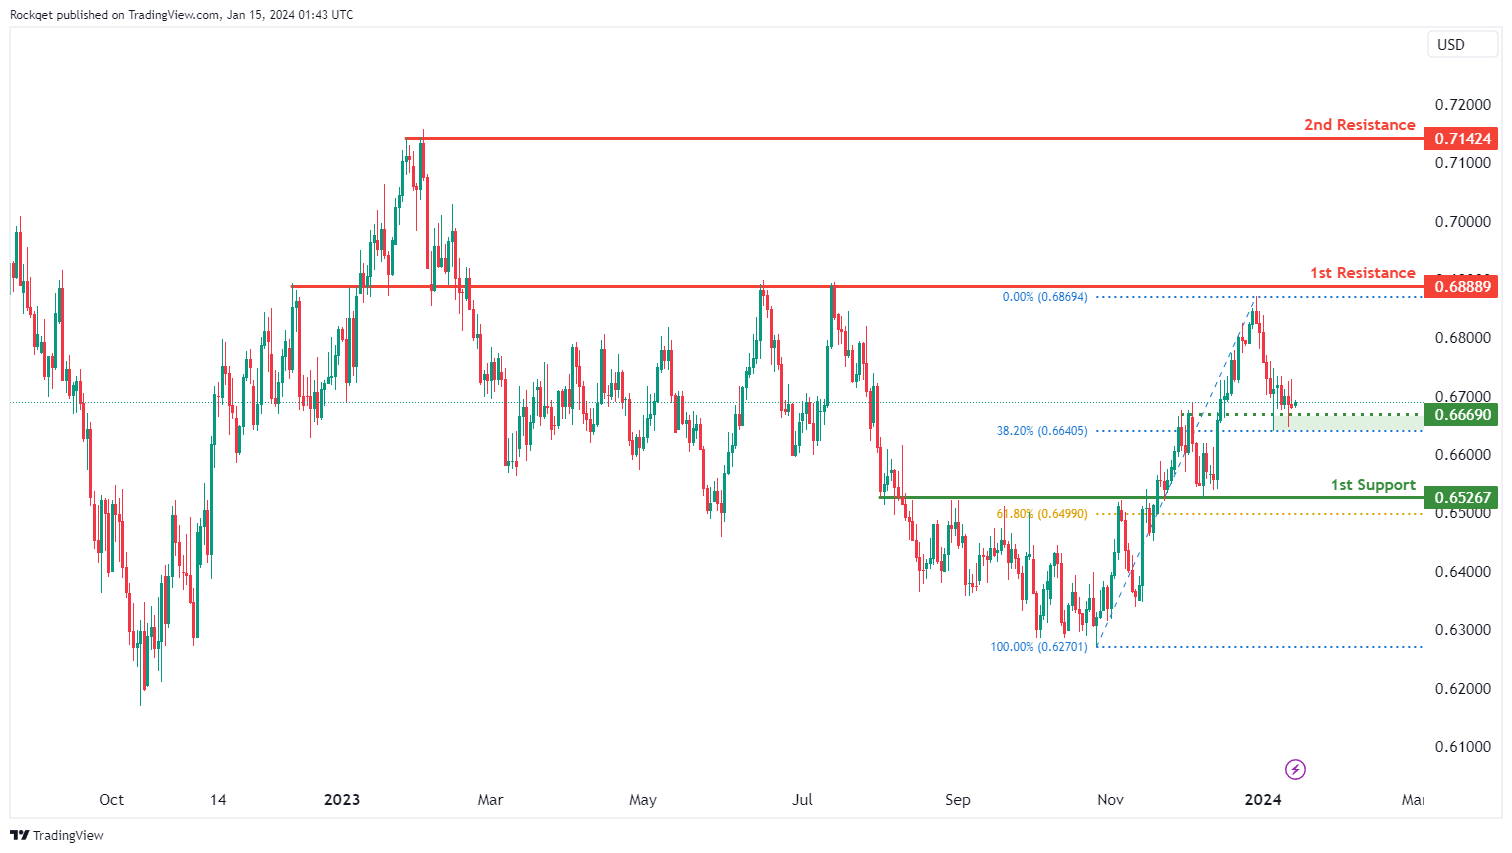
AUD/USD:
The AUD/USD chart currently exhibits a bearish overall momentum, indicating a downward trend in the Australian Dollar relative to the US Dollar. This bearish momentum suggests the potential for a bearish continuation towards the 1st support level.
Intermediate support at 0.6669 is identified as an overlap support and coincides with the 38.20% Fibonacci Retracement level. This level holds significance as it indicates a potential area where buying interest may emerge, providing temporary support for AUD/USD.
1st support at 0.6526 is marked as an overlap support and aligns with the 61.80% Fibonacci Retracement level, further reinforcing its importance as a potential support zone.
On the resistance side, 1st resistance at 0.6888 is categorized as an overlap resistance, suggesting a potential area where selling pressure or resistance may be encountered.
2nd resistance at 0.7142 is identified as a swing high resistance, indicating a significant level where price reversals or strong resistance might occur.
NZD/USD
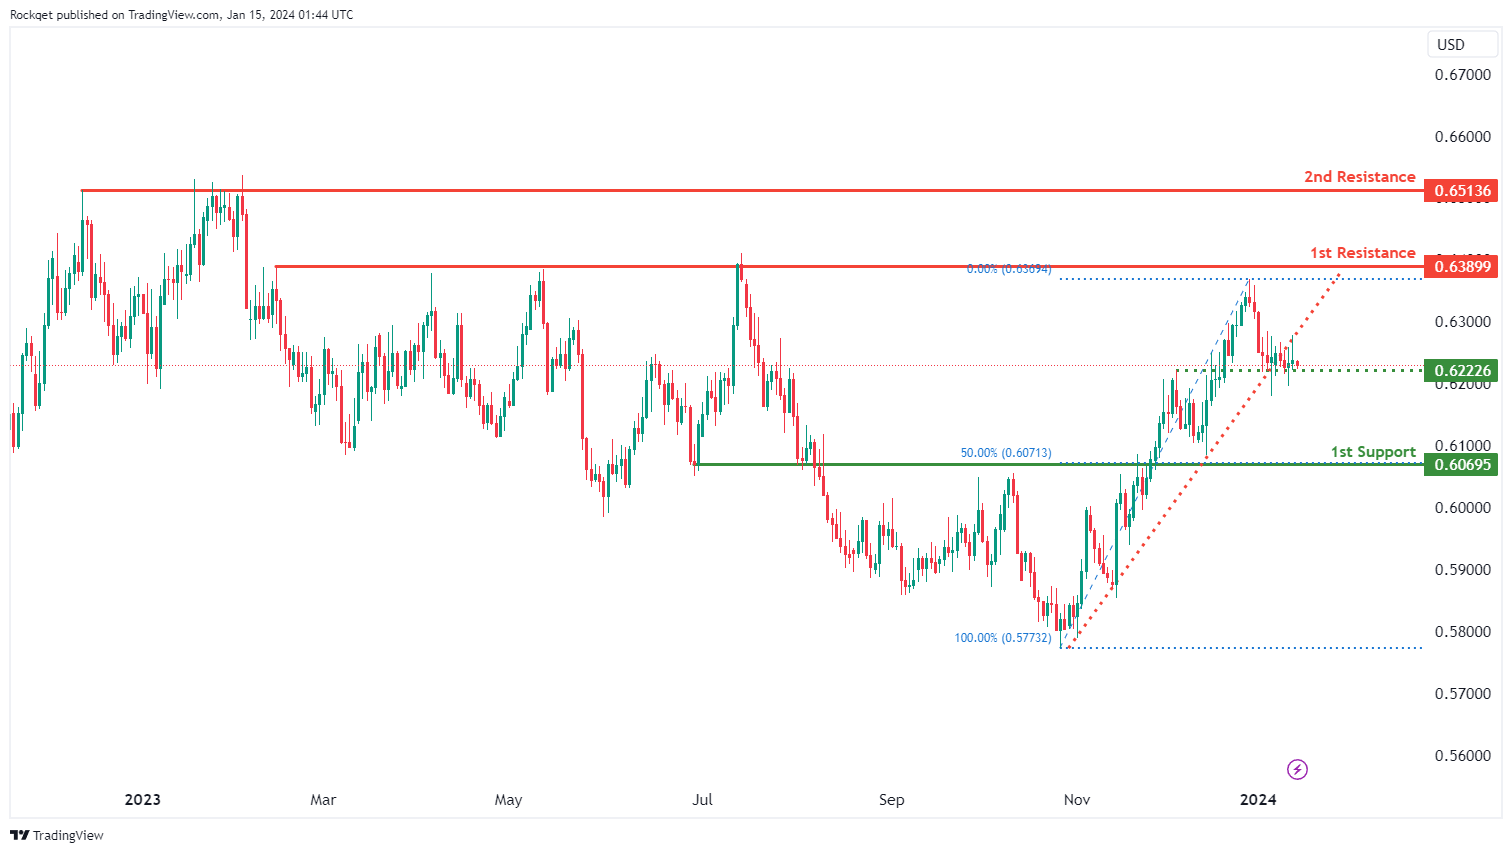
The NZD/USD chart currently exhibits a bearish overall momentum, indicating a downward trend in the New Zealand Dollar relative to the US Dollar. This bearish momentum is driven by the fact that the price has broken below an ascending support line, triggering the potential for a bearish move.
Intermediate support at 0.6222 is considered significant as it has acted as a multi-swing low support in the past. Traders may look to this level for potential buying interest and temporary support.
1st support at 0.6069 is marked as an overlap support and coincides with the 50% Fibonacci Retracement level. It holds significance as it suggests a potential area where buying pressure may emerge.
On the resistance side, 1st resistance at 0.6389 is identified as a multi-swing high resistance, indicating the potential for price reversals or resistance at this level.
2nd resistance at 0.6513 is also categorized as a multi-swing high resistance, further reinforcing the potential resistance zone for the price.
DJ30:
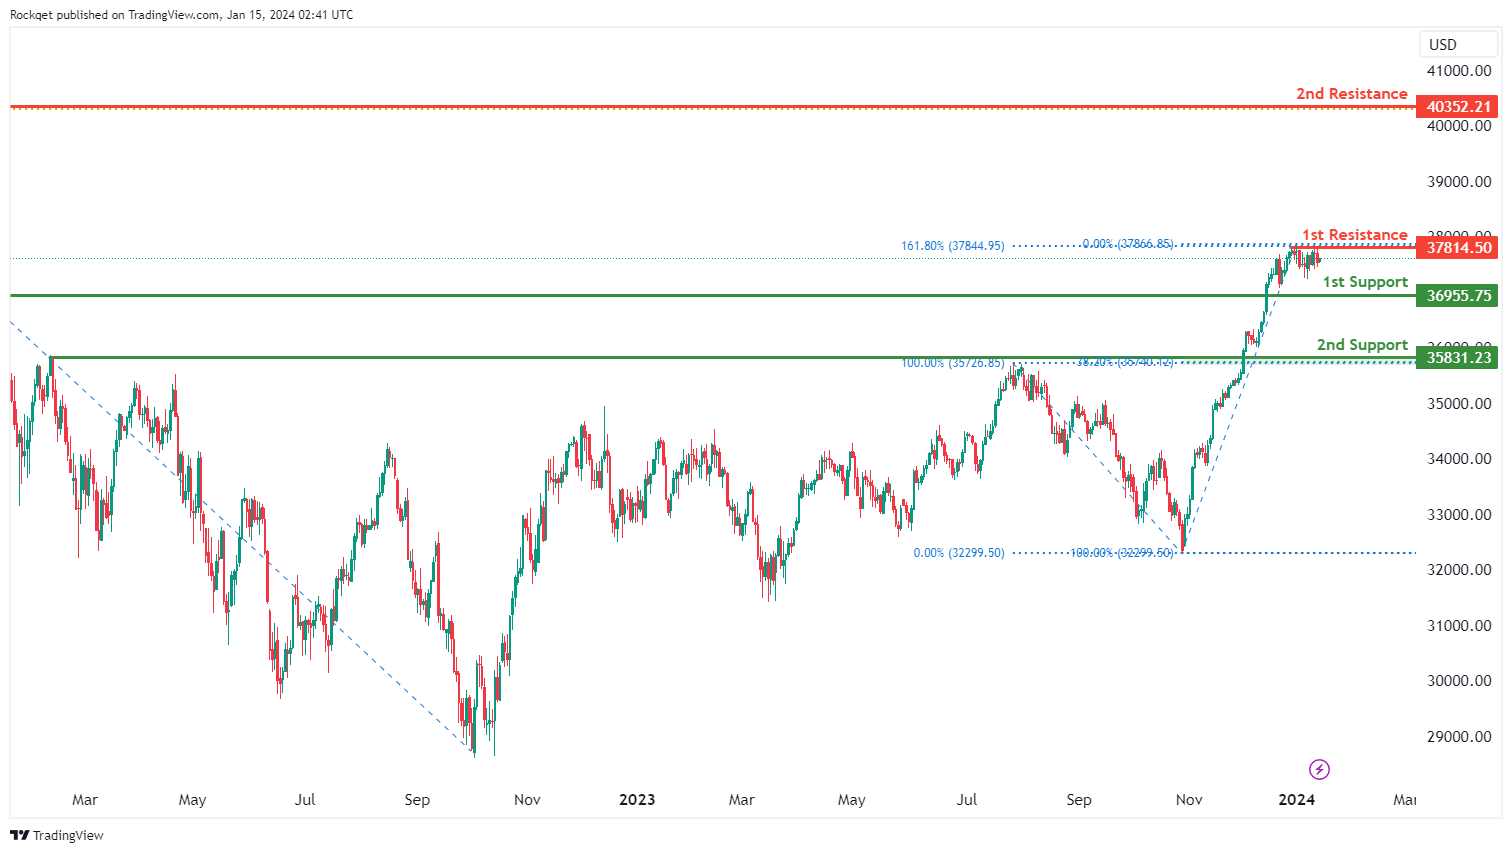
The DJ30 chart currently displays an overall bullish momentum. In this context, there is a potential The DJ30 chart currently exhibits a neutral overall momentum, indicating a lack of a clear bullish or bearish bias in the market. Given this neutral stance, it is expected that the price may fluctuate within a range defined by the 1st support and 1st resistance levels.
The 1st support level is identified at 36955.75, and it is considered a notable support level due to its characteristics as a pullback support. This level suggests a potential area where buyers may step in, offering support to the DJ30.
Similarly, the 2nd support level at 35831.23 also serves as a pullback support, reinforcing its significance as a potential zone for price support in the neutral market conditions.
On the resistance side, the 1st resistance level is positioned at 37814.50. This level holds significance as a multi-swing high resistance and is further strengthened by its alignment with the 161.80% Fibonacci Extension, indicating its potential to act as a strong barrier to upward price movement.
Furthermore, the 2nd resistance level at 40352.21 is categorized as a significant resistance level due to its association with the 61.80% Fibonacci Projection.
GER40:
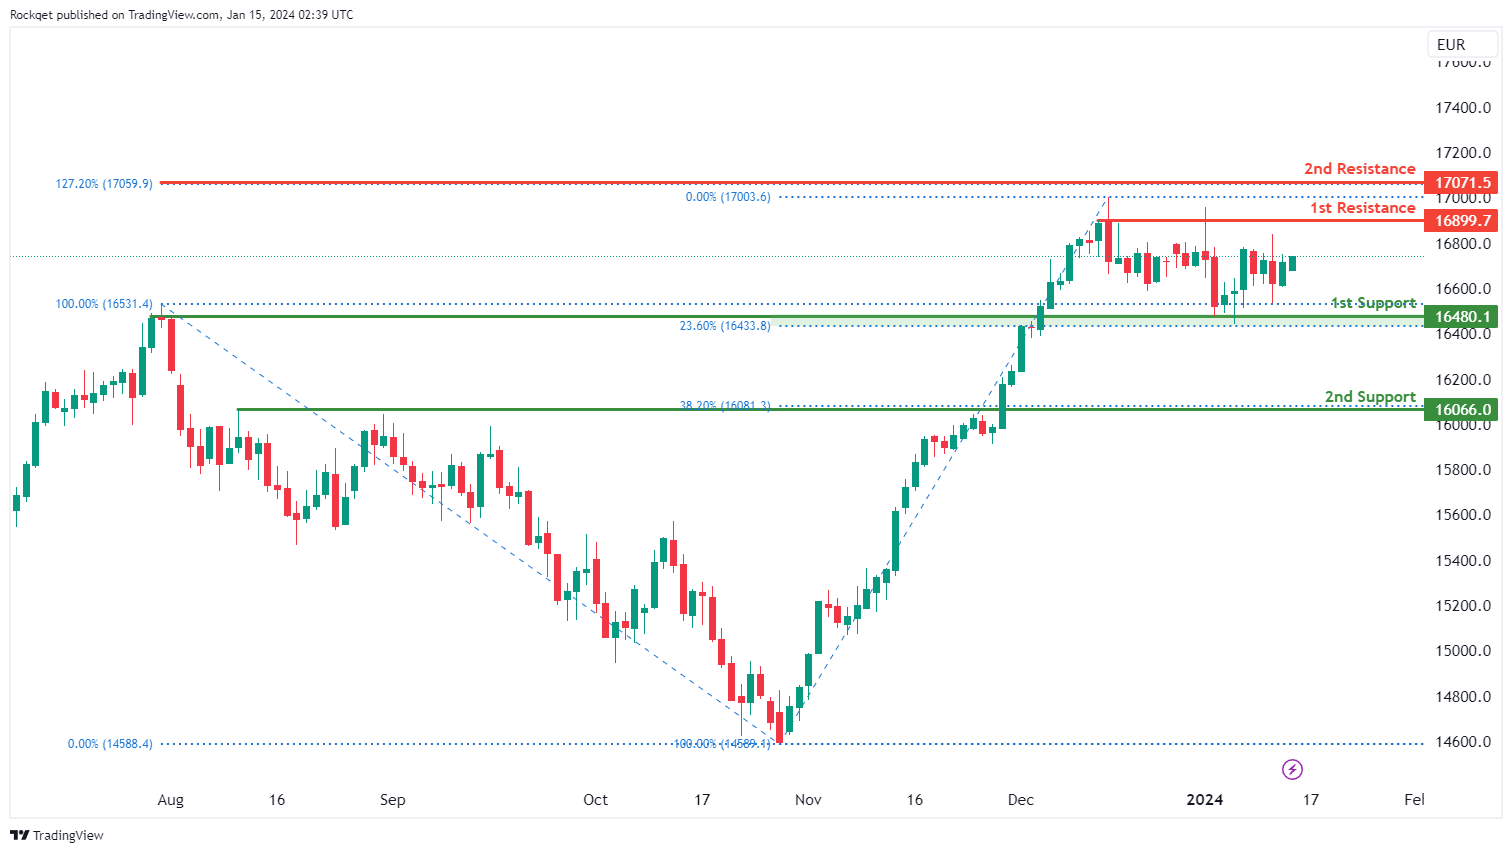
The GER40 chart currently exhibits a neutral overall momentum, suggesting a lack of a clear trend direction. Several factors contribute to this neutral momentum, and as a result, the price could potentially make fluctuations between the 1st resistance and 1st support levels.
The 1st support at 16480.10 is considered favorable due to its identification as an overlap support and coincides with the 23.60% Fibonacci Retracement, suggesting historical significance as a level where buying interest has previously emerged.
The 2nd support at 16066.00 is recognized as a pullback support and aligns with the 38.20% Fibonacci Retracement, adding confluence to its potential as a support level.
On the resistance side, the 1st resistance at 16899.70 is identified as a swing high resistance. The 2nd resistance at 17071.50 is noteworthy for the presence of the 127.20% Fibonacci Extension, adding significance to this potential resistance level.
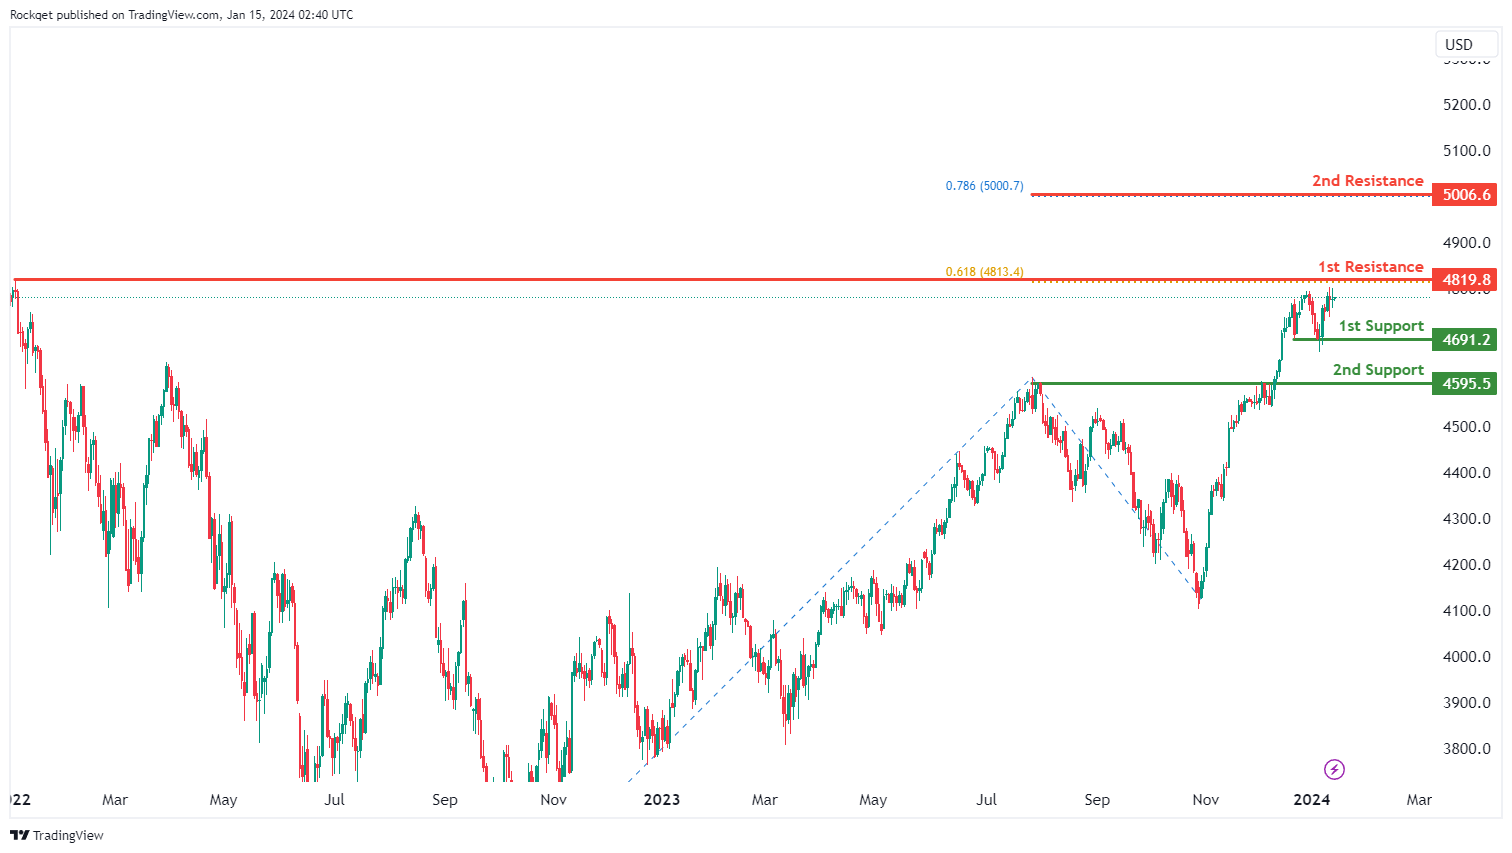
US500:
The US500 chart currently demonstrates a bullish overall momentum, indicating an upward trend. There is a potential scenario for a bullish continuation towards the 1st resistance.
The 1st support at 4691.2 is considered advantageous as a pullback support, suggesting historical significance as a level where buying interest has previously emerged.
The 2nd support at 4595.5 is recognized as another pullback support, adding to its potential as a support level.
On the resistance side, the 1st resistance at 4819.8 is identified as a swing high resistance and aligns with the 61.80% Fibonacci Projection, potentially acting as a barrier where selling interest could materialize.
The 2nd resistance at 5006.6 is noteworthy for the presence of the 78.60% Fibonacci Projection, adding significance to this potential resistance level.
BTC/USD:
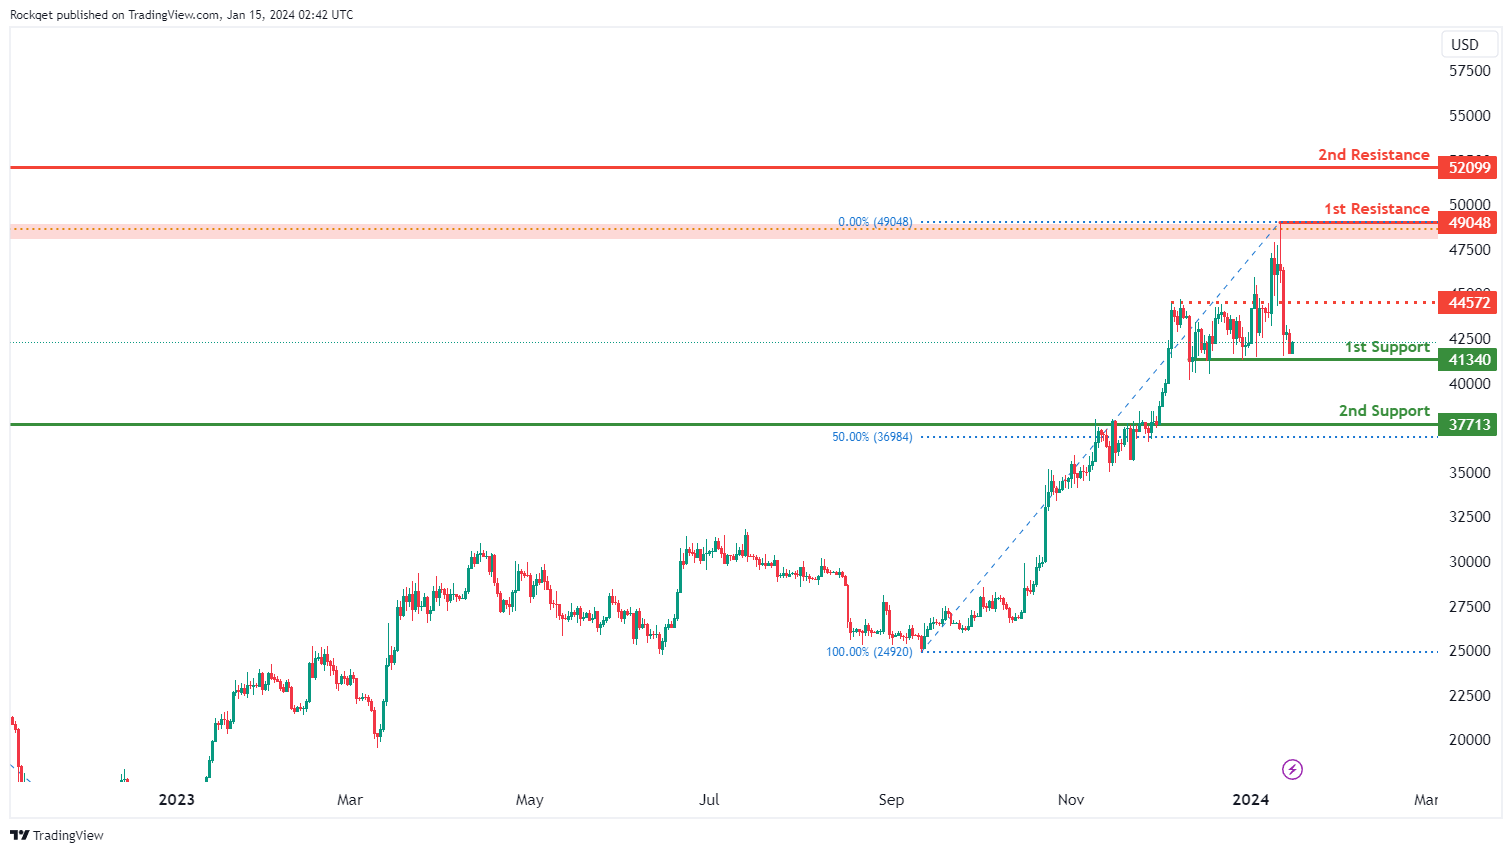
The BTC/USD chart currently indicates a bearish overall momentum, suggesting a potential downward trend. There is a scenario in which the price could make a bearish reaction off the 1st resistance and drop towards the 1st support.
The 1st support at 41340 is considered favorable as it is identified as a multi-swing low support, implying historical significance as a level where buying interest has previously emerged.
The 2nd support at 37713 is recognized as a pullback support, adding to its potential as a support level.
On the resistance side, the intermediate resistance at 44572 is identified as a pullback resistance, suggesting a level where selling interest could materialize.
The 1st resistance at 49048 is considered significant as it aligns with a swing high resistance, potentially acting as a barrier. The 2nd resistance at 52099 is also recognized as a swing high resistance.
ETH/USD:
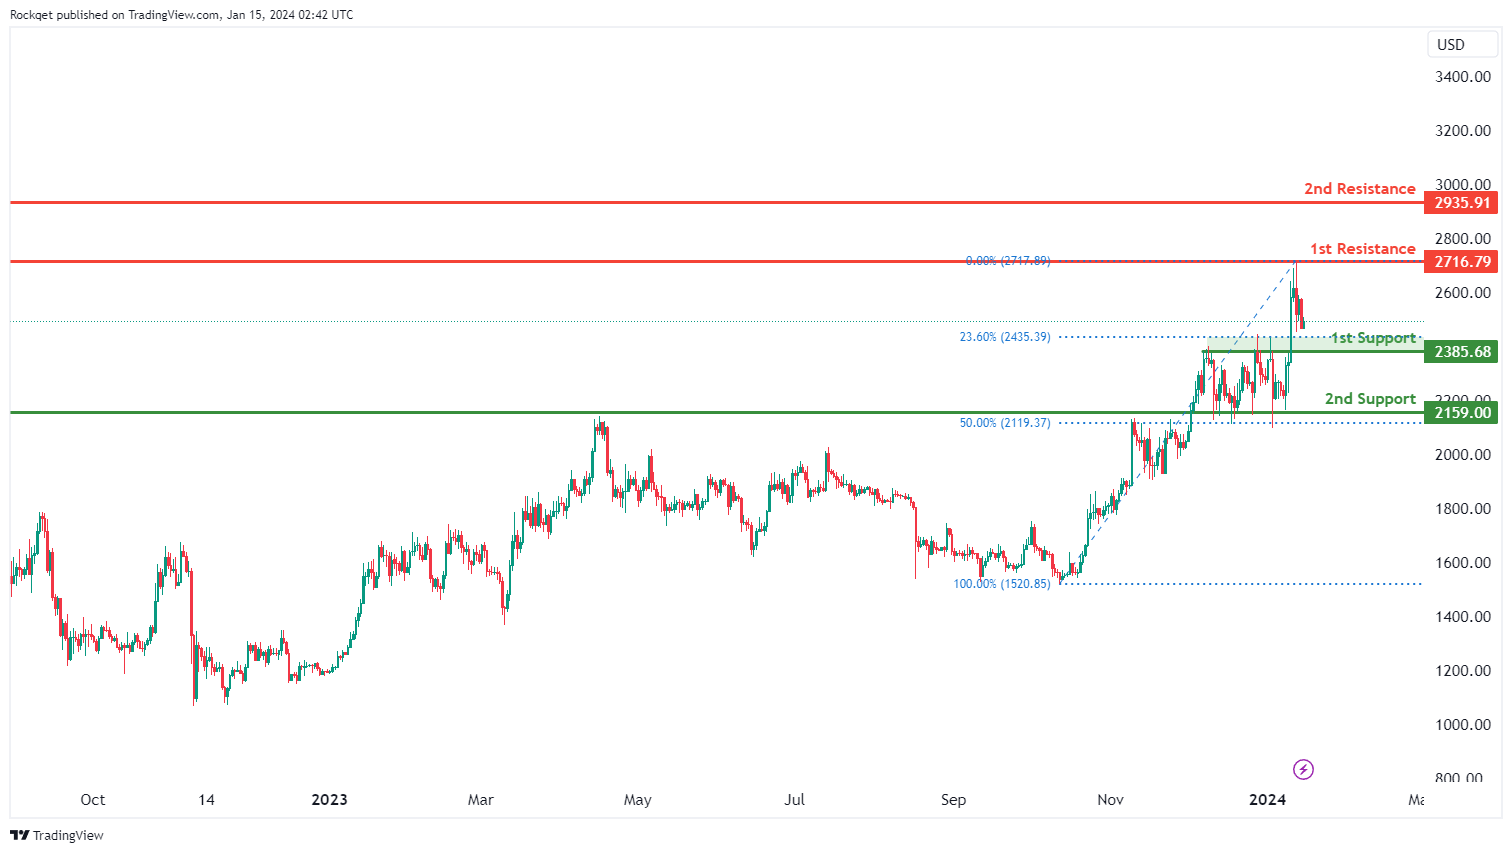
The ETH/USD chart currently exhibits a bearish overall momentum, indicating a potential downward trend. There is a scenario in which the price could make a bearish continuation towards the 1st support.
The 1st support at 2385.68 is considered advantageous due to its identification as a pullback support and its alignment with the 23.60% Fibonacci Retracement, suggesting historical significance as a level where buying interest has previously emerged.
The 2nd support at 2159.00 is recognized as an overlap support, adding to its potential as a support level.
On the resistance side, the 1st resistance at 2716.79 is deemed significant as it aligns with a swing high resistance, potentially acting as a barrier where selling interest could materialize. The 2nd resistance at 2935.91 is also recognized as a swing high resistance.
WTI/USD:
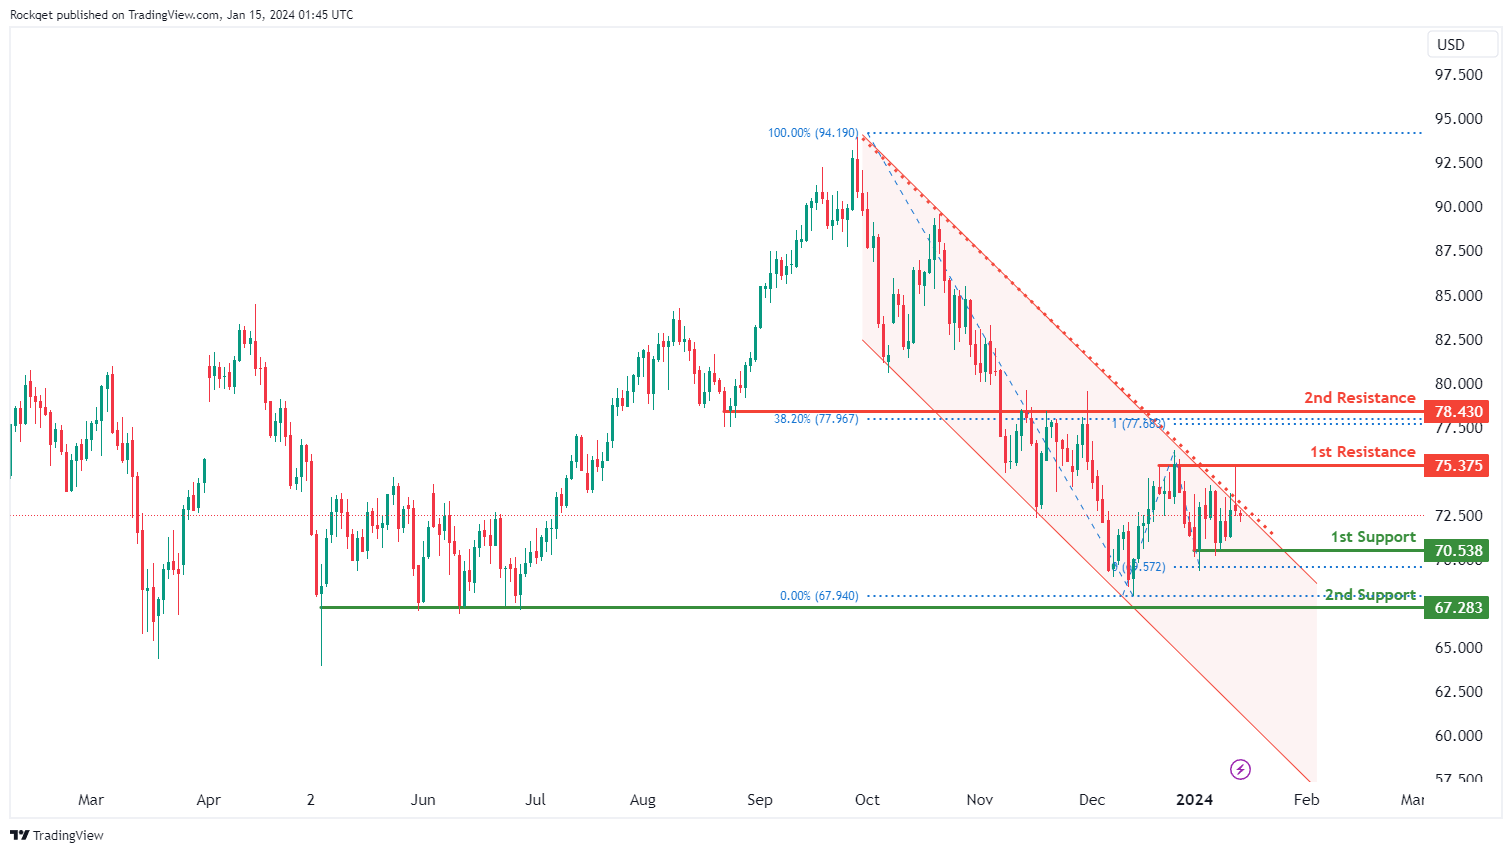
The WTI (West Texas Intermediate) chart currently exhibits a bearish overall momentum, indicating a downward trend in the price of oil. This bearish momentum is characterized by the fact that the price is within a bearish descending channel, suggesting the potential for further declines.
The 1st support level at 70.53 is considered significant as it has acted as a multi-swing low support in the past. This level may attract buying interest and provide temporary support for the price if it reaches this point.
The 2nd support at 67.28 is also categorized as a multi-swing low support, reinforcing its significance as a potential support zone in case of a price drop.
On the resistance side, the 1st resistance at 75.37 is marked as a multi-swing high resistance, signifying the potential for price reversals or resistance at this level.
The 2nd resistance at 78.43 is categorized as an overlap resistance. Notably, it aligns with the 38.20% Fibonacci Retracement level and the 100% Fibonacci Projection, indicating Fibonacci confluence. This makes it a strong potential barrier for the price.
XAU/USD (GOLD):
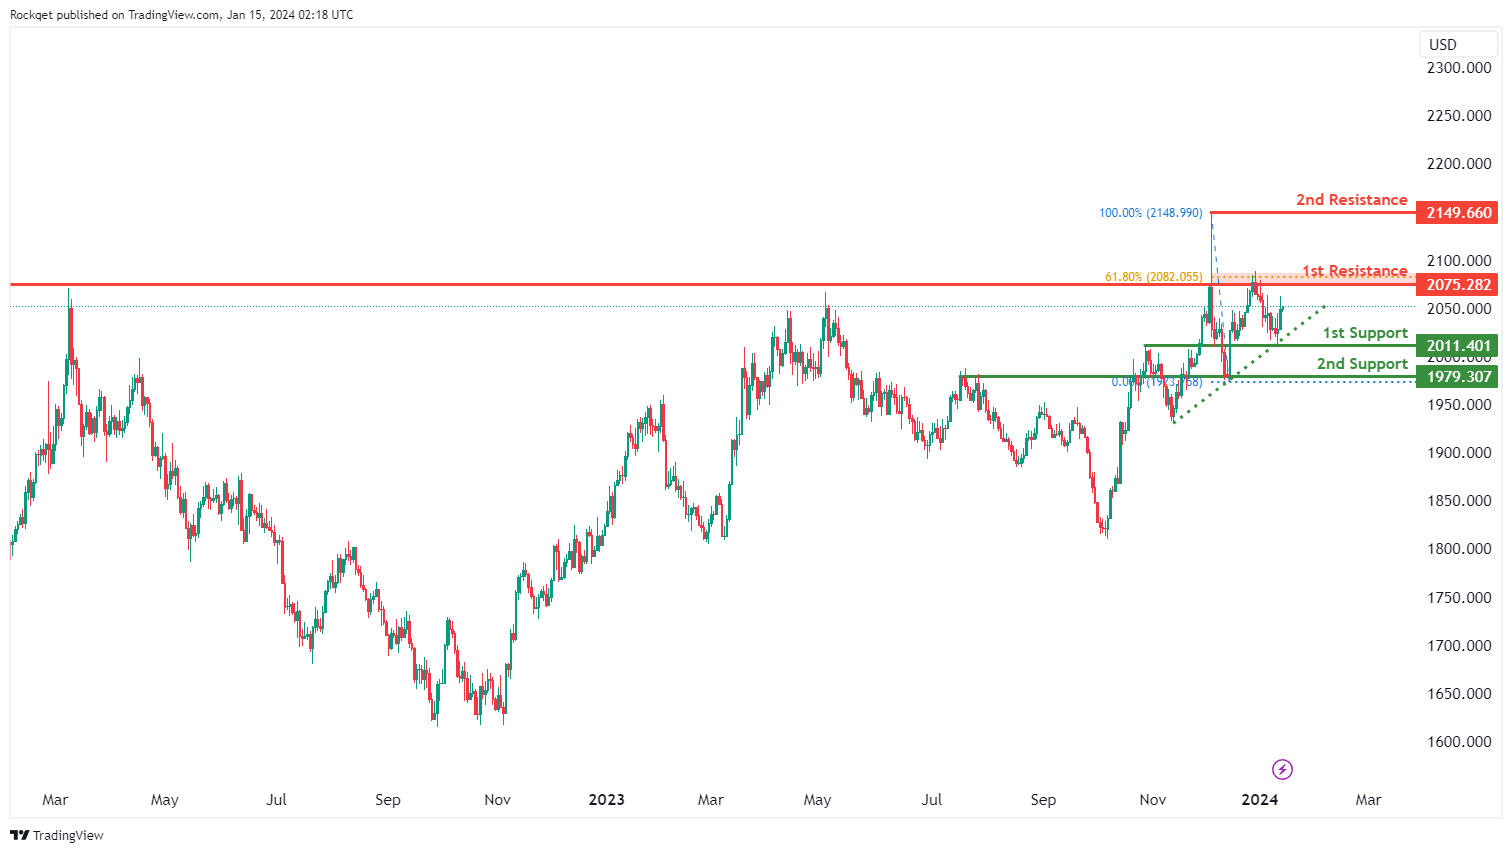
The XAU/USD chart currently has a bullish overall momentum, indicating strength in the price of Gold (XAU) relative to the US Dollar (USD). This bullish momentum is supported by the fact that price is above a major ascending trend line, suggesting that further upward movement may be in store.
The 1st support at 2011.40 is identified as an overlap support level. This means it has acted as a significant level of support in the past and could potentially provide buying interest if the price retraces.
The 2nd support at 1979.30 is also categorized as an overlap support, further reinforcing its significance as a potential support area.
On the resistance side, the 1st resistance at 2075.28 is marked as an overlap resistance. Additionally, it aligns with the 61.80% Fibonacci Retracement level, making it a strong potential barrier for the price.
The 2nd resistance at 2149.66 is categorized as a swing high resistance. Swing highs often represent points of reversal or resistance in price movement.
EUR/USD Could Recover Unless This Level Gives Way
Key Highlights
- EUR/USD is holding the key 1.0880 support zone.
- A key rising channel is forming with support at 1.0935 on the 4-hour chart.
- GBP/USD is consolidating gains near the 1.2750 level.
- Gold prices could gain pace if it clears the $2,060 resistance level.
EUR/USD Technical Analysis
The Euro started a fresh decline from the 1.1140 level against the US Dollar. EUR/USD even declined below the 1.0950 level to move into a bearish zone.
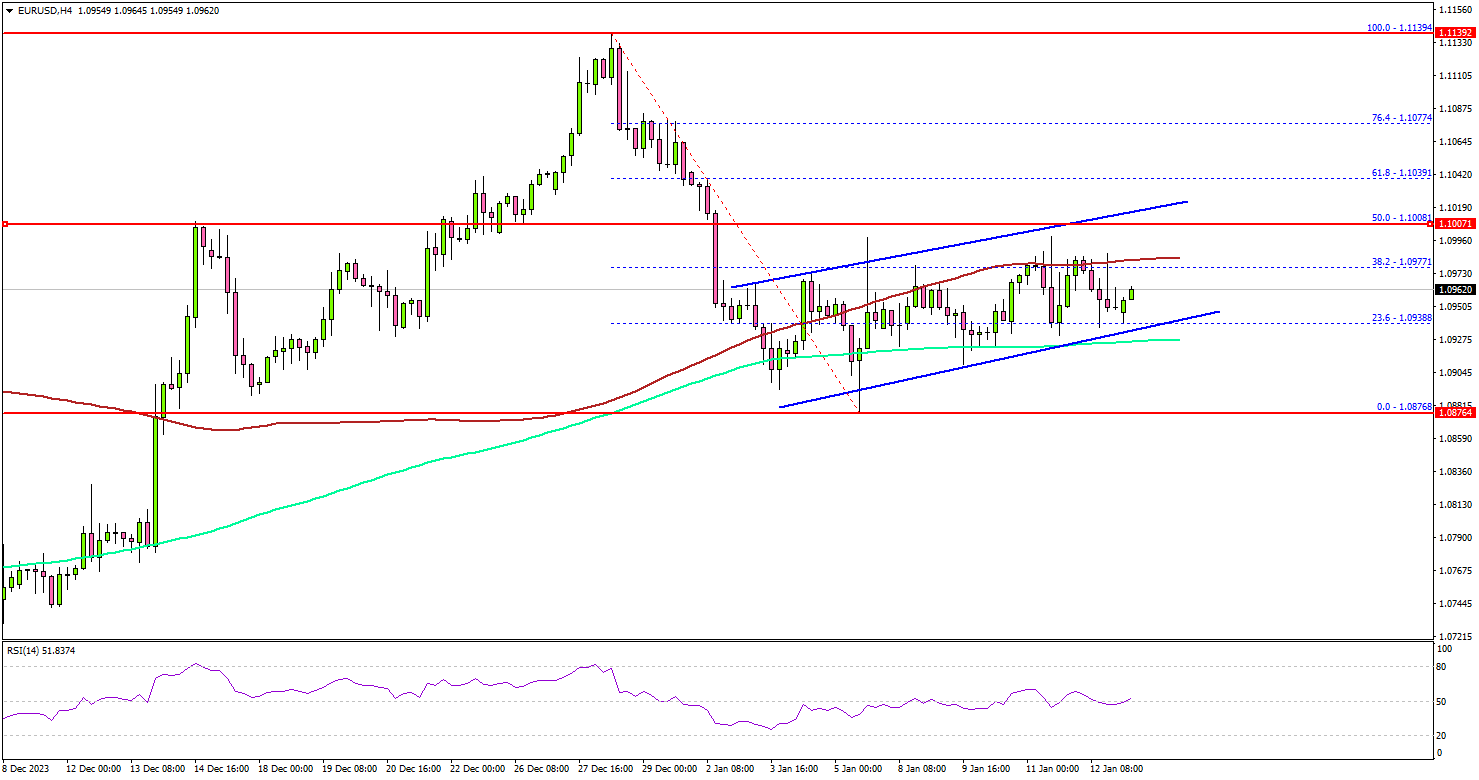
Looking at the 4-hour chart, the pair settled below the 100 simple moving average (red, 4 hours). However, the bulls were active above the 1.0880 support and the 200 simple moving average (green, 4 hours).
A low was formed near 1.0878 and the pair is now attempting a recovery wave. There was a move above the 1.0950 level. There is also a key rising channel forming with support at 1.0935 on the same chart.
On the upside, immediate resistance is near the 1.0000 level. The next key resistance is near the 1.1040 level. A close above the 1.1040 zone could open the doors for more upsides. The next stop for the bulls might be 1.1120.
If there is a fresh decline, the pair might test the 1.0935 support. The next major support sits at 1.0900. A downside break below the 1.0900 zone could spark a sustained decline. The next major support is 1.0880, below which the pair might decline and test 1.0835.
Looking at Gold, the bulls gained strength and they might now attempt a move above the $2,060 resistance zone.
Economic Releases
- Euro Zone Industrial Production for Nov 2023 (MoM) - Forecast -5.9%, versus -6.6% previous.
Contrary to market expectations, PBoC maintains MLF rate but increases liquidity
Despite the anticipation of a rate cut to bolster the weakening economy, currently grappling with deflation for the past three months, PBoC held firm, keeping the rate on CNY 995B worth of one-year medium-term lending facility loans steady at 2.50%. This decision defied the general expectation of a 0.1% cut to 2.40%.
Opting not to alter the policy rate, the central bank instead chose to enhance liquidity in the banking system. This is seen from the net injection of CNY 216B of fresh funds, following the expiration of CNY 779B worth of MLF loans this month. Moreover, PBoC also infused CNY 89B yuan through seven-day reverse repos, maintaining a stable borrowing cost at 1.80%.
There is little reaction from USD/CNH to PBoC's announcement. Technically, USD/CNH is now at a critical juncture, pressing 55 D EMA, just ahead of 7.199 near term resistance. Near term outlook is staying bearish. Another decline and break of 7.0870 short term bottoming will resume the whole fall from 7.3679 to 61.8% retracement of 6.6971 to 7.3679 at 6.9533.
However, firm break of 7.1990 will argue that the fall from 7.3679 has completed and turn near term outlook bullish for retesting this high.
ECB’s Lane: Wage increases as determinants for rate cut timing and extent
In an interview with Corriere della Sera, ECB Chief Economist Philip Lane acknowledged that the December inflation data was "broadly in line with our projections". He highlighted a "continued progress" in easing of core inflation, yet pointed out existing "headwinds to services inflation."
A critical point raised by Lane concerns wage growth, which he notes is still rising well above any kind of long-run equilibrium rate". ECB is expecting "high wage increases" to continue in 2024. "the scale of that will determine the timing and the scale of rate adjustment this year," he added.
Lane also touched upon ECB's reliance on data. He mentioned that while new wage data is received weekly, the "most complete dataset" from Eurostat's national accounts will only be available at the end of April.
This timeline suggests that key policy decisions, especially those pertaining to rate cuts, are likely to be heavily influenced by data available by June meeting.
Finally, Lane's projection of a "significant recovery" in the European economy this year is tempered with caution, as he acknowledges downside risks to their forecasts. The question of whether 2024 will see a recovery or a continuation of the stagnation experienced in 2023 remains a "big data question" for ECB.