

Sample Category Title
USD/CAD Daily Outlook
Daily Pivots: (S1) 1.3391; (P) 1.3419; (R1) 1.3457; More...
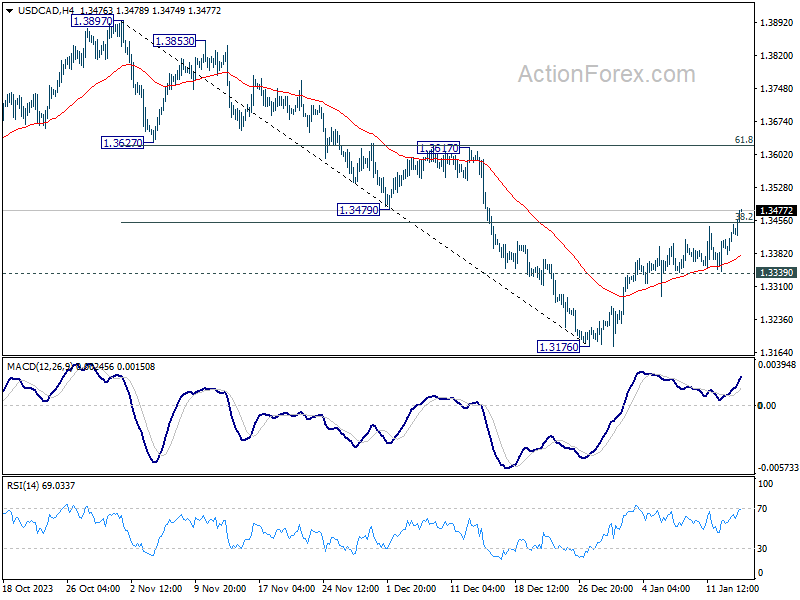
USD/CAD's rebound from 1.3176 resumed and hits as high as 1.3478 so far. Intraday bias is back on the upside. Next target is 1.3617 cluster resistance (61.8% retracement of 1.3897 to 1.3176 at 1.3622). On the downside, break of 1.3339 minor support is needed to indicate completion of the rebound. Otherwise, further rally will remain in favor in case of retreat.
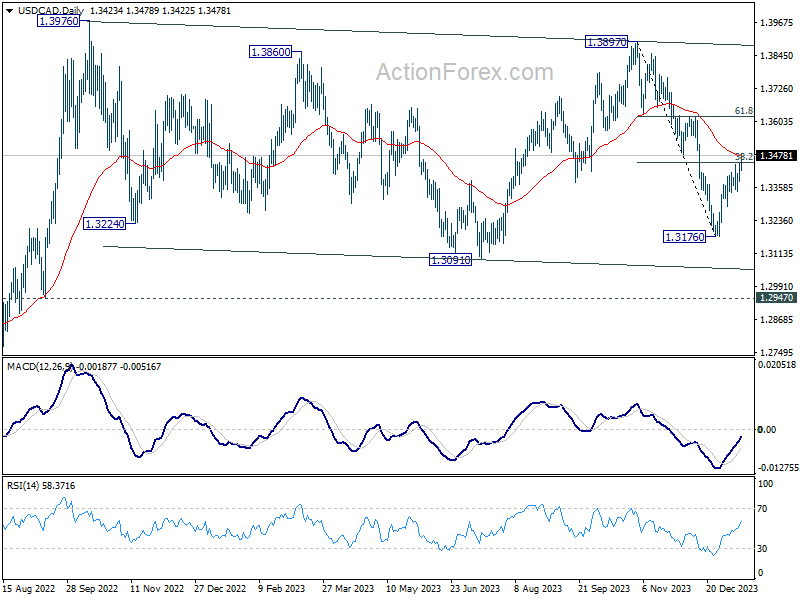
In the bigger picture, price actions from 1.3976 (2022 high) are viewed as a corrective pattern only. While fall from 1.3897 could still extend through 1.3091, strong support should emerge above 1.2947 resistance turned support to bring rebound. Overall, larger up trend from 1.2005 (2021 low) is still expected to resume at a later stage.
Technical Outlook and Review
DXY:
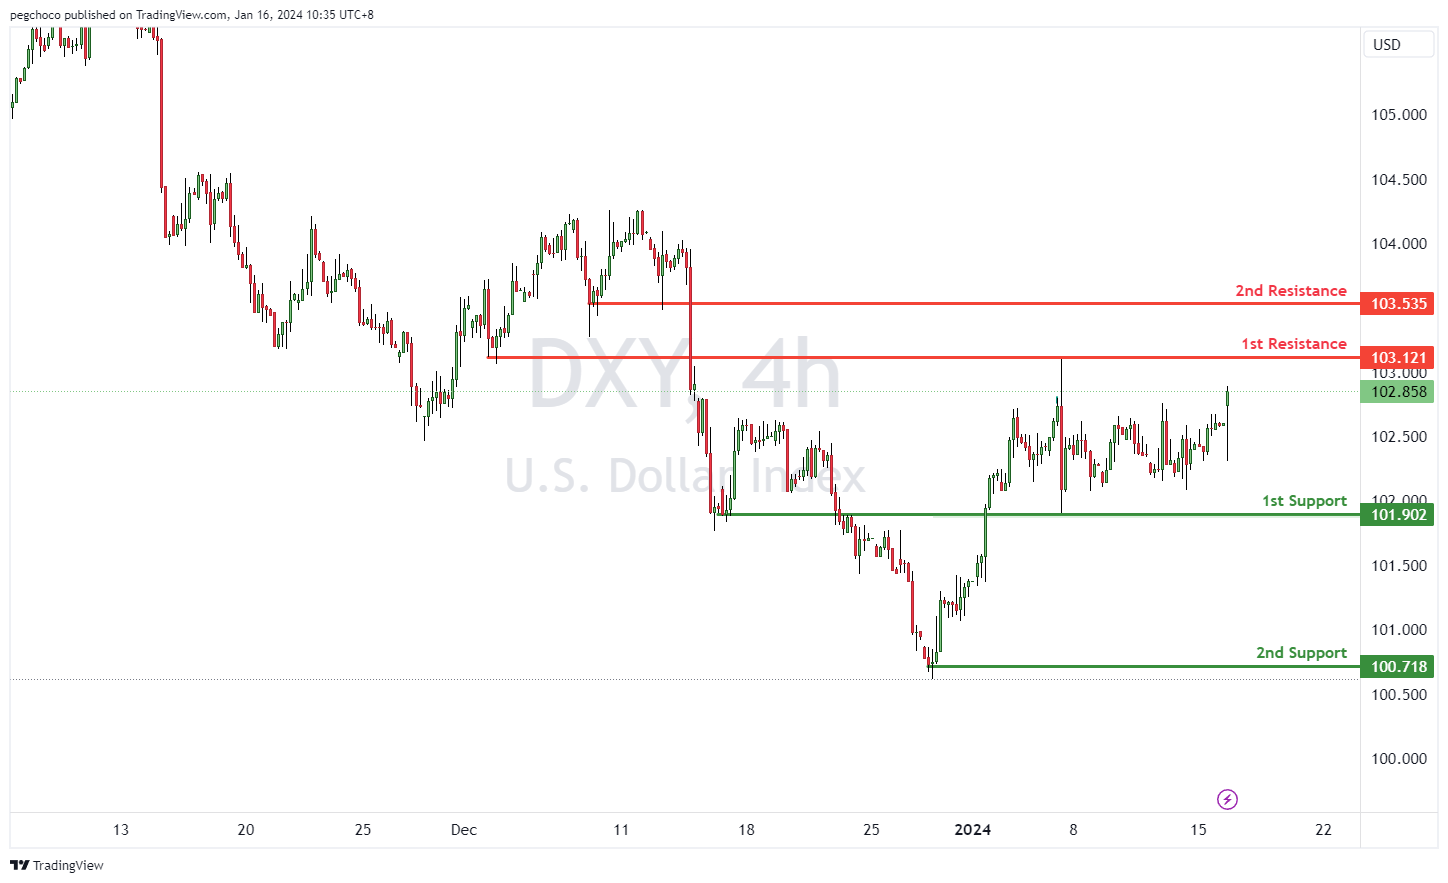
The DXY (US Dollar Index) chart currently exhibits a neutral overall momentum, suggesting a lack of a clear directional bias in the US Dollar.
Price could potentially fluctuate between the 1st support and 1st resistance levels. Here are the identified support and resistance levels:
1st support at 101.90 is identified as an overlap support, and it may provide a potential area where buying interest could emerge, temporarily supporting the US Dollar.
2nd support at 100.71 is categorized as a swing low support, further reinforcing its significance as a potential support level.
On the resistance side, 1st resistance at 103.12 is marked as an overlap resistance, and it could act as a barrier for any potential upward price movement.
2nd resistance at 103.53 is categorized as pullback resistance, adding to its significance as a potential resistance level.
EUR/USD:
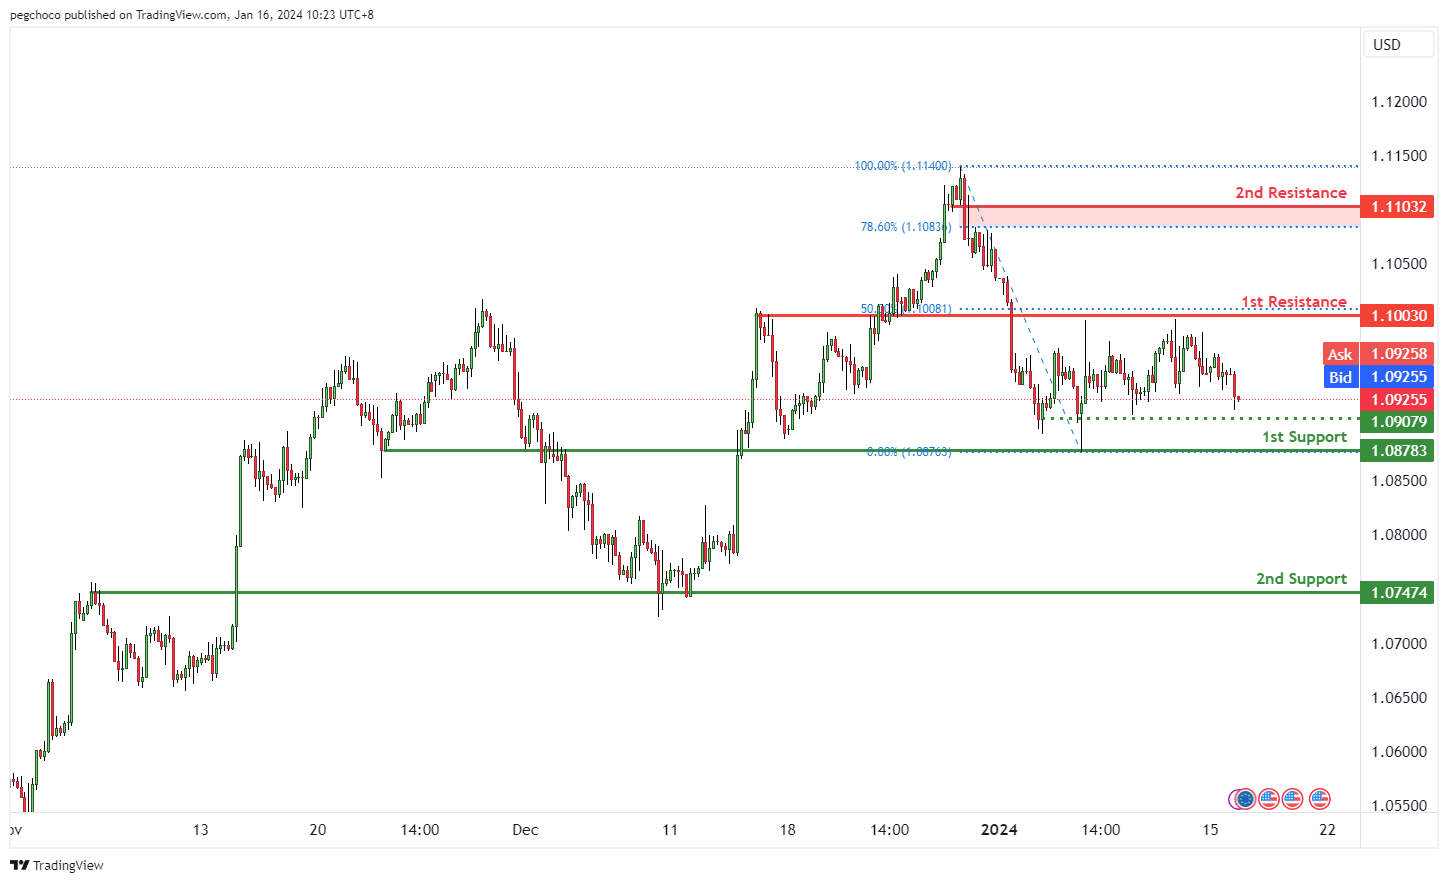
The EUR/USD chart currently exhibits a bearish overall momentum, suggesting weakness in the Euro relative to the US Dollar.
Price could potentially make a bearish continuation towards the 1st support level.
Here are the identified support and resistance levels:
1st support at 1.0878 is categorized as an overlap support, and it may serve as a potential area where buying interest could emerge, providing temporary support for EUR/USD.
2nd support at 1.0747 is also identified as an overlap support, reinforcing its significance as a potential support zone.
On the resistance side, 1st resistance at 1.1003 is marked as an overlap resistance and could act as a barrier for any potential upward price movement.
2nd resistance at 1.1103 is categorized as pullback resistance, adding to its significance as a potential resistance level.
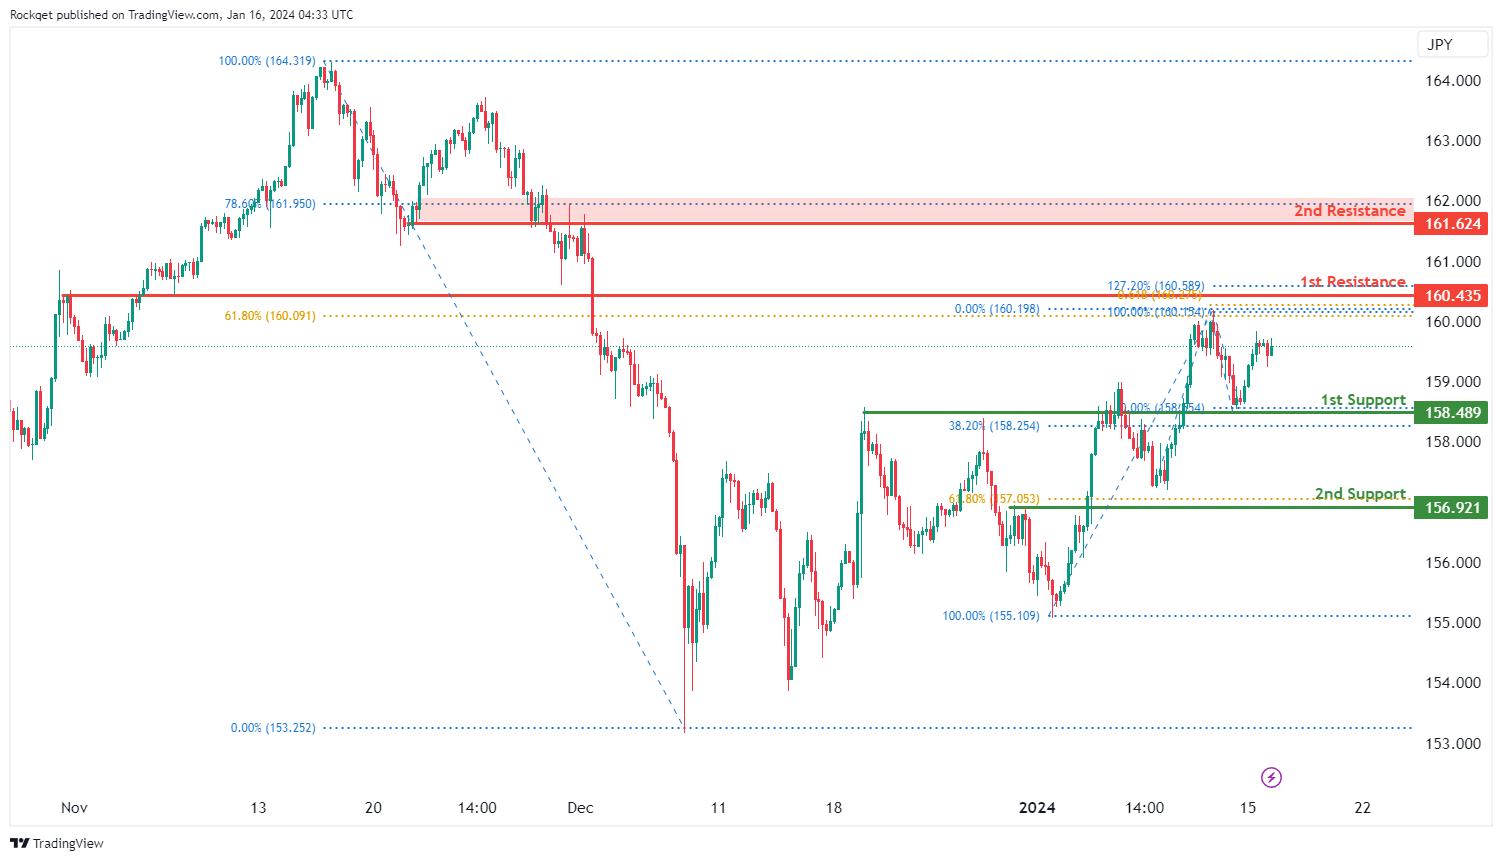
EUR/JPY:
The EUR/JPY chart currently displays a bullish overall momentum, indicating an upward trend. There is a potential scenario for a bullish continuation towards the 1st resistance.
The 1st support at 158.49 is considered favorable due to its identification as an overlap support and coincides with the 38.20% Fibonacci Retracement, suggesting historical significance as a level where buying interest has previously emerged.
The 2nd support at 156.92 is recognized as a pullback support and aligns with the 61.80% Fibonacci Retracement, adding confluence to its potential as a support level.
On the resistance side, the 1st resistance at 160.44 is identified as an overlap resistance and aligns with the 61.80% Fibonacci Retracement and the 61.80% Fibonacci Projection, adding significance to this potential resistance level.
The 2nd resistance at 161.62 is noteworthy for the presence of an overlap resistance and the 78.60% Fibonacci level, reinforcing its importance as a potential resistance.
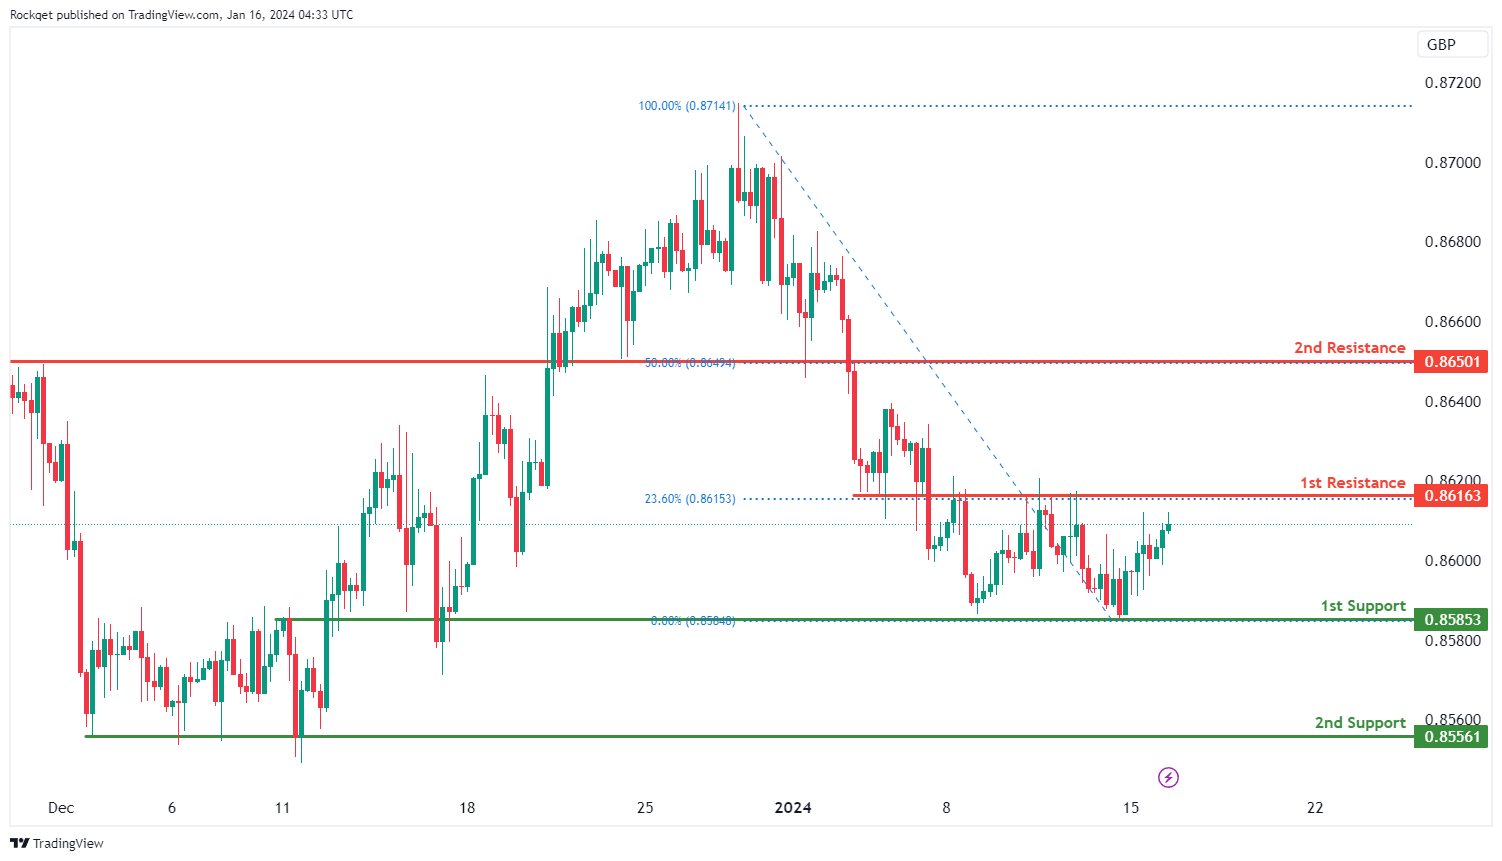
EUR/GBP:
The EUR/GBP chart currently exhibits a bullish overall momentum, indicating an upward trend. Price has the potential to make a bullish continuation towards the 1st resistance.
The 1st support at 0.8585 is considered favorable as it is identified as an overlap support, suggesting historical significance as a level where buying interest has previously emerged.
The 2nd support at 0.8556 is recognized as a multi-swing low support, adding additional strength to its potential as a support level.
On the resistance side, the 1st resistance at 0.8618 is identified as an overlap resistance and aligns with the 23.60% Fibonacci Retracement, adding significance to this potential resistance level.
The 2nd resistance at 0.8650 is also an overlap resistance, further supporting its importance as a potential barrier.
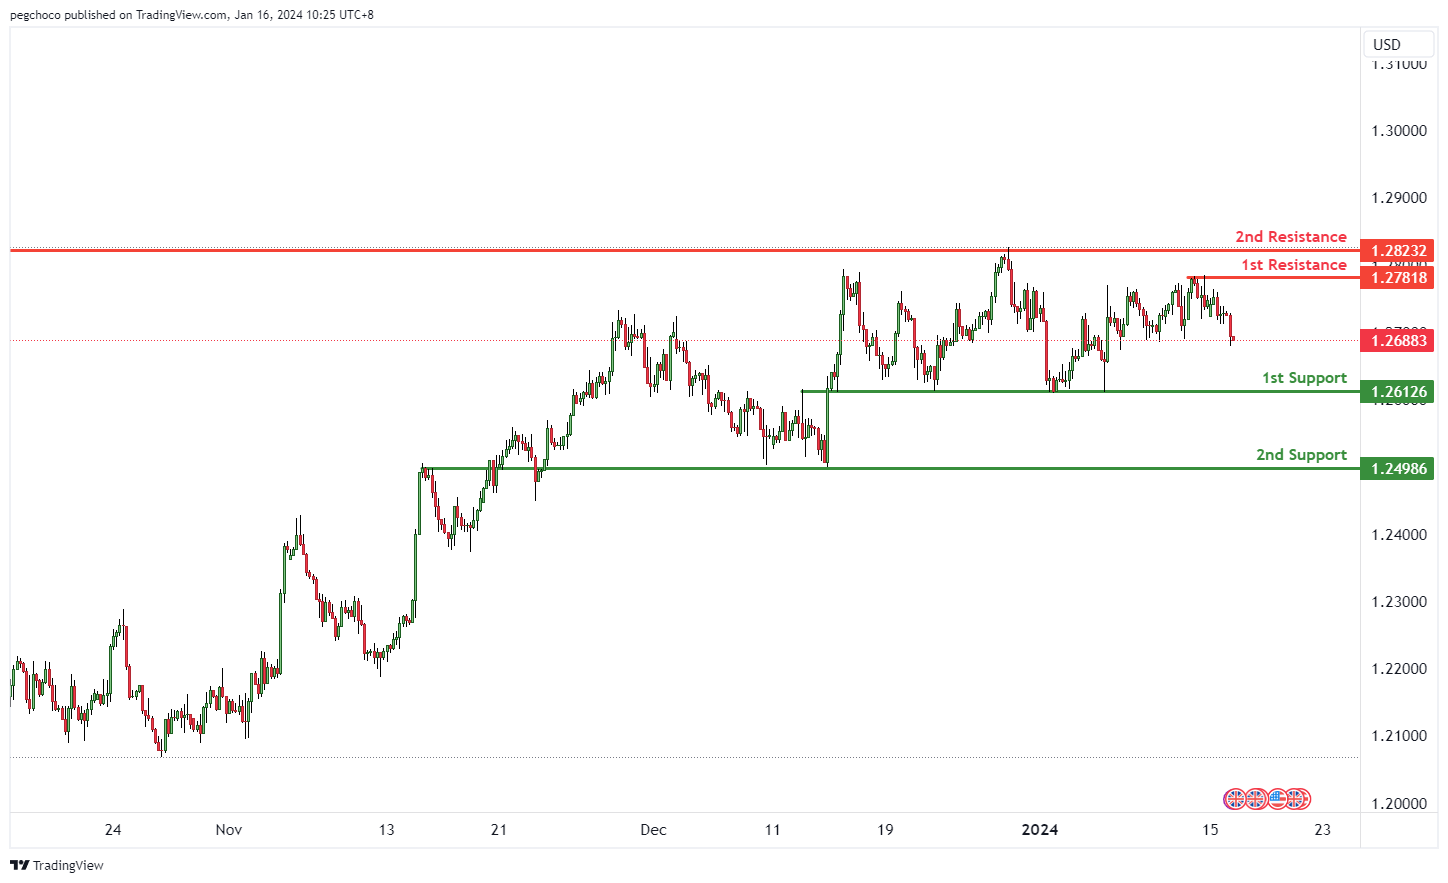
GBP/USD:
The GBP/USD chart currently exhibits a bearish overall momentum, suggesting weakness in the British Pound relative to the US Dollar.
Price could potentially make a bearish continuation towards the 1st support level.
Here are the identified support and resistance levels:
1st support at 1.2612 is categorized as an overlap support, and it may serve as a potential area where buying interest could emerge, providing temporary support for GBP/USD.
2nd support at 1.2498 is also identified as an overlap support, reinforcing its significance as a potential support zone.
On the resistance side, 1st resistance at 1.2781 is marked as a swing high resistance and could act as a barrier for any potential upward price movement.
2nd resistance at 1.2823 is also categorized as a swing high resistance, adding to its significance as a potential resistance level.
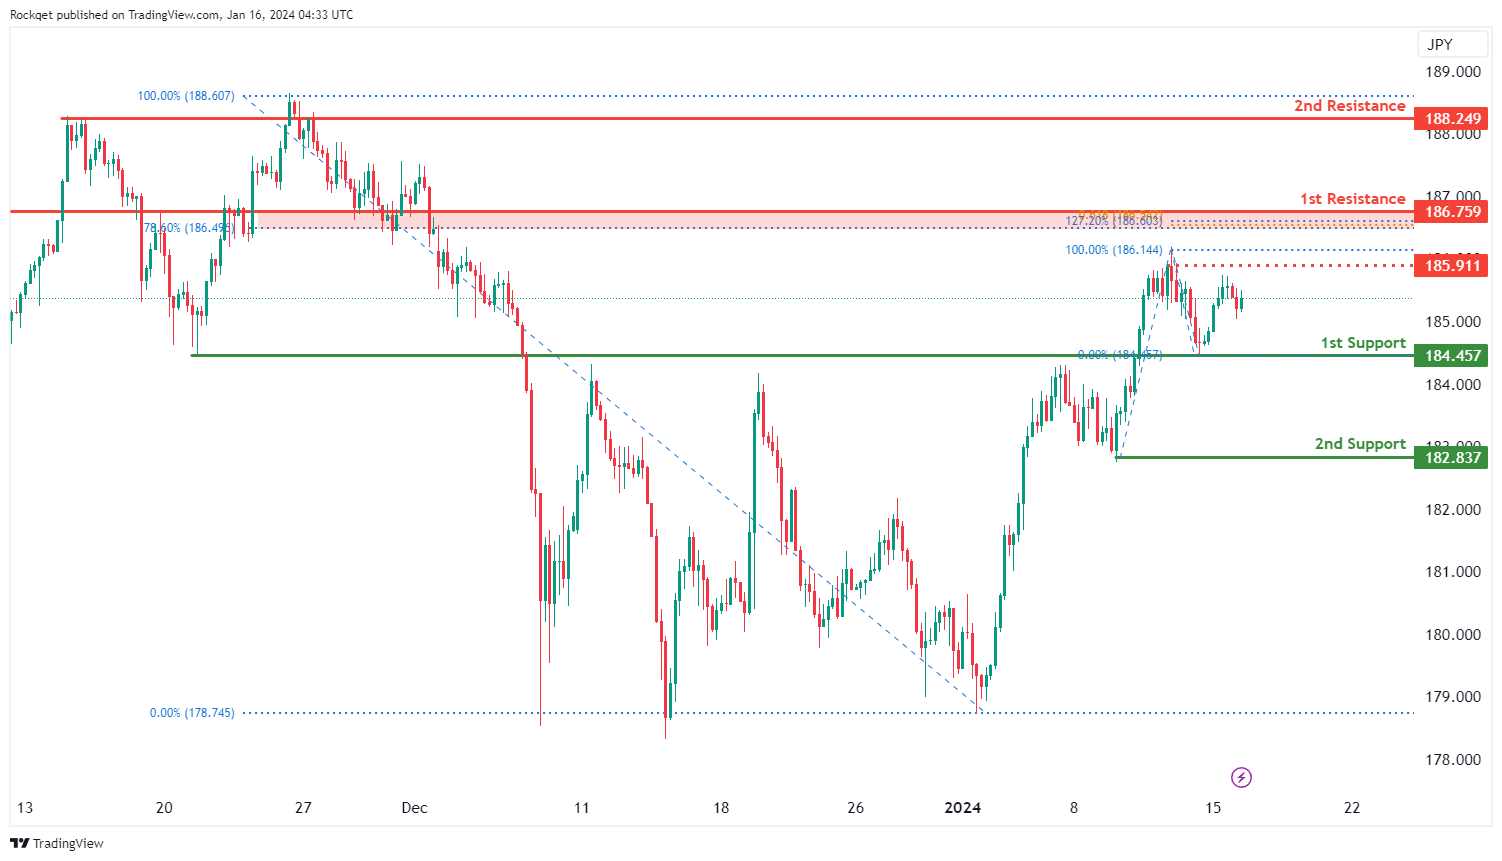
GBP/JPY:
The GBP/JPY chart currently demonstrates a bullish overall momentum, indicating an upward trend. Price has the potential to make a bullish continuation towards the 1st resistance.
The 1st support at 185.46 is considered favorable as it is identified as an overlap support, suggesting historical significance as a level where buying interest has previously emerged.
The 2nd support at 182.84 is recognized as a swing low support, adding additional strength to its potential as a support level.
On the resistance side, the 1st resistance at 186.76 is identified as a pullback resistance and aligns with the 78.60% Fibonacci Retracement, as well as the 127.20% Fibonacci Extension, adding significance to this potential resistance level.
The 2nd resistance at 188.25 is a swing high resistance, further supporting its importance as a potential barrier.There is also an intermediate resistance at 185.91, identified as a pullback resistance, contributing to the overall strength of potential resistance levels.
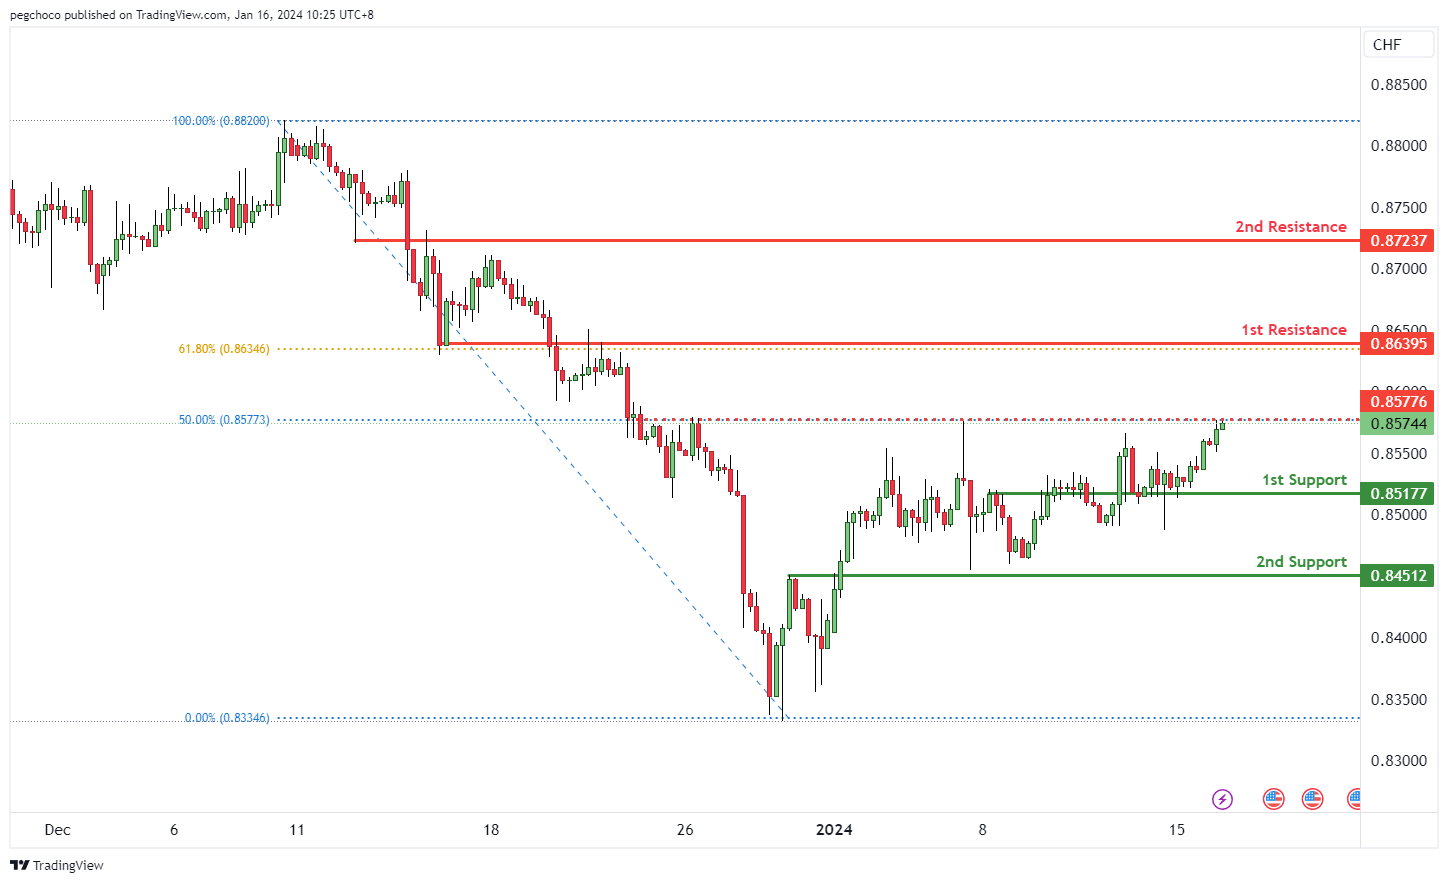
USD/CHF:
The USD/CHF chart currently exhibits a bullish overall momentum, indicating strength in the US Dollar relative to the Swiss Franc. This bullish momentum suggests the potential for a bullish continuation towards the 1st resistance level.
Here are the identified support and resistance levels:
1st support at 0.8517 is marked as an overlap support. It may serve as a potential area where buying interest could emerge, providing temporary support for USD/CHF.
2nd support at 0.8451 is also identified as an overlap support, reinforcing its significance as a potential support zone.
On the resistance side, 1st resistance at 0.8639 is categorized as an overlap resistance and is further supported by the 61.80% Fibonacci Retracement level, making it a significant barrier for potential upward price movement.
2nd resistance at 0.8723 is marked as an overlap resistance, adding to its significance as a potential resistance level.
Intermediate resistance at 0.8577 is mentioned as well, as it corresponds to the 50% Fibonacci Retracement level, which may act as a minor resistance point.
USD/JPY:
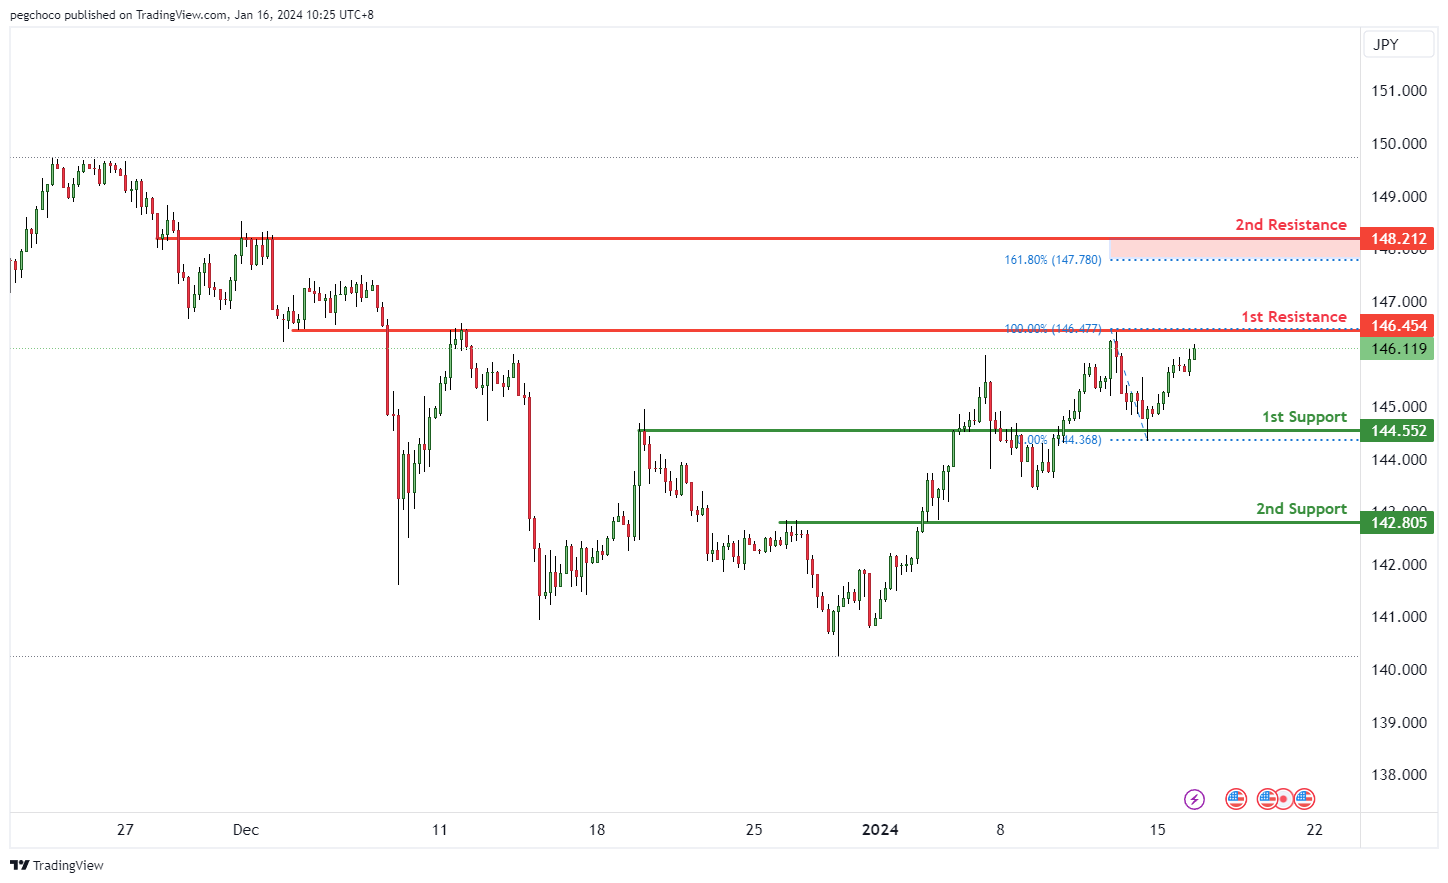
The USD/JPY chart currently exhibits a bullish overall momentum, suggesting strength in the US Dollar relative to the Japanese Yen. This bullish momentum indicates the potential for a bullish continuation towards the 1st resistance level.
Here are the identified support and resistance levels:
1st support at 144.55 is marked as an overlap support. It may act as a potential area where buying interest could emerge, providing temporary support for USD/JPY.
2nd support at 142.80 is identified as a pullback support, further reinforcing its significance as a potential support zone.
On the resistance side, 1st resistance at 146.45 is categorized as an overlap resistance, indicating a potential barrier for further upward price movement.
1st resistance at 148.21 is also marked as an overlap resistance and is supported by the 161.80% Fibonacci Extension level, making it a significant potential resistance point.
USD/CAD:
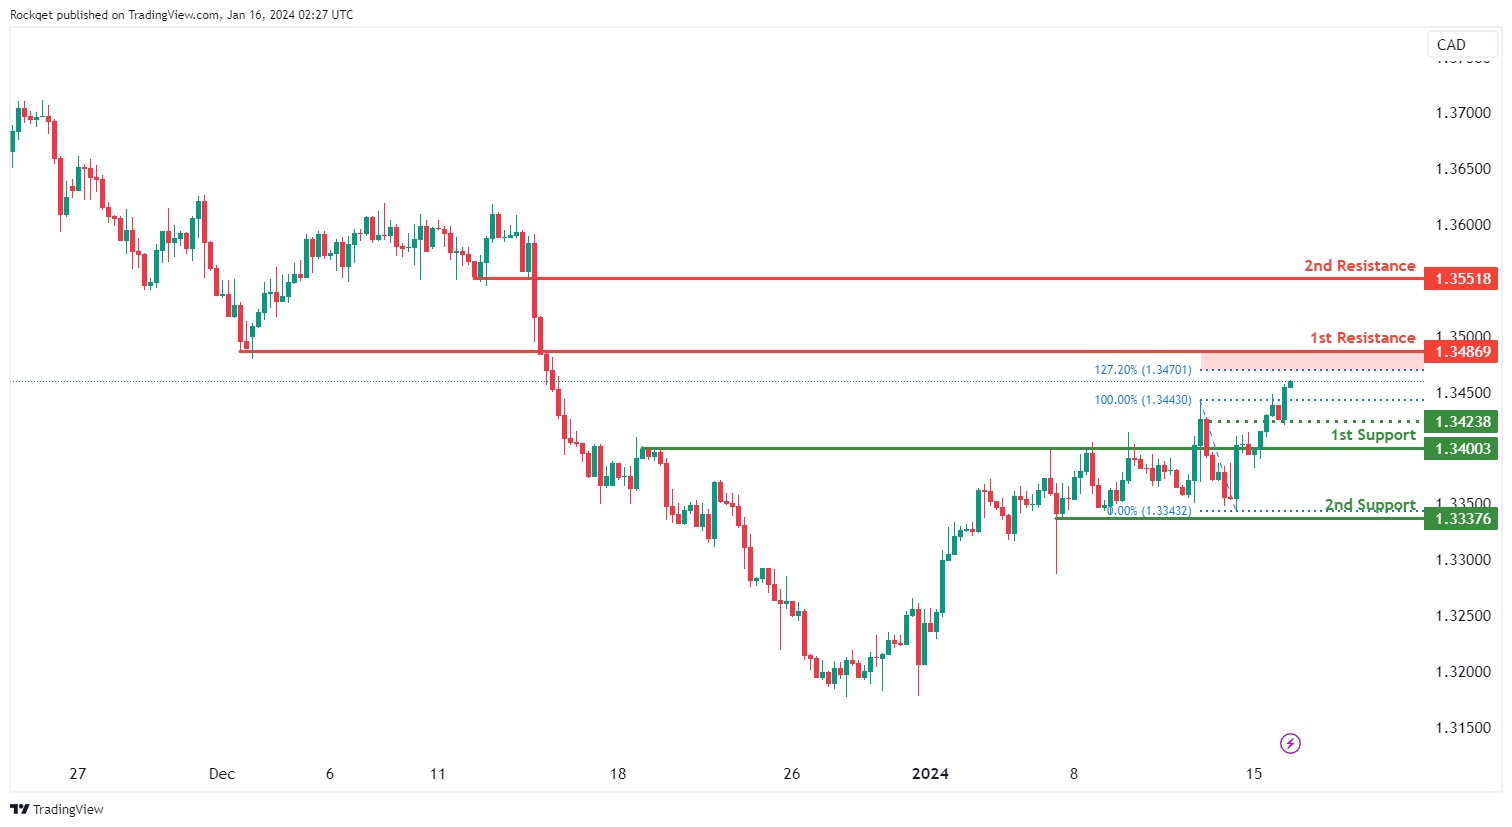
The USD/CAD chart currently exhibits an overall bullish momentum. In this context, there is a potential scenario for price to rise towards the 1st resistance.
The 1st resistance level at 1.3486 is identified as a pullback resistance that aligns close to the 127.20% Fibonacci extension level. Higher up, the 2nd resistance level at 1.3551 is also noted as a pullback resistance, further reinforcing its significance as a potential resistance zone.
To the downside, the intermediate support level at 1.3423 is identified as an overlap support while the 1st support level at 1.3400 is also noted as an overlap support. Further below, the 2nd support level at 1.3337 is marked as a pullback support, further reinforcing its importance as a key support level.
AUD/USD:
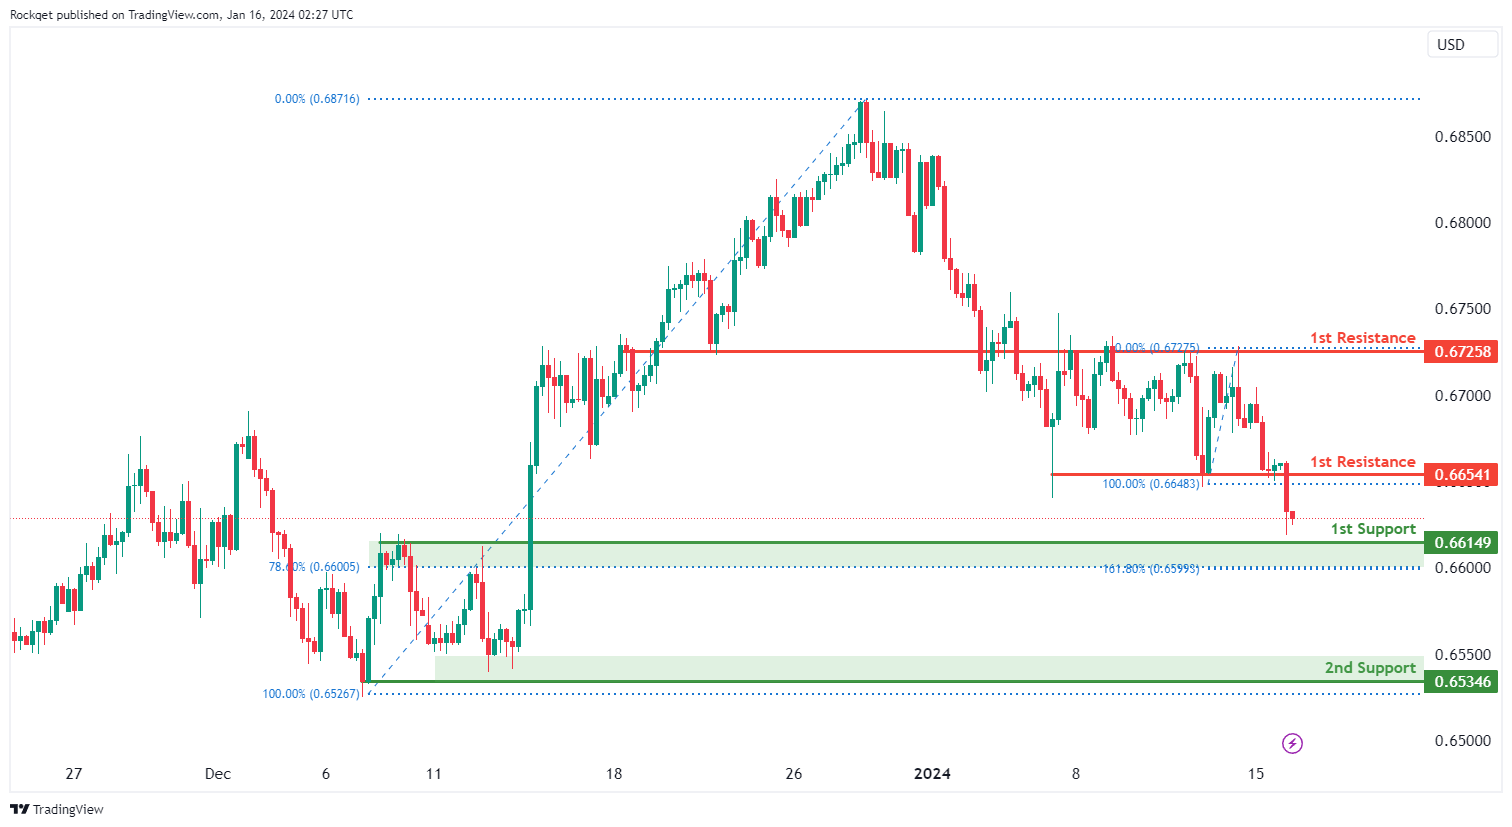
The AUD/USD chart currently exhibits an overall bearish momentum. In this context, there is a potential scenario for price to drop towards the 1st support.
The 1st support level at 0.6614 is identified as a pullback support that aligns with a confluence of Fibonacci levels i.e. the 78.60% retracement and the 161.80% extension. Further below, the 2nd support level at 0.6534 is also marked as an pullback support, further reinforcing its importance as a key support level.
To the upside, the 1st resistance level at 0.6654 is identified as a pullback resistance. Higher up, the 2nd resistance level at 0.6725 is noted as an overlap resistance, suggesting a potential barrier for further upside movement.
NZD/USD
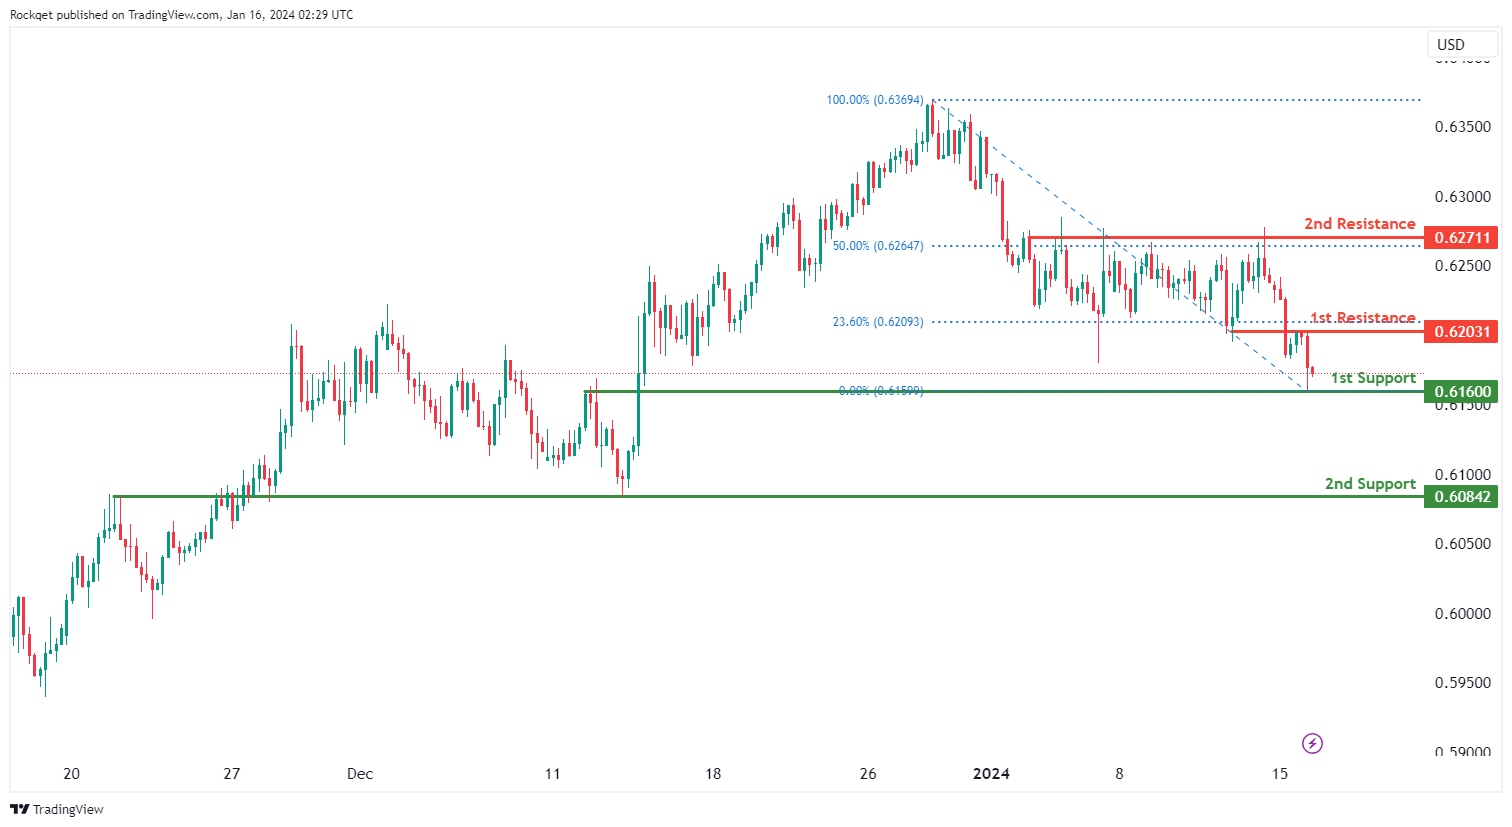
The NZD/USD chart currently exhibits an overall bearish momentum. In this context, there is a potential scenario for price to drop towards the 1st support.
The 1st support level at 0.6160 is identified as an overlap support. Further below, the 2nd support level at 0.6084 is also marked as an overlap support, further reinforcing its importance as a key support level.
To the upside, the 1st resistance level at 0.6203 is identified as an overlap resistance that aligns with the 23.60% Fibonacci retracement level. Higher up, the 2nd resistance level at 0.6271 is noted as a pullback resistance that aligns with the 50.00% Fibonacci projection level, suggesting a potential barrier for further upside movement.
DJ30:
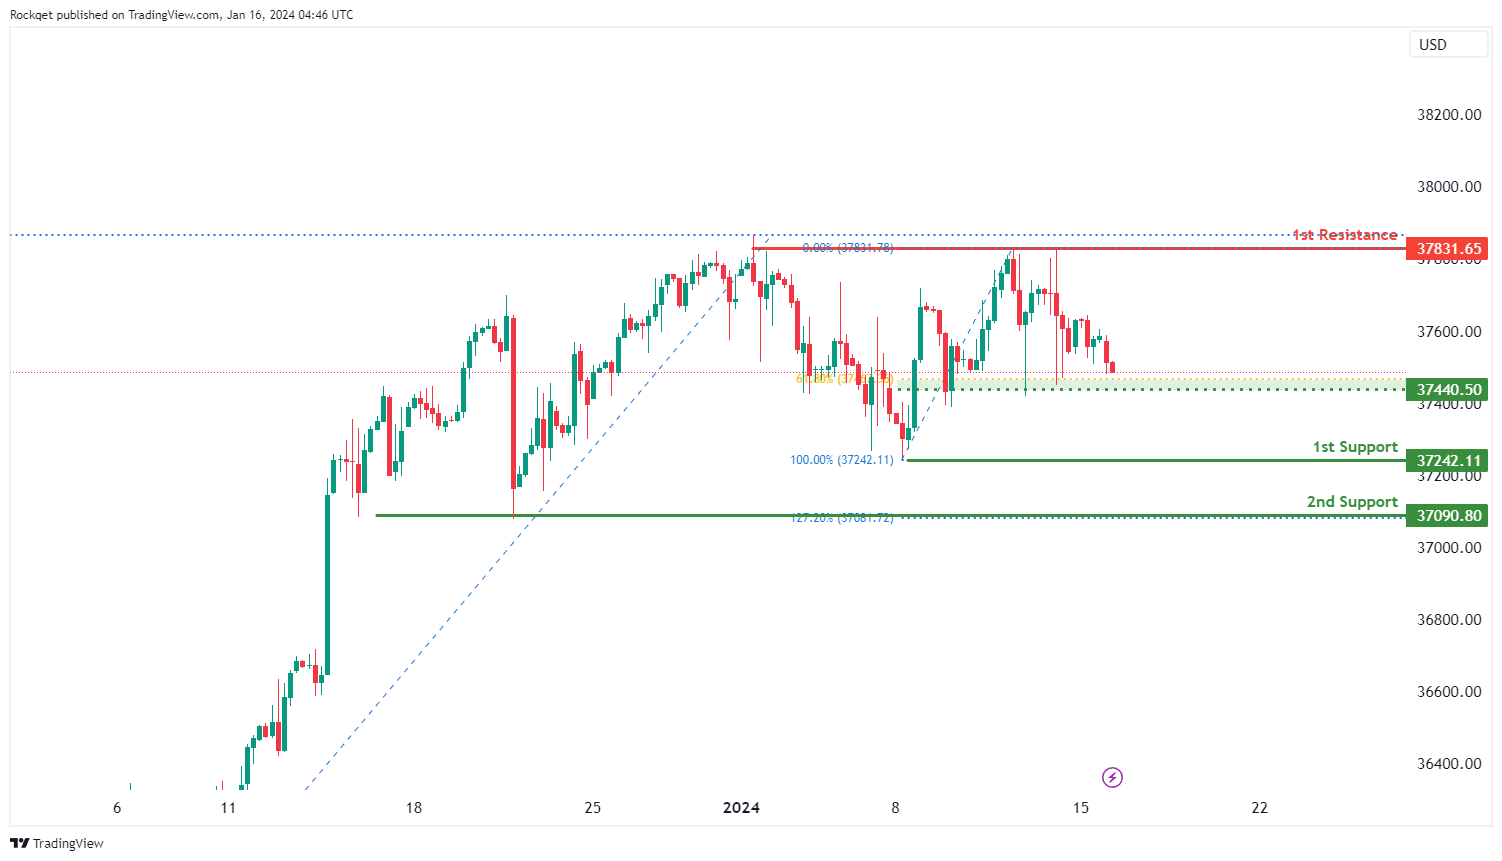
The DJ30 chart currently exhibits a bearish overall momentum, indicating a prevailing downward trend. There is a likelihood that the price may continue its bearish movement towards the 1st support level.
The 1st support at 37242.11 is considered significant due to its identification as a swing low support, suggesting a historical level where buying interest has previously emerged.
The 2nd support at 37090.80 is characterized as a pullback support, adding further strength to its potential as a level where buyers might step in.
On the resistance side, the 1st resistance at 37831.65 is identified as a multi-swing high resistance, indicating a historical level where selling pressure has been notable.
Intermediate support is found at 37440.50, recognized as a pullback support, and coincides with the 61.80% Fibonacci Retracement level. This convergence adds additional significance to this level as a potential area of support.
GER40:
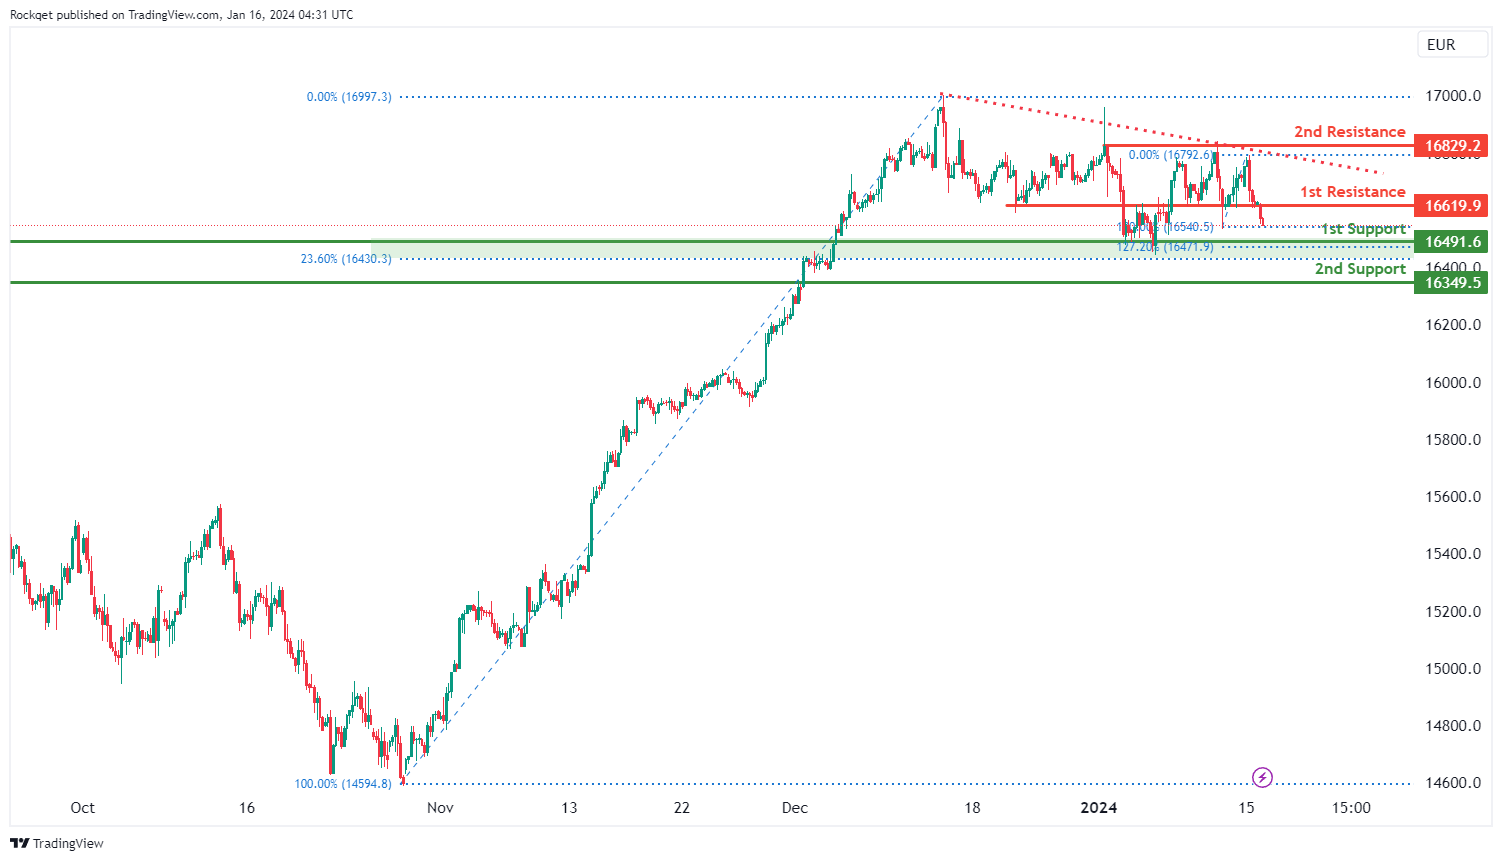
The GER40 chart currently experiences a bearish overall momentum, with key factors contributing to this being the price positioned below a major descending trend line, indicating a predisposition towards further downward movement. Given this bearish scenario, the price could potentially continue its bearish trend towards the 1st support level.
The 1st support at 16491.60 holds significance as it is identified as an overlap support. Moreover, it aligns with both the 23.60% Fibonacci Retracement and the 127.20% Fibonacci Extension, suggesting a confluence of support levels. Traders should consider this level as it has historical importance, having acted as a level where buying interest emerged previously.
The 2nd support at 16349.50 is recognized as a pullback support, adding additional strength to its potential as a level where buyers might step in. This level should be monitored closely as it provides an additional layer of support.
On the resistance side, the 1st resistance at 16619.90 is identified as a pullback resistance, signifying a historical level where selling pressure has been notable. The 2nd resistance at 16829.20 is characterized as a swing high resistance, indicating a level where strong selling interest has historically been observed.
US500:
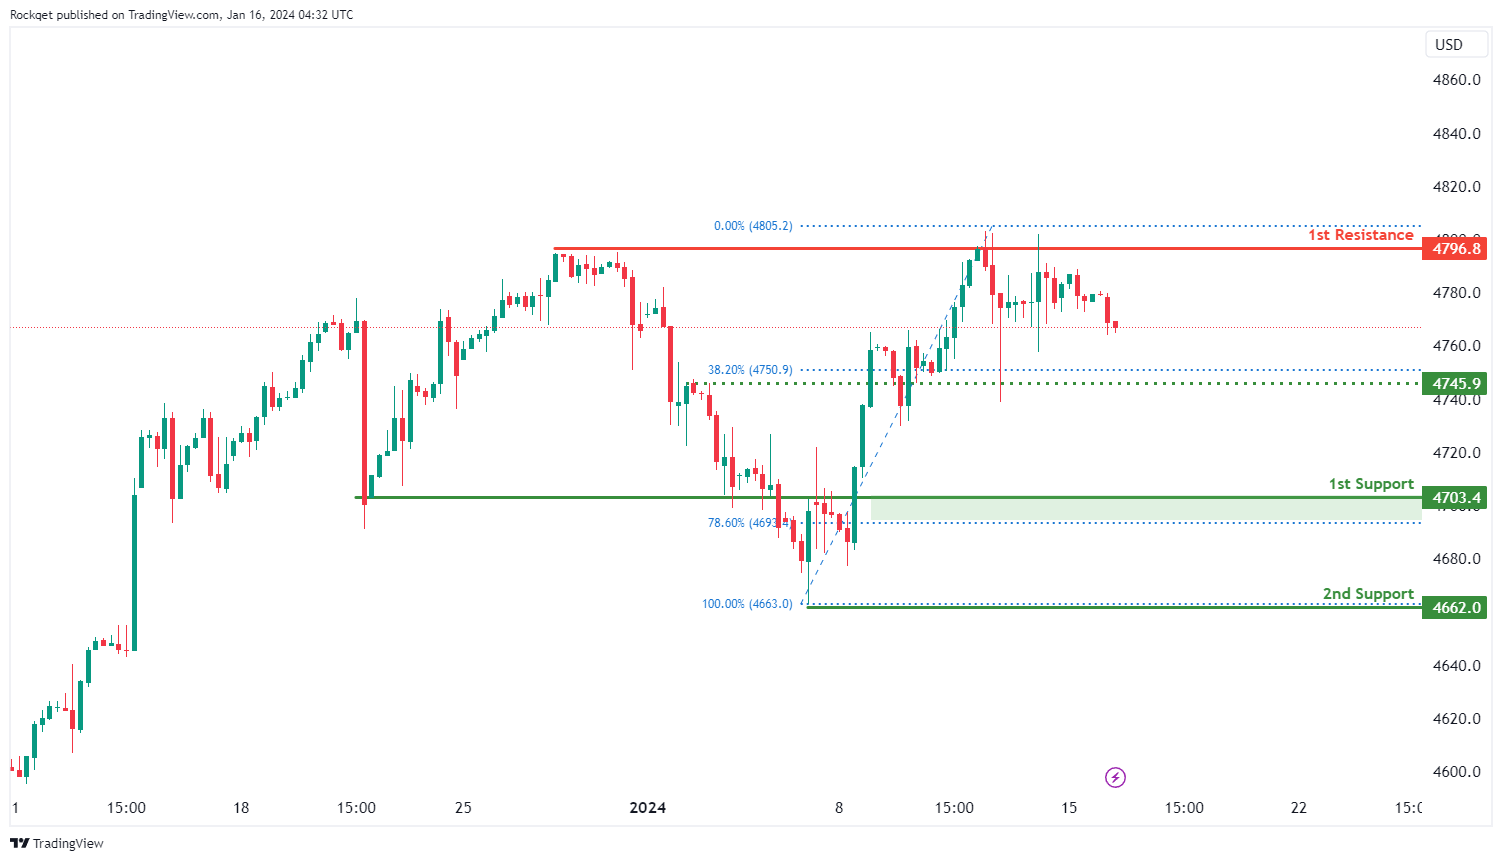
The US500 chart currently exhibits a bearish overall momentum, and several factors contribute to this downward trend. The price is positioned below a major descending trend line, indicating a bearish bias. Given this momentum, there is a potential for a bearish continuation towards the 1st support level.
The 1st support at 4703.4 is considered significant for several reasons. Firstly, it aligns with the 78.60% Fibonacci Retracement, suggesting a historical level where buying interest has emerged. Additionally, this level is identified as a pullback support, reinforcing its potential significance.
The 2nd support at 4662.0 is noteworthy for being a swing low support, indicating a level where buyers have historically stepped in. Traders should closely monitor this level as it represents a historical point of interest.
The intermediate support at 4745.9 holds importance as it is characterized as an overlap support and coincides with the 38.20% Fibonacci Retracement. This confluence of support levels enhances the significance of this level.
On the resistance side, the 1st resistance at 4796.8 is identified as a swing high resistance, marking a historical level where selling pressure has been notable.
BTC/USD:
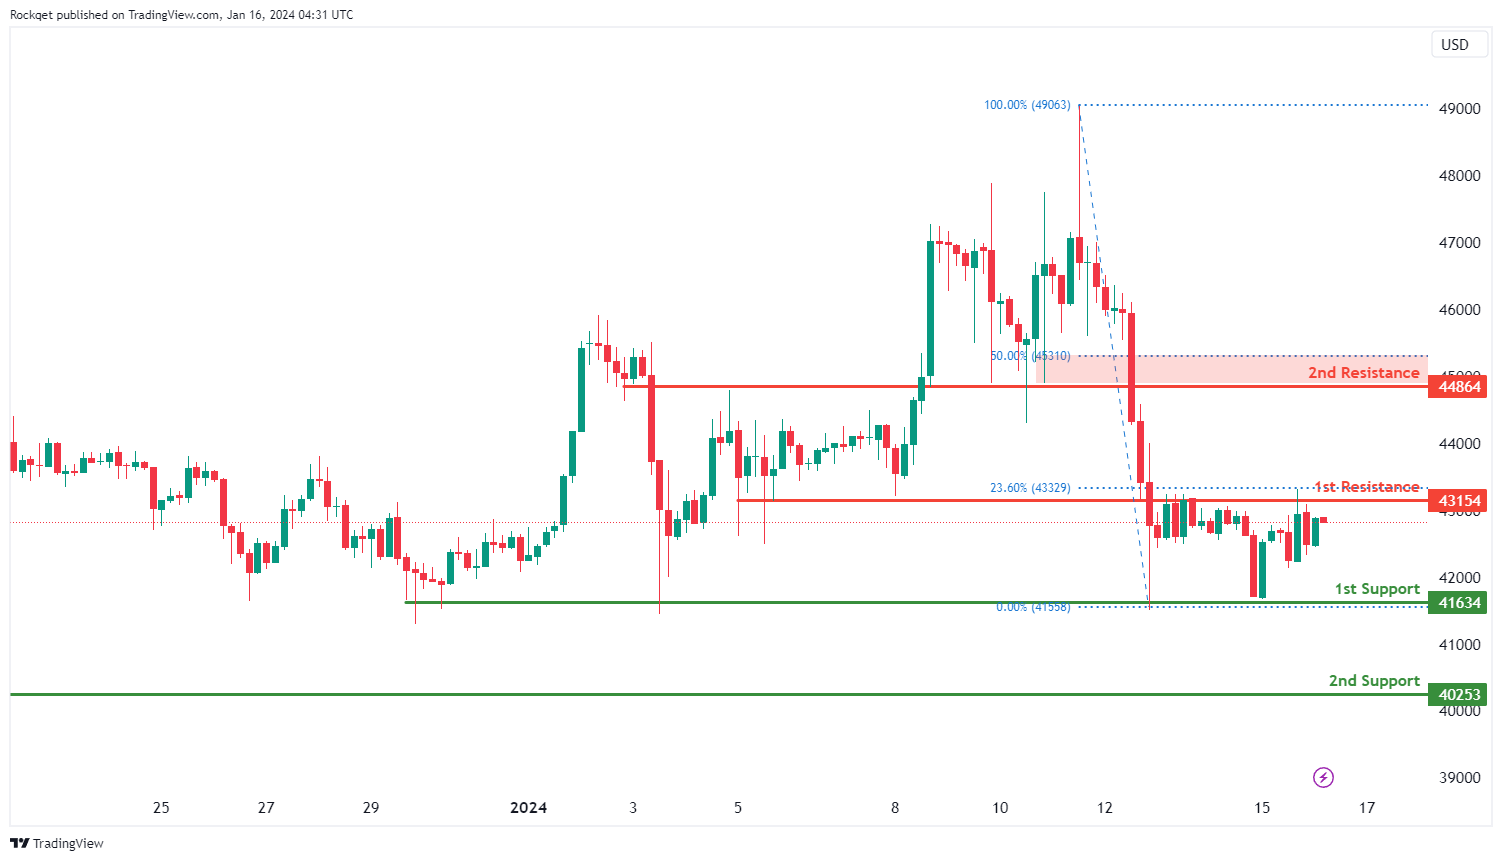
The BTC/USD chart currently exhibits a weak bullish overall momentum with low confidence, suggesting a tentative upward trend. There is a potential for a bullish continuation, and several key support and resistance levels should be considered for trading decisions.
The 1st support at 41634 is identified as a multi-swing low support, indicating a level where buyers have previously shown interest. This level is expected to provide initial support in case of any pullback.
The 2nd support at 40253 is characterized as a pullback support, adding to its significance. It represents a level where the price has retraced before finding buying support, potentially making it a key area for traders to watch.
On the resistance side, the 1st resistance at 43154 is considered significant due to its identification as an overlap resistance and alignment with the 23.60% Fibonacci Retracement. This confluence of technical factors adds strength to this resistance level.
The 2nd resistance at 44864 is recognized as an overlap resistance, further reinforcing its potential significance. Traders should carefully monitor these resistance levels as they may present challenges for further bullish movement.
ETH/USD:
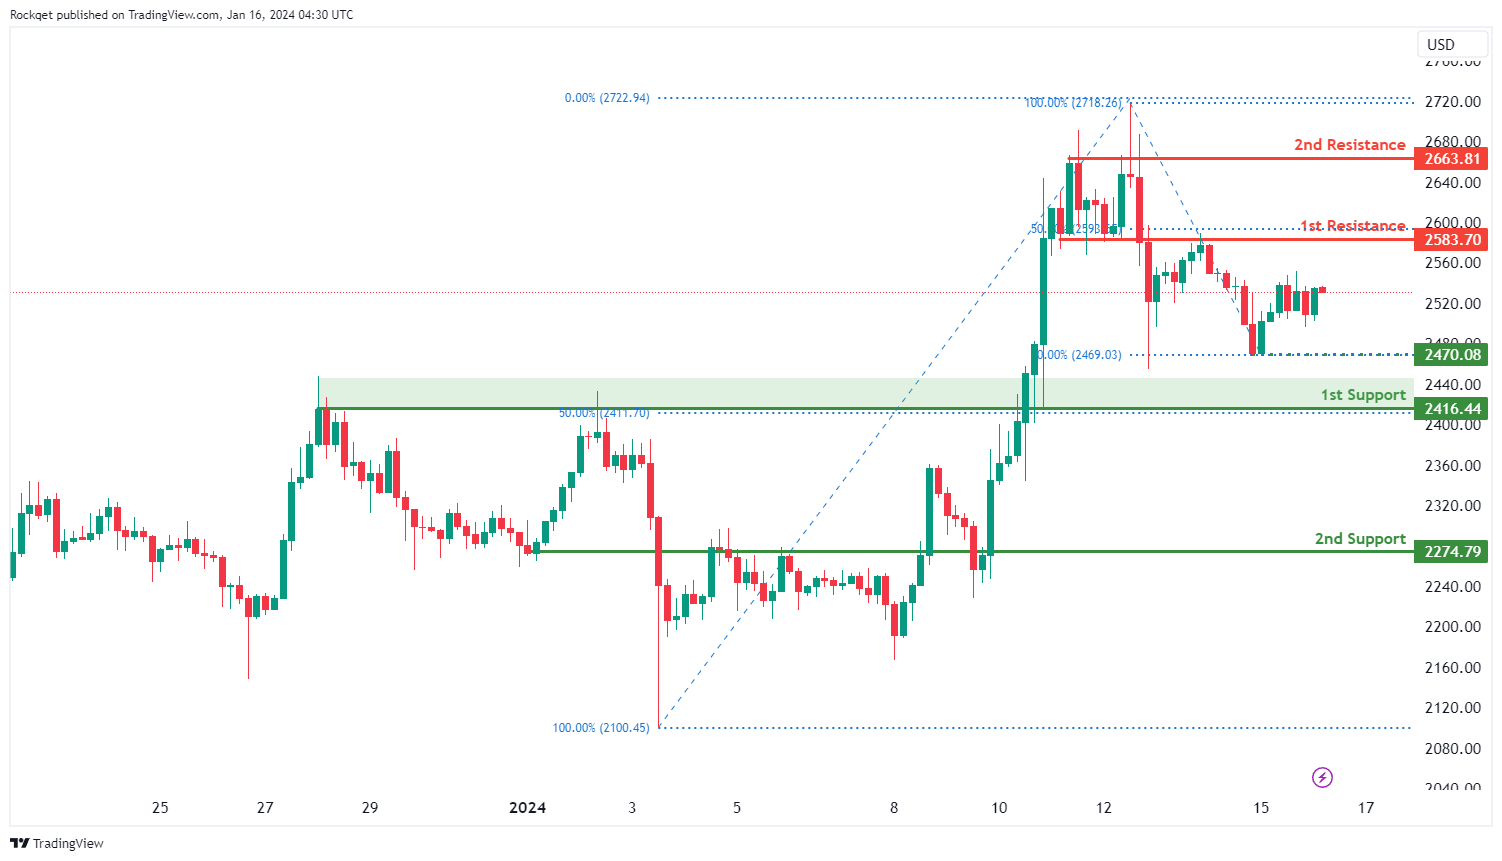
The ETH/USD chart currently reflects a neutral overall momentum, indicating a lack of a clear trend direction. The price is anticipated to potentially exhibit fluctuations between the 1st resistance and 1st support levels, and traders should carefully consider these key levels for potential trading decisions.
The 1st support at 2416.44 is identified as an overlap support and coincides with the 50% Fibonacci Retracement level, adding significance to this level. This suggests historical importance as a level where buying interest has emerged before.
The 2nd support at 2274.79 is recognized as an overlap support, contributing to its potential as a key support level. Overlap supports often signify areas where the price has found stability in the past.
On the resistance side, the 1st resistance at 2583.70 is considered significant due to its identification as an overlap resistance and alignment with the 50% Fibonacci Retracement. This confluence of technical factors adds strength to this resistance level.
The 2nd resistance at 2663.81 is acknowledged as a swing high resistance, indicating a level where the price has faced selling pressure in previous instances.
WTI/USD:
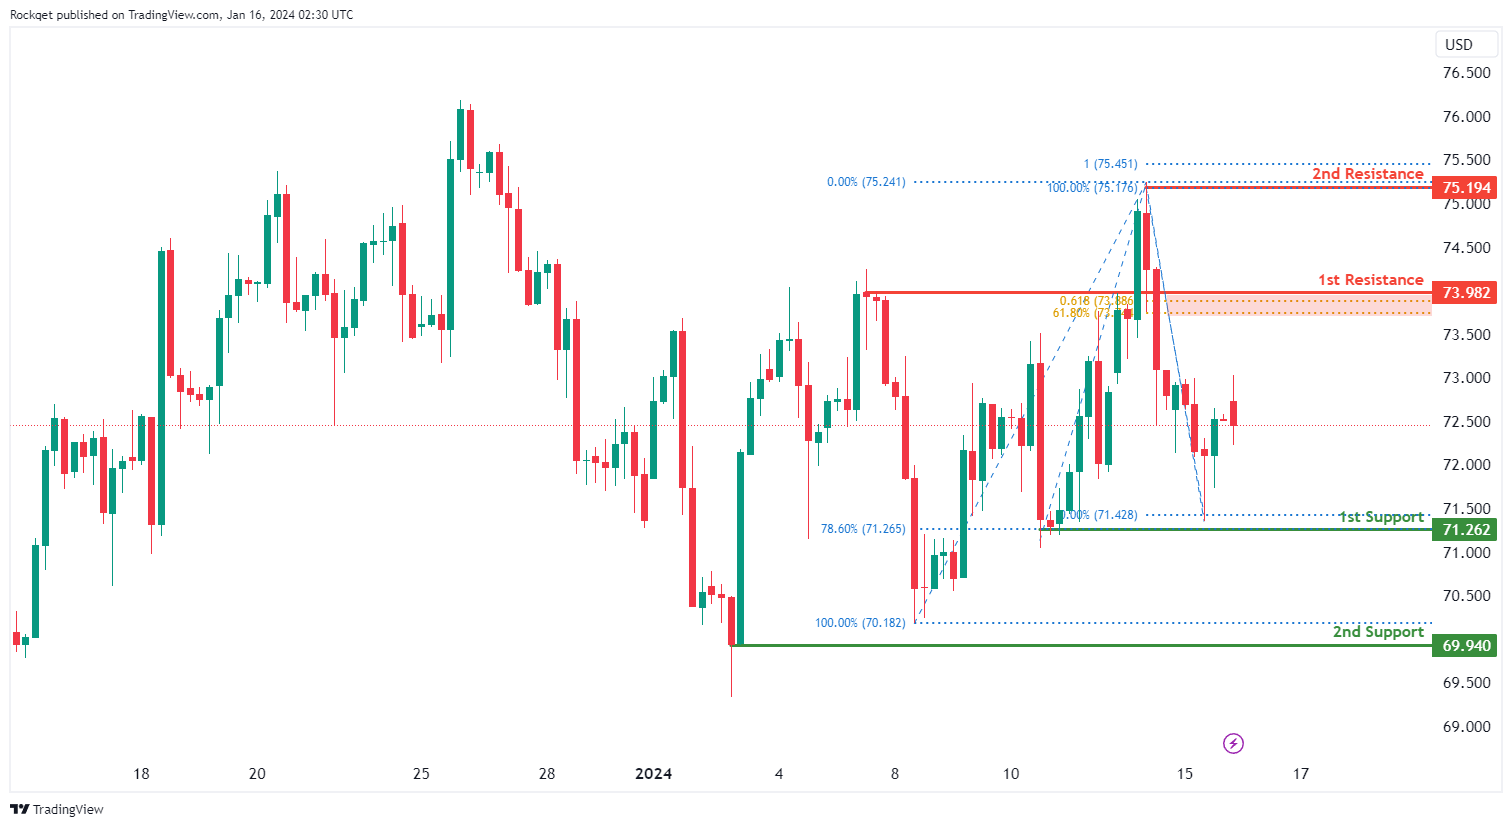
The WTI (West Texas Intermediate) chart currently exhibits a neutral bias, indicating a potential for price to fluctuate between the 1st resistance and the 1st support.
The 1st resistance level at 73.98 is identified as a pullback resistance that aligns with a confluence of Fibonacci levels i.e. the 61.80% retracement and the 61.80% projection. Higher up, the 2nd resistance level at 75.19 is noted as a swing-high resistance that aligns with the 100.00% Fibonacci projection, suggesting a potential barrier for further upside movement.
To the downside, the 1st support level at 71.26 is identified as a pullback support that aligns close to the 78.60% Fibonacci retracement level. Further below, the 2nd support level at 69.94 is marked as a swing-low support, further reinforcing its importance as a key support level.
XAU/USD (GOLD):
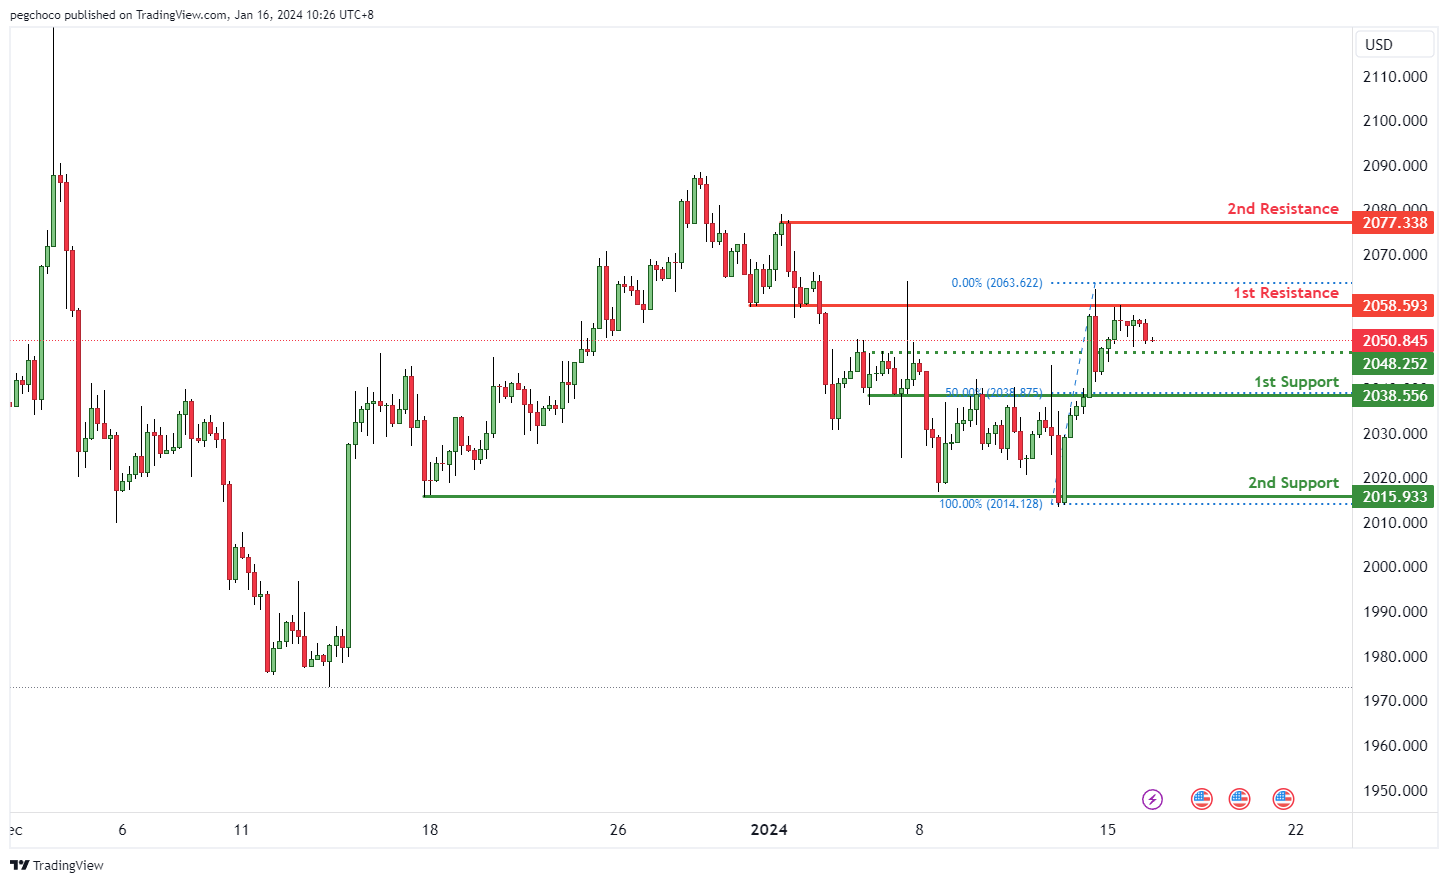
The XAU/USD (Gold/US Dollar) chart currently shows a bearish overall momentum, suggesting weakness in the price of gold relative to the US Dollar. This bearish momentum indicates the potential for a bearish continuation towards the 1st support level.
1st support at 2038.25 is marked as a pullback support. This level is significant as it suggests a potential area where buying interest may emerge, providing temporary support for XAU/USD.
2nd support at 2015.93 is categorized as multi-swing low support, further reinforcing its significance as a potential support zone.
On the resistance side, 1st resistance at 2058.59 is identified as an overlap resistance, which may act as a potential barrier for further upward price movement.
2nd resistance at 2077.33 is marked as a swing high resistance, indicating a significant potential resistance point.
Intermediate support at 2050.00 is also identified as a pullback support, providing an additional potential level of support for XAU/USD.
AUD/USD Daily Report
Daily Pivots: (S1) 0.6638; (P) 0.6672; (R1) 0.6693; More...
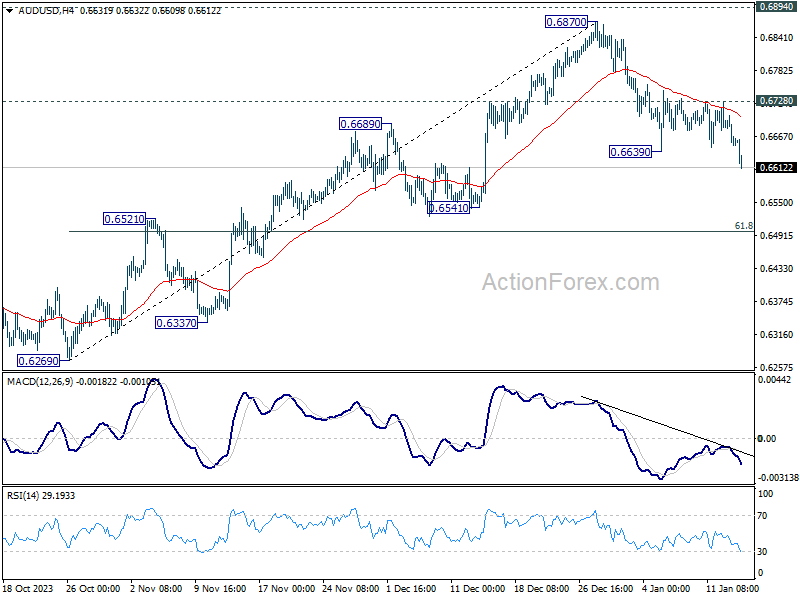
AUD/USD's decline from 0.6870 resumed by breaking through 0.6639 support. Intraday bias is back on the downside. Deeper fall should be seen to 61.8% retracement of 0.6269 to 0.6870 at 0.6497 next. On the upside, break of 0.6728 is needed to indicate completion of the decline. Otherwise, further fall would remain in favor in case of recovery.
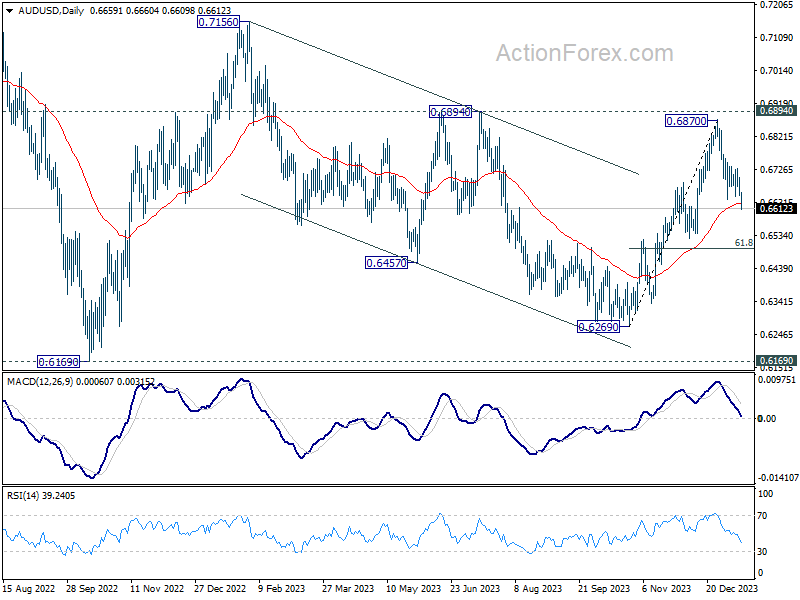
In the bigger picture, price actions from 0.6169 (2022 low) could be just a medium term corrective pattern to the down trend from 0.8006 (2021 high). Rise from 0.6269 is seen as the third leg of the pattern that could target 0.7156 on break of 0.6894 resistance. For now, range trading should be seen between 0.6169 and 0.7156 (2023 high), until further developments.
Dollar Defies Increasing Rate Cut Expectations, Gains Ground on Risk-Off Sentiment
Dollar rises broadly on risk-off sentiment today, as as Hong Kong stocks led the region lower. The greenback's strength comes despite growing calls for Fed to initiate policy loosening earlier. Notably, Goldman Sachs has joined this chorus, predicting an initial rate cut as early as March and a total of five cuts throughout the year. Concurrently, US 10-year yield has also breached the 4% mark, riding on the overall market sentiment.
The greenback's surge was particularly pronounced against risk-sensitive currencies. Australian and New Zealand Dollar led the decline, with Aussie facing additional pressure from disappointing consumer sentiment data. Canadian Dollar, though showed relative resilience as markets eagerly await Canada's CPI data. On the other hand, Japanese Yen emerged as the second strongest after the Dollar, supported partly by Japan's PPI reading, which, despite falling to its lowest level in nearly two years, still exceeded market expectations.
In the European currency space, Sterling is currently the weakest performer. Market participants are closely watching the upcoming UK employment data, with particular focus on wages growth. Given UK's current CPI level of 3.9%, robust wages growth could potentially hinder the disinflation progress and compel BoE to maintain its current interest rate for a longer period.
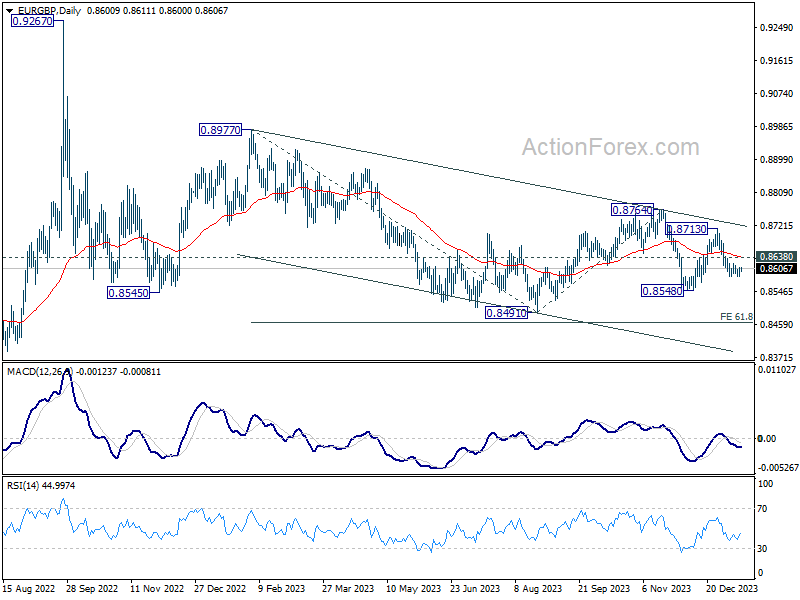
From a technical analysis standpoint, EUR/GBP is a pair to watch as Sterling reacts to UK job data. For now, the favored case is that fall from 0.8713 is resuming the larger down trend. As long as 0.8638 minor resistance holds, deeper decline is expected to 0.8548 support first. Firm break there will push EUR/GBP through 0.8491 low to 61.8% projection of 0.8977 to 0.8491 from 0.8764 at 0.8464 next. This week's UK economic data will be pivotal in either reinforcing or challenging this bearish outlook for Sterling.
In Asia, at the time of writing, Nikkei is down -0.62%. Hong Kong HSI is down -1.90%. China Shanghai SSE is down -0.67%. Singapore Strait Times is down -0.29%. Japan 10-year JGB yield is up 0.0258 at 0.583.
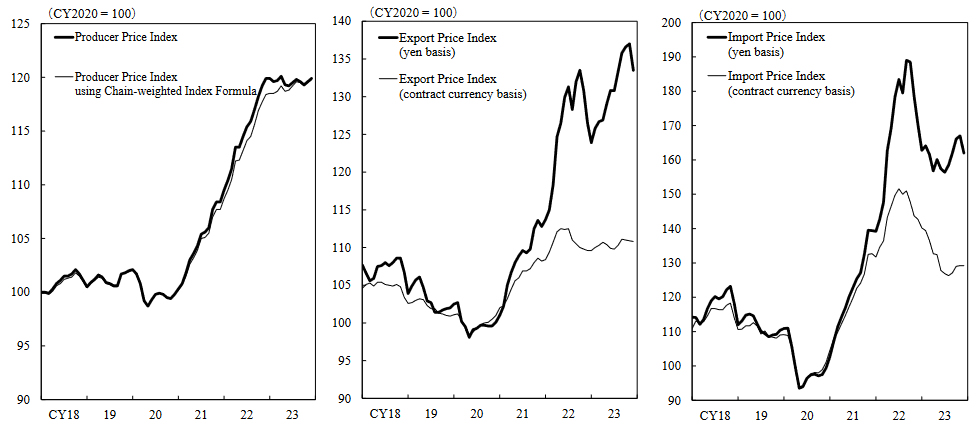
Japan's PPI slowed to 0.0% yoy in Dec, reflecting subsidy effects
Japan's PPI records a slowdown from 0.3% yoy to 0.0% yoy in December, above expectation of -0.3% yoy. Nevertheless, this figure represents the lowest PPI reading since -0.9% yoy decline in February 2021.
The deceleration in Japan's wholesale prices can be attributed partially to the government's intervention in the form of subsidies aimed at curbing petrol and utility bills. According to a BoJ official, these subsidies reduced wholesale inflation rate by approximately 0.9 percentage points.
In terms of trade-related price indices, there was a slight increase in export price index from 1.0% yoy to 1.1% yoy. Import price index improved from -10.1% yoy to -9.5% yoy.
On a month-over-month basis, the PPI rose by 0.3% mom, Meanwhile, export price index saw a marginal decline of -0.1% mom, and import price index was flat.
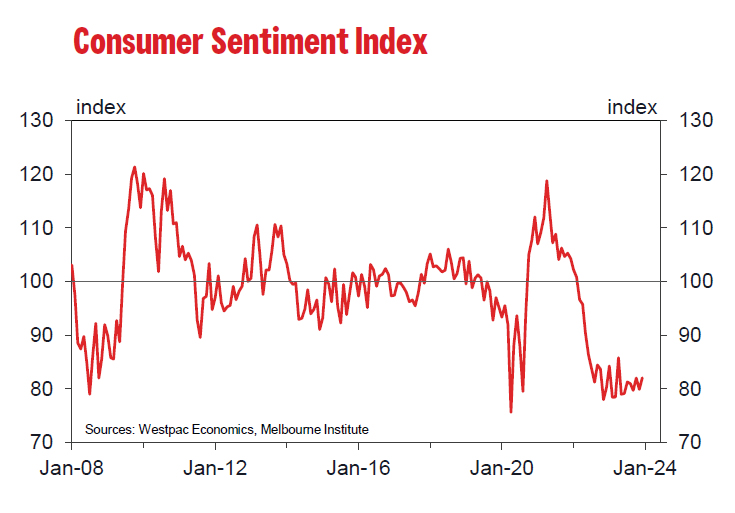
Australia's Westpac consumer sentiment plunges to 81, bleakest start since 90s
Australia's Westpac Consumer Sentiment index dropped by -1.3% mom to 81 in January. This figure is especially significant as it ranks in the bottom 7% of all observations since the inception of the survey in the mid-1970s. The only other instances of more pessimistic starts to the year were observed during the severe recession of the early 1990s.
Westpac attributed this "intense pressure" on consumers to surging cost of living, significantly higher interest rates, and increased tax burden, all of which are collectively impacting consumer incomes.
Despite the subdued consumer sentiment, Westpac highlighted that high inflation remains the primary concern for RBA. This focus on inflation suggests that the upcoming quarterly CPI release at the end of January will be a crucial determinant of RBA's policy decision in February.
"On balance, we expect the RBA to leave rates unchanged in February, and to be unlikely to raise rates further from here," Westpac noted. However, it also cautioned that an unexpected surge in inflation could complicate the decision, making it "a more finely balanced decision".
NZIER survey reveals improved business outlook and steady RBNZ policy anticipated
The latest quarterly survey of business opinion by New Zealand Institute of Economic Research revealed notable improvement in business sentiment. Only a net 2% of firms now expect general business conditions to deteriorate, compared to the 52% pessimism recorded in the previous quarter.
Christina Leung, principal economist at NZIER, expressed confidence that inflation in New Zealand is on track to return to RBNZ's target range of 1% to 3% by the second half of 2024, with a projection of reaching 2% in the first half of 2025.
"It's a pretty encouraging picture for the Reserve Bank and it reinforces our expectations that there won't be further increases," in interest rate, Leung stated.
However, Leung also mentioned that NZIER does not anticipate a reduction in the cash rate until the middle of the next year, advocating for a "wait and see approach." This cautious stance reflects a recognition of the need to monitor economic trends before making significant policy changes.
Looking ahead
UK employment data and German ZEW economic sentiment are the main focuses in European sesion. Later in the day, Canada CPI and US Empire statemanufacturing index will take center stage.
AUD/USD Daily Report
Daily Pivots: (S1) 0.6638; (P) 0.6672; (R1) 0.6693; More...
AUD/USD's decline from 0.6870 resumed by breaking through 0.6639 support. Intraday bias is back on the downside. Deeper fall should be seen to 61.8% retracement of 0.6269 to 0.6870 at 0.6497 next. On the upside, break of 0.6728 is needed to indicate completion of the decline. Otherwise, further fall would remain in favor in case of recovery.
In the bigger picture, price actions from 0.6169 (2022 low) could be just a medium term corrective pattern to the down trend from 0.8006 (2021 high). Rise from 0.6269 is seen as the third leg of the pattern that could target 0.7156 on break of 0.6894 resistance. For now, range trading should be seen between 0.6169 and 0.7156 (2023 high), until further developments.
Economic Indicators Update
| GMT | Ccy | Events | Actual | Forecast | Previous | Revised |
|---|---|---|---|---|---|---|
| 21:00 | NZD | NZIER Business Confidence Q4 | -2 | -52 | ||
| 23:30 | AUD | Westpac Consumer Confidence Jan | -1.30% | 2.70% | ||
| 23:50 | JPY | PPI Y/Y Dec | 0.00% | -0.30% | 0.30% | |
| 07:00 | GBP | Claimant Count Change Dec | 18.1K | 16K | ||
| 07:00 | GBP | ILO Unemployment Rate (3M) Nov | 4.30% | 4.20% | ||
| 07:00 | GBP | Average Earnings Excluding Bonus 3M/Y Nov | 6.60% | 7.30% | ||
| 07:00 | GBP | Average Earnings Including Bonus 3M/Y Nov | 6.80% | 7.20% | ||
| 07:00 | EUR | Germany CPI M/M Dec F | 0.10% | 0.10% | ||
| 07:00 | EUR | Germany CPI Y/Y Dec F | 3.70% | 3.70% | ||
| 10:00 | EUR | Germany ZEW Economic Sentiment Jan | 12.7 | 12.8 | ||
| 10:00 | EUR | Germany ZEW Current Situation Jan | -77 | -77.1 | ||
| 10:00 | EUR | Eurozone ZEW Economic Sentiment Jan | 21.9 | 23 | ||
| 13:15 | CAD | Housing Starts Dec | 244K | 213K | ||
| 13:30 | CAD | CPI M/M Dec | -0.30% | 0.10% | ||
| 13:30 | CAD | CPI Y/Y Dec | 3.30% | 3.10% | ||
| 13:30 | CAD | CPI Median Y/Y Dec | 3.40% | 3.40% | ||
| 13:30 | CAD | CPI Trimmed Y/Y Dec | 3.50% | 3.50% | ||
| 13:30 | CAD | CPI Common Y/Y Dec | 3.80% | 3.90% | ||
| 13:30 | USD | Empire State Manufacturing Index Jan | -5 | -14.5 |
NZDUSD Extending Lower in Zigzag Correction
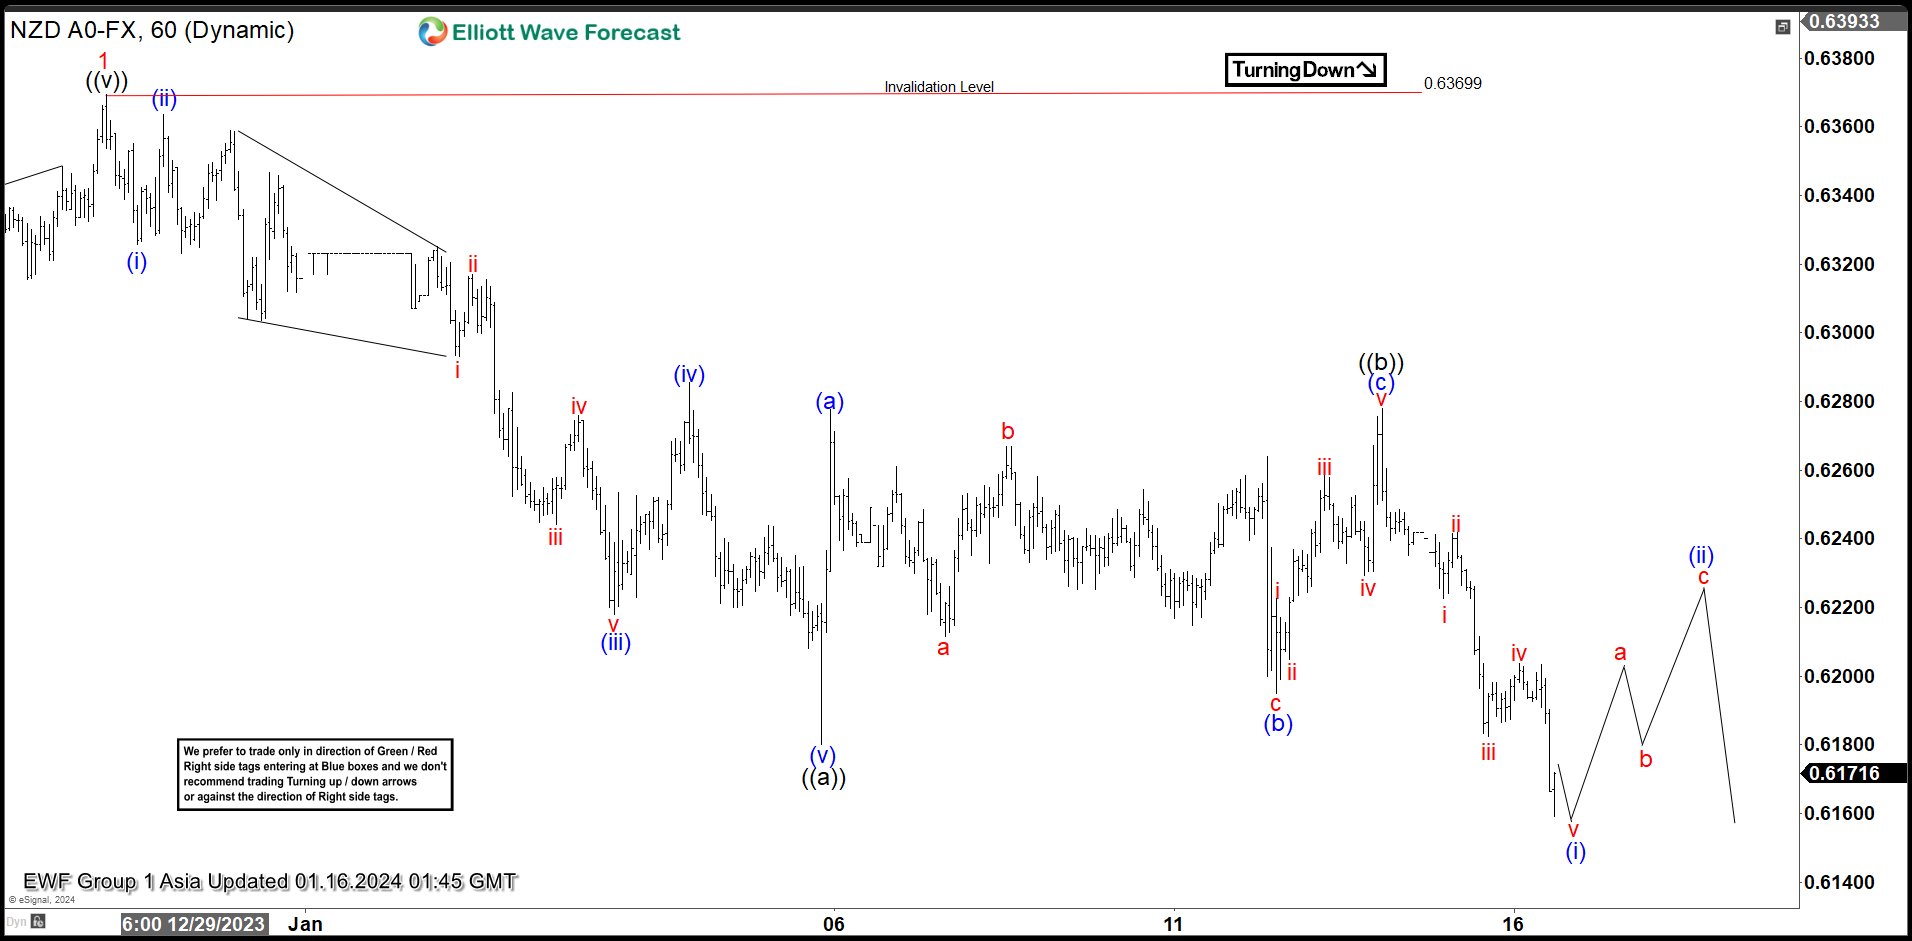
Short term Elliott Wave View in NZDUSD suggests that rally to 0.637 ended wave 1. Pair is now doing wave 2 pullback to correct cycle from 10.26.2023 low. Internal subdivision of wave 2 is unfolding as a zigzag Elliott Wave structure. Down from wave 1, wave (i) ended at 06325 and rally in wave (ii) ended at 0.636. Pair then resumes lower in wave (iii) towards 0.6218 and wave (iv) rally ended at 0.6285. Final leg down wave (v) ended at 0.618 which completed wave ((a)).
Wave ((b)) correction ended at 0.6278 with internal subdivision as a zigzag. Up from wave ((a)), wave (a) ended at 0.6277, wave (b) ended at 0.6195, and wave (c) higher ended at 0.6278. This completed wave ((b)) in higher degree. Pair has resumed lower in wave ((c)). Down from wave ((b)), wave i ended at 0.622 and wave ii ended at 0.6242. Wave iii lower ended at 0.618 and wave iv ended at 0.62036. Expect wave v lower to end soon which should complete wave (i). Pair should then rally in wave (ii) to correct cycle from 1.12.2024 high in 3, 7, or 11 swing before pair resumes lower. Near term, as far as pivot at 0.637 high stays intact, expect rally to fail in 3, 7, 11 swing for further downside.
NZDUSD 60 Minutes Elliott Wave Chart
NZDUSD Elliott Wave Video
https://www.youtube.com/watch?v=qdF60IkBcTI
NZIER survey reveals improved business outlook and steady RBNZ policy anticipated
The latest quarterly survey of business opinion by New Zealand Institute of Economic Research revealed notable improvement in business sentiment. Only a net 2% of firms now expect general business conditions to deteriorate, compared to the 52% pessimism recorded in the previous quarter.
Christina Leung, principal economist at NZIER, expressed confidence that inflation in New Zealand is on track to return to RBNZ's target range of 1% to 3% by the second half of 2024, with a projection of reaching 2% in the first half of 2025.
"It's a pretty encouraging picture for the Reserve Bank and it reinforces our expectations that there won't be further increases," in interest rate, Leung stated.
However, Leung also mentioned that NZIER does not anticipate a reduction in the cash rate until the middle of the next year, advocating for a "wait and see approach." This cautious stance reflects a recognition of the need to monitor economic trends before making significant policy changes.
Australia’s Westpac consumer sentiment plunges to 81, bleakest start since 90s
Australia's Westpac Consumer Sentiment index dropped by -1.3% mom to 81 in January. This figure is especially significant as it ranks in the bottom 7% of all observations since the inception of the survey in the mid-1970s. The only other instances of more pessimistic starts to the year were observed during the severe recession of the early 1990s.
Westpac attributed this "intense pressure" on consumers to surging cost of living, significantly higher interest rates, and increased tax burden, all of which are collectively impacting consumer incomes.
Despite the subdued consumer sentiment, Westpac highlighted that high inflation remains the primary concern for RBA. This focus on inflation suggests that the upcoming quarterly CPI release at the end of January will be a crucial determinant of RBA's policy decision in February.
"On balance, we expect the RBA to leave rates unchanged in February, and to be unlikely to raise rates further from here," Westpac noted. However, it also cautioned that an unexpected surge in inflation could complicate the decision, making it "a more finely balanced decision".
Japan’s PPI slowed to 0.0% yoy in Dec, reflecting subsidy effects
Japan's PPI records a slowdown from 0.3% yoy to 0.0% yoy in December, above expectation of -0.3% yoy. Nevertheless, this figure represents the lowest PPI reading since -0.9% yoy decline in February 2021.
The deceleration in Japan's wholesale prices can be attributed partially to the government's intervention in the form of subsidies aimed at curbing petrol and utility bills. According to a BoJ official, these subsidies reduced wholesale inflation rate by approximately 0.9 percentage points.
In terms of trade-related price indices, there was a slight increase in export price index from 1.0% yoy to 1.1% yoy. Import price index improved from -10.1% yoy to -9.5% yoy.
On a month-over-month basis, the PPI rose by 0.3% mom, Meanwhile, export price index saw a marginal decline of -0.1% mom, and import price index was flat.
China’s Economy Likely Accelerated in Q4, But Will This Lift the Gloom?
- Chinese GDP growth probably quickened in Q4
- But doubts remain about 2024 outlook
- Risk assets could rally if data due on Wednesday, 02:00 GMT is upbeat
China’s rebound hits a wall
China’s economic recovery has been a big talking point for the markets over the past year, as the lifting of most Covid curbs at the end of 2022 failed to propel growth as intended. Instead, the world’s second largest economy became a drag on global growth, as authorities struggled to get to grips with a worsening property crisis.
Annual growth slowed to 4.9% in the third quarter, having notched up 6.3% growth in the second quarter. However, it’s likely that a pickup in consumption as well as some signs of stabilization in the beleaguered real estate sector boosted GDP in the fourth quarter.
Is the economy at a turning point?
GDP is expected to have expanded by 5.3% year-on-year in the final three months of 2023. If confirmed, this would mean the government would have comfortably achieved its growth target of around 5.0%. However, a poor reading in the same period a year ago is expected to flatter the Q4 number, taking some of the shine off any rebound, unless there is a big upside surprise.
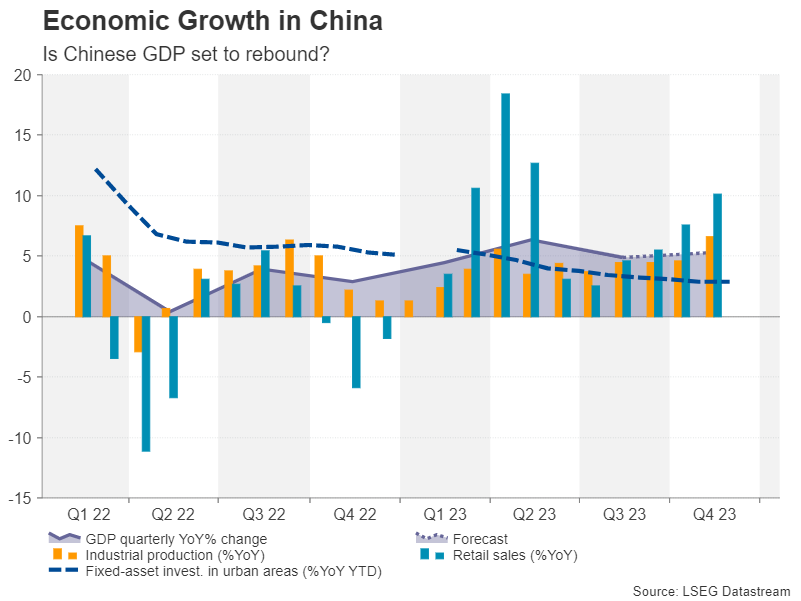
Investors will also be scrutinizing the monthly prints for retail sales, industrial production and fixed asset investment for additional clues on the health of the economy. Retail sales and industrial output have been steadily improving since the summer, in a possible sign that the drip-feed stimulus being administered by Beijing is starting to filter through the economy.
A property market still in turmoil
However, one area that hasn’t seen much of a bounce is investment in fixed assets, which has been flatlining all year amid the ongoing pain in the property market. After amassing a vast amount of debt over the decades, liquidity has started to dry up for China’s oversized property developers, amid constrains from both lenders and buyers.
The problem is partly self-induced as Beijing is determined to see through its goal of deleveraging the country’s heavily indebted sectors. The need to maintain tough lending standards as well as refrain from bailing out troubled businesses has limited the government’s scope to roll out a large stimulus package. Most of the measures announced so far have been targeted and on a regional scale.
Rising risks
But the real estate woes are not the only headache for the economy. Fears are growing of a spillover of the property crisis onto other sectors, mainly on the shadow banking industry after a major financial conglomerate recently filed for bankruptcy. Businesses are also under pressure from the government’s relentless crackdowns on some industries, particularly on large tech companies.
There have been hints that President Xi Jinping plans to broaden the crackdowns on other sectors, including energy and finance, in an anti-corruption drive. Meanwhile, Washington and Beijing remain at loggerheads over trade and 2023 was a poor year for exporters.
Aussie hoping for a China lift
With the growing list of challenges facing the economy, a stronger-than-expected GDP print on Wednesday would likely provide only short-term relief for China-sensitive assets such as industrial commodities, regional equities and the Australian dollar.
The aussie finished 2023 virtually flat against the US dollar so some good news on the Chinese GDP front could help the currency build some positive momentum at the start of 2024.
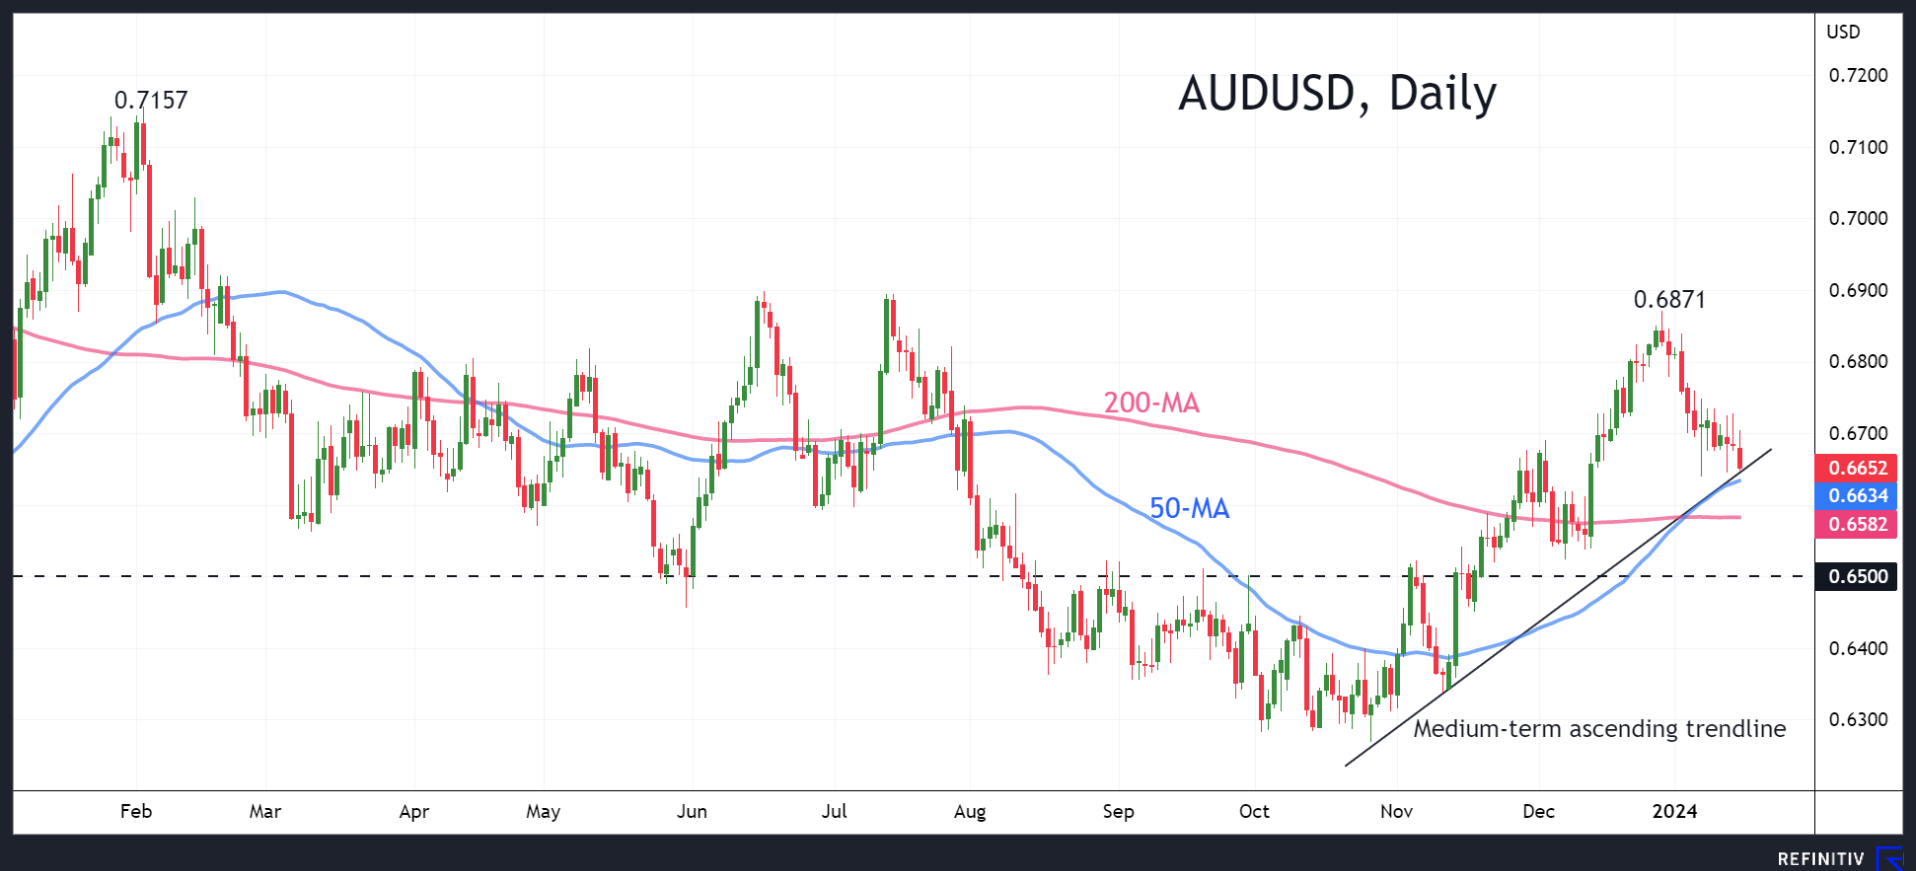
An upbeat set of numbers could help the aussie to re-challenge its December peak of $0.6871 and then aim for last February’s high of $0.7157.
However, if the GDP data disappoints, the aussie is likely to test its medium-term uptrend line in the $0.6650 region. A drop below it would turn the spotlight on the 50- and 200-day moving averages at $0.6634 and $0.6582, respectively. If there is an even sharper slide, the price could fall all the way until the $0.6500 level.
NZ First Impressions: NZIER Survey of Business Opinion, Q4 2023
The latest update on business sentiment pointed to resilience in activity and easing inflation pressures.
Key results (seasonally adjusted)
- General business confidence: -10.2 (Previous: -49.0)
- Trading activity, past three months: 6.3 Previous: -16.8)
- Trading activity, next three months: 4.9 (Previous: -12.1)
- % of businesses reporting a rise in operating costs over the past 3 months: 54.5 (Previous: 66.3)
- % of business who increased output prices over the past 3 months: 38.8 (Previous: 55.8)
The NZIER’s latest update on business conditions pointed to a Goldilocks combination of economic conditions at the start of 2024. Trading activity has been resilient and businesses are looking to take on staff. At the same time, the strong inflation pressures that have been buffeting the economy are easing.
On the activity front, businesses have reported a pick-up in trading activity through the final months of 2023. That includes a sizeable rise in manufacturing activity and retail sales, as well as gains in other sectors.
Businesses are also feeling more optimistic about the outlook for trading conditions over the coming months, though the survey is still pointing to modest growth. Conditions are mixed across the economy however. Balanced against firmer activity in sectors like retail, there is expected to be continued softness in areas like construction.
One reason for the firming in business sentiment may have been the change in government, with the new centre-right coalition expected to be much more business friendly. At the same time, many businesses will likely have welcomed the gradual easing in inflation and the related expectation that the interest rate tightening cycle has come to a close.
At the same time, there has been a sharp rise in the number of businesses who are planning on taking on staff in the new year. That comes at the same time as record levels of net migration have made it much easier for businesses to find staff with the skills they’ve been looking for. There’s also been a sharp fall in employee turnover – as economic growth has slowed, increasing numbers of workers who are currently in employment are choosing to stay put. Combined, those conditions likely point to an easing in wage growth over the year ahead.
On the inflation front, today’s survey still pointed to strong price and cost pressures, consistent with inflation lingering above 3% for some time yet. However, while still strong, those inflation pressures are dropping back. There’s also been a related lift in profitability.
As with other parts of today’s survey, inflation pressures have been mixed across industries – retailers and those in the services sector are still reporting strong pressure on input costs and output prices. In contrast, some gauges of construction cost pressures (which drove much of the strength in domestic inflation over the past year) have fallen to low levels.