

Sample Category Title
Technical Outlook and Review
DXY:
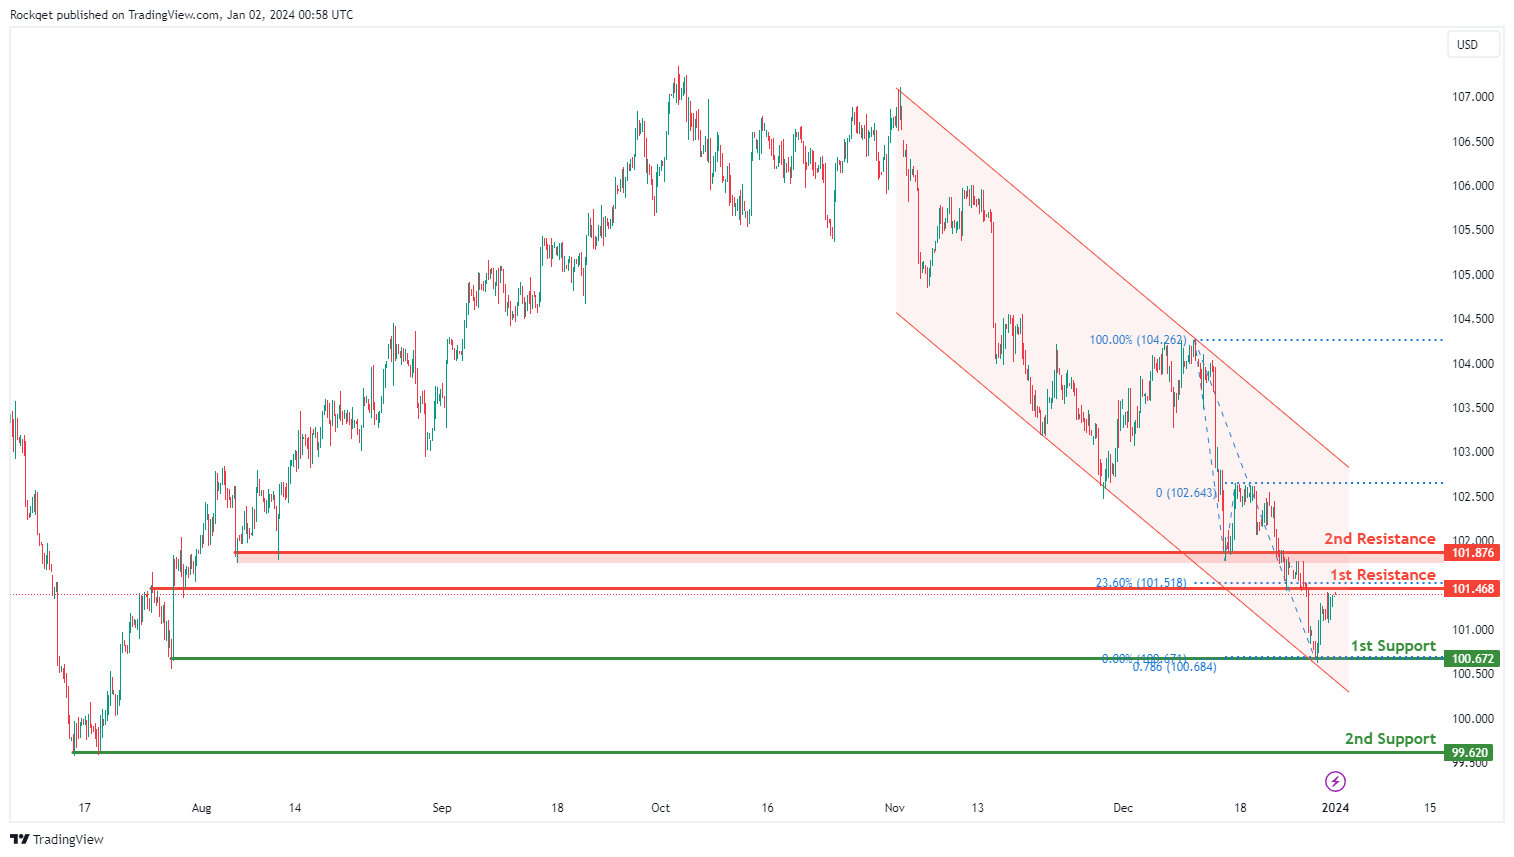
The DXY (US Dollar Index) chart currently shows an overall bearish momentum. However, there is a potential for price to make a bullish rise towards the 1st resistance.
The 1st resistance level at 101.46 is identified as an overlap resistance that aligns with the 23.60% Fibonacci retracement level. Higher up, the 2nd resistance level at 101.87 is also marked as an overlap resistance, suggesting a potential barrier for further upside movement.
To the downside, the 1st support level at 100.67 is identified as a swing-low support that aligns with the 78.60% Fibonacci projection level. Further below, the 2nd support level at 99.62 is noted as pullback support, further reinforcing its importance as a potential key support level.
EUR/USD:
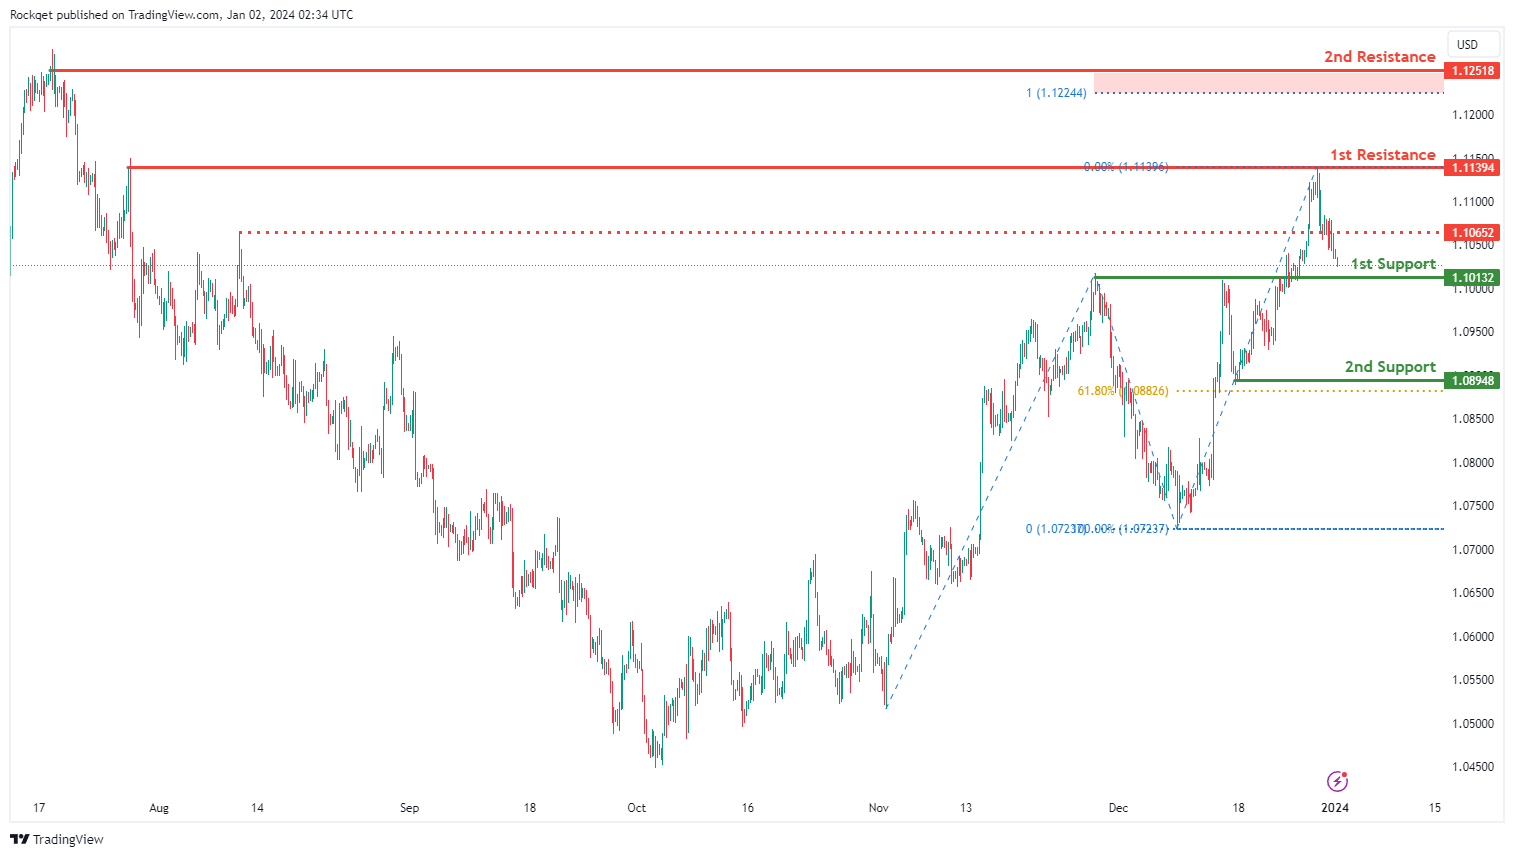
The EUR/USD chart currently exhibits an overall bullish momentum. However, there is a potential scenario for price to drop towards the 1st support and make a bullish bounce off this level.
The 1st support level at 1.1013 is identified as an overlap support. Further below, the 2nd support level at 1.0894 is marked as a pullback support that aligns with the 61.80% Fibonacci retracement level, further reinforcing its importance as a potential key support level.
To the upside, the intermediate resistance level at 1.1065 is identified as a pullback resistance while the 1st resistance level at 1.1139 is noted as a multi-swing-high resistance. Higher up, the 2nd resistance level at 1.1251 is marked as a swing-high resistance that aligns close to the 100.00% Fibonacci projection level, suggesting a potential barrier for further upside movement.
EUR/JPY:
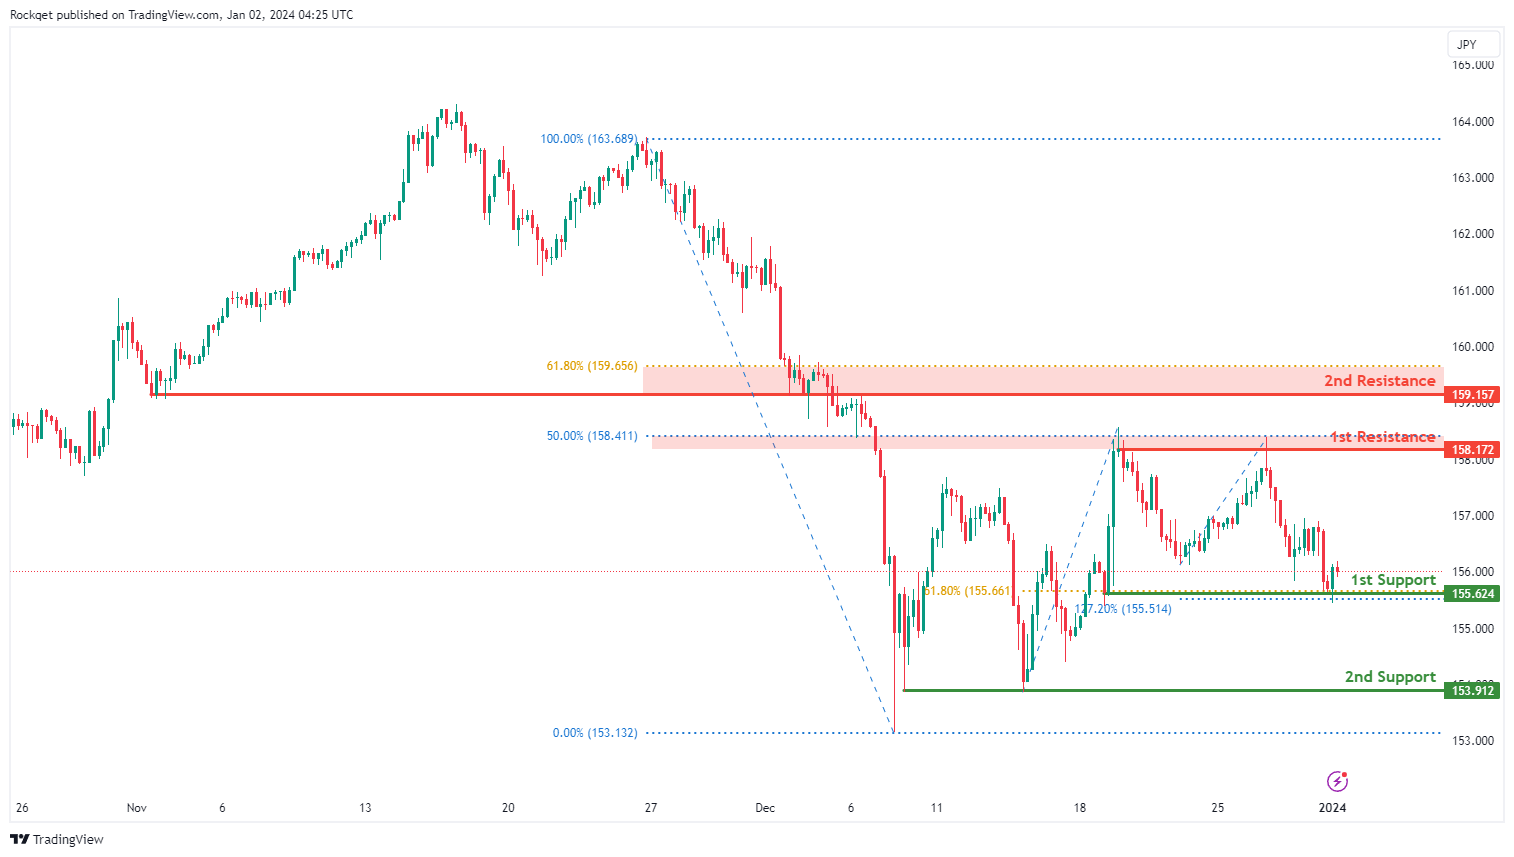
The EUR/JPY chart currently displays a neutral bias. In this context, there is a potential scenario for price to fluctuate between the 1st resistance and the 1st support.
The 1st support at 155.62 is considered as a pullback support that aligns with the 61.80% Fibonacci retracement level. Additionally, the 2nd support at 153.91 is identified as a multi-swing low support, providing an additional layer of potential support.
On the resistance side, the 1st resistance at 158.17 is linked to a pullback resistance that aligns with the 50.00% Fibonacci retracement level. Furthermore, the 2nd resistance at 159.15 is associated with an overlap resistance that aligns with the 61.80% Fibonacci retracement level, adding an extra layer of potential resistance.
EUR/GBP:
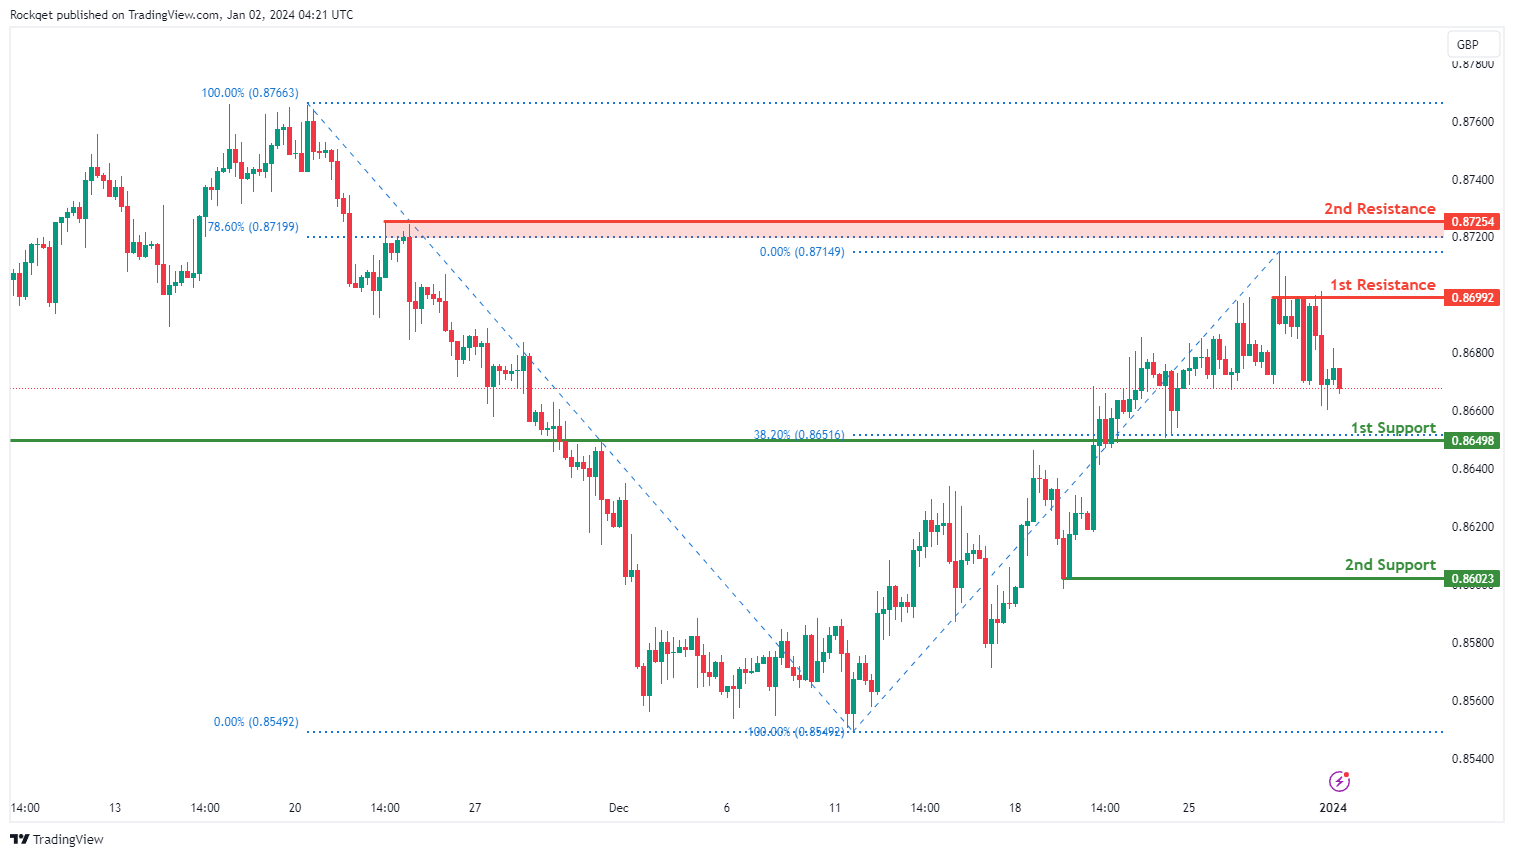
The EUR/GBP chart currently exhibits an overall bearish momentum. In this context, there is a potential scenario for price to make a bearish continuation towards the 1st support.
The 1st support at 0.8649 is considered an overlap support that aligns with the 38.20% Fibonacci retracement level. Additionally, the 2nd support at 0.8602 is identified as a pullback support.
On the resistance side, the 1st resistance at 0.8699 is linked to a pullback resistance. Furthermore, the 2nd resistance at 0.8725 also represents a pullback resistance that aligns with the 78.60% Fibonacci retracement level, suggesting a level where selling interest could intensify.
GBP/USD:
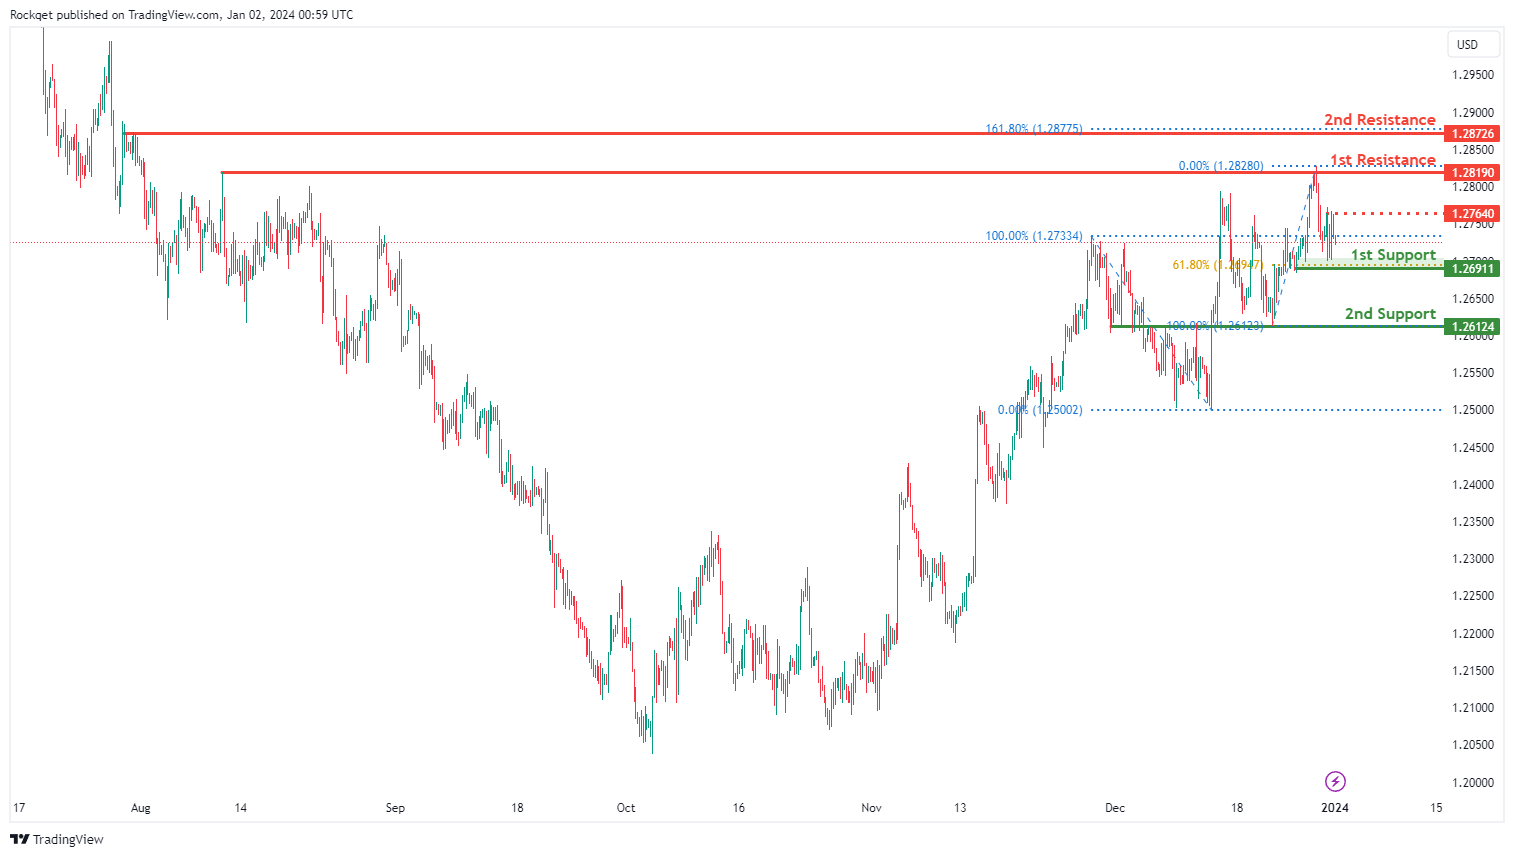
The GBP/USD chart currently exhibits a neutral bias. In this context, there is a potential scenario for price to fluctuate between the 1st resistance and the 1st support.
The intermediate resistance level at 1.2764 is identified as a pullback resistance while the 1st resistance level at 1.2819 is marked as a pullback resistance. Higher up, the 2nd resistance level at 1.2872 is also noted as a pullback resistance that aligns with the 161.80% Fibonacci extension level, suggesting a potential barrier for further upside movement.
To the downside, the 1st support level at 1.2691 is identified as a pullback support that aligns with the 61.80% Fibonacci retracement level. Further below, the 2nd support level at 1.2612 is noted as an overlap support, further reinforcing its importance as a potential key support level.
GBP/JPY:
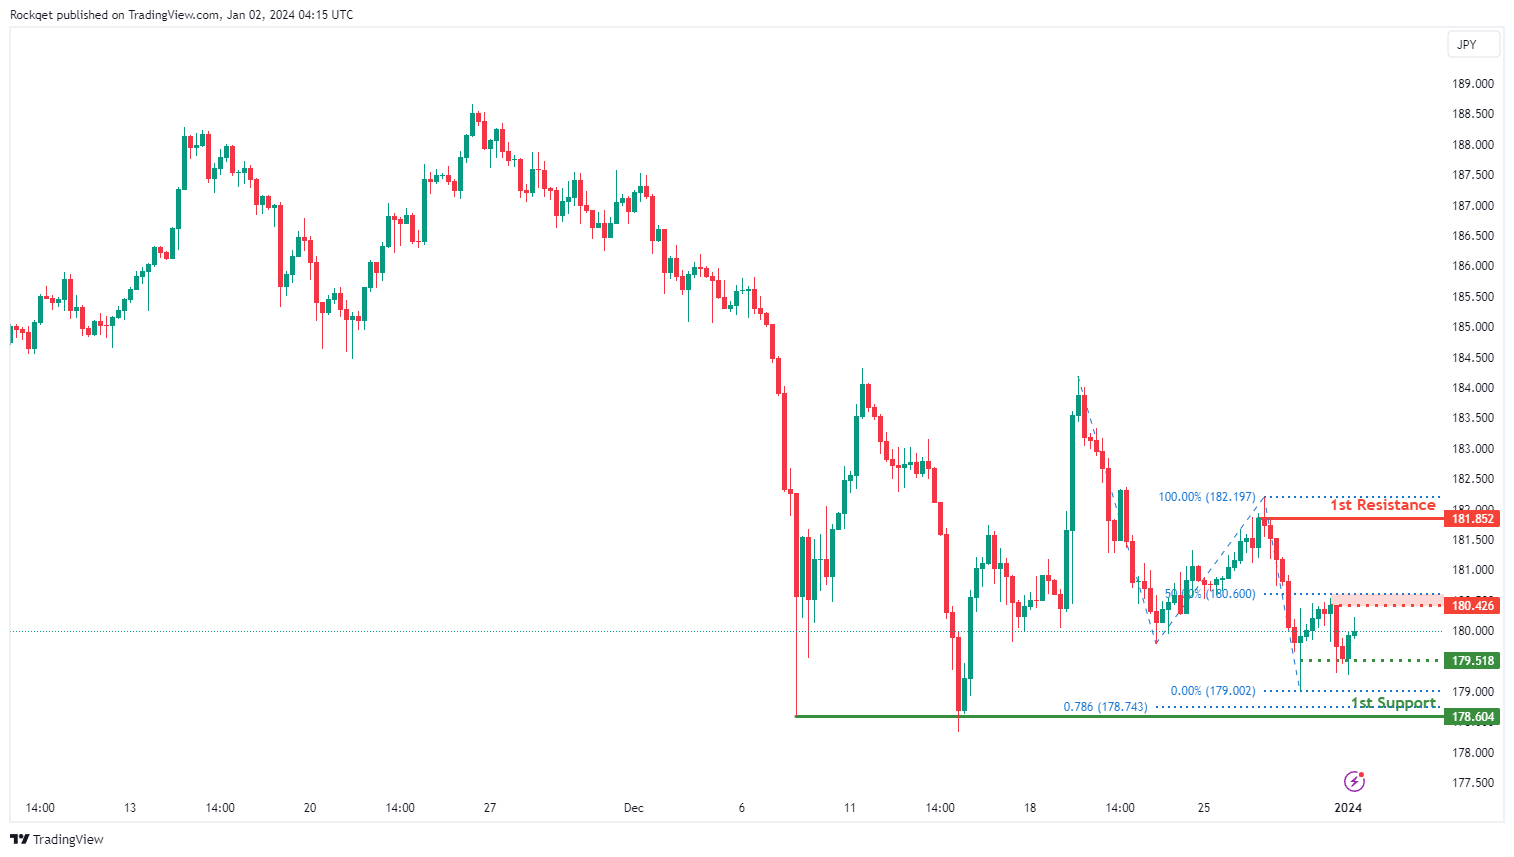
The GBP/JPY chart currently exhibits a neutral bias, suggesting a potential scenario for price to fluctuate between the intermediate resistance and the intermediate support.
The intermediate support at 179.51 is considered as a pullback low support. Additionally, the 1st support at 178.60 is identified as a multi-swing low support, providing an additional layer of potential support for the currency pair.
On the resistance side, the intermediate resistance at 180.42 is associated with a pullback resistance that aligns close to the 50.00% Fibonacci retracement level. Furthermore, the 1st resistance at 181.85 also represents a pullback resistance, indicating a level where selling interest could intensify.
USD/CHF:
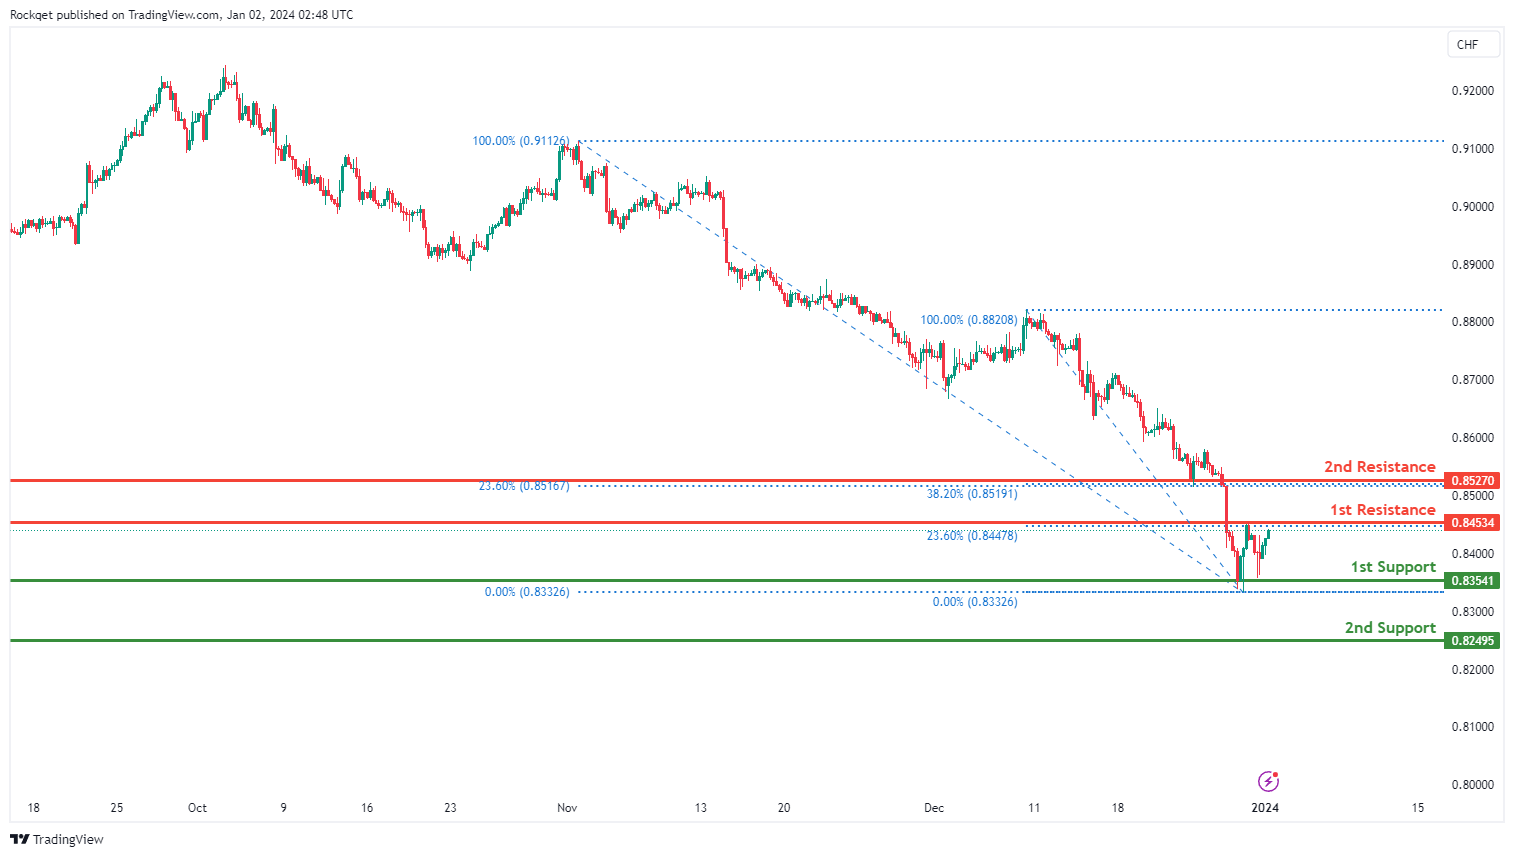
The USD/CHF chart currently exhibits an overall bearish momentum. However, there is a potential scenario for price to rise towards the 1st resistance.
The 1st resistance level at 0.8453 is identified as a pullback resistance that aligns with the 23.60% Fibonacci retracement level. Higher up, the 2nd resistance level at 0.8527 is also also marked as a pullback resistance that aligns with a confluence of Fibonacci levels i.e. the 23.60 and the 38.20% Fibonacci retracement levels, suggesting a potential barrier for further upside movement.
To the downside, the 1st support level at 0.8354 is identified as a pullback support. Further below, the 2nd support level at 0.8249 is noted as a pullback support, further reinforcing its importance as a key support level.
USD/JPY:
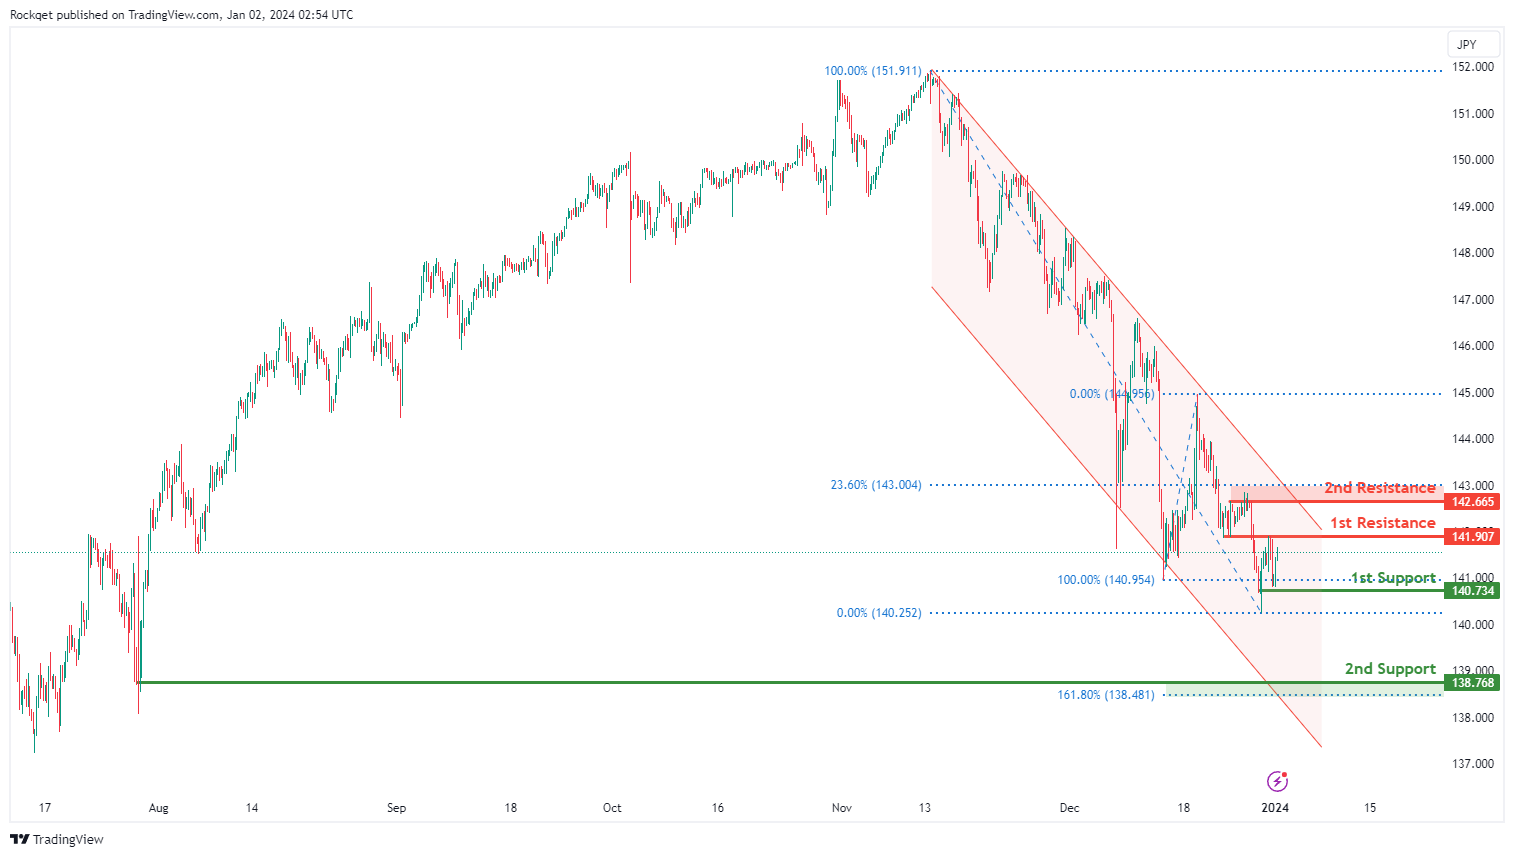
The USD/JPY chart currently exhibits an overall bearish momentum. However, there is a potential for price to rise towards the 1st resistance.
The 1st resistance level at 141.90 is identified as an overlap resistance. Higher up, the 2nd resistance level at 142.66 is marked as a pullback resistance that aligns close to the 23.60% Fibonacci retracement level, suggesting a potential barrier for further upside movement.
To the downside, the 1st support level at 140.73 is identified as a pullback support. Further below, the 2nd support level at 138.76 is noted as a swing-low support that aligns close to the 161.80% Fibonacci extension level, further reinforcing its importance as a key support level.
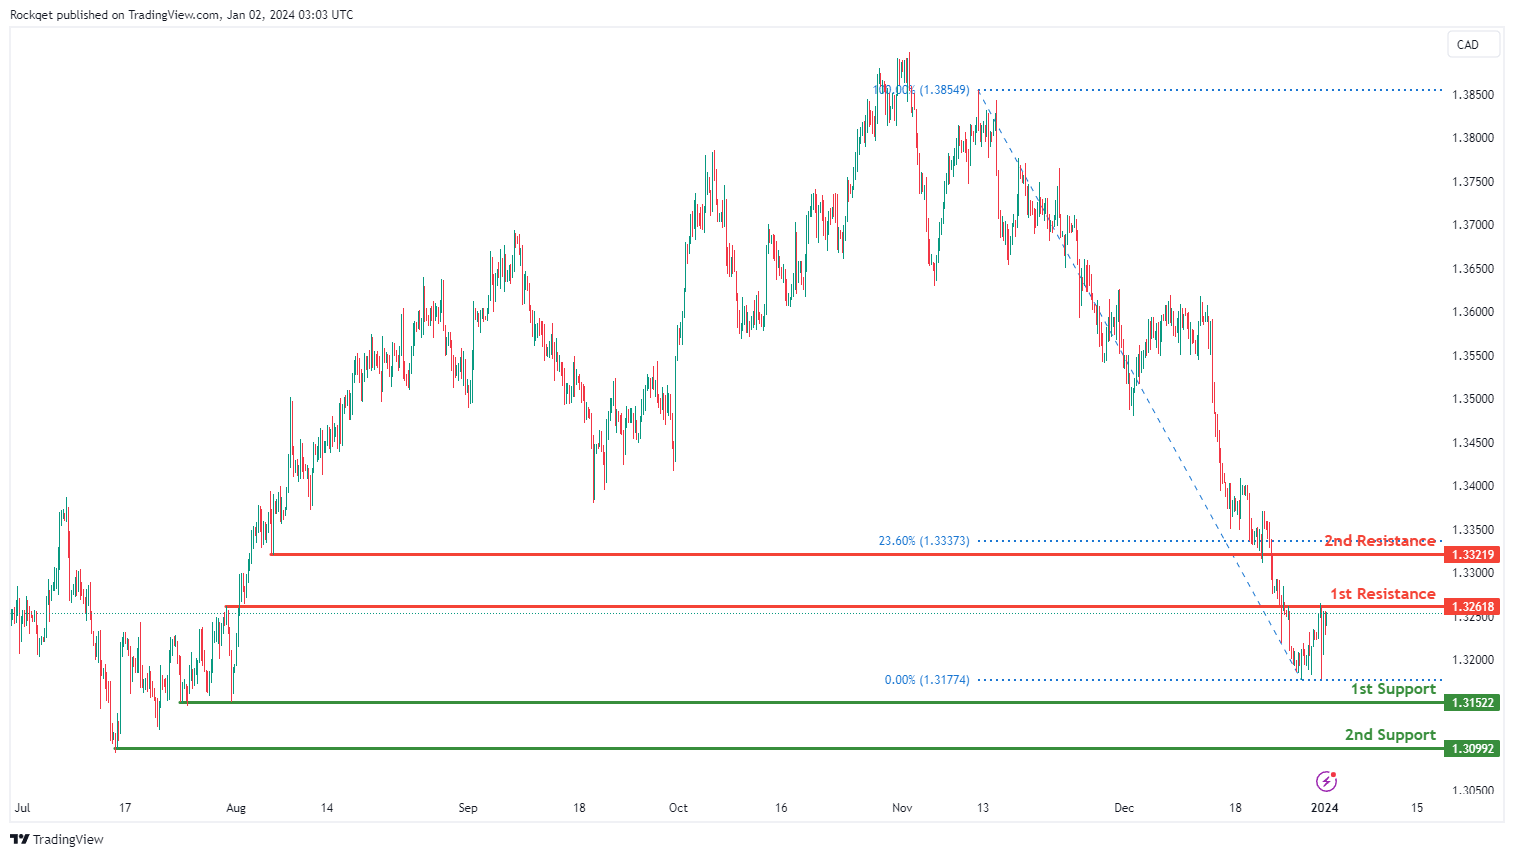
USD/CAD:
The USD/CAD chart currently exhibits an overall bearish momentum. In this context, there is a potential scenario for price to make a bearish reversal off the 1st resistance and drop towards the 1st support.
The 1st resistance level at 1.3261 is identified as an overlap resistance. Higher up, the 2nd resistance level at 1.3321 is marked as a pullback resistance that aligns with the 2360% Fibonacci retracement level, suggesting a potential barrier for further upside movement.
To the downside, the 1st support level at 1.3152 is identified as a pullback support. Further below, the 2nd support level at 1.3099 is noted as a swing-low support, further reinforcing its importance as a key support level.
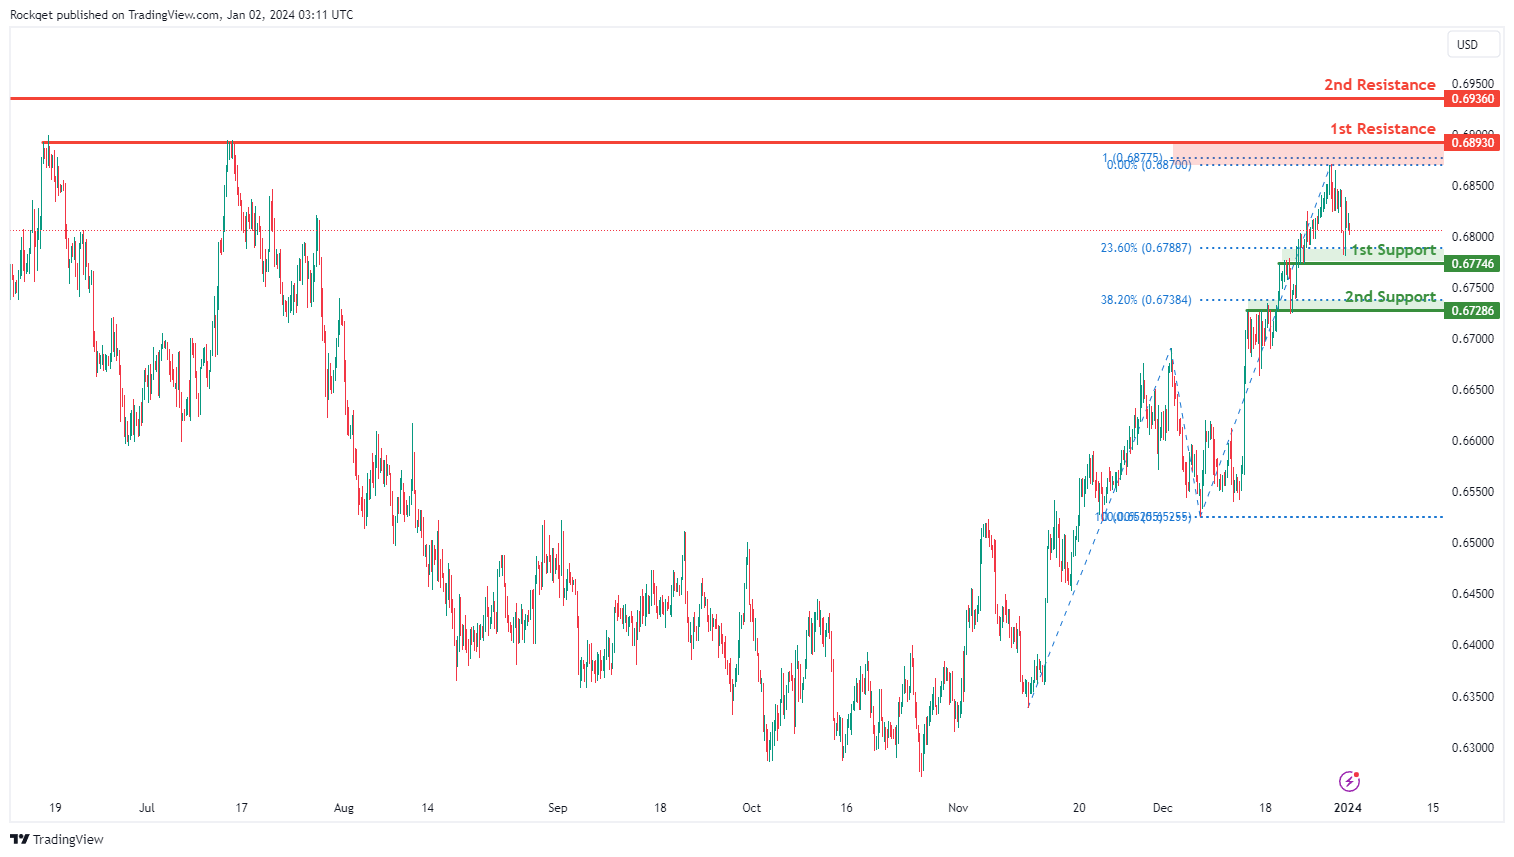
AUD/USD:
The AUD/USD chart currently exhibits an overall bullish momentum. However, there is a potential scenario for price to drop towards the 1st support,
The 1st support level at 0.6774 is identified as an overlap support that aligns close to the 23.60 Fibonacci retracement level. Further below, the 2nd support level at 0.6728 is also marked as an overlap support that aligns close to the 38.20 Fibonacci retracement level, further reinforcing its importance as a key support level.
To the upside, the 1st resistance level at 0.6893 is identified as a multi-swing-high resistance that aligns close to the 100.00% Fibonacci projection level. Higher up, the 2nd resistance level at 0.6936 is noted as a pullback resistance, indicating its potential significance as a barrier for further upward movement.
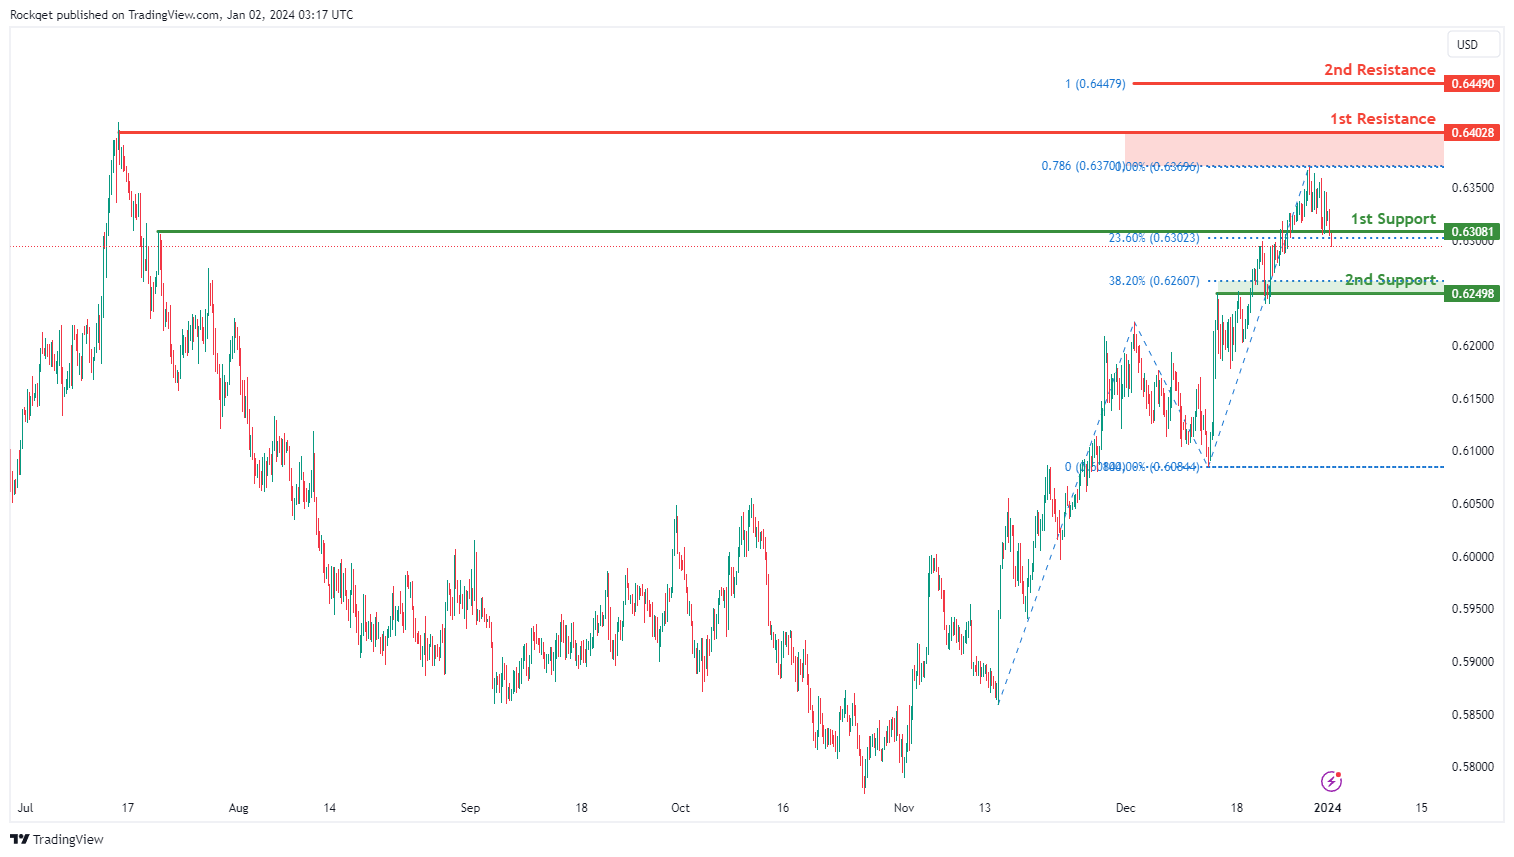
NZD/USD
The NZD/USD chart currently exhibits an overall bullish momentum. However, there is a potential scenario for price to break below the 1st support and fall towards the 2nd support to mark the start of a bearish downward trend.
The 1st support level at 0.6308 is identified as an overlap support that is close to the 23.60% Fibonacci retracement level. Further below, the 2nd support level at 0.6246 is also noted as an overlap support that is close to with the 38.20% Fibonacci retracement level, further reinforcing its importance as a key support level.
To the upside, the 1st resistance level at 0.6402 is identified as a swing-high resistance that aligns close to the 78.60% Fibonacci projection level. Higher up, the 2nd resistance level at 0.6449 is marked as a resistance that aligns with the 100.00% Fibonacci projection level, indicating its potential significance as a barrier for further upward movement.
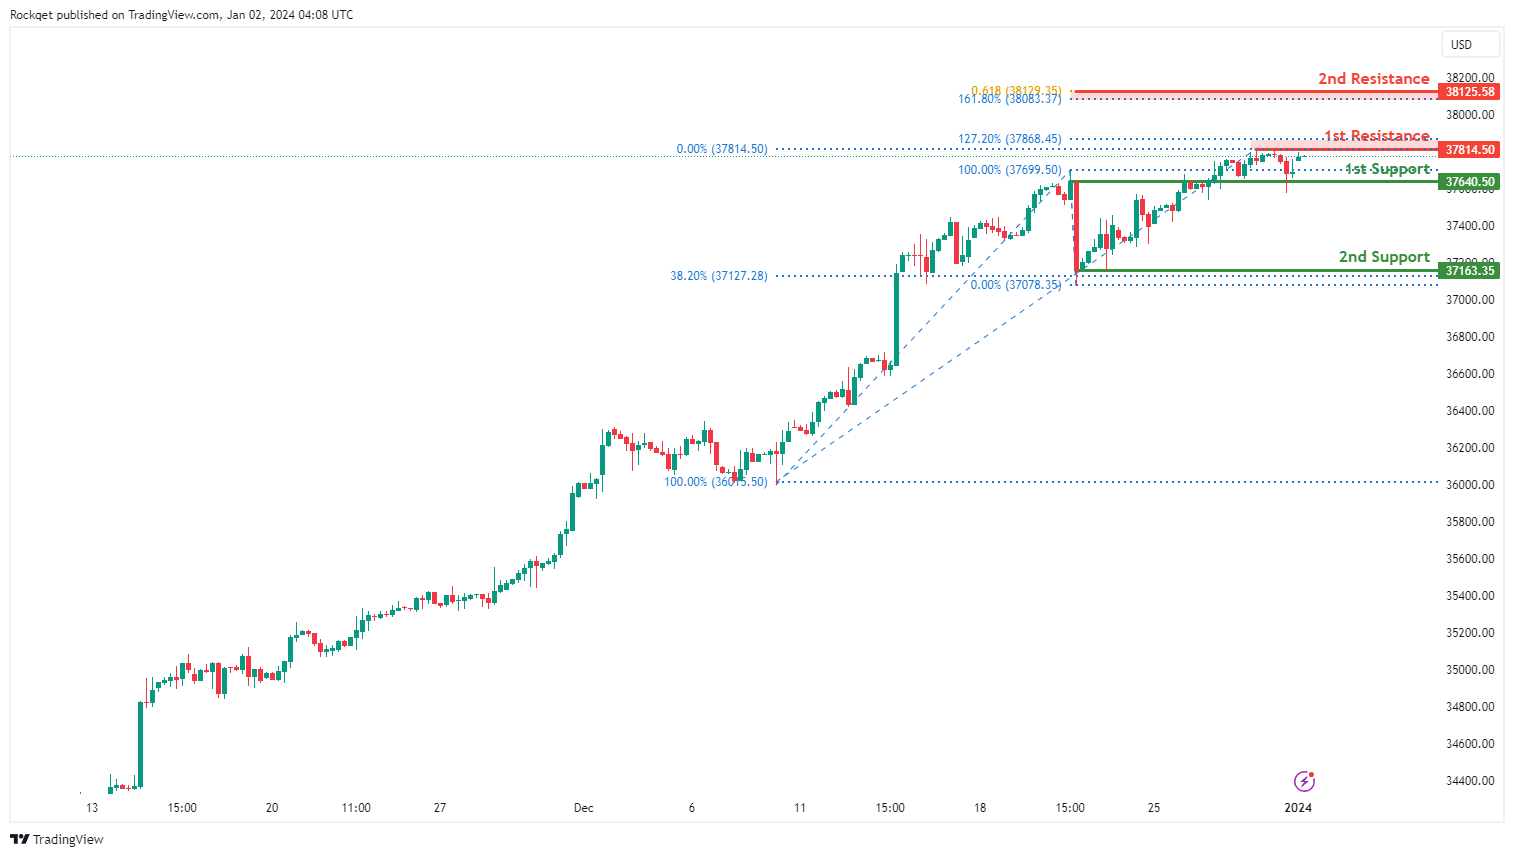
DJ30:
The DJ30 chart currently exhibits a bullish overall momentum. However, there is a potential for price to fluctuate between the 1st resistance and the 1st support.
The 1st resistance at 37,814.50 is associated with a pullback resistance that aligns with the 127.20% Fibonacci extension level. Furthermore, the 2nd resistance at 38,125.58 represents a resistance that aligns with a confluence of Fibonacci levels i.e. the 161.80% extension and the 61.80% projection levels, indicating a level where selling interest could intensify.
To the downside, the 1st support at 37,640.50 is considered as an overlap support. Additionally, the 2nd support at 37,163.35 is identified as a swing-low support that aligns with the 38.20% Fibonacci retracement level, providing an additional layer of potential support.
GER40:
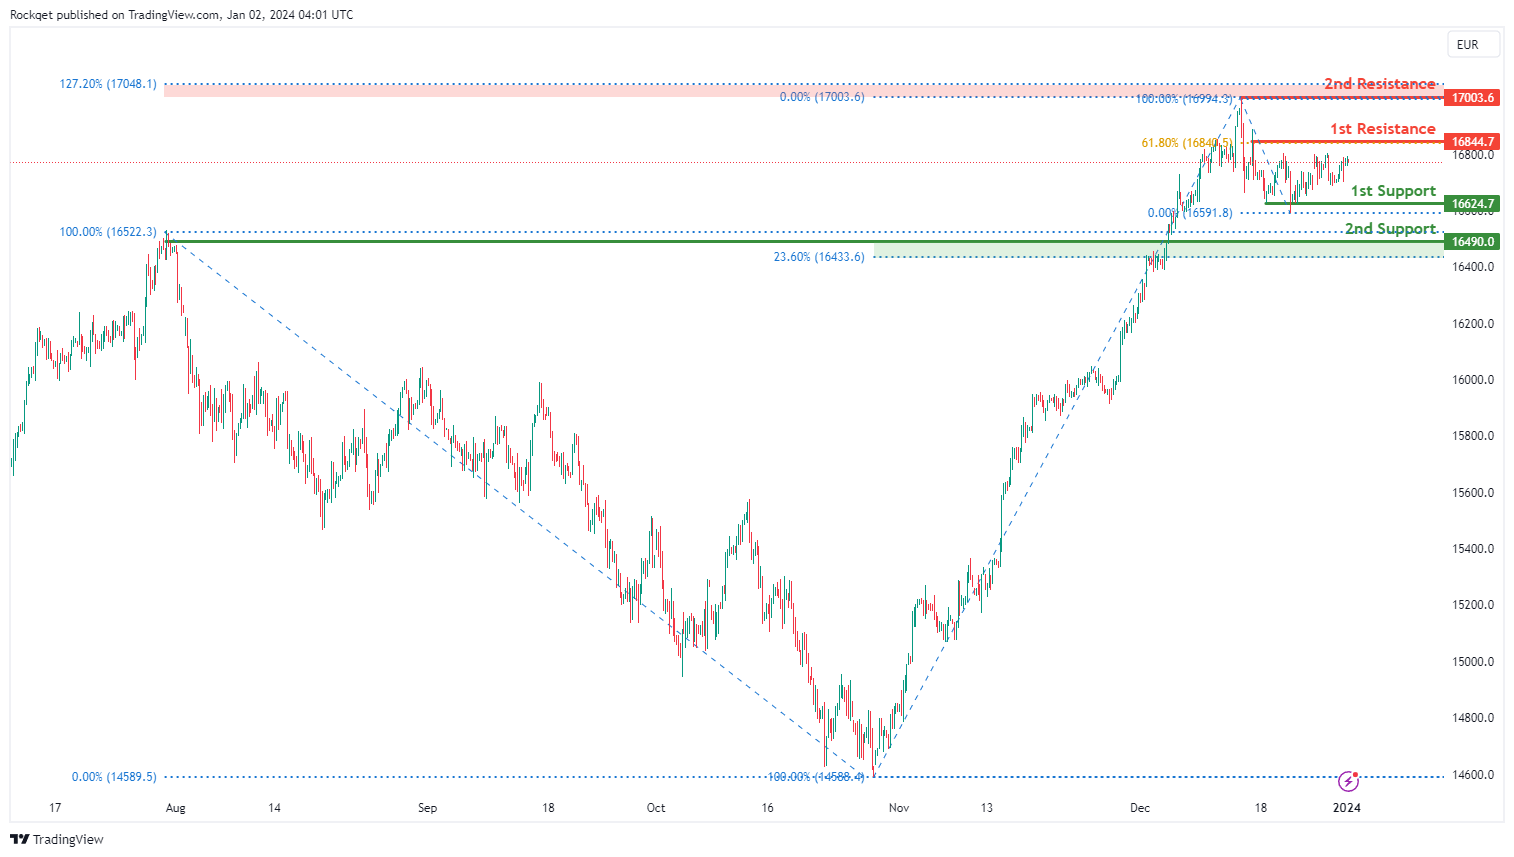
The GER40 chart currently exhibits a bullish overall momentum. However, there is a potential for price to fluctuate between the 1st resistance and the 1st support.
The 1st resistance at 16,844.70 is associated with a pullback resistance that aligns with the 61.80% Fibonacci retracement level. Furthermore, the 2nd resistance at 17,003.60 represents a swing-high resistance that aligns with the 127.20% Fibonacci extension level, indicating a level where selling interest could intensify.
To the downside, the 1st support at 16,624.70 is considered as a pullback support. Additionally, the 2nd support at 16,490.00 is also identified as a pullback support that aligns with the 23.60% Fibonacci retracement level, providing an additional layer of potential support.
US500:
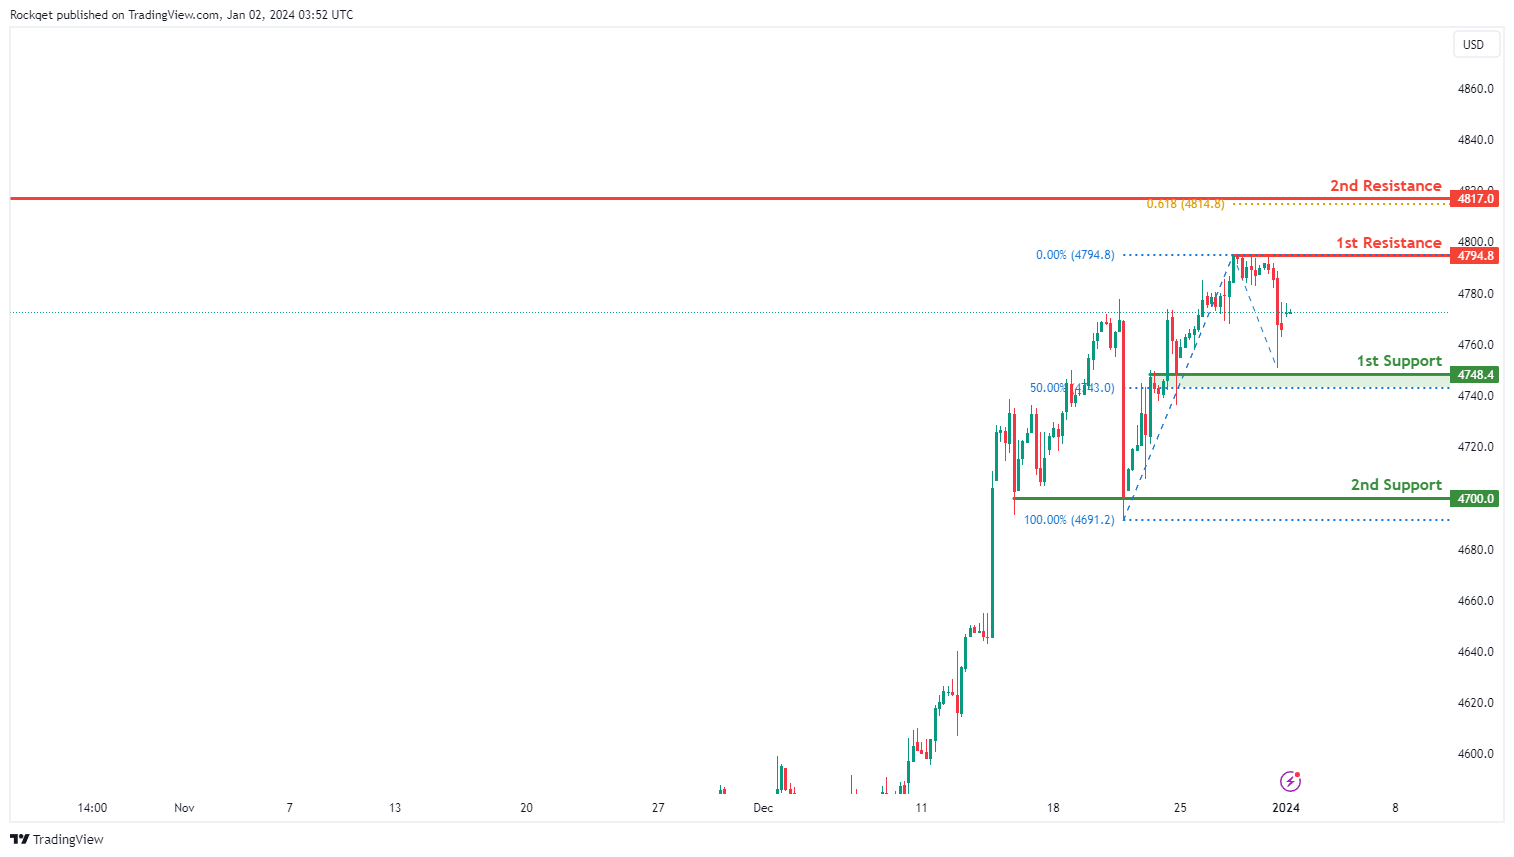
The US500 chart currently maintains an overall bullish momentum. However, there is a potential for price to fluctuate between the 1st resistance and the 1st support.
The 1st resistance at 4,794.80 is associated with a pullback resistance. Furthermore, the 2nd resistance at 4,817.00 represents a swing-high resistance that aligns with the 61.80% Fibonacci projection level, indicating a level where selling interest could intensify.
To the downside, the 1st support at 4,748.40 is considered as an overlap support that aligns with the 50.00% Fibonacci retracement level. Additionally, the 2nd support at 4,700.00 is identified as a pullback support, providing an additional layer of potential support.
BTC/USD:
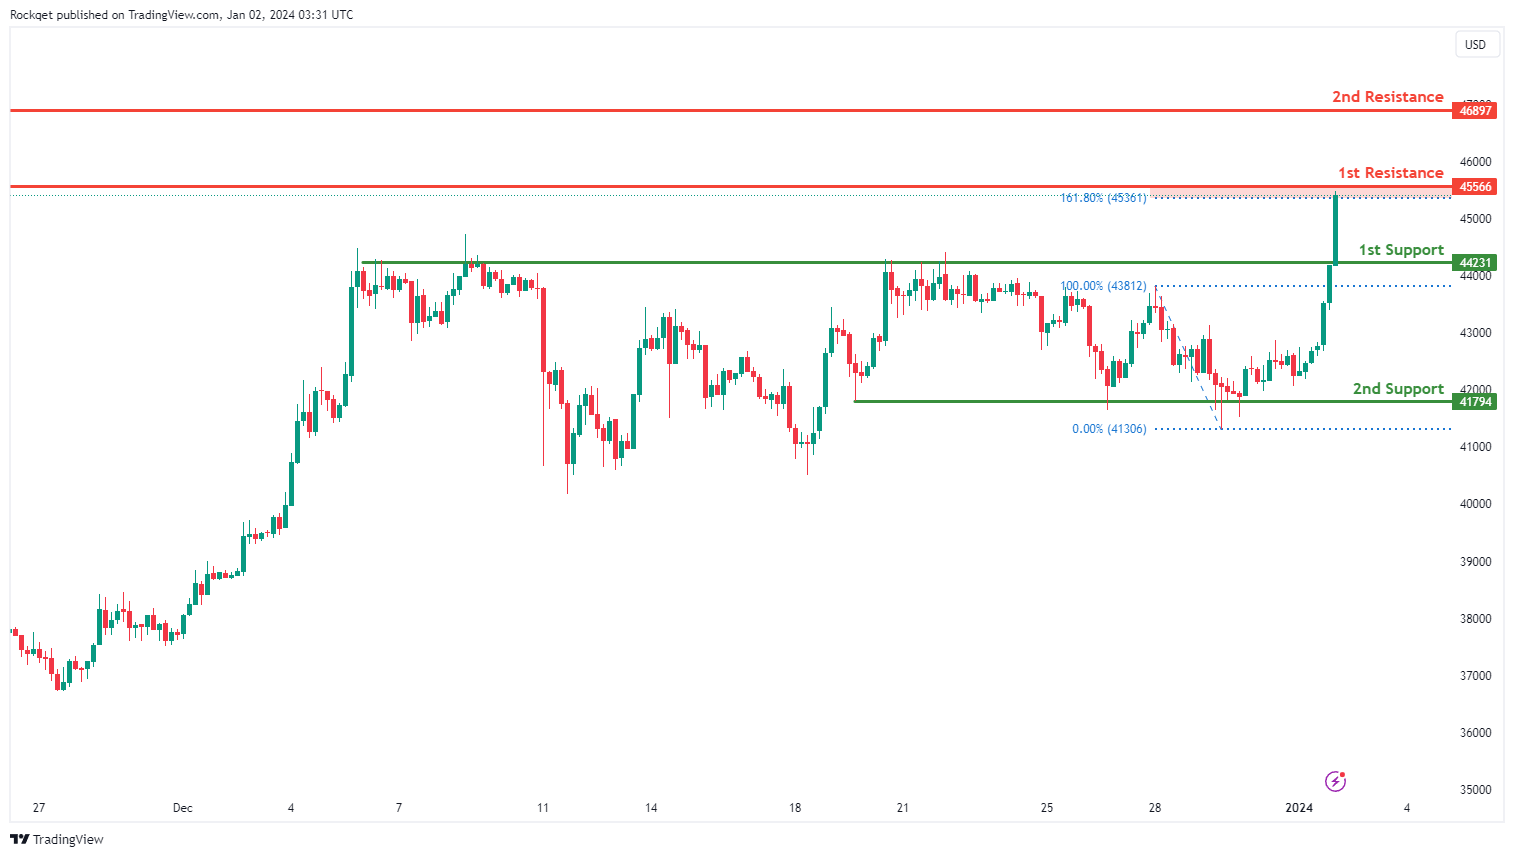
The BTC/USD chart currently displays an overall bullish momentum, suggesting a potential scenario for price to make a bullish continuation towards the 1st resistance.
The 1st resistance at 45,566 is associated with a pullback resistance that aligns close to the 161.80% Fibonacci extension level. Furthermore, the 2nd resistance at 46,897 represents an overlap resistance, indicating a level where selling interest could intensify.
To the downside, the 1st support at 44,231 is considered as a pullback support. Additionally, the 2nd support at 41,794 is also identified as a pullback support, providing an additional layer of potential support.
ETH/USD:
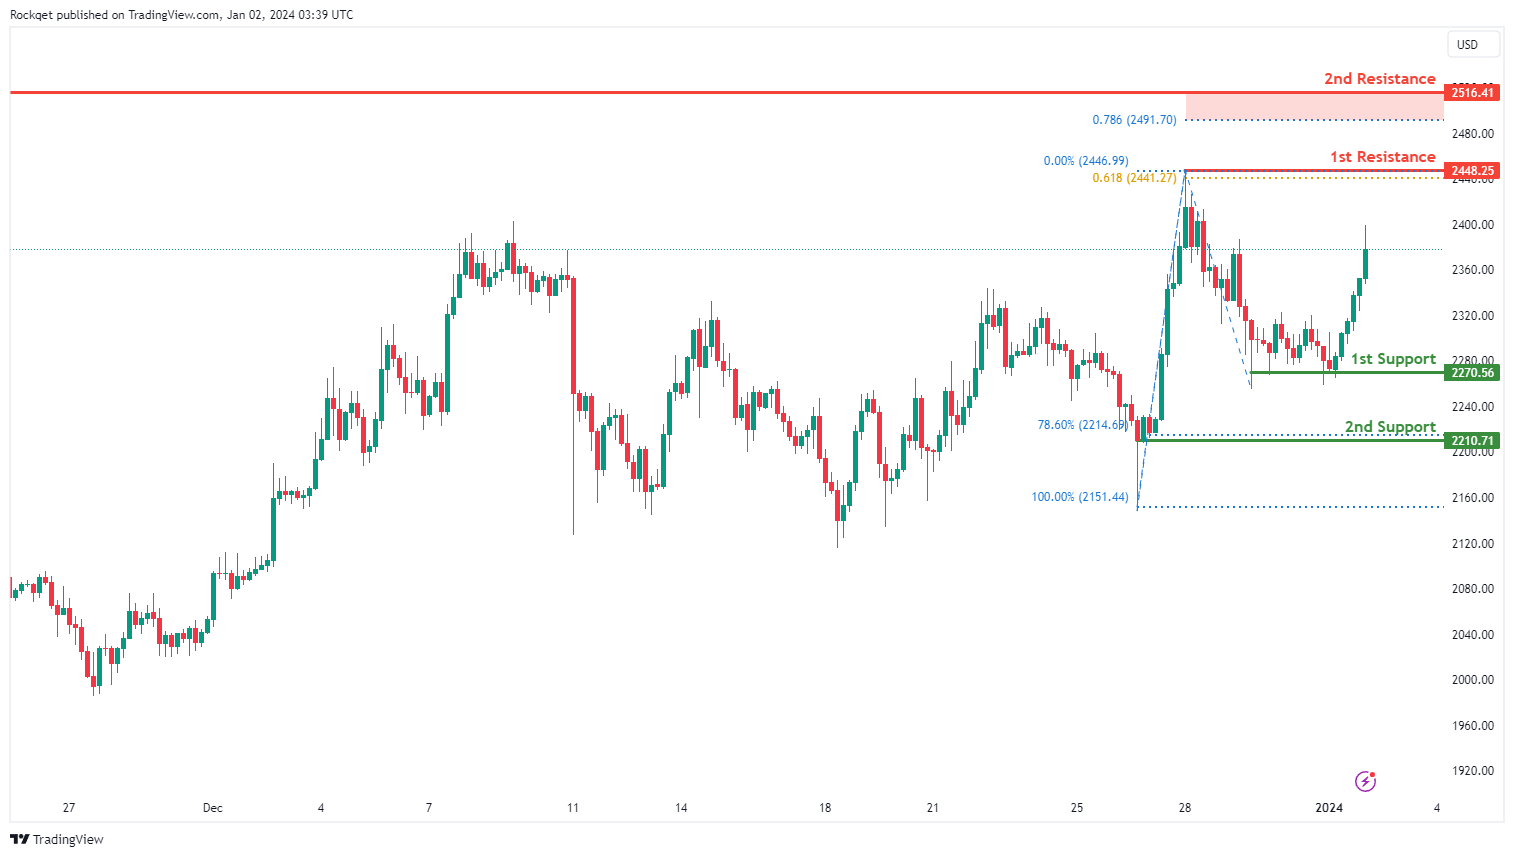
The ETH/USD chart currently exhibits an overall bullish momentum, suggesting a potential scenario for price to make a bullish continuation towards the 1st resistance.
The 1st resistance at 2,4448.25 is associated with a swing high resistance that aligns with the 61.80% Fibonacci projection level. Furthermore, the 2nd resistance at 2,516.41 represents a pullback resistance that aligns close to the 78.60% Fibonacci projection level, indicating a level where selling interest could intensify.
To the downside, the 1st support at 2,270.56 is considered as a pullback support that aligns with the 61.80% Fibonacci retracement level. Additionally, the 2nd support at 2,210.71 is identified as a swing-low support that aligns with the 78.60% Fibonacci retracement level, providing an additional layer of potential support.
WTI/USD:
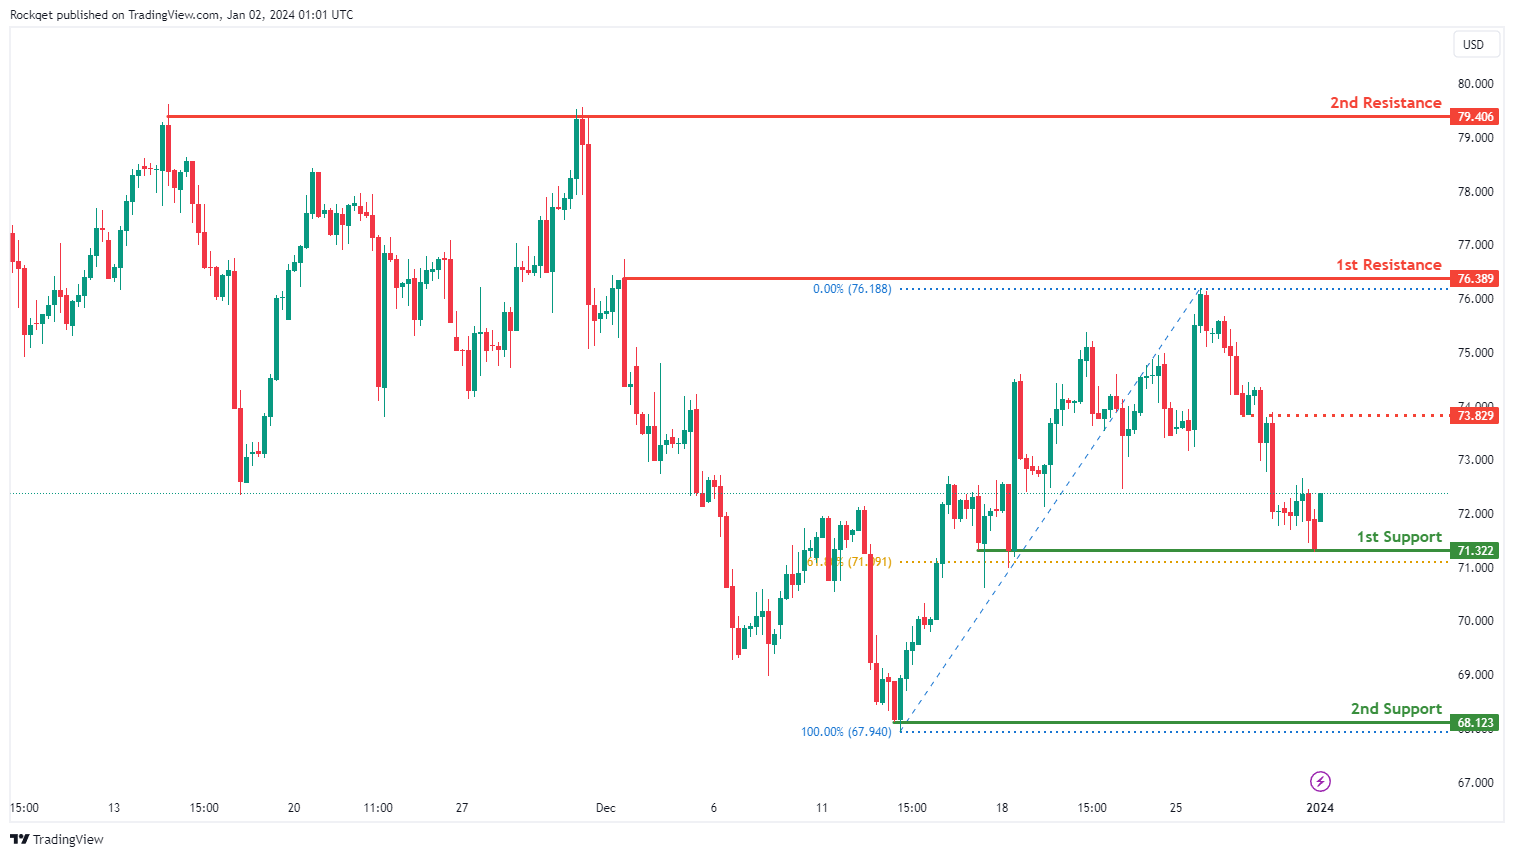
The WTI chart currently exhibits an overall bearish momentum. However, there is a potential scenario for price to rise towards the 1st resistance should it break above the intermediate resistance.
The intermediate resistance level at 73.82 is identified as an overlap resistance while the 1st resistance level at 76.38 is identified as a pullback resistance. Higher up, the 2nd resistance level at 79.40 is noted as a multi-swing-high resistance, further indicating its potential significance as a barrier for further upward movement.
To the downside, the 1st support level at 71.32 is identified as a pullback support that aligns close to the 61.80% Fibonacci retracement level. Further below, the 2nd support level at 68.12 is marked as a swing-low support, reinforcing its importance as a key support level.
XAU/USD (GOLD):
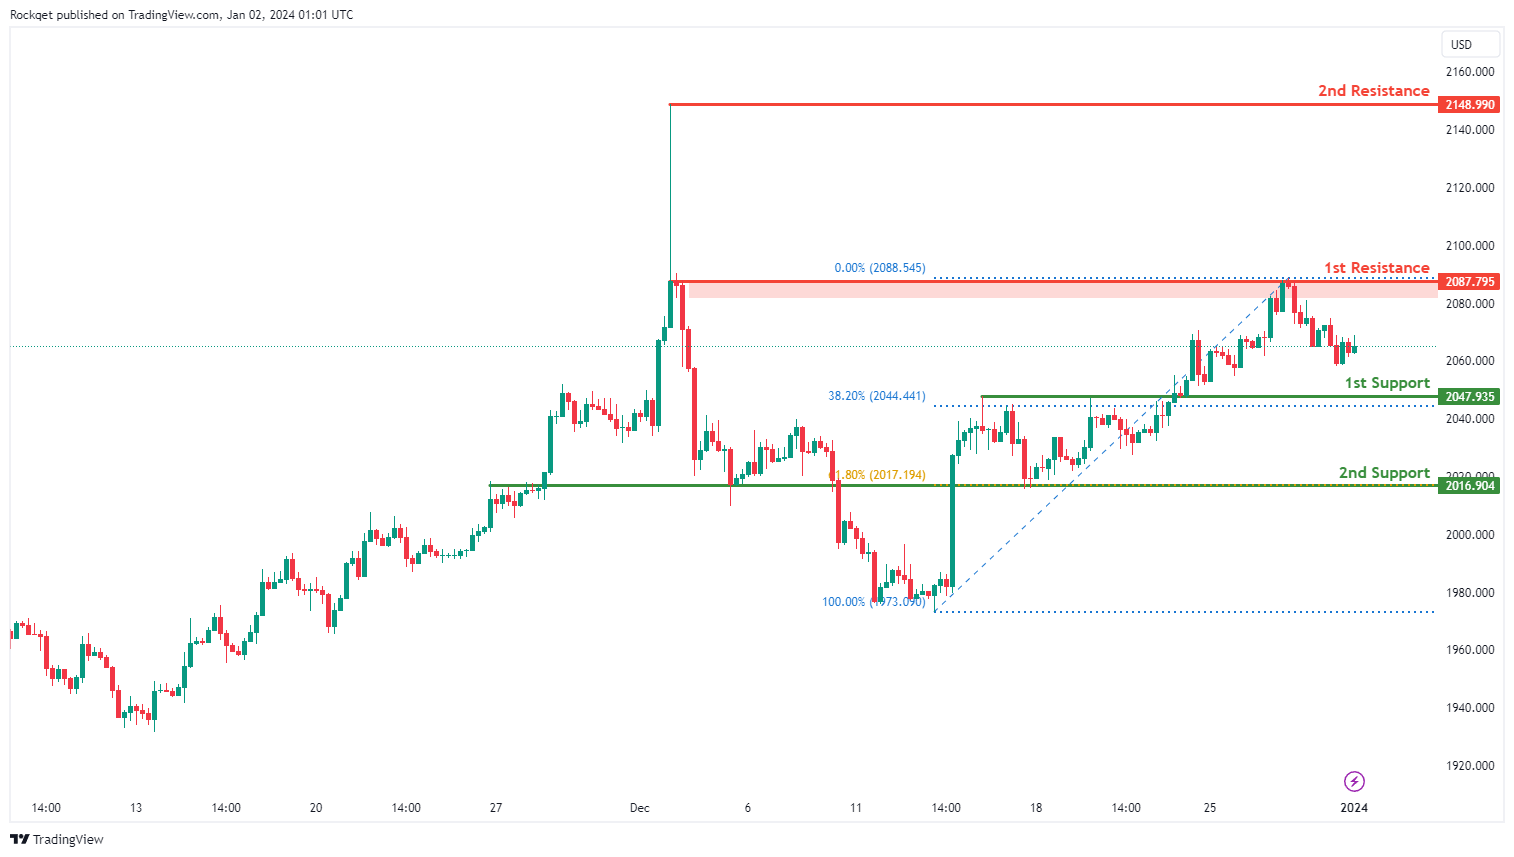
The XAU/USD chart currently demonstrates a bullish momentum, indicating a potential for price to make a bullish continuation towards the 1st resistance.
The 1st resistance level at 2,087.79 is identified as a pullback resistance. Higher up, the 2nd resistance level at 2,148.99 is marked as a swing-high resistance, further indicating its potential significance as a barrier for further upward movement.
To the downside, the 1st support level at 2,047.93 is identified as a pullback support that aligns close to the 38.20% Fibonacci retracement level. Further below, the 2nd support level at 2,016.90 is noted as an overlap support that aligns with the 61.80% Fibonacci retracement level, reinforcing its importance as a key support level.
EUR/USD Daily Outlook
Daily Pivots: (S1) 1.1020; (P) 1.1052; (R1) 1.1070; More...
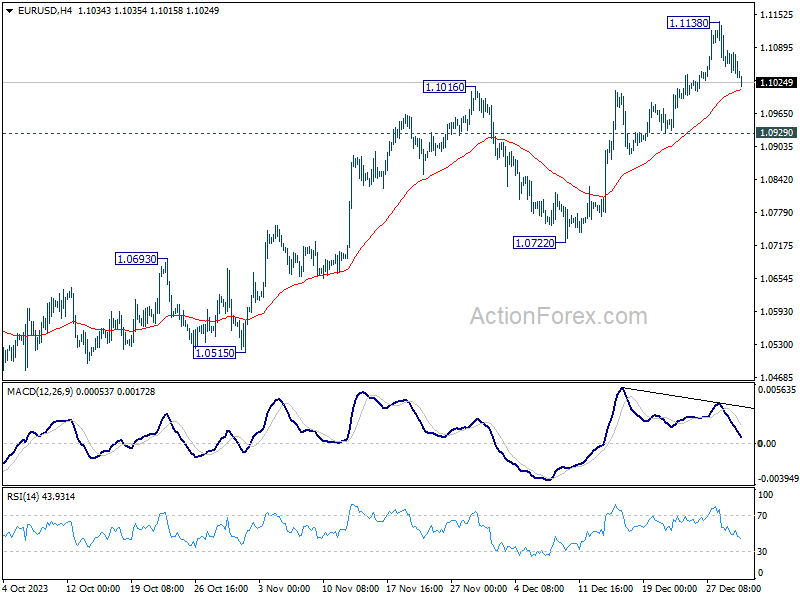
EUR/USD's retreat from 1.1138 extends lower today but stays well above 1.0929 support. Intraday bias remains neutral for the moment. Further rally is expected as long as 1.0929 support holds. Break of 1.1138 will resume the rise from 1.0447 to retest 1.1274 high. Strong resistance should be seen from there to limit upside, at least on first attempt. Meanwhile, break of 1.0929 will indicate short term topping and turn bias back to the downside for 1.0772 support.
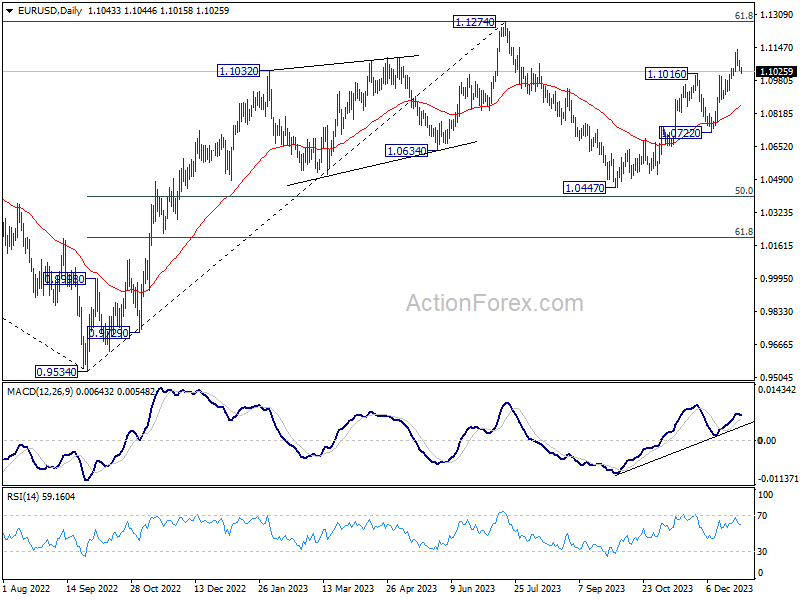
In the bigger picture, price actions from 1.1274 are viewed as a corrective pattern to rise from 0.9534 (2022 low). Rise from 1.0447 is seen as the second leg. While further rally could cannot be ruled out, upside should be limited by 1.1274 to bring the third leg of the pattern. Meanwhile, sustained break of 1.0722 support will argue that the third leg has already started for 1.0447 and below.
Dollar Gains on Risk-Off Mood: Mixed China Data and Japan Earthquake Drive Cautious Trading
Dollar gains modest ground in Asian session today, driven by mild risk-off sentiment. Mixed data emerging from China's PMI manufacturing sector has cast a shadow over market sentiment, contributing to a tepid start in Hong Kong's stock market. The HSI index is grappling with the aftermath of its fourth consecutive year of losses, as a prolonged period of underperformance continues.
Contrasting this, Japanese Yen is showing a broad softening while Japan is on holiday. A powerful earthquake in Japan's central region on New Year's Day adds a layer of uncertainty to the economic outlook. Investors are closely monitoring the situation, assessing the potential repercussions of this natural disaster.
In Europe, both the Swiss Franc and the Euro are seeing The British Pound, meanwhile, is showing a mixed performance. Meanwhile, Aussie and Loonie are on the firmer side.
Looking ahead, trading activity is poised to intensify with focus on crucial economic data releases. Markets are particularly attuned to ISMs and NFP from US, as well as inflation data from Eurozone. FOMC minutes is also a major highlight.
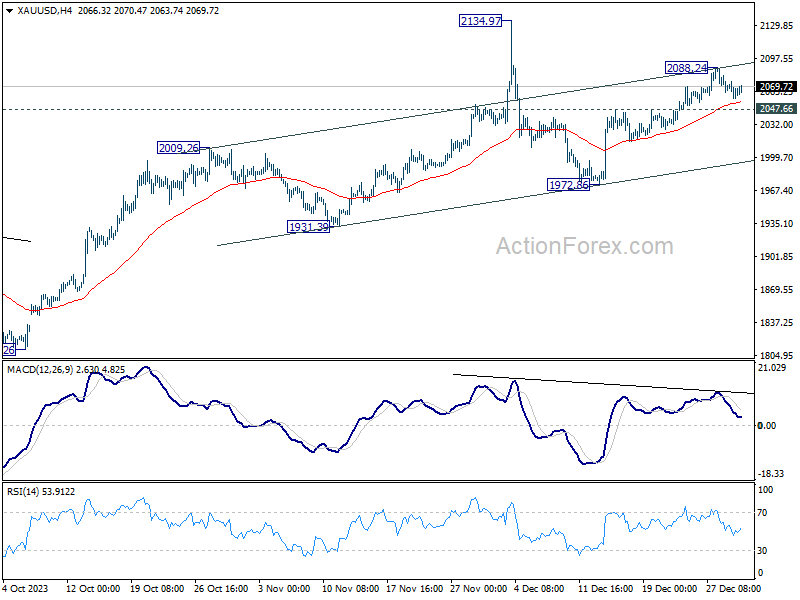
Technically, Gold lost much upside momentum after hitting channel resistance (disregarding the exaggerated spike to 2134.97 on thin liquidity). For now, further rise is still in favor as long as 2047.66 resistance turned support holds. Sustained break of the channel resistance could prompt upside acceleration. However, break of 2047.66 will bring deeper pull back to channel support (now at around 2000 psychological level.
In Asia, at the time of writing, Hong Kong HSI is down -1.45%. China Shanghai SSE is down -0.21%. Singapore Strait Times is down -0.27%. Japan is on holiday.
China's Caixin PMI manufacturing rises, as NBS PMI shows contraction
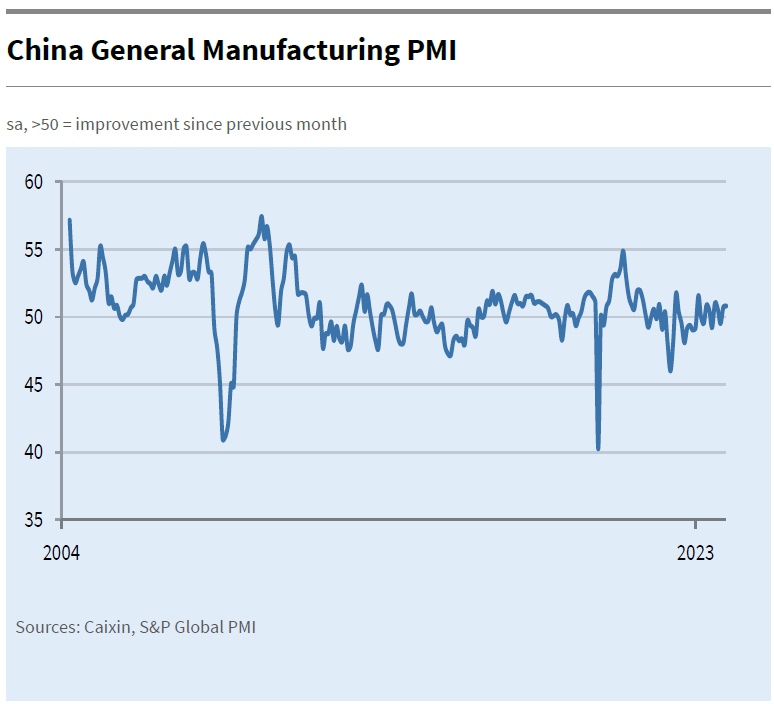
December brought mixed signals from China's manufacturing sector, as indicated by two key indices: Caixin PMI and official NBS PMI. Caixin PMI Manufacturing slightly increased from 50.7 to 50.8, surpassing expectations of 50.4, suggesting a marginal yet steady expansion in the manufacturing sector. Notably, Caixin highlighted that both output and new orders are rising at faster rates, indicating increased production and demand within the industry.
However, the same period saw a dip in official PMI Manufacturing, which fell from 49.4 to 49.0. This decline suggests contraction in the sector, contrasting with optimism reflected in Caixin PMI data. The difference between these two indices can be attributed to their varied focus groups; Caixin PMI typically surveys small and medium-sized enterprises, while NBS PMI is more reflective of larger, state-owned companies.
Wang Zhe, Senior Economist at Caixin Insight Group, emphasized the improved economic outlook for the manufacturing sector, with expanding supply and demand, and stable price levels. Yet, he also pointed out significant challenge in employment, highlighting businesses' cautious approach in areas like hiring, raw material purchasing, and inventory management.
On the other hand, NBS PMI Non-Manufacturing showed a slight improvement, rising from 50.2 to 50.4. This marginal increase suggests a modest expansion in China's services sector.
Bitcoin Price Rallies On Rumors of Spot ETF Approval
Bitcoin is trying to resume its medium term up trend, breaking 45k handle for the first time in nearly two years. Bitcoin could be gathering momentum at the start of the year in anticipation of two important events. One is SEC approval of one or several of the 14 outstanding applications for a spot Bitcoin ETF product, currently pending a decision with the regulator. Another is The halving, which happens every four years, is an event written in bitcoin's code.
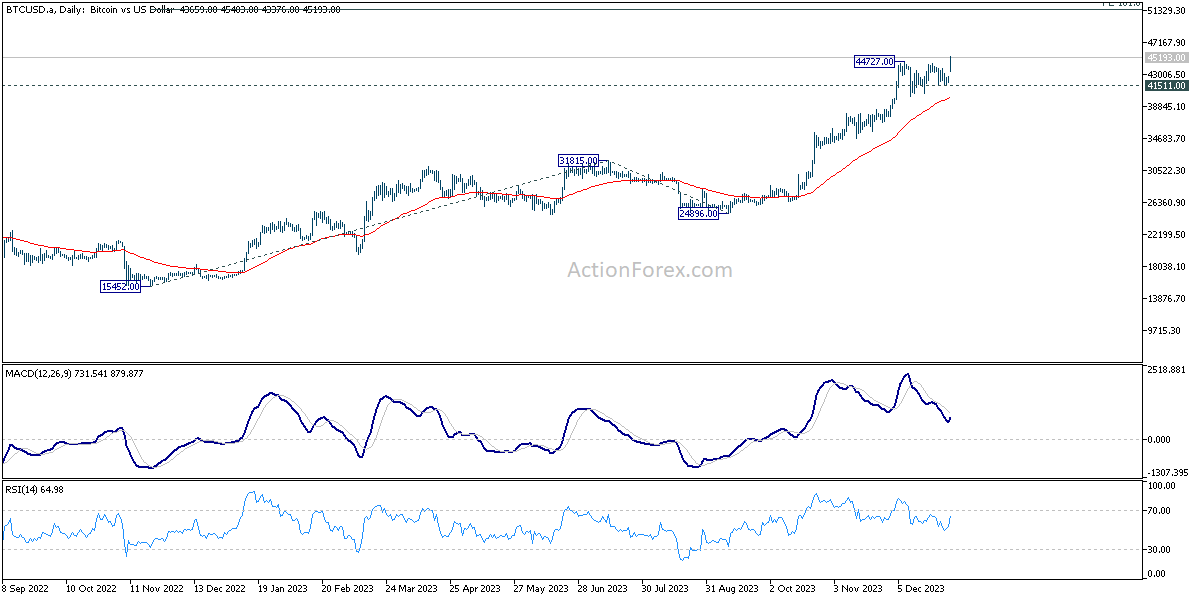
Technically, break of 44727 short term top indicates resumption of whole up trend from 15452 (2022 low). Near term outlook will stay bullish as long as 41511 support holds. Next target is 161.8% projection of 15452 to 31815 from 24896 at 51371.
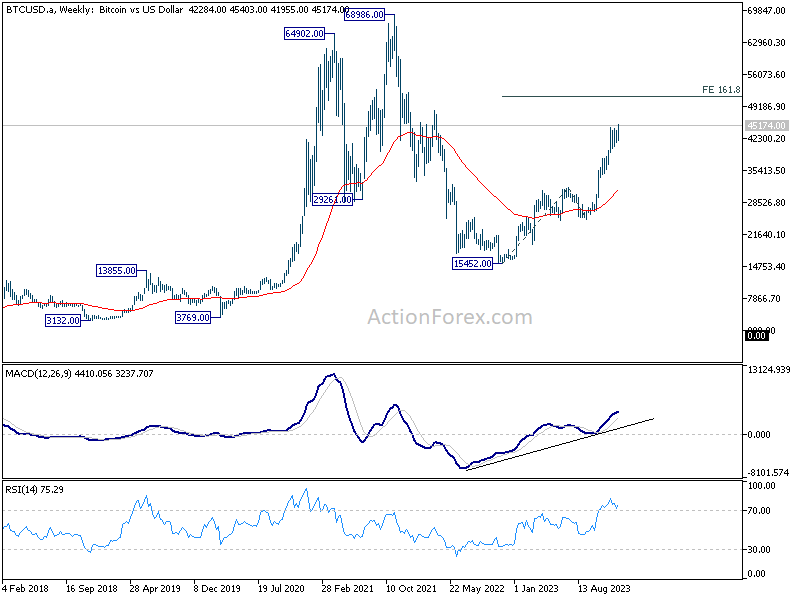
In the bigger picture, upside acceleration as seen in W MACD suggests that rise from 15452 is an impulsive move. Hence, sustained break of 51371 would solidify the case that Bitcoin is ready to resume the long term up trend through 68986 historical high at a later stage.
Fed Minutes, NFP, and Eurozone inflation in focus as year of rate cuts starts
The upcoming release of FOMC's minutes from its December 12-13 meeting is anticipated to shed light on Fed's pivotal policy shift. This meeting is particularly notable for its projection of downward adjustment in interest rates from the current 5.25-5.50% to 4.625% by the end of 2024, followed a further reduction to 3.625% by the end of 2025. The financial community is bracing for insights into FOMC's deliberations on key issues: the planned trajectory of interest rate reductions, with a keen focus on the timing of the initial cut. Current market sentiment, as indicated by Fed funds futures, strongly anticipates a reduction as soon as March, with a probability exceeding 80%.
Furthermore, the upcoming release of US ISM manufacturing and services data, along with non-farm payroll statistics, holds considerable weight. These datasets serve as critical barometers for assessing the strength and resilience of the economy, labor market health, and inflationary undercurrents. Their outcomes will not only provide valuable insights into the current state of the economy but will also play a decisive role in steering Fed's forthcoming policy decisions.
In Europe, Eurozone's CPI flash report is drawing considerable attention. Forecast suggests rebound in headline inflation to 3.0%, while core inflation is expected to continue its slowdown to 3.4%. ECB, yet to signal a shift in policy direction, is closely monitored amidst market speculations about a possible easing of policy in the second quarter. The rate at which inflationary pressures ease will be a critical factor for ECB as it contemplates the appropriate timing for reducing borrowing costs.
Canadian economic scenario is also under scrutiny, with the focus on employment data. Unemployment rate, which has been on a gradual uptick since last May, is projected to increase further to 5.9%. A crucial factor in this context is the rate at which job market is loosening and the economy is slowing down. These dynamics will be pivotal in influencing BoC decision on whether to initiate interest rate cuts this year.
Here are some highlights for the week:
- Tuesday: China Caixin PMI manufacturing; Eurozone PMI manufacturing final, M3 money supply; UK PMI manufacturing final; Canada PMI manufacturing; US PMI manufacturing final, construction spending.
- Wednesday: Swiss PMI manufacturing; Germany unemployment; US ISM manufacturing, FOMC minutes.
- Thursday: Japan PMI manufacturing final; China Caixin PMI services; Germany CPI flash; Eurozone PMI services final; UK PMI services final, M4 money supply, mortgage approvals; US Challenger job cuts, ADP private employment, jobless claims, PMI services final.
- Friday: Japan monetary base, consumer confidence; Germany retail sales; UK PMI construction; Eurozone CPI flash, PPI; Canada employment, Ivey PMI; US non-farm payrolls, ISM services, factory orders.
EUR/USD Daily Outlook
Daily Pivots: (S1) 1.1020; (P) 1.1052; (R1) 1.1070; More...
EUR/USD's retreat from 1.1138 extends lower today but stays well above 1.0929 support. Intraday bias remains neutral for the moment. Further rally is expected as long as 1.0929 support holds. Break of 1.1138 will resume the rise from 1.0447 to retest 1.1274 high. Strong resistance should be seen from there to limit upside, at least on first attempt. Meanwhile, break of 1.0929 will indicate short term topping and turn bias back to the downside for 1.0772 support.
In the bigger picture, price actions from 1.1274 are viewed as a corrective pattern to rise from 0.9534 (2022 low). Rise from 1.0447 is seen as the second leg. While further rally could cannot be ruled out, upside should be limited by 1.1274 to bring the third leg of the pattern. Meanwhile, sustained break of 1.0722 support will argue that the third leg has already started for 1.0447 and below.
Economic Indicators Update
| GMT | Ccy | Events | Actual | Forecast | Previous | Revised |
|---|---|---|---|---|---|---|
| 00:01 | GBP | BRC Shop Price Index Y/Y Nov | 4.30% | 4.30% | ||
| 01:45 | CNY | Caixin Manufacturing PMI Dec | 50.8 | 50.4 | 50.7 | |
| 08:45 | EUR | Italy Manufacturing PMI Dec | 44.4 | 44.4 | ||
| 08:50 | EUR | France Manufacturing PMI Dec F | 42 | 42 | ||
| 08:55 | EUR | Germany Manufacturing PMI Dec F | 43.1 | 43.1 | ||
| 09:00 | EUR | Eurozone Manufacturing PMI Dec F | 44.2 | 44.2 | ||
| 09:00 | EUR | Eurozone M3 Money Supply Y/Y Nov | -1% | -1% | ||
| 09:30 | GBP | Manufacturing PMI Dec F | 46.4 | 46.4 | ||
| 14:30 | CAD | Manufacturing PMI Dec | 47.7 | |||
| 14:45 | USD | Manufacturing PMI Dec F | 48.2 | 48.2 | ||
| 15:00 | USD | Construction Spending M/M Nov | 0.60% | 0.60% |
Bitcoin Price Rallies On Rumors of Spot ETF Approval
Key Highlights
- Bitcoin price started a fresh rally after rumors of spot ETF approval by today.
- BTC broke a major declining channel with resistance at $43,000 on the 4-hour chart.
- The price could continue higher if it remains stable above $44,000.
- The US Manufacturing PMI could remain at 48.2 in Dec 2023.
Bitcoin Price Technical Analysis
Bitcoin price remained strong above the $42,000 support zone. BTC formed a base and recently started a fresh increase as rumors of spot ETF approval escalated.
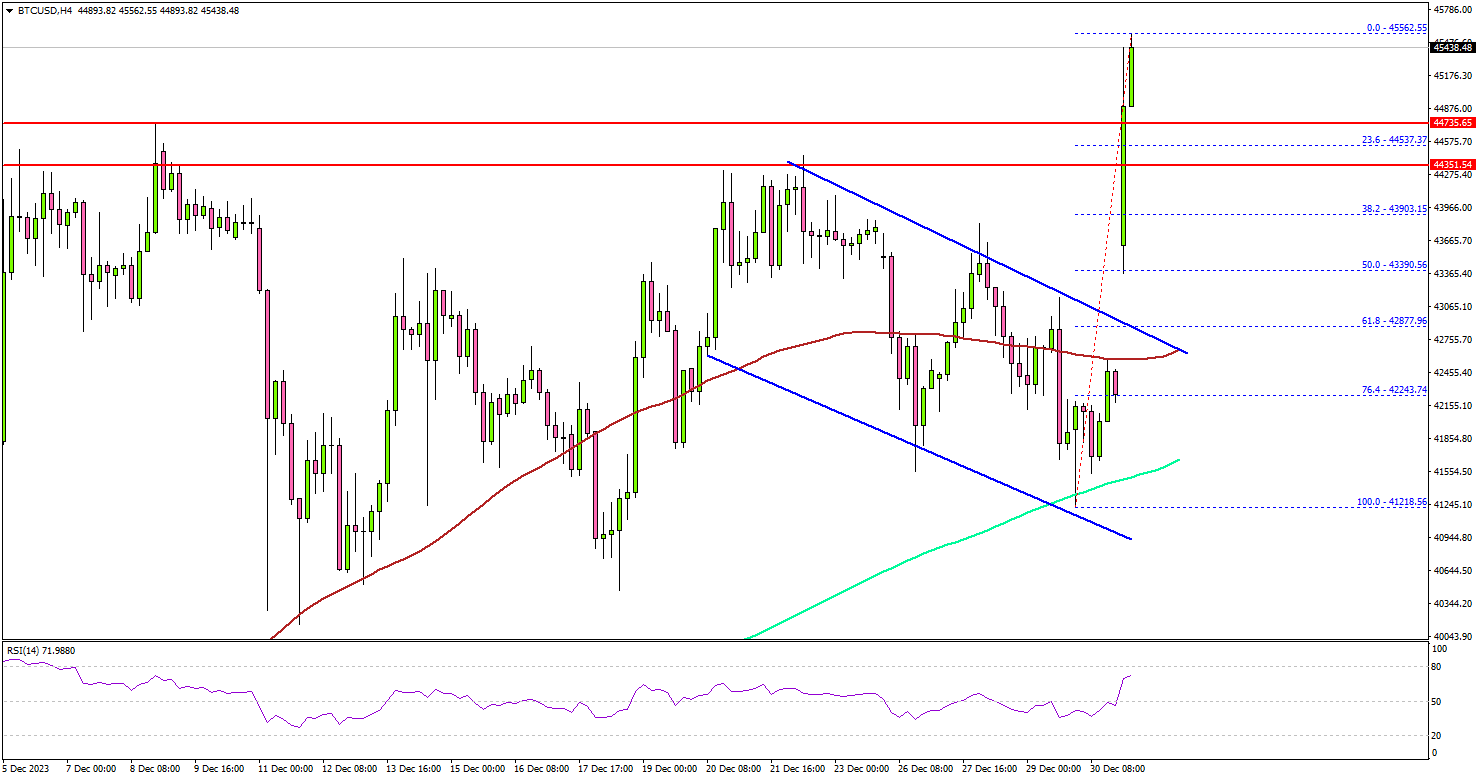
Looking at the 4-hour chart, the price broke many hurdles near $43,000. It broke a major declining channel with resistance at $43,000. The price even settled above $44,000, the 100 simple moving average (red, 4 hours), and the 200 simple moving average (green, 4 hours).
A new multi-week high was formed near $45,562 and the price is now consolidating gains. If there is a fresh increase, Bitcoin could face resistance near $46,200.
The next resistance is near $48,000. A successful close above the $48,000 level might start a decent increase. In the stated case, the price may perhaps rise toward the $50,000 level.
If not, the price might start a downside correction. Immediate support is near the $44,750 level. The next major support is near $44,350. Any more losses might send the price toward the $43,000 level.
Economic Releases
- Euro Zone Manufacturing PMI for Dec 2023 – Forecast 44.2, versus 44.2 previous.
- UK Manufacturing PMI for Dec 2023 – Forecast 46.4, versus 46.4 previous.
- US Manufacturing PMI for Dec 2023 – Forecast 48.2, versus 48.2 previous.
Bitcoin breaks 45k barrier, eyeing 50k
Bitcoin soars notably today, and breaks 45k mark for the first time in nearly two years, signaling a resurgence in its medium-term uptrend. The flagship cryptocurrency could be gathering momentum to extend its medium term up trend at the start of the year.
Two key events are driving this optimism: the pending SEC approval for spot Bitcoin ETF products, with 14 applications currently under review, and the much-anticipated Bitcoin halving event, a code-embedded process that occurs every four years.
From a technical perspective, break of 44727 short term top indicates resumption of whole up trend from 15452 (2022 low). Near term outlook will stay bullish as long as 41511 support holds. Next target is 161.8% projection of 15452 to 31815 from 24896 at 51371.
In the bigger picture, upside acceleration as seen in W MACD suggests that rise from 15452 is an impulsive move. Hence, sustained break of 51371 would solidify the case that Bitcoin is ready to resume the long term up trend through 68986 historical high at a later stage.
China’s Caixin PMI manufacturing rises, as NBS PMI shows contraction
December brought mixed signals from China's manufacturing sector, as indicated by two key indices: Caixin PMI and official NBS PMI. Caixin PMI Manufacturing slightly increased from 50.7 to 50.8, surpassing expectations of 50.4, suggesting a marginal yet steady expansion in the manufacturing sector. Notably, Caixin highlighted that both output and new orders are rising at faster rates, indicating increased production and demand within the industry.
However, the same period saw a dip in official PMI Manufacturing, which fell from 49.4 to 49.0. This decline suggests contraction in the sector, contrasting with optimism reflected in Caixin PMI data. The difference between these two indices can be attributed to their varied focus groups; Caixin PMI typically surveys small and medium-sized enterprises, while NBS PMI is more reflective of larger, state-owned companies.
Wang Zhe, Senior Economist at Caixin Insight Group, emphasized the improved economic outlook for the manufacturing sector, with expanding supply and demand, and stable price levels. Yet, he also pointed out significant challenge in employment, highlighting businesses' cautious approach in areas like hiring, raw material purchasing, and inventory management.
On the other hand, NBS PMI Non-Manufacturing showed a slight improvement, rising from 50.2 to 50.4. This marginal increase suggests a modest expansion in China's services sector.
Forecast 2024: Bitcoin Yesterday, Tomorrow, and the Day After
The main question, just a few years ago, was when the crypto bubble would burst. Over time, bitcoin gradually earned its place in the minds and portfolios of traders and investors. Competing actively with physical gold and other investment and defensive assets, digital gold emerged as a formidable contender.
In the past year, the merits and drawbacks of bitcoin have been a topic of frequent discussion, encompassing analysis of its rises and falls and presenting views from seasoned Wall Street experts and pseudonymous social network analysts. It's important to note that many predictions from both groups proved quite accurate, despite the ultra-high volatility of this flagship asset. Today's focus is on recalling the 2023 predictions for bitcoin, their forecasts for 2024 and beyond, with a particular emphasis on those specialists who offered specific figures rather than general, vague phrases.
2023: Those Who Hit the Mark or Came Close
Let's recall that the past year was undoubtedly successful for bitcoin. Despite all its highs and lows, BTC/USD, starting the year at $16,515, reached a peak of $44,694 on December 8, demonstrating a 2.7-fold increase. Among the reasons for the coin's bull rally, experts cite the growing network hash rate, anticipation of the Federal Reserve's policy easing, and, of course, the approval by the Securities and Exchange Commission (SEC) of the launch of spot bitcoin ETFs and the bitcoin halving in April 2024. It should be noted that all these events began to influence market sentiment only in the second half of 2023. Therefore, the forecasts made in the first half of the year are particularly interesting.
Alistair Milne, IT Director of Altana Digital Currency Fund, made a nearly bullseye prediction by stating, "By the end of 2023, we should see bitcoin at a minimum of $45,000," which he declared already in January.
Mark W. Yusko, the head of Morgan Creek, in February, precisely identified that the next bull market could start as early as the second quarter of 2023, due to favourable macroeconomic conditions. He noted that it was unlikely for the U.S. Federal Reserve to reduce the key interest rate during this period. However, a slowdown or pause in rate adjustments would be seen as a positive sign for risk assets, including cryptocurrencies. Yusko, emphasizing the upcoming halving, pointed out that the digital asset market's recovery usually starts nine months prior to such events, indicating that this rally should have commenced by the end of summer 2023.
Experts at Matrixport, comparing January's BTC quotes with historical data and anticipating a deceleration in the U.S. Consumer Price Index (CPI) growth, accurately predicted that the flagship cryptocurrency's rate might reach $29,000 by summer and $45,000 by Christmas. This precise hit on the target was made evident by their analysis.
Trader, analyst, and founder of venture company Eight, Michael Van De Poppe, released a video review predicting the coin's rise to $40,000 by year-end, a forecast made at the start of March. Similarly, Mike Novogratz, CEO of Galaxy Digital, projected a rise to $40,000, with the caveat that this level would be achieved only when the U.S. Federal Reserve started reducing the key interest rate. Dave the Wave, a trader known for several accurate predictions, voiced the same $40,000 target in May, emphasizing that this was his conservative estimate.
BTC/USD fell below $25,000 in the first half of June, and the market was yet to learn that in just a few days, major financial institutions would start submitting applications to the SEC for entering the cryptocurrency market through spot bitcoin ETFs. Among the contenders for launching these funds were global asset managers like BlackRock, Invesco, Fidelity, and others. At this point, Business Insider took an interest in expert predictions. Let's look at a few opinions gathered from their survey.
Jagdeep Sidhu, President of Syscoin Foundation, believed that despite several crypto storms, the ecosystem's resilience had become evident. The market had recovered from the ashes of FTX, and if inflation in the U.S. decreased, bitcoin could reach $38,000 by year-end, Sidhu stated. David Uhryniak, Director of Ecosystem Development at TRON, along with Benjamin Cowen, was confident that bitcoin would end the year above $35,000.
A consensus forecast from another survey conducted by Finder.com among 29 analysts pointed to a price of $38,488 by year-end, with bitcoin's peak values in 2023 expected to be around $42,000. Naturally, individual expert predictions varied. Overall, most survey participants (59%) were optimistic about BTC, considering summer a good time to enter the market, 34% advised holding existing cryptocurrency, and 7% recommended selling it.
2023: Above or Below the Target
Certainly, not all predictions were as close to the year's outcomes. Another frequently cited target in forecasts was the $50,000 mark, which, according to the analyst known as CryptoYoddha, experts at TradingShot, and former Goldman Sachs top manager and CEO of Real Vision Raoul Pal, BTC/USD was expected to reach. Legendary trader and analyst Peter Brandt, who accurately predicted BTC's 2018 correction, set his sights even higher this time. He believed the coin would reach its previous highs near $68,000 in the second half of 2023, followed by another correction and a new all-time high.
In late January 2023, the analyst under the pseudonym Plan B predicted that the flagship currency would rise to $100,000 by year-end. Moreover, he estimated that bitcoin could test the $42,000 level as early as March, citing the stock-to-flow (S2F) model he developed, which measured the relationship between an asset's available supply and its production rate. However, as we now know, the $42,000 test occurred only nine months later, in December, and $100,000 remained an unattainable height.
Felix Zulauf, founder of Zulauf Asset Management, speculated that bitcoin would enter a clear bull rally around late spring 2023 and did not rule out the possibility of the asset reaching $100,000 on a sharp upward trend. Credible Crypto experts also issued an optimistic forecast, suggesting that the flagship crypto asset had a good chance of renewing its historical maximum in the $69,000 zone. A CNBC survey among influential industry figures revealed expectations of retesting $69,000 by Tether's CTO Paolo Ardoino, while Marshall Beard, the Strategy Director of cryptocurrency exchange Gemini, pointed to $100,000. Investor and author of the famous book "Rich Dad Poor Dad," Robert Kiyosaki, named an even larger figure, claiming that by the beginning of 2024, bitcoin would reach $120,000.
The market isn't driven solely by bulls. Roaming its expanse, one can encounter bears and even "crypto-gravediggers." For instance, Bloomberg analyst Mike McGlone, in May, anticipated a bitcoin price collapse to a support level of $7,366. This was a stark contrast to his view at the end of the previous year, 2022, when McGlone predicted bitcoin would soar to $100,000.
Strategists from the British multinational financial conglomerate Standard Chartered expected that a liquidity crisis would lead to new bankruptcies of crypto exchanges and companies, resulting in BTC potentially plummeting to $5,000 in 2023. An analyst known as Grinding Poet even declared that "a retest of the 2018 lows is inevitable" and set a new target of $3,150.
2024: Optimism and Super Optimism
Bloomberg Intelligence analyst Jamie Coutts has forecasted a rise in bitcoin's price to $50,000 before the halving in April 2024. Eric Balchunas, a senior analyst at Bloomberg, explained that the SEC's approval of BTC-ETF applications would open up bitcoin to a capital market of $30 trillion. Bloomberg anticipates that the approval will occur very soon, around January 8-10. According to predictions by the analytical firm Fundstrat, this could increase daily demand for bitcoin by $100 million. In this scenario, even before the planned halving, the price of BTC could reach up to $180,000.
Adam Back, CEO of Blockstream and one of the earliest developers of BTC, likened the past few years to a biblical plague epidemic. "There was COVID-19, central banks' quantitative easing, wars affecting energy costs, inflation driving people and companies to bankruptcy," he explained. As 2023 came to a close, the effects of many of these events had diminished, according to Back. "The bankruptcies linked to Three Arrows Capital, Celsius, BlockFi, and FTX... all of that is mostly over. I don't think we're in for many big surprises." Back believes 2024 will be a year of recovery for bitcoin, responding to the upcoming halving in April and potentially reaching $100,000 before the event.
Samson Mow, former colleague of Back at Blockstream and now CEO of Jan3, agreed with this assessment. Experts at Seeking Alpha also echoed a similar figure, suggesting that the cryptocurrency should be valued around $98,000 to keep miners afloat post-halving.
Standard Chartered experts, particularly Geoff Kendrick, speak of a similar outlook. According to the bank's economists, the current situation indicates the end of the "crypto winter." However, their forecast is slightly more conservative, with the main cryptocurrency reaching the $100,000 mark only by the end of 2024. Apple co-founder Steve Wozniak also settled on this round figure. Pascal Gauthier, CEO of Ledger, David Marcus, head of Lightspark, and Vijay Ayyar, a top manager at CoinDCX, also anticipate bitcoin's price rise to $100,000.
Investor and bestselling author of "Rich Dad Poor Dad," Robert Kiyosaki, believes that the U.S. economy is on the brink of a serious crisis, and cryptocurrencies, particularly bitcoin, offer investors a safe haven in these turbulent times. Kiyosaki predicts that the halving will be a key event, potentially driving BTC's price to soar to $120,000. Markus Thielen, head of research at the crypto-financial service Matrixport, suggests a similar figure of $125,000. Renowned blogger and analyst Lark Davis believes that this event could lead to bitcoin's price rising to about $150,000, or even up to $180,000. Tom Lee, co-founder of Fundstrat, estimates a rise to $185,000.
According to calculations by Dave the Wave, BTC, post the April 2024 halving, will only rise slightly above its previous high of around $69,000 by mid-2024, but could escalate to $160,000 by year-end. Alistair Milne predicts that by the end of 2024, the BTC rate should reach $150,000-$300,000. However, he cautions, "this may well be the peak opportunity for bulls." Analysts from LookIntoBitcoin advise locking in profits when the coin appreciates to at least $110,000.
And finally, let's consider the fresh perspective of Artificial Intelligence (AI): an increasingly integral voice in such discussions. The experts at Finbold consulted Google Bard, a machine learning system, about the likely value of the flagship cryptocurrency after the much-anticipated 2024 halving. The AI predicted that bitcoin would likely reach a new all-time high, attributing this not only to the halving but also to broader BTC adoption and interest from institutional investors. Google Bard specifically noted that after the halving, bitcoin could surge to $100,000. However, the AI also highlighted factors that could limit the cryptocurrency's growth, not ruling out the possibility of a continued crypto winter in 2024.
In contrast, a scenario from Google Bard's competitor, ChatGPT, developed by OpenAI, appears more optimistic. It suggests that the main cryptocurrency could climb as high as $150,000. (Interestingly, the illustration accompanying this article was also created using AI, in this case, Microsoft Bing)
2024: Moderate Optimism and Moderate Pessimism
Consolidating all the aforementioned scenarios into a consensus forecast, with certain allowances, yields a range from $100,000 to $180,000. While this range is undoubtedly encouraging for investors, there are more conservative and even pessimistic predictions.
Analyst PlanB, having missed his target in 2023, significantly lowered his expectations. "Expect $32,000 for bitcoin before the halving," he writes, "rising to $55,000 during the halving, and then, by the end of the year, the main cryptocurrency might climb to $66,000." Arthur Hayes, former CEO of the cryptocurrency exchange BitMEX, also stated that the first cryptocurrency's quotes would reach only a "modest" goal of $70,000.
A sobering perspective comes from the company CryptoVantage, whose employees surveyed 1,000 crypto investors in the USA. Only 23% of them believe that bitcoin will reach its historical maximum of $68,917 in the upcoming year. 47% think that the coin's price will rise to this mark within five years. 78% are confident that BTC will eventually return to its historical maximum, but at an undefined future date. However, 9% believe this will never happen again.
BBC World analyst Glen Goodman joined the chorus of sceptics. He commented that the $120,000 figure "seems more like a number plucked out of thin air than a realistically grounded prediction." Goodman argues that authors of such predictions favor market bulls and overlook several key factors. The most crucial, according to him, is that U.S. financial regulators are relentlessly targeting the crypto industry with lawsuits and investigations. Against this backdrop, experts from JP Morgan believe that in 2024 the main cryptocurrency will trade around $45,000, considering this price as an upper limit indicating the asset's limited potential.
2025 and Beyond: $1,000,000 to $10,000,000. Who Predicts Higher?
"Looking too far into the future is not far-sighted," a saying attributed to Sir Winston Churchill, the Prime Minister of the United Kingdom during 1940-1945 and 1951-1955. While we might heed the advice of the esteemed British leader, some influencers still dare to make long-term predictions without fearing being seen as short-sighted.
An average result from a survey of 29 experts conducted by Finder.com indicates that BTC's price may reach $100,000 not in 2024, but only by the end of 2025, and could ascend to $280,000 by the end of 2030. An analyst known as Trader Tardigrade believes that bitcoin is following the same price structure as it did from 2013 to 2018. If his model is accurate, the beginning price "boom" could lead to bitcoin rising to $400,000 by 2026.
Venture capitalist Tim Draper, a third-generation venture capitalist and co-founder of Draper Fisher Jurvetson, is optimistic about 2025. He believes that the halving will significantly impact the main cryptocurrency's price, eventually reaching $250,000. Previously, he predicted that BTC would hit this mark by the end of 2022. When his prediction did not materialize, he extended the timeline to mid-2023. Now, Draper has revised his forecast again, stating with certainty that the main cryptocurrency will reach the targeted price by the end of June 2025. According to him, one of the growth drivers will be the adoption of BTC by women, suggesting that housewives using bitcoin for shopping could become a significant factor in the coin's widespread adoption.
Mike Novogratz, CEO of Galaxy Digital, believes that the demand for alternative financial instruments will continue to grow, with bitcoin being one of these instruments. He predicts that in the long term, bitcoin's price could reach $500,000. Doubling this estimate, Arthur Hayes, former CEO of the cryptocurrency exchange BitMEX, and Max Keiser, a former trader and TV host who is now an advisor to the president of El Salvador, have both cited a figure of $1 million per coin. Michael Saylor, the founder of MicroStrategy, has a more polarized view, stating that "bitcoin will either plummet to zero or skyrocket to $1 million."
Cathy Wood, CEO of ARK Invest, forecasts a significant increase in the total market capitalization of cryptocurrencies, reaching $25 trillion by 2030, which is an increase of more than 2100%. ARK Invest's baseline scenario envisages bitcoin's price rising to $650,000 during this period, while a more optimistic scenario projects a climb to $1,500,000. Yassine Elmandjra, an analyst at ARK Invest and a colleague of Wood, acknowledged that such a prediction for the coin's growth may seem improbable, but added that it is "quite reasonable" when considering the history of cryptocurrency development.
Larry Lepard, Managing Partner at the Boston-based investment company Equity Management Associates, has also provided a long-term forecast. He believes that over the next decade, the dollar will devalue, and people will increasingly invest in cryptocurrencies, gold, and real estate. Given bitcoin's limited supply, the digital asset will become a highly sought-after investment tool and will benefit from the collapse of fiat currency. "I believe the price of bitcoin will rise sharply. I think it will first reach $100,000, then $1 million, and eventually rise to $10 million per coin. I'm confident that my grandchildren will be shocked at how wealthy people who own just one bitcoin will become," Lepard stated.
The Artificial Intelligence ChatGPT offers a slightly more modest scenario. It suggests that the main cryptocurrency might rise to $500,000 by 2028, reach $1 million by 2032, and escalate to $5 million by 2050. However, this AI prediction comes with several conditions. Such growth is possible only if: cryptocurrency is widely adopted; bitcoin becomes a popular means for capital saving; and the coin is integrated into various financial systems. If these conditions are not met, then, according to AI calculations, by 2050, the value of the coin could range from $20,000 to $500,000.
Funeral Squad for Bitcoin: $0.0000. Who Predicts Lower?
According to Newton's Third Law, every action has an equal and opposite reaction. Although this law was formulated in 1689, it seems to apply even to 21st-century cryptocurrencies. If there are those eager to drive up the value of bitcoin, there will inevitably be others prepared to bury it deeper.
Warren Buffett, the billionaire and stock market legend, famously described bitcoin as "rat poison squared." His steadfast partner, Charles Munger, Vice Chairman of the holding company Berkshire Hathaway, is equally critical. Despite turning 100 years old on January 1, 2024 (congratulations to him), he continues to actively oppose this digital "evil."
Munger has called on the U.S. authorities to destroy bitcoin, equating investment in it to gambling. In an interview with The Wall Street Journal, he stated that the cryptocurrency industry undermines the stability of the global financial sector and argued that BTC cannot be considered an asset class as it holds no intrinsic value. He believes that it should be subject to such stringent regulatory measures that would ultimately suffocate the industry. "It's the dumbest investment I've ever seen," the renowned investor exclaimed. "I'm not proud of my country for allowing this nonsense. It's laughable that someone buys it. It's not good. It's insane. It's only harmful." The billionaire labelled everyone who disagrees with him as idiots and branded bitcoin a "spoiled product" and a "venereal disease."
Steve Hanke, a professor of economics at Johns Hopkins University, has also criticized bitcoin, asserting that the fundamental value of the first cryptocurrency is zero. He has labelled BTC as an extremely speculative asset with no economic value or utility.
Peter Schiff, President of Euro Pacific Capital and a gold enthusiast, believes that "there is nothing more inferior than cryptocurrencies" and that "bitcoin is nothing." He has compared holders of the asset to a cult. "Nobody needs bitcoin. People buy it only after being persuaded by others. Once they acquire [BTC], they immediately try to draw others into it. It's like a cult," Schiff wrote. Back in 2017, he predicted that the coin would soon become worthless. Despite the years that have passed, the entrepreneur has not changed his stance. He recently reiterated that "bitcoin's journey to zero just got a bit delayed. In the end, bitcoin will implode.".
Jamie Dimon, the head of the American banking giant JPMorgan, has also heavily criticized digital gold. During a CNBC broadcast, he expressed skepticism about the supposed 21 million coin limit of bitcoin's issuance. "How do you know? It might reach 21 million, and a picture of Satoshi [Nakamoto] might pop up and laugh at all of you," he speculated about the future.
Jim Cramer, host of CNBC's "Mad Money," also focused on the risks. He believes that no one really knows what the major players in the industry are hiding and that there are no guarantees of their honesty with their clients. According to him, any new scandal could cause a sharp decline in bitcoin's value, putting investor assets at risk. Referring to the opinion of Carley Garner, senior commodity strategist & broker at DeCarley Trading, he recommended staying away from virtual currencies.
Discussing the prospects of the flagship cryptocurrency, Dieter Wermuth, economist and partner at Wermuth Asset Management, stated that the economy would be better and simpler without bitcoin. In his view, it makes sense to abandon bitcoin altogether: it could be beneficial for overall prosperity, as investments in cryptocurrency are wasteful and divert funds from overall economic growth. Moreover, bitcoin creates social inequality, facilitates money laundering, tax evasion, and is highly energy-intensive due to mining. Dieter Wermuth even called bitcoin "the main killer of the climate."
Jenny Johnson, CEO of the investment firm Franklin Templeton, which manages assets worth $1.5 trillion, also expressed scepticism about the primary cryptocurrency. She claimed that bitcoin is the biggest distraction from real innovation. The head of Franklin Templeton is convinced that bitcoin can never become a global currency, as the U.S. government will not allow this to happen. "I can tell you that if bitcoin becomes so significant that it threatens the dollar as the reserve currency, the U.S. will limit its use," she stated.
Indeed, Mrs. Johnson's statement did not come out of nowhere. Over the past year, there has been a lot of discussion about regulatory pressure on the crypto industry, legal disputes, and astronomical fines. Gary Gensler, Chairman of the Securities and Exchange Commission (SEC) compared the current state of the crypto industry to the wild early 20th century. At that time, the agency undertook stringent measures, which he believes are necessary now to intimidate businessmen and keep the industry in check. John Reed Stark, a former SEC official, echoes Gensler's sentiments. "Cryptocurrency prices are rising for two reasons," he explains, "firstly, due to gaps in regulation and potential market manipulation; secondly, because of the possibility to sell inflated, overvalued cryptocurrency to an even bigger fool."
Such statements are not only made by U.S. authorities but also by many other government representatives worldwide. For instance, the European Central Bank declared in December 2022 that bitcoin had lost its relevance. However, the ECB later revised its assessment, noting that cryptocurrency could still serve as an alternative to fiat currency.
***
It's noteworthy that since the inception of bitcoin, its demise has been proclaimed 474 times. The death counter of the main cryptocurrency is maintained on the platform 99bitcoins. This information resource tallies what are known as "bitcoin obituaries" – statements from notable individuals, news portals, and other media outlets with significant readership, unequivocally asserting that the asset has depreciated or is about to depreciate. In 2021, there were 47 such "obituaries," in 2022 – 27, and in 2023, BTC was declared "dead" only seven times. This figure is the lowest in the last decade, indicating that bitcoin is not only alive but also continues to thrive, despite the scepticism of its detractors.
To conclude this extensive overview, let's look at some interesting statistics. According to research by DocumentingBTC, an investor who put $100 into real gold exactly 10 years ago would now have only $134 in their account. Investing in Google would have yielded $504, Facebook – $818, Amazon – $830, Netflix – $1,040, and Microsoft – $1,111. Apple investors could have seen their investment grow to $1,208. Tesla claims the third spot on the profitability podium with an increase from $100 to $4,475. NVIDIA shares rank second, growing to $8,599. However, had you invested your $100 in digital gold, bitcoin, you would now have an impressive $25,600! This is why bitcoin is often hailed as the best investment of the decade. The conclusion is yours to draw.
Happy New Year!
Summary 1/2 – 1/5
Tuesday, Jan 2, 2024
| GMT | Ccy | Events | Consensus | Previous |
|---|---|---|---|---|
| 00:01 | GBP | BRC Shop Price Index Y/Y Nov | 4.30% | |
| 01:45 | CNY | Caixin Manufacturing PMI Dec | 50.4 | 50.7 |
| 08:45 | EUR | Italy Manufacturing PMI Dec | 44.4 | 44.4 |
| 08:50 | EUR | France Manufacturing PMI Dec F | 42 | 42 |
| 08:55 | EUR | Germany Manufacturing PMI Dec F | 43.1 | 43.1 |
| 09:00 | EUR | Eurozone Manufacturing PMI Dec F | 44.2 | 44.2 |
| 09:00 | EUR | Eurozone M3 Money Supply Y/Y Nov | -1% | -1% |
| 09:30 | GBP | Manufacturing PMI Dec F | 46.4 | 46.4 |
| 14:30 | CAD | Manufacturing PMI Dec | 47.7 | |
| 14:45 | USD | Manufacturing PMI Dec F | 48.2 | 48.2 |
| 15:00 | USD | Construction Spending M/M Nov | 0.60% | 0.60% |
| GMT | Ccy | Events | |
|---|---|---|---|
| 00:01 | GBP | BRC Shop Price Index Y/Y Nov | |
| Forecast: | Previous: 4.30% | ||
| 01:45 | CNY | Caixin Manufacturing PMI Dec | |
| Forecast: 50.4 | Previous: 50.7 | ||
| 08:45 | EUR | Italy Manufacturing PMI Dec | |
| Forecast: 44.4 | Previous: 44.4 | ||
| 08:50 | EUR | France Manufacturing PMI Dec F | |
| Forecast: 42 | Previous: 42 | ||
| 08:55 | EUR | Germany Manufacturing PMI Dec F | |
| Forecast: 43.1 | Previous: 43.1 | ||
| 09:00 | EUR | Eurozone Manufacturing PMI Dec F | |
| Forecast: 44.2 | Previous: 44.2 | ||
| 09:00 | EUR | Eurozone M3 Money Supply Y/Y Nov | |
| Forecast: -1% | Previous: -1% | ||
| 09:30 | GBP | Manufacturing PMI Dec F | |
| Forecast: 46.4 | Previous: 46.4 | ||
| 14:30 | CAD | Manufacturing PMI Dec | |
| Forecast: | Previous: 47.7 | ||
| 14:45 | USD | Manufacturing PMI Dec F | |
| Forecast: 48.2 | Previous: 48.2 | ||
| 15:00 | USD | Construction Spending M/M Nov | |
| Forecast: 0.60% | Previous: 0.60% | ||
Wednesday, Jan 3, 2024
| GMT | Ccy | Events | Consensus | Previous |
|---|---|---|---|---|
| 08:30 | CHF | Manufacturing PMI Dec | 43 | 42.1 |
| 08:55 | EUR | Germany Unemployment Change Dec | 20K | 22K |
| 08:55 | EUR | Germany Unemployment Rate Dec | 5.90% | 5.90% |
| 15:00 | USD | ISM Manufacturing PMI Dec | 47.1 | 46.7 |
| 15:00 | USD | ISM Manufacturing Prices Paid Dec | 50 | 49.9 |
| 15:00 | USD | ISM Manufacturing Employment Index Dec | 45.8 | |
| 19:00 | USD | FOMC Minutes |
| GMT | Ccy | Events | |
|---|---|---|---|
| 08:30 | CHF | Manufacturing PMI Dec | |
| Forecast: 43 | Previous: 42.1 | ||
| 08:55 | EUR | Germany Unemployment Change Dec | |
| Forecast: 20K | Previous: 22K | ||
| 08:55 | EUR | Germany Unemployment Rate Dec | |
| Forecast: 5.90% | Previous: 5.90% | ||
| 15:00 | USD | ISM Manufacturing PMI Dec | |
| Forecast: 47.1 | Previous: 46.7 | ||
| 15:00 | USD | ISM Manufacturing Prices Paid Dec | |
| Forecast: 50 | Previous: 49.9 | ||
| 15:00 | USD | ISM Manufacturing Employment Index Dec | |
| Forecast: | Previous: 45.8 | ||
| 19:00 | USD | FOMC Minutes | |
| Forecast: | Previous: | ||
Thursday, Jan 4, 2024
| GMT | Ccy | Events | Consensus | Previous |
|---|---|---|---|---|
| 00:30 | JPY | Manufacturing PMI Dec F | 47.7 | 47.7 |
| 01:45 | CNY | Caixin Services PMI Dec | 51.6 | 51.5 |
| 08:45 | EUR | Italy Services PMI Dec | 49.8 | 49.5 |
| 08:50 | EUR | France Services PMI Dec F | 44.3 | 44.3 |
| 08:55 | EUR | Germany Services PMI Dec F | 48.4 | 48.4 |
| 09:00 | EUR | Eurozone Services PMI Dec F | 48.1 | 48.1 |
| 09:30 | GBP | Services PMI Dec F | 52.7 | 52.7 |
| 09:30 | GBP | Mortgage Approvals Nov | 48K | 47K |
| 09:30 | GBP | M4 Money Supply M/M Nov | 0.20% | 0.30% |
| 12:30 | USD | Challenger Job Cuts Y/Y Dec | -40.80% | |
| 13:00 | EUR | Germany CPI M/M Dec P | 0.20% | -0.40% |
| 13:00 | EUR | Germany CPI Y/Y Dec P | 3.20% | |
| 13:15 | USD | ADP Employment Change Dec | 130K | 103K |
| 13:30 | USD | Initial Jobless Claims (Dec 29) | 210K | 218K |
| 14:45 | USD | Services PMI Dec F | 51.3 | 51.3 |
| 15:30 | USD | Natural Gas Storage | -87B | |
| 16:00 | USD | Crude Oil Inventories | -7.1M | |
| 23:50 | JPY | Monetary Base Y/Y Dec | 9.00% | 8.90% |
| GMT | Ccy | Events | |
|---|---|---|---|
| 00:30 | JPY | Manufacturing PMI Dec F | |
| Forecast: 47.7 | Previous: 47.7 | ||
| 01:45 | CNY | Caixin Services PMI Dec | |
| Forecast: 51.6 | Previous: 51.5 | ||
| 08:45 | EUR | Italy Services PMI Dec | |
| Forecast: 49.8 | Previous: 49.5 | ||
| 08:50 | EUR | France Services PMI Dec F | |
| Forecast: 44.3 | Previous: 44.3 | ||
| 08:55 | EUR | Germany Services PMI Dec F | |
| Forecast: 48.4 | Previous: 48.4 | ||
| 09:00 | EUR | Eurozone Services PMI Dec F | |
| Forecast: 48.1 | Previous: 48.1 | ||
| 09:30 | GBP | Services PMI Dec F | |
| Forecast: 52.7 | Previous: 52.7 | ||
| 09:30 | GBP | Mortgage Approvals Nov | |
| Forecast: 48K | Previous: 47K | ||
| 09:30 | GBP | M4 Money Supply M/M Nov | |
| Forecast: 0.20% | Previous: 0.30% | ||
| 12:30 | USD | Challenger Job Cuts Y/Y Dec | |
| Forecast: | Previous: -40.80% | ||
| 13:00 | EUR | Germany CPI M/M Dec P | |
| Forecast: 0.20% | Previous: -0.40% | ||
| 13:00 | EUR | Germany CPI Y/Y Dec P | |
| Forecast: | Previous: 3.20% | ||
| 13:15 | USD | ADP Employment Change Dec | |
| Forecast: 130K | Previous: 103K | ||
| 13:30 | USD | Initial Jobless Claims (Dec 29) | |
| Forecast: 210K | Previous: 218K | ||
| 14:45 | USD | Services PMI Dec F | |
| Forecast: 51.3 | Previous: 51.3 | ||
| 15:30 | USD | Natural Gas Storage | |
| Forecast: | Previous: -87B | ||
| 16:00 | USD | Crude Oil Inventories | |
| Forecast: | Previous: -7.1M | ||
| 23:50 | JPY | Monetary Base Y/Y Dec | |
| Forecast: 9.00% | Previous: 8.90% | ||
Friday, Jan 5, 2024
| GMT | Ccy | Events | Consensus | Previous |
|---|---|---|---|---|
| 05:00 | JPY | Consumer Confidence Index Dec | 36.6 | 36.1 |
| 07:00 | EUR | Germany Retail Sales M/M Nov | -0.50% | 1.10% |
| 09:30 | GBP | Construction PMI Dec | 46.1 | 45.5 |
| 10:00 | EUR | Eurozone CPI Y/Y Dec P | 3.00% | 2.40% |
| 10:00 | EUR | Eurozone CPI Core Y/Y Dec P | 3.40% | 3.60% |
| 10:00 | EUR | Eurozone PPI M/M Nov | -0.10% | 0.20% |
| 10:00 | EUR | Eurozone PPI Y/Y Nov | -8.70% | -9.40% |
| 13:30 | USD | Nonfarm Payrolls Dec | 168K | 199K |
| 13:30 | USD | Unemployment Rate Dec | 3.80% | 3.70% |
| 13:30 | USD | Average Hourly Earnings M/M Dec | 0.30% | 0.40% |
| 13:30 | CAD | Net Change in Employment Dec | 13.2K | 24.9K |
| 13:30 | CAD | Unemployment Rate Dec | 5.90% | 5.80% |
| 15:00 | USD | ISM Services PMI Dec | 52.7 | 52.7 |
| 15:00 | USD | Factory Orders M/M Nov | 2.30% | -3.60% |
| 15:00 | CAD | Ivey PMI Dec | 55 | 54.7 |
| GMT | Ccy | Events | |
|---|---|---|---|
| 05:00 | JPY | Consumer Confidence Index Dec | |
| Forecast: 36.6 | Previous: 36.1 | ||
| 07:00 | EUR | Germany Retail Sales M/M Nov | |
| Forecast: -0.50% | Previous: 1.10% | ||
| 09:30 | GBP | Construction PMI Dec | |
| Forecast: 46.1 | Previous: 45.5 | ||
| 10:00 | EUR | Eurozone CPI Y/Y Dec P | |
| Forecast: 3.00% | Previous: 2.40% | ||
| 10:00 | EUR | Eurozone CPI Core Y/Y Dec P | |
| Forecast: 3.40% | Previous: 3.60% | ||
| 10:00 | EUR | Eurozone PPI M/M Nov | |
| Forecast: -0.10% | Previous: 0.20% | ||
| 10:00 | EUR | Eurozone PPI Y/Y Nov | |
| Forecast: -8.70% | Previous: -9.40% | ||
| 13:30 | USD | Nonfarm Payrolls Dec | |
| Forecast: 168K | Previous: 199K | ||
| 13:30 | USD | Unemployment Rate Dec | |
| Forecast: 3.80% | Previous: 3.70% | ||
| 13:30 | USD | Average Hourly Earnings M/M Dec | |
| Forecast: 0.30% | Previous: 0.40% | ||
| 13:30 | CAD | Net Change in Employment Dec | |
| Forecast: 13.2K | Previous: 24.9K | ||
| 13:30 | CAD | Unemployment Rate Dec | |
| Forecast: 5.90% | Previous: 5.80% | ||
| 15:00 | USD | ISM Services PMI Dec | |
| Forecast: 52.7 | Previous: 52.7 | ||
| 15:00 | USD | Factory Orders M/M Nov | |
| Forecast: 2.30% | Previous: -3.60% | ||
| 15:00 | CAD | Ivey PMI Dec | |
| Forecast: 55 | Previous: 54.7 | ||
Week Ahead – US Jobs Report and Eurozone Inflation to Kickstart the New Year
- NFP report and Eurozone CPI will be the week’s focal point on Friday
- FOMC minutes and ISM PMIs will also be crucial for the US dollar
- Canadian employment and Chinese PMIs might attract attention too
Rate cut bets in overdrive
It’s been one big rollercoaster ride for the US dollar in 2023, as hopes of a Fed pivot were repeatedly dented by surprisingly strong economic data, which more often than not, has come from the robust performance of the American labour market. But traders seem surer this time that a pivot is just around the corner, as Fed chief Powell himself has dropped subtle hints about it.
Thus, despite a powerful rebound during the summer and autumn, the greenback looks set to finish the year with losses of almost 3% against a basket of currencies. That rally was driven by a surge in Treasury yields, which have since been tarnished by heightened expectations of aggressive rate cuts over the coming year.
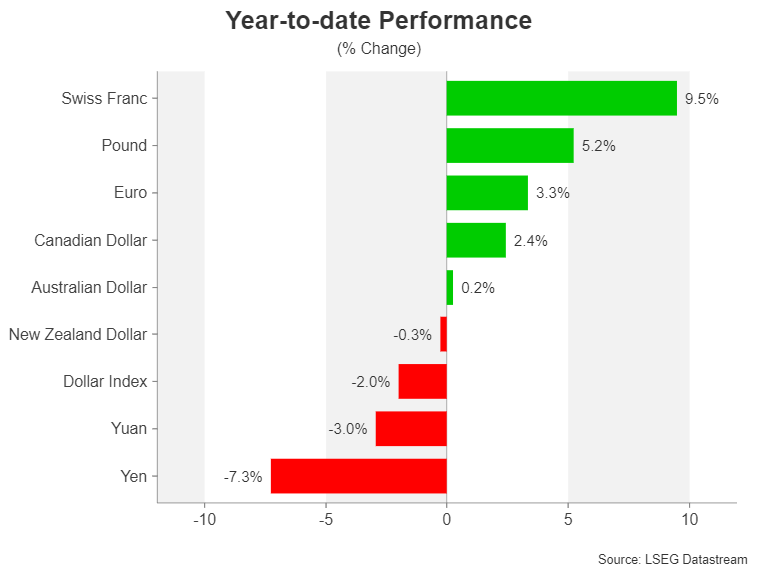
Cumulative rate cut odds for 2024 are fast approaching 160 basis points. This seems excessive when considering that the US economy is not in recession and Fed officials are only predicting about three 25-bps cuts. The minutes of the December meeting that produced those forecasts are due on Wednesday and FOMC members might attempt to use the publication to reinforce their view of only modest policy easing over the next couple of years.
A not too cold, not too hot jobs report
Another clue on the rate path will be policymakers’ outlook on the jobs market as they’ve recently indicated that as inflation comes down, their focus on the Fed’s other mandate – employment – will increase.
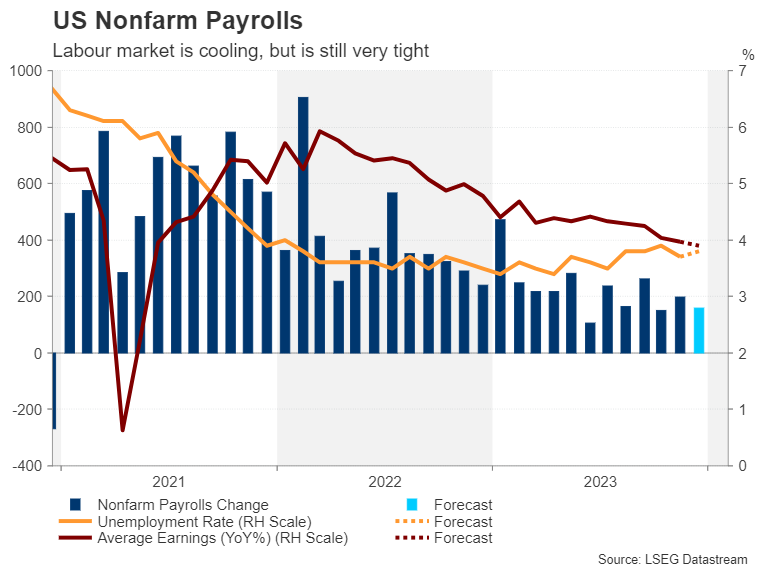
This might explain Powell’s lack of caution in being eager to steer policy towards easing on fear that holding rates at restrictive levels for too long might push up the unemployment rate. However, it’s been so far so good as far as the labour market is concerned. Jobs growth has slowed but companies aren’t laying off staff in big numbers, allowing wages to rise at a moderate pace.
Analysts don’t expect this picture to have altered much in December. Nonfarm payrolls are projected to rise by 158k, down from 199k in November, while the jobless rate is forecast to tick up slightly to 3.8%. Average earnings aren’t anticipated to rock the boat either, with the month-on-month rate expected at 0.3% and the year-on-year figure at 3.9% versus 4.0% previously.
Will there be a rude awakening for the markets?
Given investors’ strong conviction that the Fed will soon start slashing rates, a small beat or miss in the headline print is unlikely to generate anything more than a kneejerk reaction in the dollar. A very disappointing report isn’t very probable as weekly jobless claims have been quite low during the month. So if there will be a shock, it will be from an unexpectedly hot report.
The dollar could jump higher along with yields, while Wall Street could succumb to panic selling from investors scaling back their rate cut bets on the back of upbeat NFP readings. But in the event that the jobs data fails to provide any fresh direction, investors will probably turn to the other releases of the week.
These will include the ISM manufacturing and non-manufacturing PMIs, due on Wednesday and Friday, respectively, the JOLTS job openings on Wednesday, Challenger layoffs on Thursday, and factory orders on Friday.
Some risks ahead for the loonie and aussie
Across the border in Canada, the loonie will be keeping tabs on the domestic labour market as rate cut bets for the Bank of Canada have also been ratcheted up lately. The Canadian dollar is on track to have gained about 2.5% against its US counterpart in 2023, faring somewhat better than the other commodity-linked currencies, the Australian and New Zealand dollars. Less exposure to China and a more unquestionably hawkish stance by the BoC have contributed to its relative outperformance versus the aussie and kiwi.
However, there’s a risk that 2024 might be more of a struggle for the loonie if stagnating economic growth forces the Bank of Canada to start lowering rates. The country’s unemployment rate has been steadily edging up since May and likely rose further in December to 5.9%, data on Friday is expected to show.
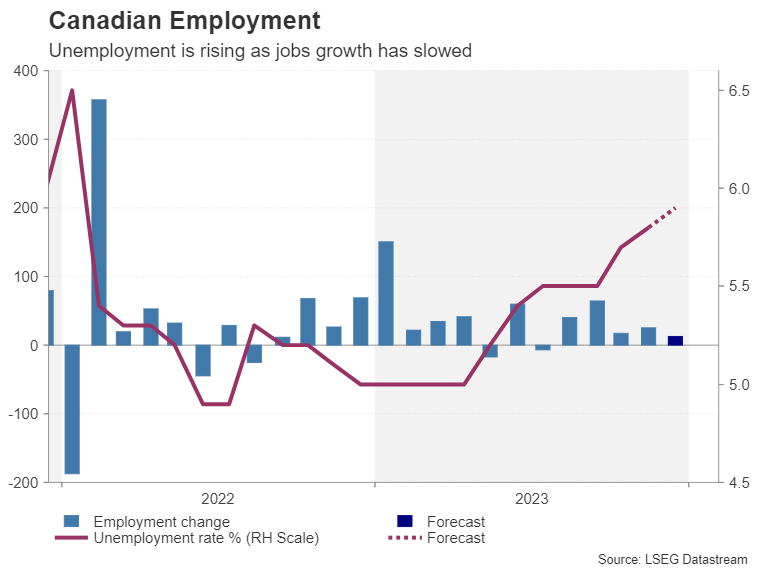
Although employment has been rising during this period, it hasn’t been able to keep pace with the growth in the number of jobseekers. It’s expected that the economy added just 13.2k jobs in December. Nevertheless, wage growth remains elevated at 5.0% so investors will be watching that figure too, as well as the latest Ivey PMI gauge on Friday.
PMI data will also be important for the Australian dollar as China’s two sets of releases are due next week. The official government survey is out on Sunday and the Caixin/S&P Global version will follow on Tuesday. Any slowdown in China’s manufacturing PMIs in December could hurt risk sentiment at the turn of the year, weighing on equities as well as the aussie.
Eurozone inflation could reverse decline
A currency that will probably take the middle spot in the 2023 FX league table is the euro. The single currency has had a few ups and downs of its own over the past year, but overall, it’s been propped up by a more hawkish-than-anticipated ECB. It’s likely, though, that in 2024, a weaker Eurozone economy will spur the European Central Bank to slash rates more than the Fed. Yet, with US yields falling faster than Eurozone ones, the euro has come out a winner from all the frenzy of rate cut speculation.
Unlike the Fed, the ECB is wary about sending any pivot signals before it can be sure that inflation is well and truly headed towards 2%. The flash CPI readings for December will probably justify this caution on Friday. Headline CPI is forecast to accelerate from 2.4% to 3.0% y/y in December, suggesting there’s still some way to go before inflation settles sustainably around the 2% target.
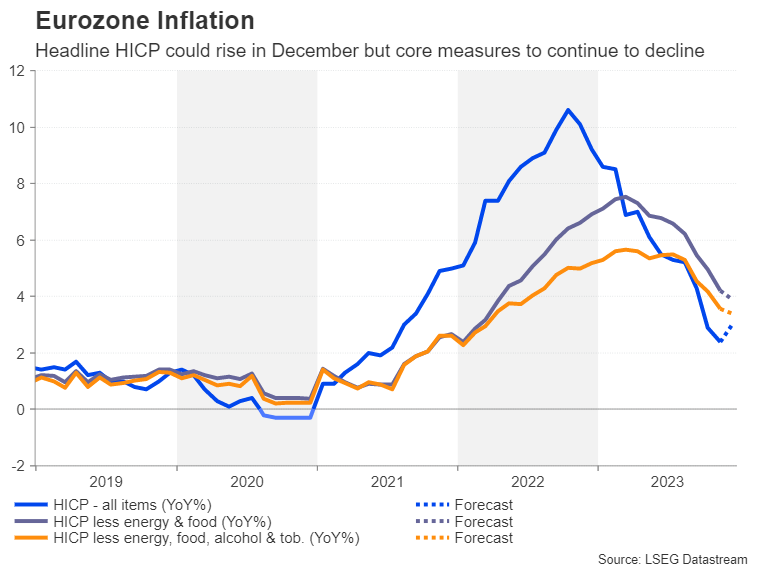
However, the forecasts for the underlying measures of inflation are more encouraging, with core CPI that excludes food and energy, as well as tobacco and alcohol prices, projected to decline from 3.6% to 3.4% y/y.
If that turns out to be the case, investors may well leave their rate cut wagers untampered, meaning there may not be any additional boost for the euro against the greenback from any pickup in headline inflation.