Sample Category Title
EUR/CHF Daily Outlook
Daily Pivots: (S1) 0.9281; (P) 0.9323; (R1) 0.9389; More...
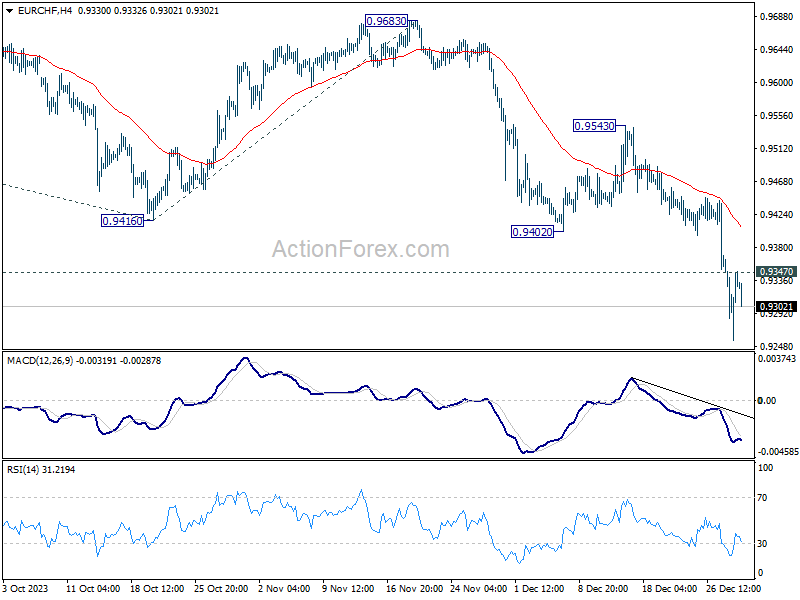
Intraday bias in EUR/CHF remains on the downside for the moment. Current fall would target 100% projection of 0.9995 to 0.9416 from 0.9683 at 0.9104 next. On the upside, above 0.9347 minor resistance will turn intraday bias neutral first. But outlook will stay bearish as long as 0.9543 resistance holds, even in case of strong recovery.
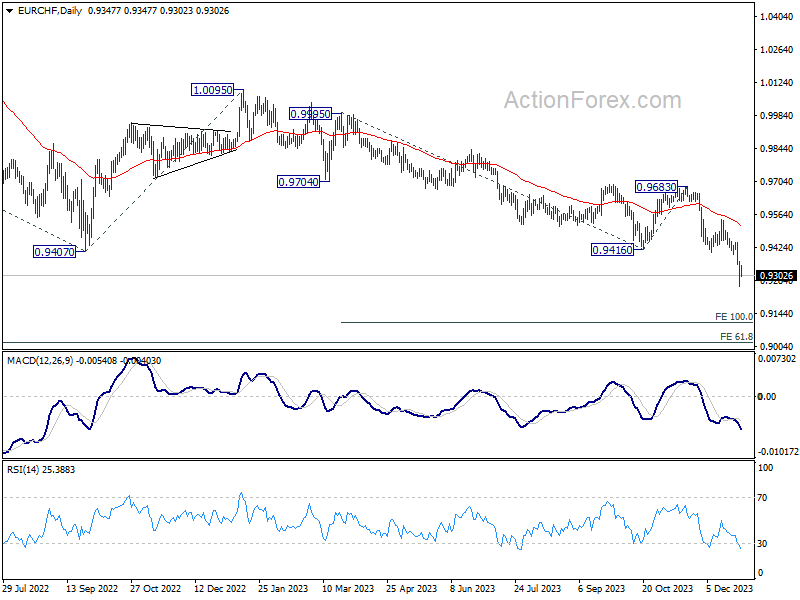
In the bigger picture, medium term outlook remains bearish as long as 0.9683 resistance holds. Current fall from 1.2004 (2018 high) is part of the multi-decade down trend. Next target is 61.8% projection of 1.1149 (2020 high) to 0.9407 from 1.0095 at 0.9018.
AUD/USD and NZD/USD Regain Strength
AUD/USD is moving higher and might climb further above 0.6870. NZD/USD is also rising and could extend its increase above the 0.6370 resistance zone.
Important Takeaways for AUD USD and NZD USD Analysis Today
- The Aussie Dollar started a fresh increase above the 0.6760 and 0.6800 levels against the US Dollar.
- There is a bullish flag forming with resistance near 0.6845 on the hourly chart of AUD/USD at FXOpen.
- NZD/USD is gaining bullish momentum above the 0.6320 support.
- There is a short-term contracting triangle forming with support near 0.6320 on the hourly chart of NZD/USD at FXOpen.
AUD/USD Technical Analysis
On the hourly chart of AUD/USD at FXOpen, the pair started a fresh increase from the 0.6725 support. The Aussie Dollar was able to clear the 0.6760 resistance to move into a positive zone against the US Dollar.
There was a close above the 0.6800 resistance and the 50-hour simple moving average. Finally, the pair tested the 0.6870 zone. A high is formed near 0.6869 and the pair is now consolidating gains.
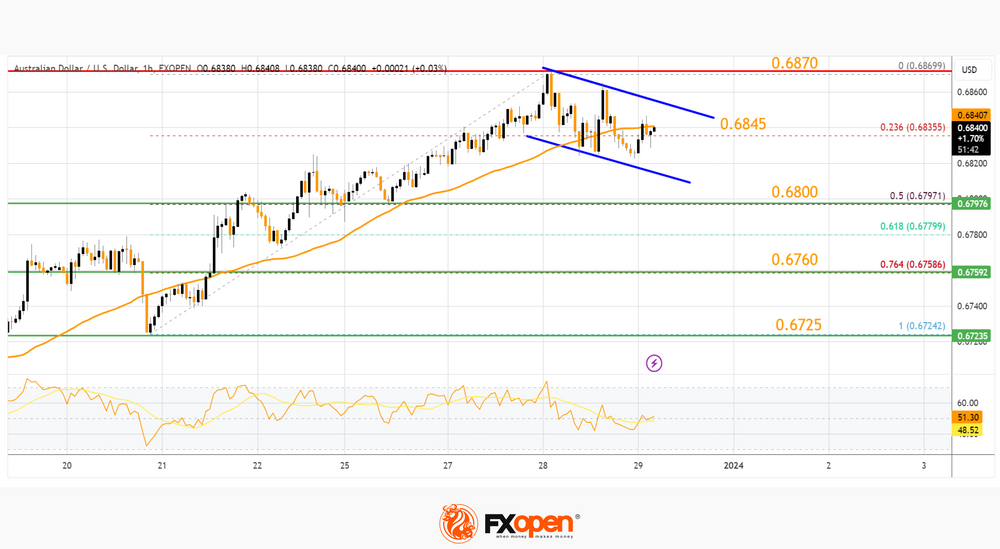
There was a minor move below the 23.6% Fib retracement level of the upward move from the 0.6724 swing low to the 0.6869 high.
On the downside, initial support is at 0.6820. The next support could be the 50% Fib retracement level of the upward move from the 0.6724 swing low to the 0.6869 high at 0.6800. If there is a downside break below the 0.6800 support, the pair could extend its decline toward the 0.6760 zone.
Any more losses might signal a move toward 0.6660. On the upside, the AUD/USD chart indicates that the pair is now facing resistance near 0.6845. There is also a bullish flag forming with resistance near 0.6845.
The first major resistance might be 0.6870. An upside break above the 0.6870 resistance might send the pair further higher. The next major resistance is near the 0.6920 level. Any more gains could clear the path for a move toward the 0.7000 resistance zone.
NZD/USD Technical Analysis
On the hourly chart of NZD/USD on FXOpen, the pair started a steady increase from the 0.6240 level. The New Zealand Dollar broke the 0.6290 resistance to start the recent increase against the US Dollar.
The pair settled above 0.6305 and the 50-hour simple moving average. It tested the 0.6370 zone and is currently consolidating gains above the 23.6% Fib retracement level of the upward wave from the 0.6238 swing low to the 0.6369 high.
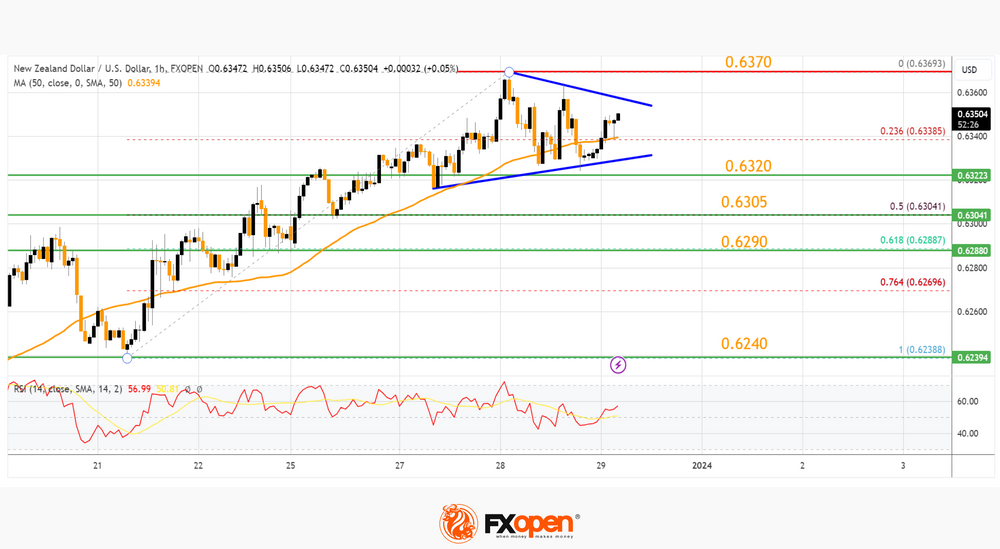
The NZD/USD chart suggests that the RSI is still above 50 and signaling more upsides. On the upside, the pair might struggle near 0.6360. The next major resistance is near the 0.6370 level.
A clear move above the 0.6370 level might even push the pair toward the 0.6400 level. Any more gains might clear the path for a move toward the 0.6500 resistance zone in the coming days.
On the downside, there is a short-term contracting triangle forming with support near 0.6320. The next major support is near the 50% Fib retracement level of the upward wave from the 0.6238 swing low to the 0.6369 high at 0.6305.
If there is a downside break below the 0.6305 support, the pair might slide toward the 0.6290 support. Any more losses could lead NZD/USD in a bearish zone to 0.6240.
This article represents the opinion of the Companies operating under the FXOpen brand only. It is not to be construed as an offer, solicitation, or recommendation with respect to products and services provided by the Companies operating under the FXOpen brand, nor is it to be considered financial advice.
Swiss KOF rises to 97.8, outlook subdued despite improvement
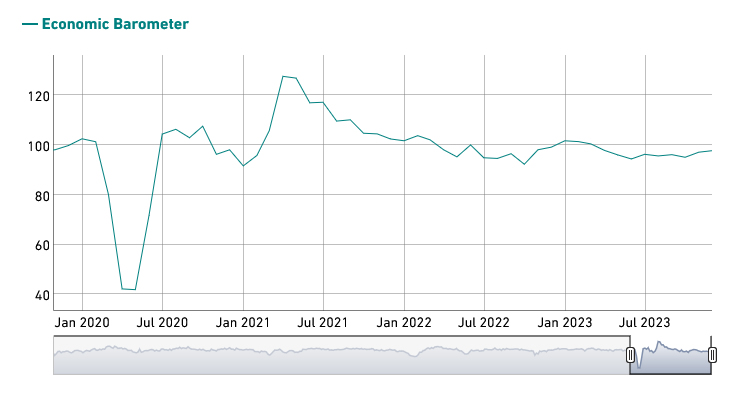
Swiss KOF Economic Barometer rose modestly from 96.7 to 97.8 in December, slightly above expectation of 97.3. KOF said, " The outlook for the Swiss economy for the start of 2024 therefore remains subdued despite a further improvement."
KOF also noted that the barometer's increase was primarily driven by positive developments in the manufacturing sector and indicators related to private consumption. However, indicators in other economic sectors remained largely unchanged from the previous month.
The Finish Line
Here we are, on the last trading day of the year. This year was completely different than what was expected. We were expecting the US to enter recession, but the US printed around 5% growth in Q3. We were expecting the Chinese post-Covid reopening to boost Chinese growth and fuel global inflation, but a year after the end of China’s zero-Covid measures, China is suffocating due to an unexpected deflation and worsening property crisis. We were expecting last year’s negative correlation between stocks and bonds to reverse – as recession would boost bond appetite but batter stocks. None happened.
The biggest takeaway of this year is the birth of ChatGPT which propelled AI right into the middle of our lives. Nasdaq 100 stocks close the year at an ATH, Nvidia – which was the biggest winner of this year’s AI rally dwarfed everything that compared to it. Nvidia shares gained more than 350% this year. That’s more than twice the performance of Bitcoin – which also had a good year mind you.
Besides Nvidia, ChatGPT’s sugar daddy Microsoft, Apple, Amazon, Meta, Google and Tesla – the so-called Magnificent 7 generated almost all of the S&P500 and Nasdaq100’s returns this year. And thanks to this few handfuls of stocks, Nasdaq100 is set for its best year since 1999 following a $7 trillion surge.
The million-dollar question is what will happen next year. Of course, we don’t know, nobody knows, and our crystal balls completely missed the AI rally that marked 2023, yet the general expectation is a cool down in the technology rally, and a rebalancing between the big tech stocks and the S&P493 on narrowing profit lead for the Magnificent 7 compared to the rest of the index in 2024.
The other thing is, the S&P500’s direction next year is unclear as the Federal Reserve (Fed) is expected to start chopping the interest rates, with the first-rate cut expected to happen as early as much with more than 85% probability. So what will the Fed cuts mean for the S&P500? Looking at what happened in the past, the S&P500 typically rises after the first rate cut, but the sustainability of the gains will depend on the underlying economic fundamentals. Lower rates are good for the S&P500 valuations EXCEPT when the economy enters recession within the next 12 months. So that backs the idea that I have been trying to convey here since weeks: lower US yields will be supportive of the S&P500 valuations as long as the economy remains strong, and earnings expectations hold up.
For now, they do. The S&P500 earnings will certainly end a bit better than flat this year, and the EPS is expected to rise by more than 10% next year. The Magnificent 7 are expected to post around 22% EPS growth next year. But note that, these expectations are mostly priced in, so yes, there will still be a hangover and a correction period after a relentless two-month rally triggered a broad-based risk euphoria among investors. The S&P500 is about to print its 9th consecutive week of gains – which would be its longest winning streak in 20 years.
In the FX, the US dollar index rebounded yesterday as treasury yields rose following a weak sale of 7-year notes. But the US dollar is still set for its worse year since 2020. Gold prepares to close the year near ATH, the EURUSD will likely reach the finish line above 1.10 and the USDJPY having tested but hasn’t been able to clear the 140 support. In the coming weeks, I would expect the EURUSD to ease on rising expectations from the ECB doves, and/or on the back of a retreat from the Fed doves. We could see a minor rebound in the USDJPY if the Japanese manage to calm down the BoJ hawks’ ambitions. Overall, I wouldn’t be surprised to see the US dollar recover against most majors in the first weeks of next year.
In the energy, crude oil remains downbeat. The barrel of American crude couldn’t extend rally after breaking the $75pb earlier this week, and that failure to add on to the gains is now bringing the oil bears back to the market. The barrel of US crude sank below the $72pb as the US oil inventories slumped by more than 7mio barrels last week, much more than a 2-mio-barrel decline expected. The latter brought forward the demand concerns and washed out the supply worries due to the Red Sea tensions. Note that crude oil is set for its biggest yearly decline since 2020; OPEC’s efforts to curb production and the rising geopolitical tensions in the Middle East remained surprisingly inefficient to boost appetite in oil this year.
EUR/USD Daily Outlook
Daily Pivots: (S1) 1.1031; (P) 1.1086; (R1) 1.1116; More...
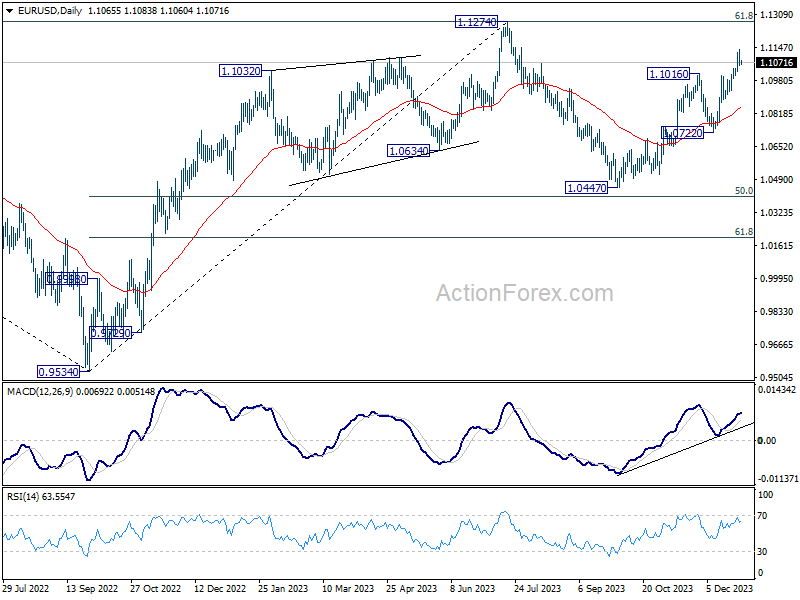
Intraday bias in EUR/USD remain neutral for consolidations below 1.1138 temporary top. Further rally is expected as long as 1.0929 support holds. Break of 1.1138 will resume the rise from 1.0447 to retest 1.1274 high. Strong resistance should be seen from there to limit upside, at least on first attempt. Meanwhile, break of 1.0929 will indicate short term topping and turn bias back to the downside for 1.0772 support.
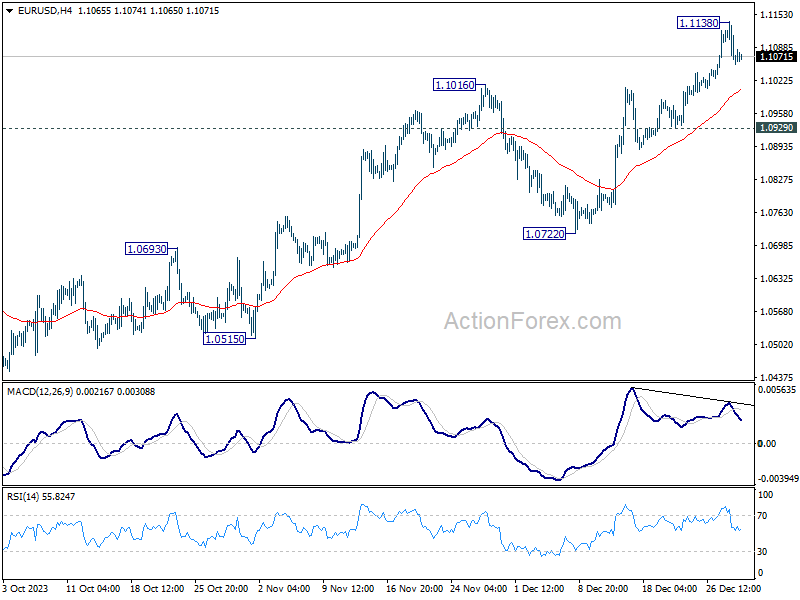
In the bigger picture, price actions from 1.1274 are viewed as a corrective pattern to rise from 0.9534 (2022 low). Rise from 1.0447 is seen as the second leg. While further rally could cannot be ruled out, upside should be limited by 1.1274 to bring the third leg of the pattern. Meanwhile, sustained break of 1.0722 support will argue that the third leg has already started for 1.0447 and below.
GBP/USD Daily Outlook
Daily Pivots: (S1) 1.2687; (P) 1.2757; (R1) 1.2802; More...
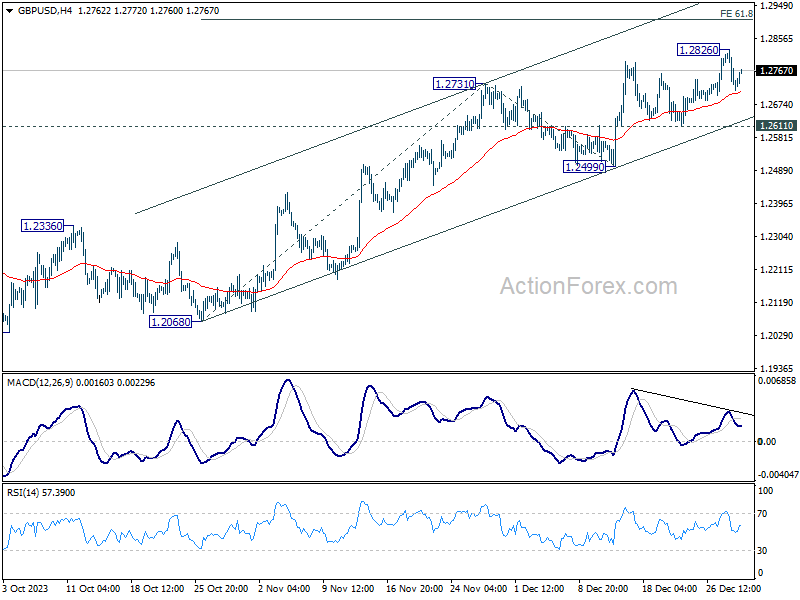
Intraday bias in GBP/USD remains neutral for the moment. Further rise is in favor as long as 1.2611 support holds. Above 1.2826 will resume larger rise from 1.2036 to 61.8% projection of 1.2068 to 1.2731 from 1.2499 at 1.2909. Nevertheless, break of 1.2611 will indicate short term topping, and turn bias back to the downside for 1.2499 support.
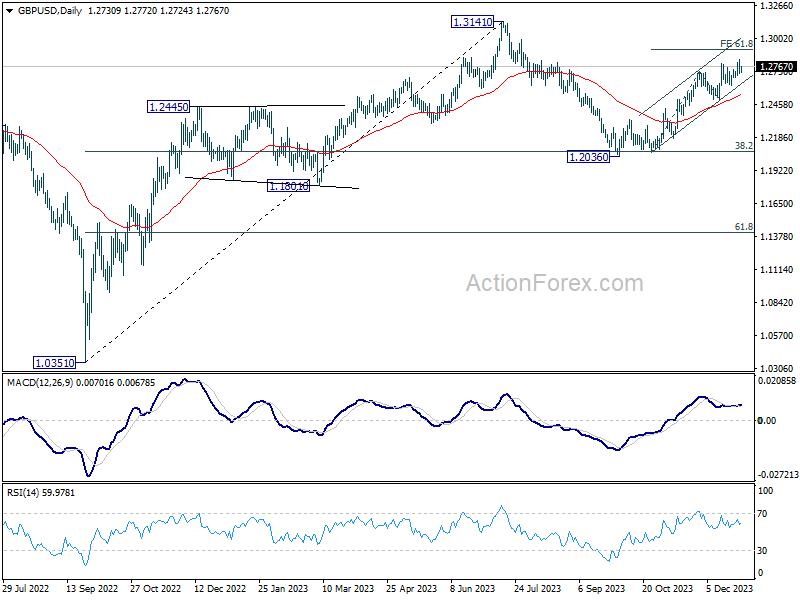
In the bigger picture, price actions from 1.3141 medium term top are seen as a corrective pattern to rise from 1.0351 (2022 low). Rise from 1.2036 is seen as the second leg that's in progress. Upside should be limited by 1.3141 to bring the third leg of the pattern. Meanwhile, break of 1.2499 support will argue that the third leg has already started for 38.2% retracement of 1.0351 (2022 low) to 1.3141 at 1.2075 again.
USD/CHF Daily Outlook
Daily Pivots: (S1) 0.8370; (P) 0.8412; (R1) 0.8490; More....
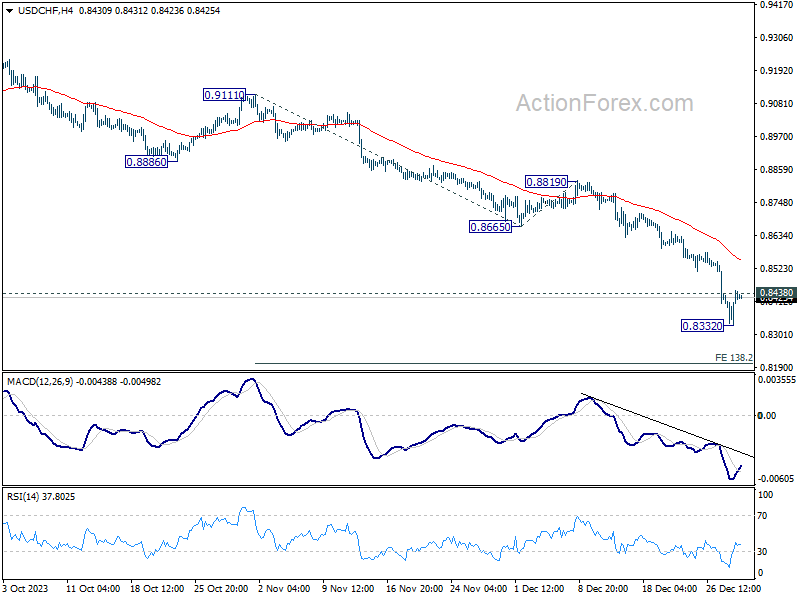
Intraday bias in USD/CHF is turned neutral with current recovery, and some consolidations would be seen above 0.8332 temporary low. Outlook will stay bearish as long as 0.8665 support turned resistance holds. Break of 0.8332 will resume larger fall from 0.9243 to 138.2% projection of 0.9111 to 0.8665 from 0.8819 at 0.8203 next.
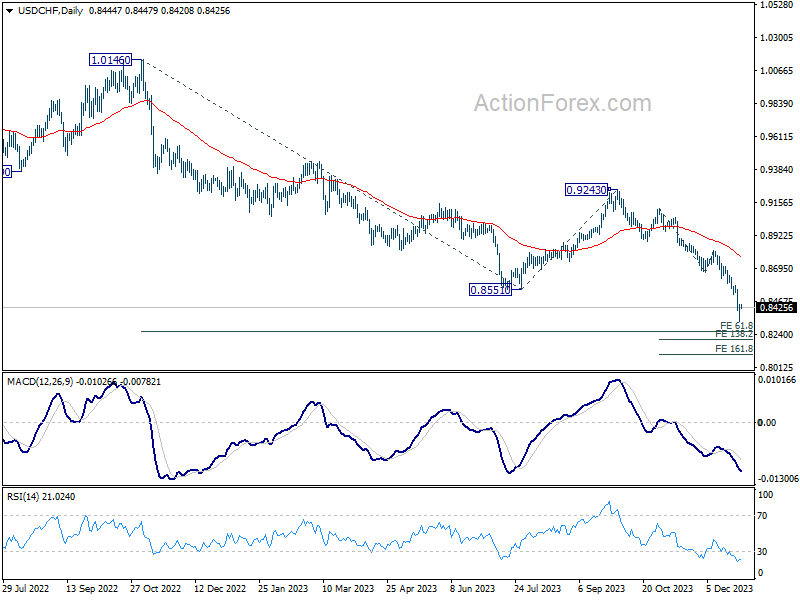
In the bigger picture, break of 0.8551 support indicates resumption of whole decline from 1.0146 (2022 high). Next target is 61.8% retracement of 1.0146 to 0.8551 from 0.9243 at 0.8257. Sustained break there could prompt downside acceleration to 100% projection at 0.7648. This will now remain the favored case as long as 0.8819 resistance holds.
USD/JPY Daily Outlook
Daily Pivots: (S1) 140.50; (P) 141.16; (R1) 142.08; More...
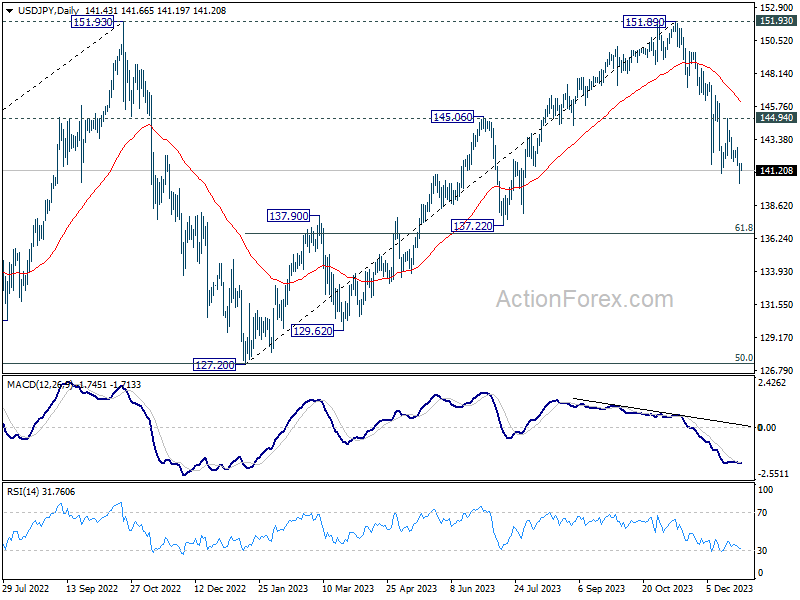
Intraday bias in USD/JPY remains on the downside for the moment. Current fall from 151.89 would target 136.63 fibonacci level. On the upside, above 142.84 minor resistance will turn intraday bias neutral gain. But recovery should be limited below 144.94 resistance to bring another decline.
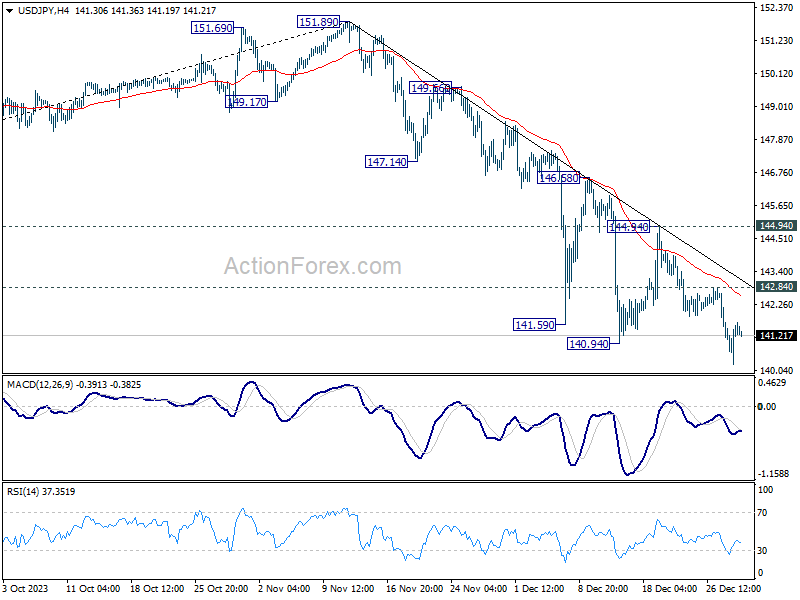
In the bigger picture, fall from 151.89 is seen as the third leg of the corrective pattern from 151.93 (2022 high). Deeper decline would be seen to 61.8% retracement of 127.20 to 151.89 at 136.63, sustained break there will pave the way to 127.20 support (2022 low). This will now remain the favored as long as 146.58 resistance holds.
USD/CAD Daily Outlook
Daily Pivots: (S1) 1.3196; (P) 1.3216; (R1) 1.3249; More...
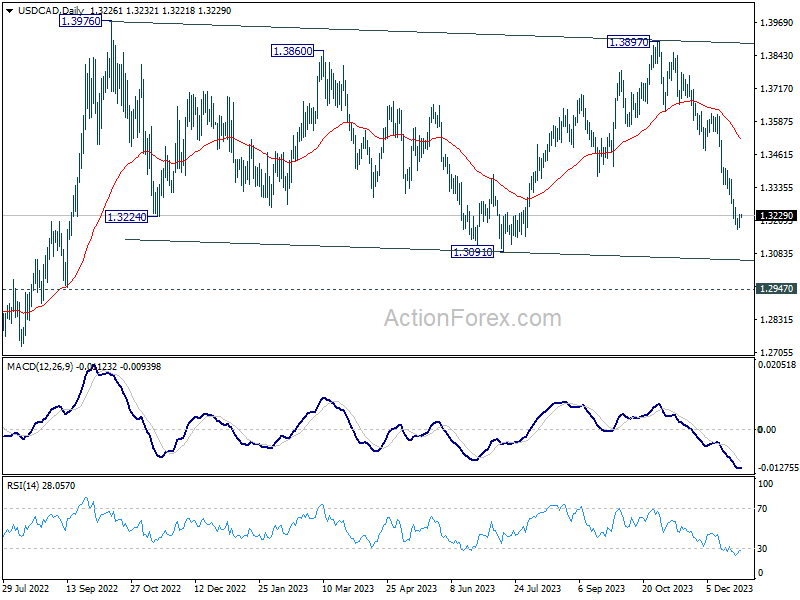
Intraday bias in USD/CAD is turned neutral first with current recovery. On the downside, break of 1.3176 will resume the fall from 1.3897 to 1.3091 support and possibly below. Nevertheless, considering bullish convergence condition in 4H MACD, break of 1.3284 will indicate short term bottoming, and turn bias back to the upside for stronger rebound.
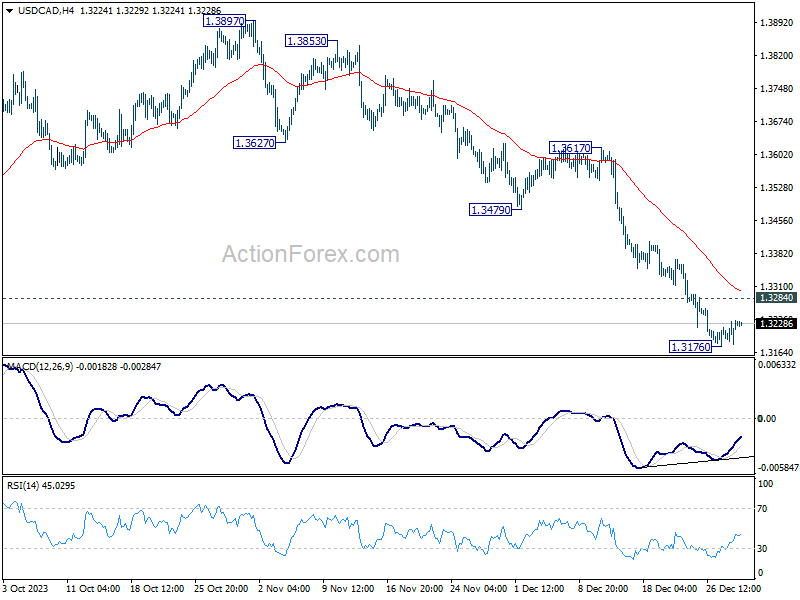
In the bigger picture, outlook is mixed up by deeper then expected fall from 1.3897. But after all, price actions from 1.3976 (2022 high) are viewed as a corrective pattern that's in progress. Larger up trend from 1.2005 (2021 low) is still expected to resume at a later stage as long as 1.2947 resistance turned support holds.
AUD/USD Daily Report
Daily Pivots: (S1) 0.6812; (P) 0.6841; (R1) 0.6859; More...
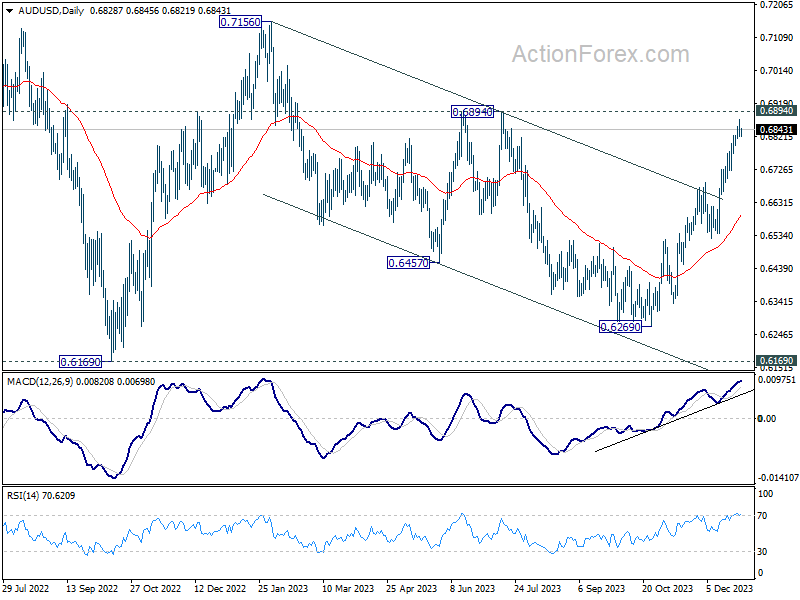
AUD/USD continues to lose upside momentum ahead of 0.6894 resistance and intraday bias is turned neutral first. On the upside, decisive break of 0.6894 will extend the rally from 0.6269 towards 0.7156 key resistance next. On the downside, however, break of 0.6796 support will indicate short term topping, on bearish divergence condition in 4H MACD. Intraday bias will be turned back to the downside for pullback to 0.6689 resistance turned support.
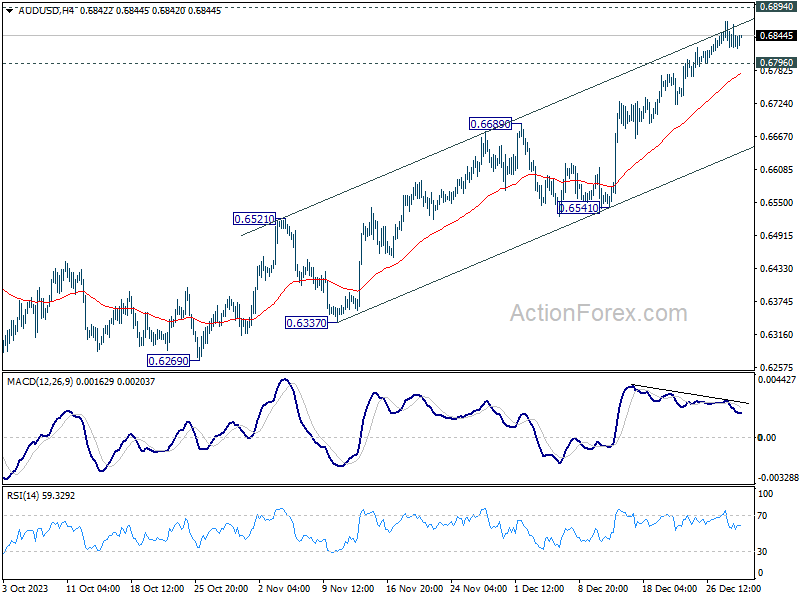
In the bigger picture, there is no confirmation that down trend from 0.8006 (2021 high) has completed. Price actions from 0.6169 (2022 low) could be just a medium term corrective pattern. Rise from 0.6269 is seen as the third leg of the pattern. For now, range trading should be seen between 0.6169 and 0.7156 (2023 high), until further developments.