Sample Category Title
Deflationary Spiral Still a Recurring Risk in China, But Yuan Remains Resilient
- November NBS Manufacturing & Non-Manufacturing PMIs for China came in weaker than expected.
- Recurring risk of the deflationary spiral in China has led to the underperformance of China & Hong Kong stock markets despite the recent bout of global risk-on-herding behaviour.
- The Chinese yuan has continued to appreciate against the US dollar driven by external factors; an increasing expectation of a dovish Fed pivot to come in Q1 2024.
- Watch the key medium-term resistance of 7.2675 on the USD/CNH (offshore yuan).
The November NBS Manufacturing PMI for China has remained a contractionary state; it declined to 49.4 from 49.5 in October and below the consensus estimate of 49.7. This observation suggests a weak external demand environment coupled with the ongoing dismantling of global manufacturing supply chains especially in the semiconductor industry due to the rivalry between the US and China in the high-tech Internet of Things space.
Even though the services sector has continued to record growth for the 11th consecutive month, the NBS Non-Manufacturing PMI for November came in at 50.2, down from 50.6 recorded in October; its weakest expansion so far in the past 11 months.
Also, new export orders sub-component data of the NBS Non-Manufacturing PMI continued to contract deeper in November from a month earlier; 46.8 versus. 49.1.
All in all, the latest spate of lackluster key economic data and the ongoing depressed property market in China have allowed the deflationary spiral narrative to resurface again despite recently implemented targeted fiscal and monetary stimulus measures to alleviate the current severe liquidity crunch faced by China’s property developers.
One of the latest indirect monetary stimulus measures in the pipeline could potentially involve China state-owned banks providing short-term unsecured loans for the first time to qualified property developers. This measure does not seem to gel well in terms of positive sentiment for the Chinese stock market as it increases moral hazard risk in the financial system as well as erodes banks’ profit margins.
China & and Hong Kong stock markets continued their persistent underperformance
China’s key benchmark stock indices and its proxies have continued to underperform month-to-date for November despite a broad-based risk-on-herding behaviour that has taken shape for the rest of the world since late October 2023 due to a weakening US dollar trend.
The CSI 300 recorded a monthly loss of -2.12% for the month of November together with similar weakness seen in the Hang Seng Index (-0.51%), Hang Seng China Enterprises Index (-0.33%), and Hang Seng TECH Index (+3.44%) that underperformed the iShares MSCI All-Country World ETF (+8.61%) over the same period.
Yuan bulls remain resilient despite weakness in China stock market
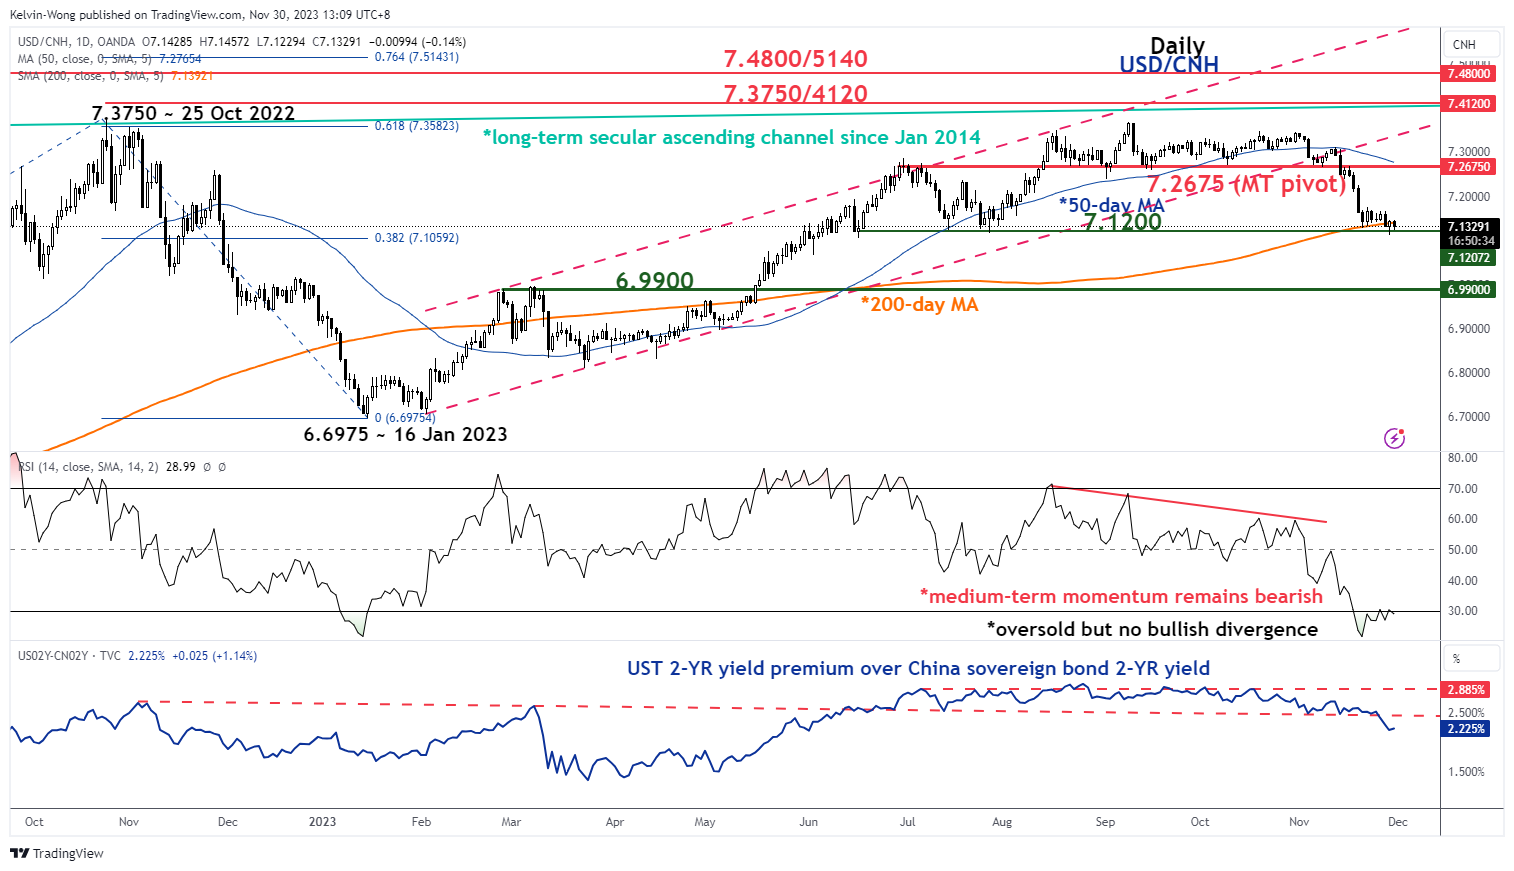
Fig 1: USD/CNH medium-term trend as of 30 Nov 2023 (Source: TradingView, click to enlarge chart)
The offshore yuan (CNH) has appreciated by +3.5% against the US dollar since 8 September 2023 and the primary catalyst is more external rather than domestic driven.
The recent yuan strength has been attributed to increasing expectations of a Fed Pivot to kickstart an interest rate cut cycle to come as soon as March next year.
Based on the current calculations from CME FedWatch Tool at this time of the writing, it has shown a 46% chance of a 25 basis points (bps) cut on the Fed Funds rate during the 20 March 2024 FOMC meeting.
This latest bout of dovish expectations on the Fed being priced by market participants has led to a significant shrinkage of the 2-year yield premium between the US Treasury note and China sovereign bond; the 2-year US Treasury note/China sovereign yield spread has dropped by -65 bps from its August 2023 print of 2.97%.
Also, the latest observation from a technical analysis perspective suggests that the yuan may continue to strengthen from a multi-week perspective as the medium-term downside momentum remains bearish for the USD/CNH (offshore yuan) foreign exchange rate as indicated by the latest reading of its daily RSI momentum indicator and trend analysis via the breakdown of its former medium-term ascending channel from 16 January 2023 low.
The USD/CNH now looks vulnerable to a further potential decline, a break below its near-term support of 7.1200 (also the key 200-day moving average) exposes the next medium-term support of 6.9900.
Only a clearance with a daily close above the 7.2675 medium-term pivotal resistance (also the downward-sloping 50-day moving average) ignites a potential medium-term bullish revival in the US dollar to see the major resistance zone coming in at 7.3750/4120 on the USD/CNH.
USD/CAD Daily Outlook
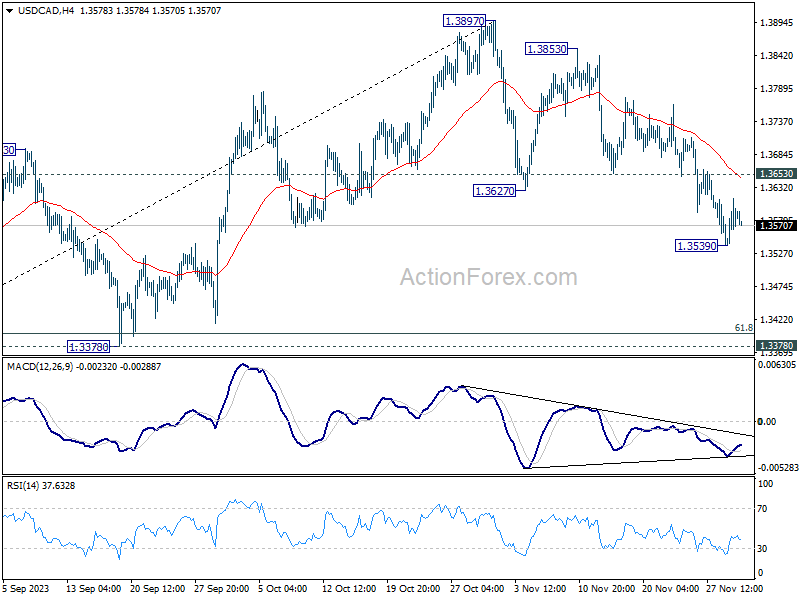
Daily Pivots: (S1) 1.3549; (P) 1.3582; (R1) 1.3623; More...
A temporary low is formed at 1.3539 with current recovery and intraday bias is turned neutral first. Further decline is expected as long as 1.3653 support turned resistance holds. Below 1.3539 will resume the correction from 1.3897 to 1.3378 support next.
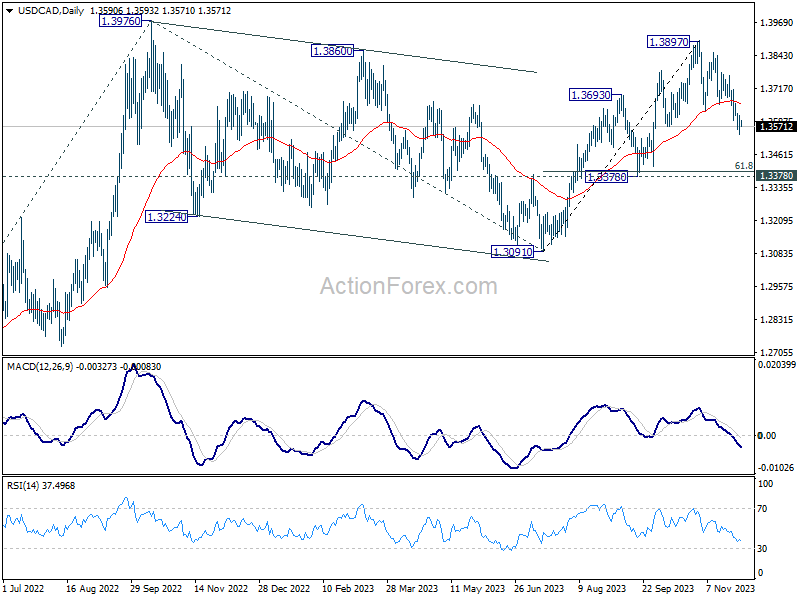
In the bigger picture, corrective pattern from 1.3976 (2022 high) should have completed with three waves down to 1.3091. Decisive break of 1.3976 high will confirm resumption of up trend from 1.2005 (2021 low). Next target is 61.8% projection of 1.2401 to 1.3976 from 1.3091 at 1.4064. This will remain the favored case as long as 1.3378 support holds.
AUD/USD Daily Report
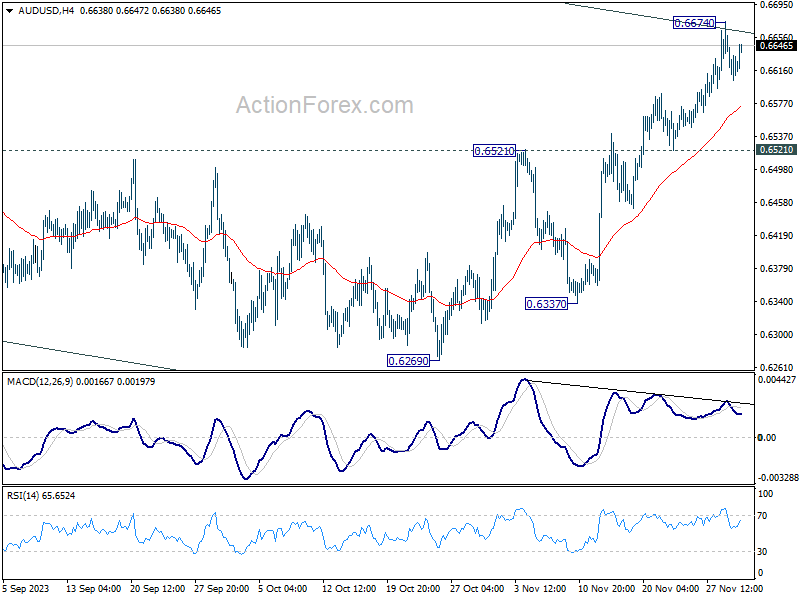
Daily Pivots: (S1) 0.6609; (P) 0.6637; (R1) 0.6678; More...
Intraday bias in AUD/USD is turned neutral with current retreat. Some more consolidations could be seen first. But further rally is expected as long as 0.6521 resistance turned support holds. On the upside, sustained break break of channel resistance (now at 0.6663) will argue that whole decline from 0.7156 has completed with three waves down to 0.6269. Further rally should then be seen to 0.6894 resistance for confirmation.
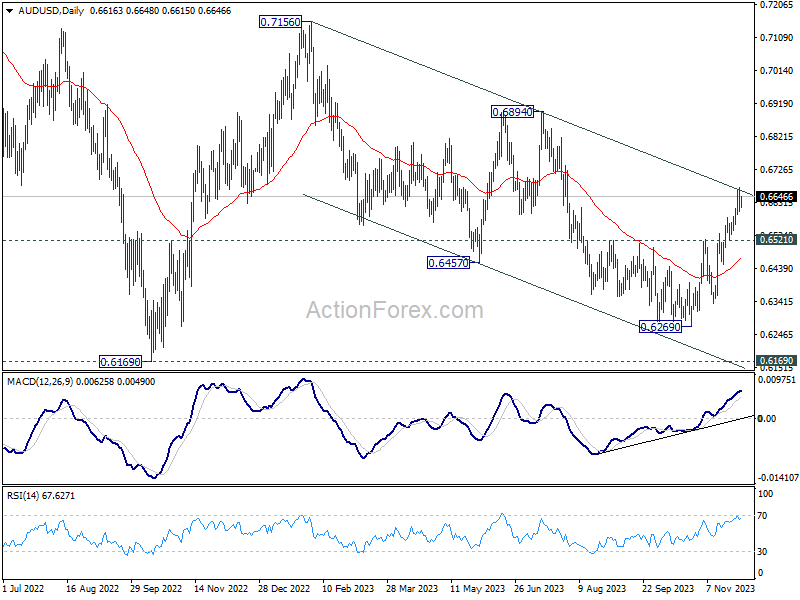
In the bigger picture, there is no confirmation that down trend from 0.8006 (2021 high) has completed. price actions from 0.6169 (2022 low) could be just a medium term corrective pattern, with rise from 0.6269 as the third leg. For now, range trading should be seen between 0.6169 and 0.7156 (2023 high), until further developments.
EUR/USD Daily Outlook
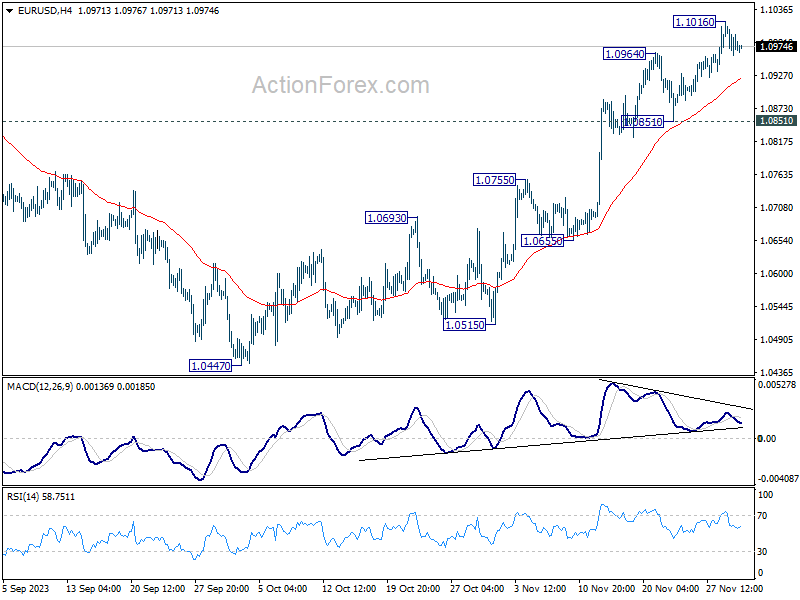
Daily Pivots: (S1) 1.0947; (P) 1.0982; (R1) 1.1004; More...
Intraday bias in EUR/USD is turned neutral with current retreat, and some consolidations would be seen first. But further rally is expected as long as 1.0851 support holds. Above 1.1016 will resume the rise from 1.0447 to 1.1274 resistance next. But strong resistance should be seen there to limit upside.
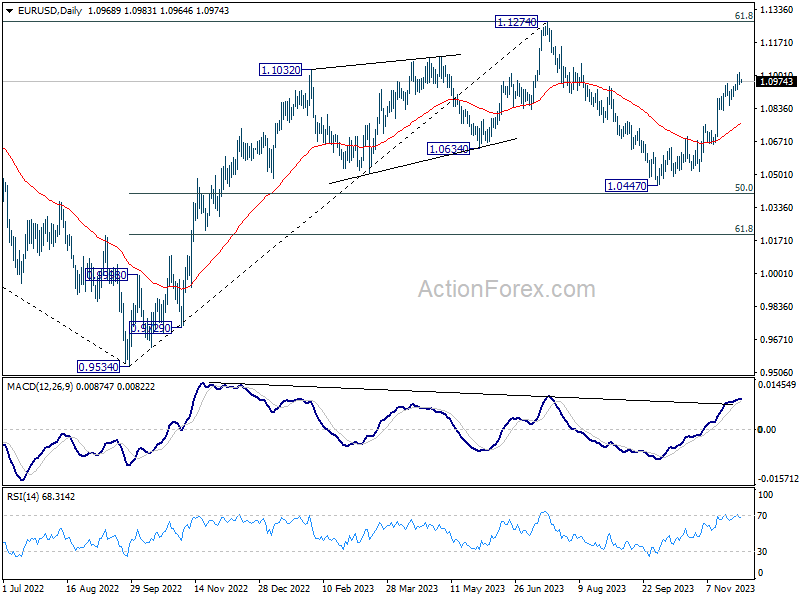
In the bigger picture, price actions from 1.1274 are viewed as a corrective pattern to rise from 0.9534 (2022 low). Rise from 1.0447 is tentatively seen as the second leg. Hence while further rally could be seen, upside should be limited by 1.1274 to bring the third leg of the pattern.
GBP/USD Daily Outlook
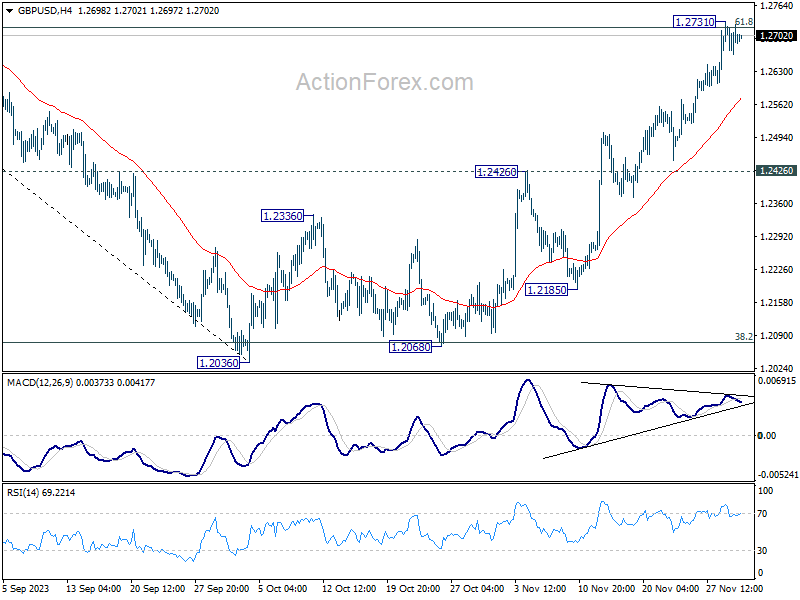
Daily Pivots: (S1) 1.2662; (P) 1.2697; (R1) 1.2730; More...
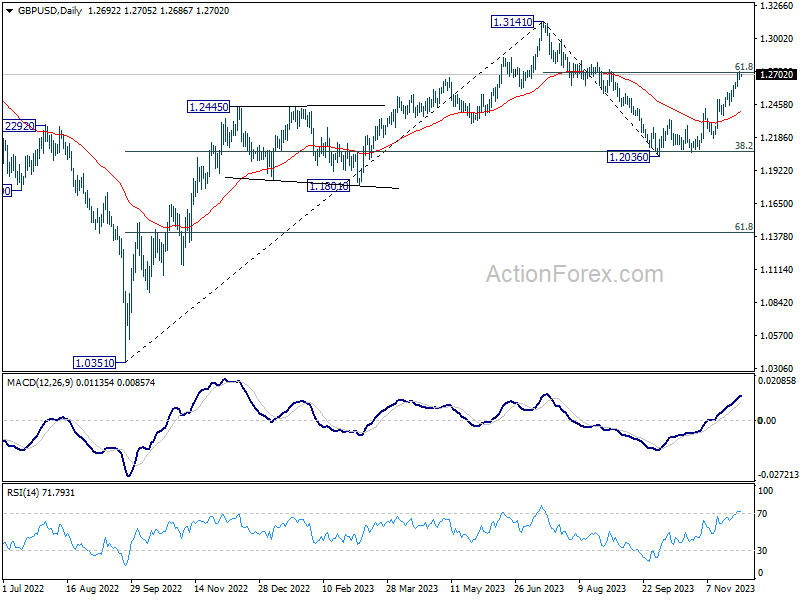
Intraday bias in GBP/USD is turned neutral first with current retreat and some more consolidations could be seen. Nevertheless, further rally is in favor as long as 1.2426 resistance turned support holds. On the upside, sustained trading above 61.8% retracement of 1.3141 to 1.2036 at 1.2716 will pave the way to retest 1.3141 high.
In the bigger picture, price actions from 1.3141 are seen as a corrective pattern to rise from 1.0351 (2022 low). Strong rebound from 38.2% retracement of 1.0351 (2022 low) to 1.3141 at 1.2075 suggests that current rise from 1.2036 is already the second leg. However, while further rally could be seen, upside should be limited by 1.3141 to bring the third leg of the pattern.
USD/CHF Daily Outlook
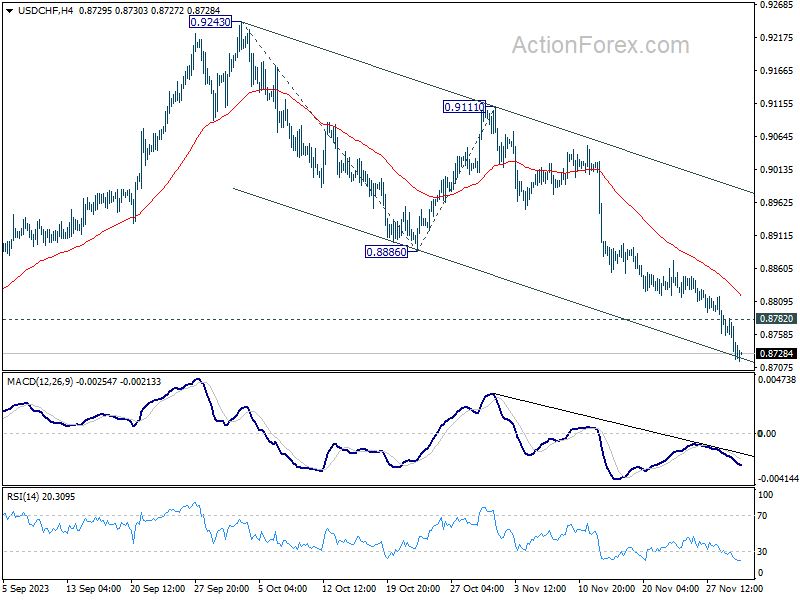
Daily Pivots: (S1) 0.8712; (P) 0.8748; (R1) 0.8775; More....
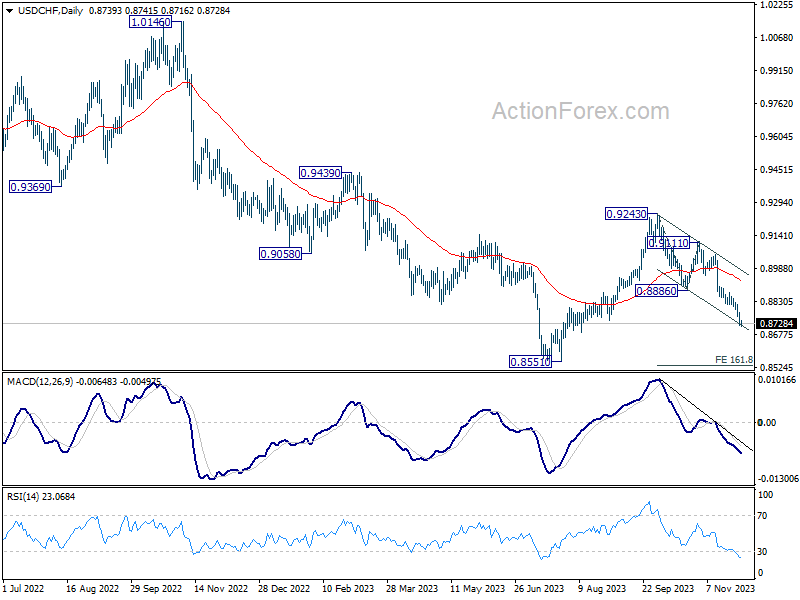
Intraday bias in USD/CHF remains on the downside for the moment. Current fall from 0.92434 should target 161.8% projection of 0.9243 to 0.8886 from 0.9111 at 0.8533, which is close to 0.8551 low. On the upside, above 0.8782 minor resistance will turn intraday bias neutral and bring consolidations first. But risk will stay on the downside as long as 0.8886 support turned resistance holds.
In the bigger picture, price actions from 0.8551 are currently seen as part of a corrective pattern to the decline from 1.0146 (2022 high). Fall from 0.9243 is seen as the second leg for now. Deeper decline could be seen to 0.8551 low but strong support should be seen there to bring rebound. For now, this will remain the favored case as long as 0.8886 resistance holds.
USD/JPY Daily Outlook
Daily Pivots: (S1) 146.63; (P) 147.27; (R1) 147.87; More...
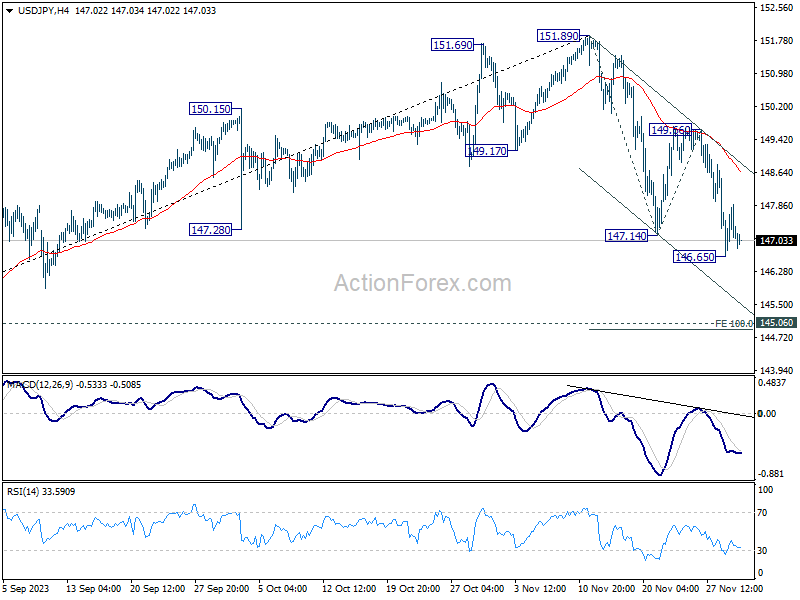
USD/JPY is staying consolidation above 146.65 temporary low and intraday bias remains neutral. While another recovery cannot be ruled out, risk will stay on the downside as long as 55 4H EMA (now at 148.75) holds. Break of 146.65 will resume the fall from 151.89 to 100% projection of 151.89 to 147.14 from 149.66 at 144.91, which is close to 145.06 key resistance turned support.
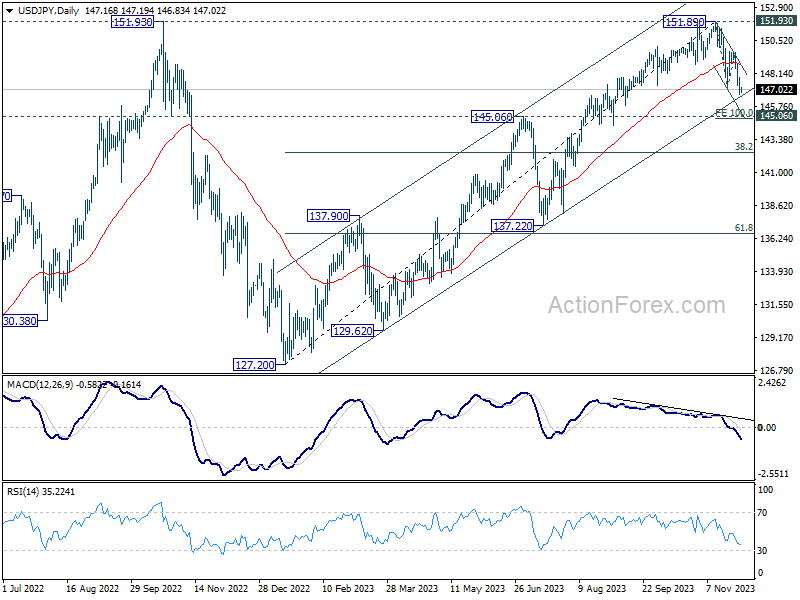
In the bigger picture, rise from 127.20 (2023 low) is seen as the second leg of the pattern from 151.93 (2022 high). Decisive break of 145.06 resistance turned support will confirm that this second leg has completed, after rejection by 151.93. Deeper fall would be seen through 38.2% retracement of 127.20 to 151.89 at 142.45 to 61.8% retracement at 136.63. Nevertheless strong bounce from 145.06 will retain medium term bullishness for another test on 151.93 at a later stage.
Dollar and Euro Slide on Rate Cut Expectations, with US PCE and Eurozone CPI in Focus
Dollar and Euro are emerging as notable underperformers for the week, largely influenced by increasing market anticipation of interest rate cuts by Fed and ECB in the coming year, a sentiment that is also impacting treasury yields. In US, 10-year treasury yield, a key benchmark for market expectations, has dropped below 4.3% for the first time since September. This movement reflects the changing perceptions of investors, who are now factoring in a greater likelihood of a shift in Fed's policy. Market probabilities indicate less than a 50% chance of a rate cut by Fed in March 2024, but expectations rise to nearly 80% for May. The release of today's US PCE inflation data is eagerly awaited, as it could either confirm the market's expectations or lead to adjustments in the outlook.
Similar trends are observed in Europe, where Germany's 10-year bund yield has crossed below 2.5% mark for the first time since August. This is attributed to traders increasingly betting on faster ECB rate cuts in the next year. Current market forecasts suggest a 90% likelihood of an initial 25bps reduction in April, followed by a cumulative decrease of 105 bps throughout the year. Consequently, Euro has weakened significantly, particularly against Sterling and Swiss Franc, breaking through key near-term support levels. There is more downside prospect for Euro if today's Eurozone CPI flash misses expectations.
Overall, Japanese Yen stands out as the strongest currency for the week, maintaining its firmness despite a mild retreat overnight. New Zealand Dollar follows as the second strongest, bolstered by RBNZ's hawkish stance. In contrast, Australian Dollar is underperforming, influenced by negative PMI data from China, a key trading partner. Canadian Dollar's performance is mixed but leans towards the softer side, similar to the Sterling. Upcoming Canadian GDP data may provide further direction for the Canadian currency.
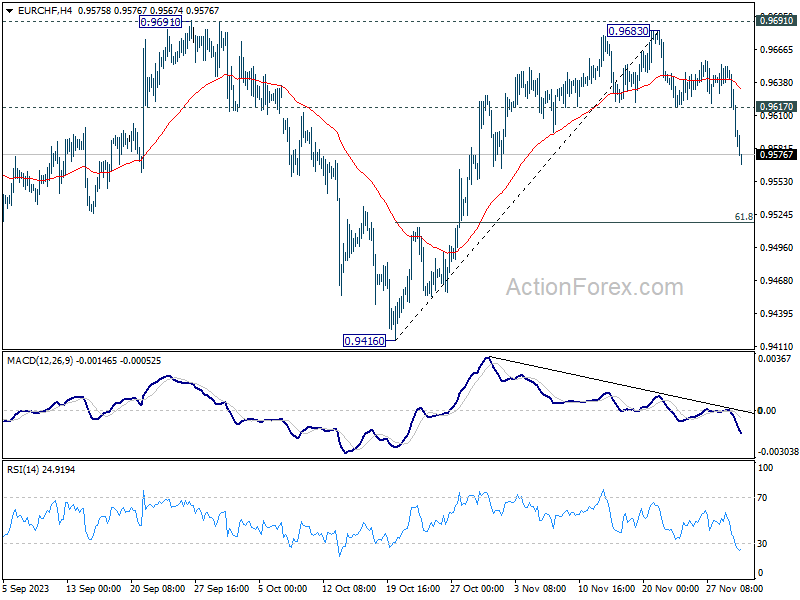
Technical analysis of the EUR/CHF pair reveals significant developments. The pair's extended decline from 0.9683 confirms a notable rejection at the 0.9691 structural resistance, diminishing the possibility of a larger bullish trend reversal. The trend now favors a more profound fall, possibly reaching the 61.8% retracement level of 0.9416 to 0.9683 at 0.9518. The market's reaction to this level will be crucial in determining whether EUR/CHF is set to resume its downtrend from the January high of 1.0095.
In Asia, at the time of writing, Nikkei is up 0.18%. Hong Kong HSI is down -0.02%. China Shanghai SSE is up 0.04%. Singapore Strait Times is down -0.38%. Japan 10-year JGB yield is up 0.0079 at 0.689. Overnight, DOW rose 0.04%. S&P 500 fell -0.09%. NASDAQ fell -0.16%. 10-year yield fell sharply by -0.065 to 4.271.
BoJ's Nakamura : More time needed before altering ultra-easy monetary stance
BoJ board member Toyoaki Nakamura, in a speech to business leaders today, emphasized that Japan has not yet reached a point where it can confidently assert that the sustained and stable achievement of BoJ's 2% inflation target, along with corresponding wage growth, is within reach. He added that the current inflation in Japan is primarily driven by "cost-push factors".
In light of this assessment, he said BoJ "must patiently maintain current monetary easing for the time being." Some more time is needed before adjusting the policy.
Nevertheless, Nakamura expressed a positive outlook on Japan's economy, describing it as recovering moderately. He also anticipates that this moderate recovery will be accompanied by increases in wages, which could play a crucial role in sustaining economic growth and achieving the inflation target.
Japan's mixed economic signals: Industrial production up, retail sales growth slows
Japan's economy presents a mixed picture based on the latest data for October 2023. Industrial production saw a notable increase, rising 1.0% mom, exceeding expectations of a 0.7% increase.
However, manufacturers surveyed by Japan's Ministry of Economy, Trade and Industry have a mixed outlook. They expect industrial output to decrease by -0.3% mom in November but anticipate a significant climb of 3.2% mom in December. This forecast points to short-term fluctuations but overall optimism towards the year's end.
In contrast to the industrial sector, retail sales figures were less encouraging. Retail sales in October rose by 4.2% yoy, falling short of the expected 5.9% yoy increase. Despite this slower growth, retail sales have continued to mark annual gains for 20 consecutive months.
However, a month-over-month analysis reveals a downturn, with retail sales falling by -1.6% in October from September, ending a three-month streak of gains.
China's manufacturing PMI slips further to 49.4, indicating continued contraction
China's NBS Manufacturing PMI slightly declined from 49.5 to 49.4 in November, marking the weakest reading since December 2022 and falling below market expectation of 49.6. This decline indicates that China's manufacturing sector has been struggling to maintain consistent growth, having been in contraction for five consecutive months since April, briefly returning to expansion in September, and then slipping back into contraction in October.
NBS statistician Zhao Qinghe attributed this downturn to several factors, including "traditional off-season" effects in some manufacturing industries and "insufficient market demand". This explanation points to both cyclical and demand-driven challenges impacting the manufacturing sector.
Within manufacturing PMI, there was a drop in new-orders subindex to 49.4 from 49.5, further reflecting the demand-side struggles. Additionally, new-export-orders subindex fell to 46.3, down from 46.8, indicating challenges in external markets and potentially reflecting global economic conditions.
PMI Non-Manufacturing also witnessed a decrease, moving from 50.6 to 50.2, which was below expected 51.1. However, within the non-manufacturing PMI, construction subindex showed an improvement, rising to 55 from 53.5. The official composite PMI, which combines both manufacturing and services, fell to 50.4 from 50.7.
NZ ANZ business confidence jumps to 30.8, but inflation concerns remain
ANZ Business Confidence in New Zealand saw a significant increase in November, reaching its highest level since March 2015, as it rose from 23.4 to 30.8. Additionally, Own Activity Outlook improved from 23.1 to 26.3.
ANZ's analysis said the results support the idea of "soft landing" for New Zealand economy. However, ANZ points out that it's still uncertain if this slowdown will be adequate to reduce inflation to target level quickly enough.
The survey also revealed varied trends across different economic indicators. Export intentions saw an uptick from 6.1 to 9.2, indicating stronger future export plans. Investment intentions also increased marginally from 3.8 to 4.5. In contrast, employment intentions experienced a slight decrease from 5.6 to 5.4, suggesting a small dip in hiring plans.
Notably, cost expectations showed a decrease from 76.0 to 73.9, which could signal easing cost pressures. Profit expectations reversed from a negative -5.6 to a positive 1.5, reflecting an improved outlook for business profitability.
The report presented a mixed view of inflation indicators. Inflation expectations continued their downward trajectory, moving from 4.94% to 4.79%. However, pricing intentions rose slightly from 46.3 to 46.8.
ANZ also commented on the market's expectations for RBNZ's OCR. They noted that while there is market anticipation for rate cuts, the current economic indicators, particularly some stalling in inflation measures and the overall robust level of activity, suggest that the RBNZ may not be inclined to lower rates soon.
Fed's Beige Book: Activity slowdown, easing labor demand, moderating price pressures
The latest Fed's Beige Book report indicates general slowdown in economic activity, with variations across different regions. Specifically, four districts reported "modest growth", two districts experienced "flat to slightly down", and six districts observed "slight declines" in activity.
This mixed picture reflects the diverse economic conditions across the country and points to a cautious economic outlook for the next six to twelve months, which is perceived to have "diminished" during the reporting period.
In terms of labor market dynamics, demand for labor "continued to ease". Most districts reported either flat or modest increases in overall employment. Wage growth across most districts was characterized as "modest to moderate". Notably, the report highlights "easing in wage pressures", with several districts even reporting declines in starting wages. This trend could be a response to the overall economic slowdown and a signal of less competition for labor.
Regarding prices, the report notes a general moderation in price increases across districts, although prices remain at elevated levels. The expectation is for "moderate price increases to continue into next year".
Fed's Mester: Monetary policy well-positioned following discernible progress on inflation
Cleveland Fed President Loretta Mester, in her remarks at a conference overnight, acknowledged that while inflation remains above Fed's 2% target, there has been "discernible progress" in controlling it, even as the "overall economy has remained relatively strong".
Mester expressed confidence in the current stance of monetary policy, stating, "Monetary policy is in a good place for policymakers to assess incoming information on the economy and financial conditions."
Highlighting the need for flexibility, Mester described the central bank's rate policy as needing to be "nimble," and she believes that "the current level of the funds rate positions us well to do that."
Mester did not rule out the possibility of further rate hikes, emphasizing that the decision to increase rates further and the duration for which the rate target remains high "will depend importantly on whether the economy is evolving as expected, how the risks are changing, and the progress being made on our dual mandate goals of price stability and maximum employment."
Looking ahead
Eurozone CPI flash will be the main focus in European session and unemployment rate will also be featured. Germany retail sales and unemployment, Swiss retail sales and KOF economic barometer will also be released.
Later in the day, US PCE inflation is the highlight, with jobless claims, Chicago PMI and pending home sales scheduled. Canada will also publish GDP data.
USD/JPY Daily Outlook
Daily Pivots: (S1) 146.63; (P) 147.27; (R1) 147.87; More...
USD/JPY is staying consolidation above 146.65 temporary low and intraday bias remains neutral. While another recovery cannot be ruled out, risk will stay on the downside as long as 55 4H EMA (now at 148.75) holds. Break of 146.65 will resume the fall from 151.89 to 100% projection of 151.89 to 147.14 from 149.66 at 144.91, which is close to 145.06 key resistance turned support.
In the bigger picture, rise from 127.20 (2023 low) is seen as the second leg of the pattern from 151.93 (2022 high). Decisive break of 145.06 resistance turned support will confirm that this second leg has completed, after rejection by 151.93. Deeper fall would be seen through 38.2% retracement of 127.20 to 151.89 at 142.45 to 61.8% retracement at 136.63. Nevertheless strong bounce from 145.06 will retain medium term bullishness for another test on 151.93 at a later stage.
Economic Indicators Update
| GMT | Ccy | Events | Actual | Forecast | Previous | Revised |
|---|---|---|---|---|---|---|
| 23:50 | JPY | Industrial Production M/M Oct P | 1.00% | 0.70% | 0.50% | |
| 23:50 | JPY | Retail Trade Y/Y Oct | 4.20% | 5.90% | 5.80% | 6.30% |
| 00:00 | NZD | ANZ Business Confidence Nov | 30.8 | 23.4 | ||
| 00:30 | AUD | Private Capital Expenditure Q3 | 0.60% | 1.00% | 2.80% | |
| 00:30 | AUD | Private Sector Credit M/M Oct | 0.30% | 0.40% | 0.50% | |
| 01:00 | CNY | NBS Manufacturing PMI Nov | 49.4 | 49.6 | 49.5 | |
| 01:00 | CNY | NBS Non-Manufacturing PMI Nov | 50.2 | 51.1 | 50.6 | |
| 05:00 | JPY | Housing Starts Y/Y Oct | -6.30% | -7.00% | -6.80% | |
| 07:00 | EUR | Germany Retail Sales M/M Oct | 0.50% | -0.80% | ||
| 07:30 | CHF | Real Retail Sales Y/Y Oct | 0.20% | -0.60% | ||
| 08:00 | CHF | KOF Economic Barometer Nov | 96.2 | 95.8 | ||
| 08:55 | EUR | Germany Unemployment Change Nov | 25K | 30K | ||
| 08:55 | EUR | Germany Unemployment Rate Nov | 5.80% | 5.80% | ||
| 09:00 | EUR | Italy Unemployment Oct | 7.40% | 7.40% | ||
| 10:00 | EUR | Eurozone Unemployment Rate Oct | 6.50% | 6.50% | ||
| 10:00 | EUR | Eurozone CPI Y/Y Nov P | 3.80% | 2.90% | ||
| 10:00 | EUR | Eurozone CPI Core Y/Y Nov P | 3.90% | 4.20% | ||
| 13:30 | CAD | GDP M/M Sep | 0.10% | 0.00% | ||
| 13:30 | USD | Personal Income M/M Oct | 0.20% | 0.30% | ||
| 13:30 | USD | Personal Spending Oct | 0.20% | 0.70% | ||
| 13:30 | USD | PCE Price Index M/M Oct | 0.10% | 0.40% | ||
| 13:30 | USD | PCE Price Index Y/Y Oct | 3.00% | 3.40% | ||
| 13:30 | USD | Core PCE Price Index M/M Oct | 0.20% | 0.30% | ||
| 13:30 | USD | Core PCE Price Index Y/Y Oct | 3.50% | 3.70% | ||
| 13:30 | USD | Initial Jobless Claims (Nov 24) | 215K | 209K | ||
| 14:45 | USD | Chicago PMI Nov | 45.4 | 44 | ||
| 15:00 | USD | Pending Home Sales M/M Oct | -0.70% | 1.10% | ||
| 15:30 | USD | Natural Gas Storage | -8B | -7B |
USDJPY Shows Incomplete Elliott Wave Bearish Sequence
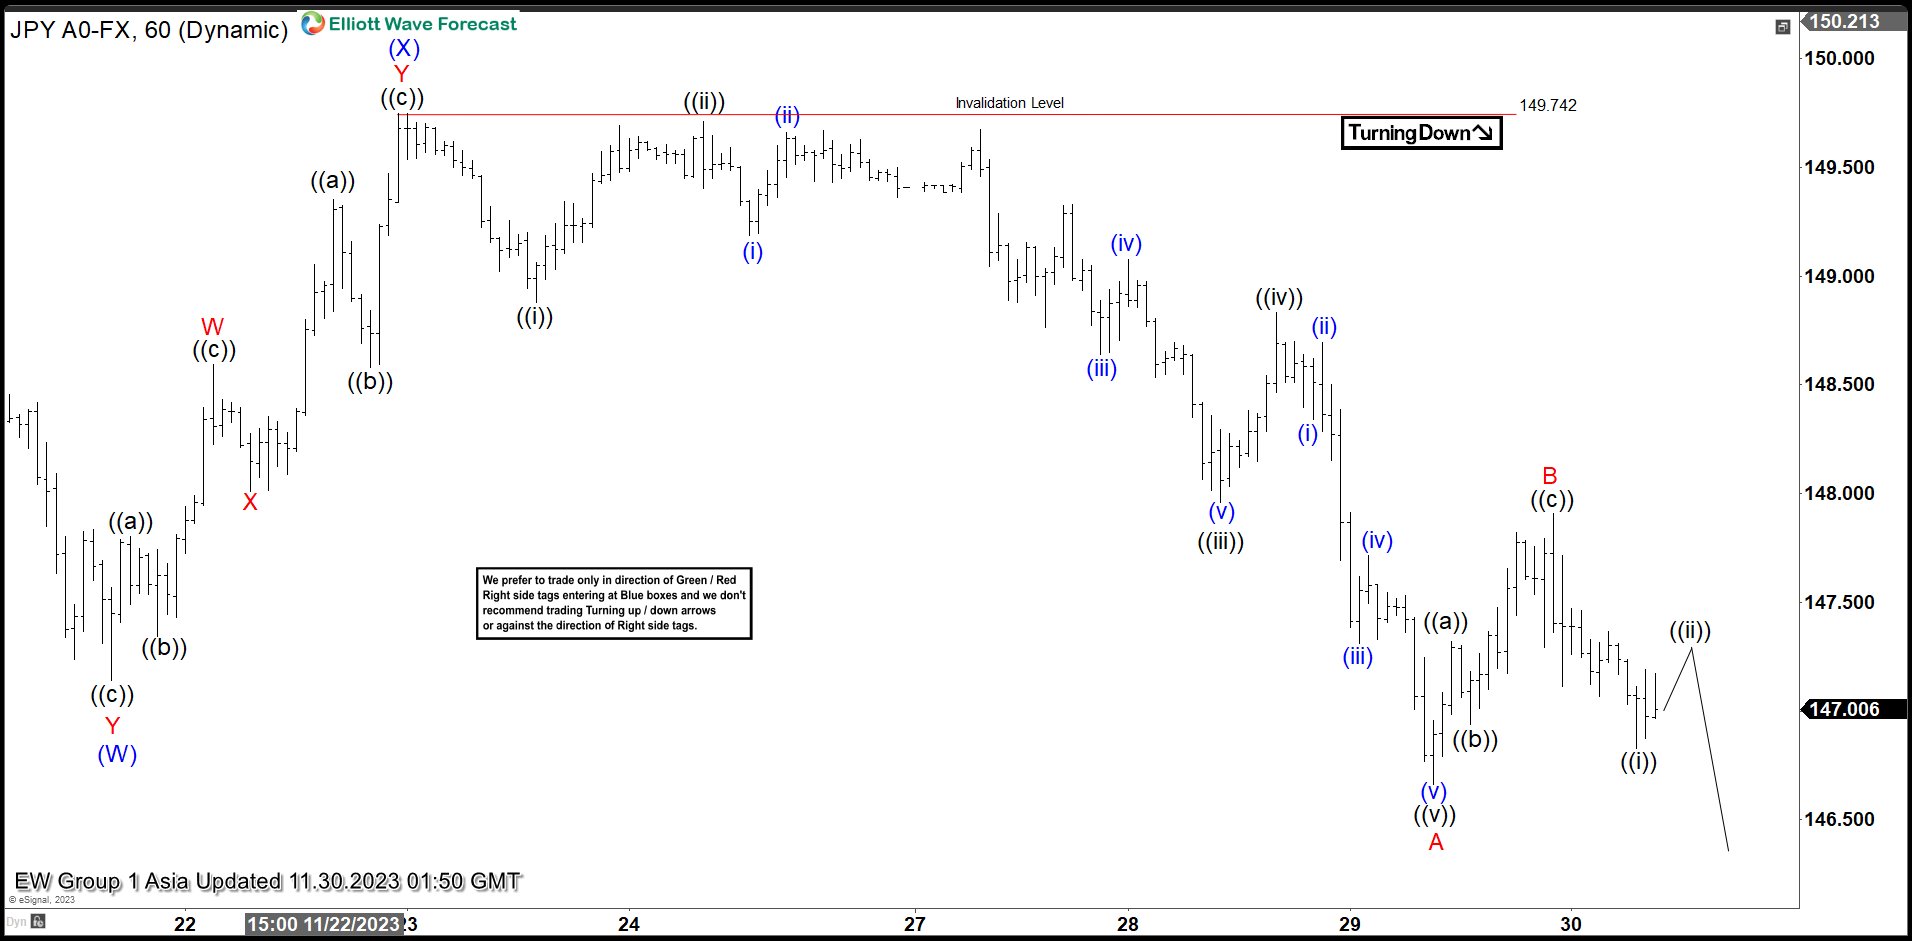
USDJPY shows incomplete bearish sequence from 11.13.2023 suggesting further downside. Down from 11.13.2023 high, decline is unfolding as a double three Elliott Wave structure. Down from 11.13.2023 high, wave (W) ended at 147.15. Wave (X) ended at 149.78 with internal subdivision as a double three in lesser degree. Up from wave (W), wave W ended at 148.59 and dips in wave X ended at 148. Wave Y higher ended at 149.78 which completed wave (X).
Wave (Y) lower is in progress with internal subdivision as a zigzag structure. Down from wave (X), wave ((i)) ended at 148.87 and wave ((ii)) rally ended at 149.71. Pair extended lower in wave ((iii)) towards 147.96 and rally in wave ((iv)) ended at 148.83. Final leg wave ((v)) ended at 146.66 which completed wave A. Rally in wave B ended at 147.9 with internal subdivision as a zigzag. Up from wave A, wave ((a)) ended at 147.32, and wave ((b)) pullback ended at 146.94. Wave ((c)) higher ended at 147.9 which completed wave B. Near term, as far as pivot at 149.78 high stays intact, expect rally to fail in 3, 7, or 11 swing for further downside in wave C.
USDJPY 60 Minutes Elliott Wave Chart
USDJPY Elliott Wave Video
https://www.youtube.com/watch?v=2zjpxgbcmZM
Technical Outlook and Review
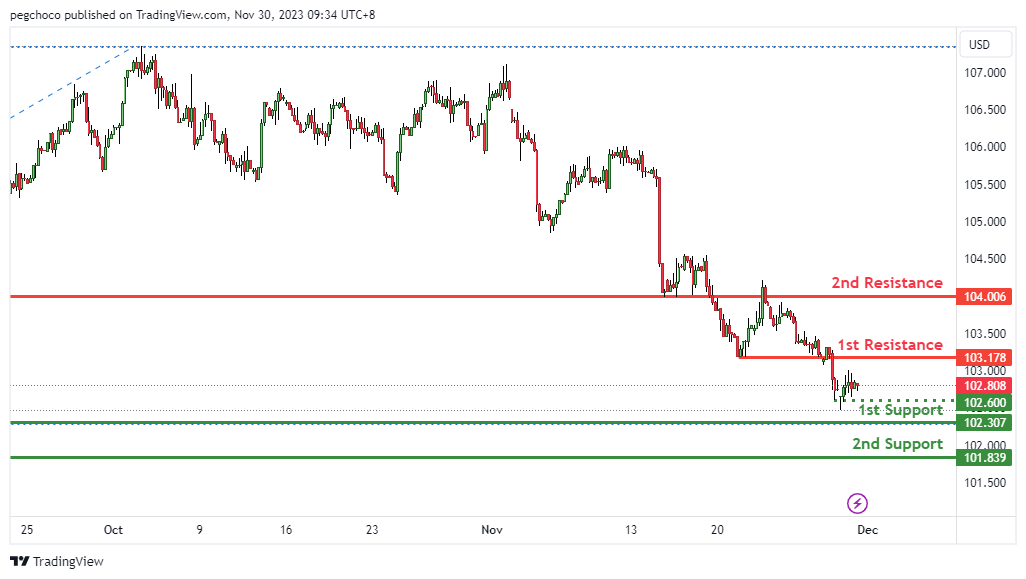
DXY:
The DXY (US Dollar Index), the overall momentum of the chart is bearish, suggesting a potential download movement in price. In this scenario could potentially make a Bearish continuation towards the 1st support.
The 1st support at 102.30 is identified as a pullback support. This suggests that it’s a significant level where buying interest may emerge, potentially providing some support for the US Dollar Index.
The 2nd support at 101.83 is another overlap support level. This adds further significance to this support level, indicating it as a potential area where buyers might become active.
On the resistance side, the 1st resistance at 102.79 is categorized as a pullback resistance. This implies that it’s a level where selling pressure may increase, acting as a potential barrier to further upward price movement for the US Dollar Index.
The 2nd resistance at 103.17 is also noted as a pullback resistance, suggesting it’s another significant level where selling interest could intensify.
Additionally, there is an intermediate support at 102.60, identified as a swing low support. This reinforces the potential support factors for the currency index.
EUR/USD:
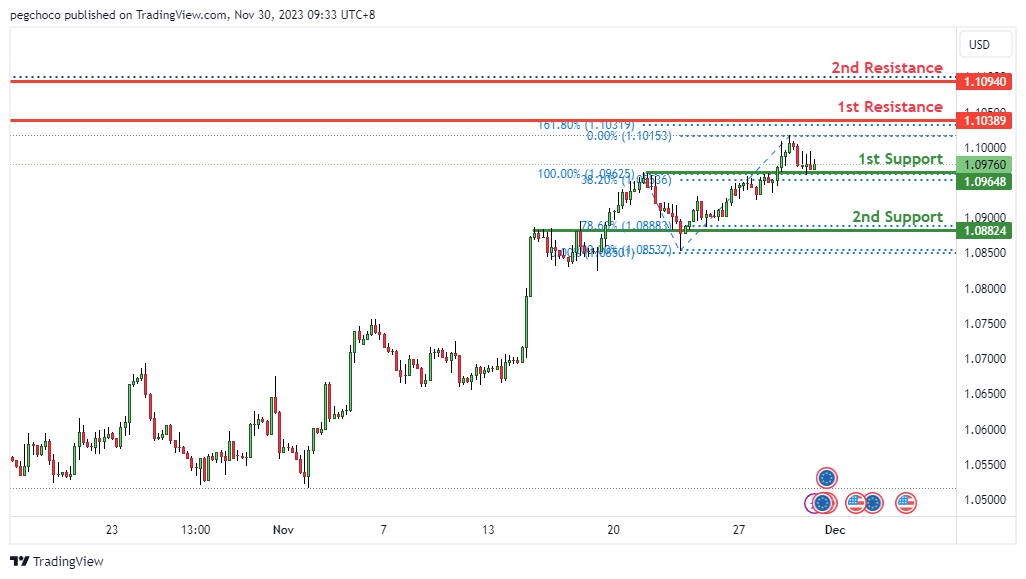
The EUR/USD, the overall momentum of the chart is bullish, suggesting a potential upward movement in price. In this scenario, there is a possibility that the price could potentially make a bullish bounce off the 1st support and head towards the 1st resistance.
The 1st support at 1.0964 is identified as a pullback support, and it also coincides with the 38.20% Fibonacci Retracement level. This suggests that it’s a significant level where buying interest may emerge, potentially leading to a bullish bounce for the EUR/USD currency pair.
The 2nd support at 1.08824 is another overlap support level, and it aligns with the 78.60% Fibonacci Retracement. This adds further significance to this support level, indicating it as a potential area where buyers might become active.
On the resistance side, the 1st resistance at 1.1038 is categorized as an overlap resistance, and it also coincides with the 161.80% Fibonacci Extension level. This dual significance suggests that it’s a significant barrier where selling interest could intensify, potentially limiting the upward movement for EUR/USD.
The 2nd resistance at 1.1094 is noted as a pullback resistance, indicating that it’s a level where selling pressure may increase, acting as another potential obstacle to the currency pair’s upward price movement.
EUR/JPY:
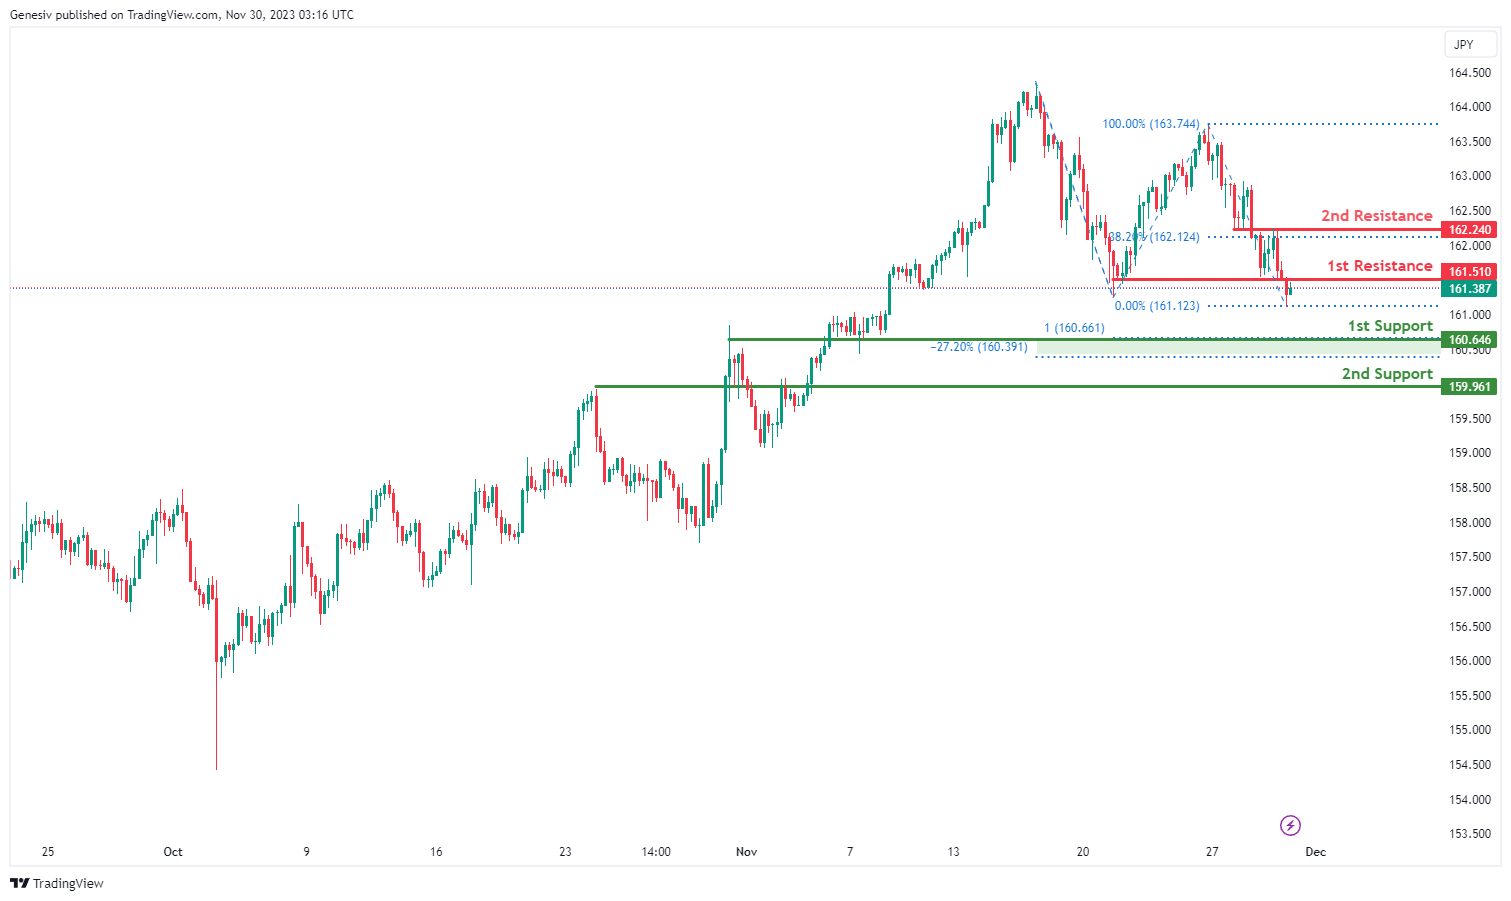
The analyzed instrument is EUR/JPY, and the overall momentum of the chart is currently bearish.
There is a potential for the price to make a bearish reaction off the 1st resistance and drop to the 1st support.
The 1st support level is identified at 160.64, and its favorable characteristics include being an overlap support, coinciding with the -27% Fibonacci Expansion, and aligning with the 100% Fibonacci Projection, indicating Fibonacci confluence.
The 2nd support level is situated at 159.96, and its favorable aspect is derived from being a pullback support.
On the resistance side, the 1st resistance is positioned at 161.51, and it is considered significant due to being a pullback resistance.
The 2nd resistance is located at 162.24, and its significance is derived from being an overlap resistance and coinciding with the 38.20% Fibonacci Retracement.
EUR/GBP:
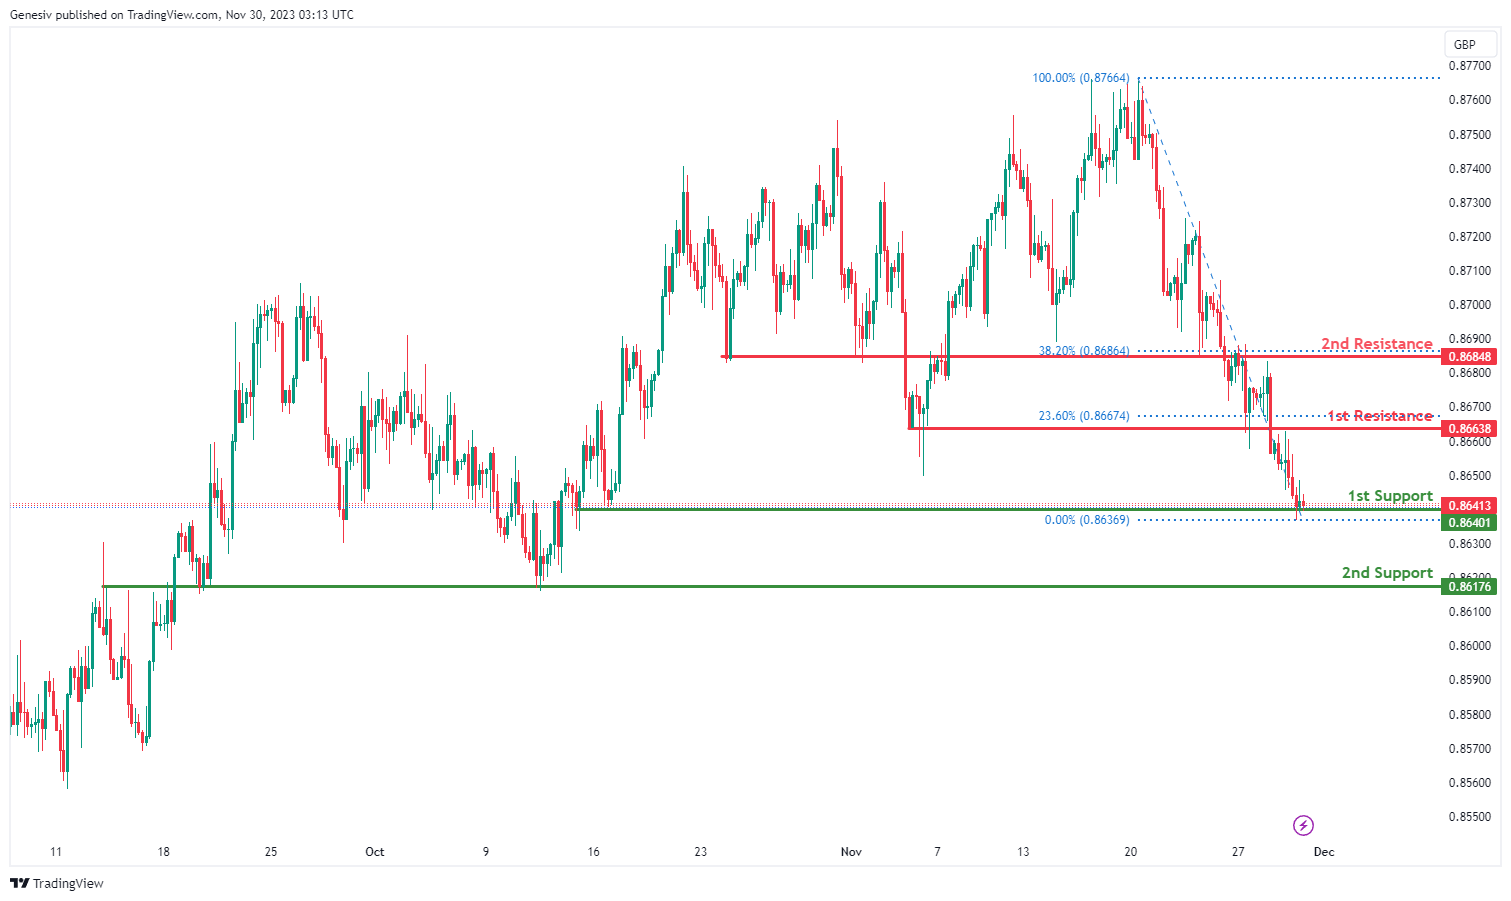
The analyzed instrument is EUR/GBP, and the overall momentum of the chart is currently bullish.
There is a potential for the price to make a bullish bounce off the 1st support and head towards the 1st resistance.
The 1st support level is identified at 0.8640, and its favorable characteristic is attributed to being a multi-swing low support.
The 2nd support level is situated at 0.8617, and its favorable aspect is derived from being an overlap support.
On the resistance side, the 1st resistance is positioned at 0.8663, and it is considered significant due to being a pullback resistance.
The 2nd resistance is located at 0.8684, and its significance is derived from being an overlap resistance.
GBP/USD:
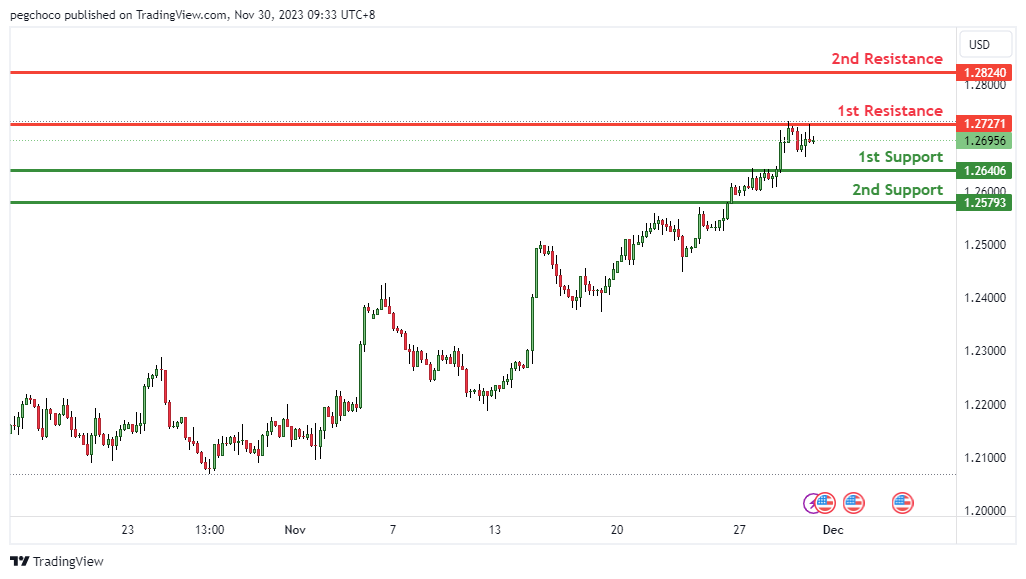
The GBP/USD, the overall momentum of the chart is neutral. In this scenario, there is a possibility that the Price could potentially fluctuate between the 1st resistance and 1st support level.
The 1st support at 1.264 is identified as a pullback support. This suggests that it’s a significant level where buying interest may emerge, providing support for the GBP/USD currency pair.
The 2nd support at 1.2579 is another overlap support level. This adds further significance to this support level, indicating it as a potential area where buyers might become active.
On the resistance side, the 1st resistance at 1.2727 is categorized as an overlap resistance. This suggests that it’s a significant barrier where selling interest could intensify, potentially limiting the upward movement for GBP/USD.
The 2nd resistance at 1.2824 is also noted as an overlap resistance, adding to the potential resistance factors for the currency pair.
GBP/JPY:
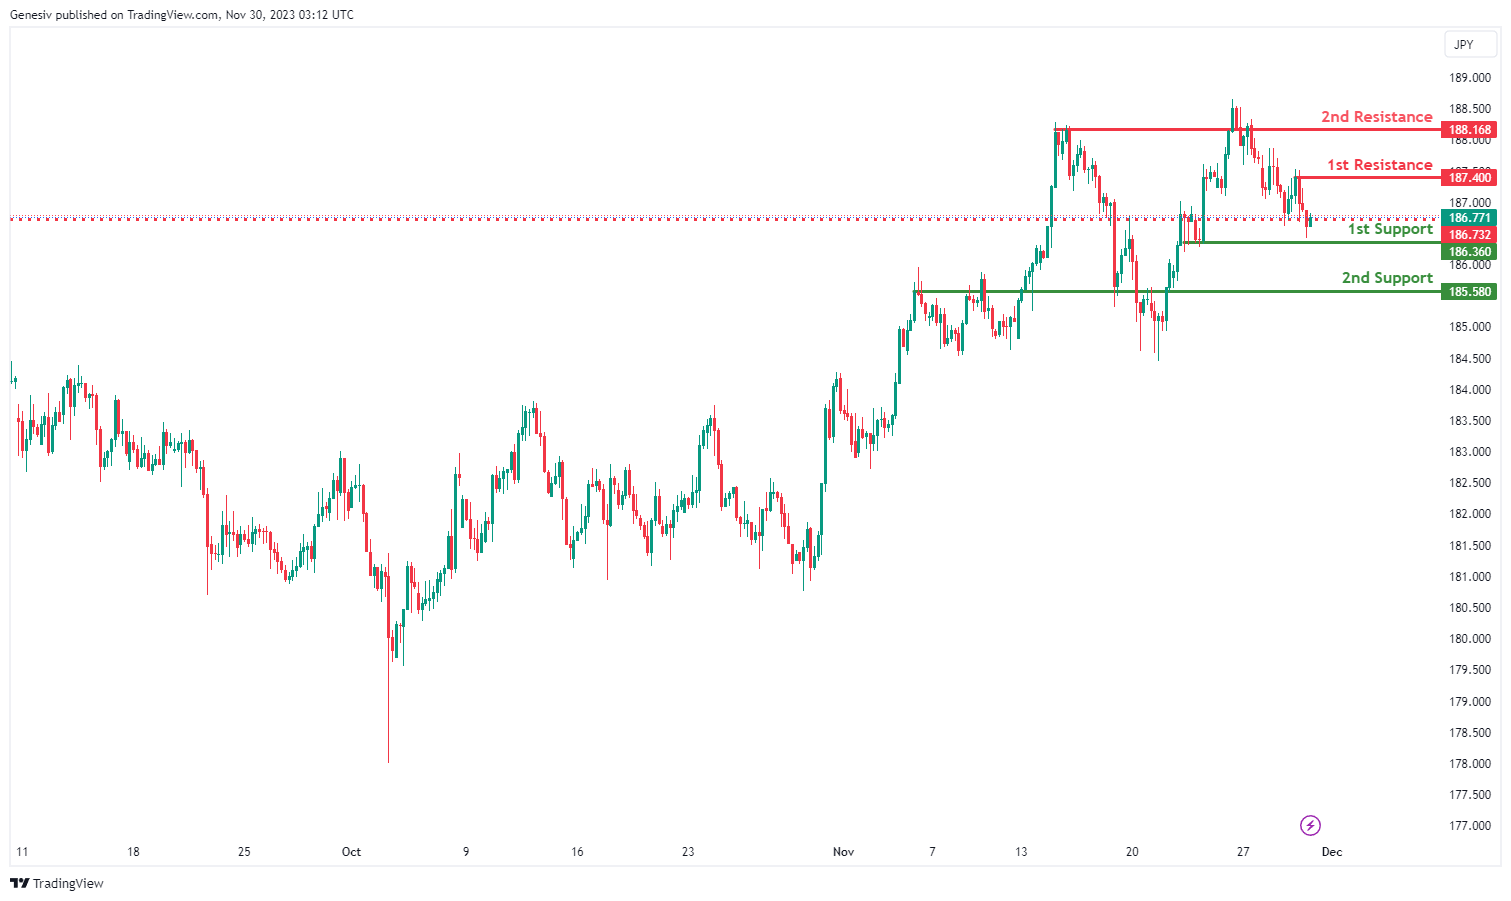
The overall momentum of GBP/JPY is bearish, indicating a potential continuation of the downward movement in price. There is a possibility that the price could experience a bearish continuation towards the 1st support.
1st support at 186.78: This level is identified as a pullback support, suggesting that it has previously acted as a significant price level where buyers have shown interest. It’s a level to watch for potential bullish reactions or a temporary halt in the bearish momentum.
2nd support at 185.58: The 2nd support level is marked as multi-swing low support, indicating its importance as a potential area of buying interest. Traders may anticipate potential support around this level.
1st resistance at 187.40: This level is characterized as pullback resistance, suggesting that it could be a point where selling p
2nd resistance at 188.17: The 2nd resistance is also noted as pullback resistance, indicating that it’s a level where sellers might be more active in defending their positions.ressure may increase, potentially leading to a continuation of the bearish trend.
USD/CHF:
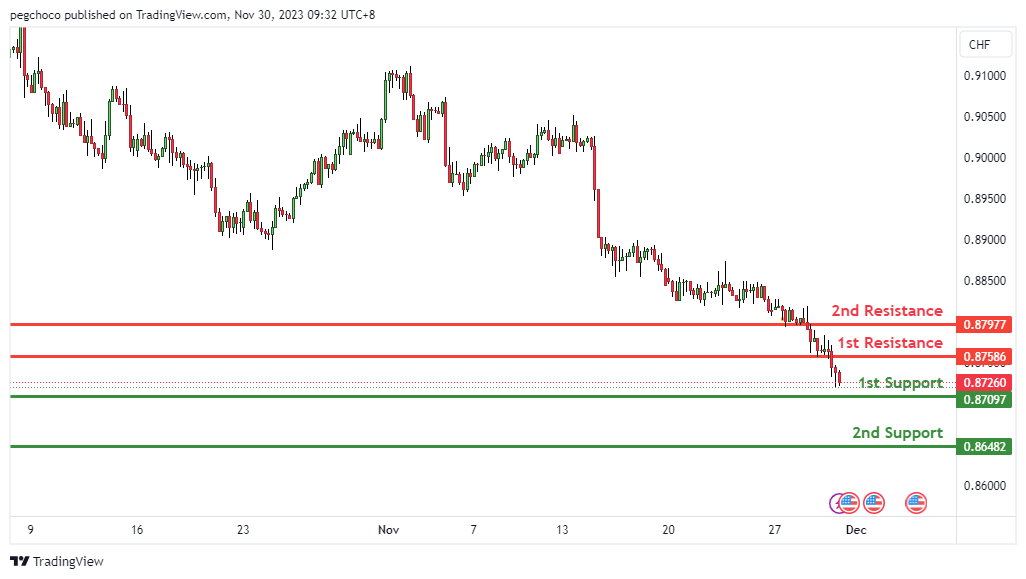
The USD/CHF, the overall momentum of the chart is bearish,suggesting a potential downward movement in price. In this scenario, there is a possibility that the price could potentially make a rise towards the 1st resistance in the short term before reversing off it and dropping towards the 1st support.
The 1st support at 0.8709 is identified as a multi-swing low support. This suggests that it’s a significant level where buying interest may emerge, providing support for the USD/CHF currency pair.
The 2nd support at 0.8709 is another support level identified as pullback support. This adds further significance to this support level, indicating it as a potential area where buyers might become active.
On the resistance side, the 1st resistance at 0.8758 is categorized as an overlap resistance. This suggests that it’s a significant barrier where selling interest could intensify, potentially acting as a barrier to further upward price movement for USD/CHF.
The 2nd resistance at 0.8797 is noted as a pullback resistance, indicating that it’s a level where selling pressure may increase, acting as another potential obstacle to the currency pair’s upward price movement.
USD/JPY:
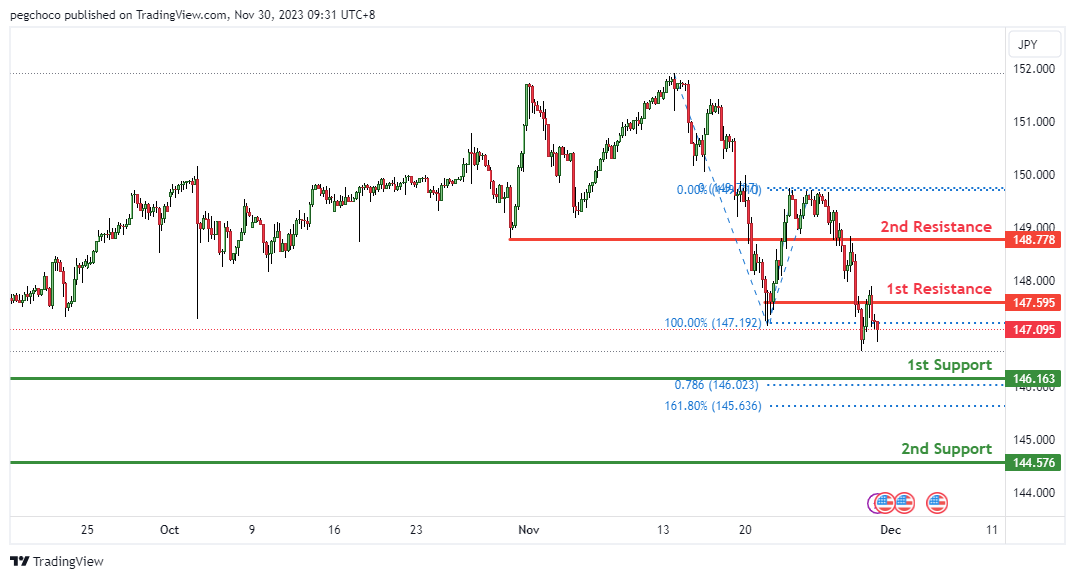
The USD/JPY, the overall momentum of the chart is bearish, indicating a downward trend, suggesting a potential downward movement in price. In this scenario, there is a possibility that the price could potentially make a bearish continuation towards the 1st support.
The 1st support at 146.16 is identified as a swing low support, and it also coincides with the 78.60% Fibonacci Projection. This suggests that it’s a significant level where buying interest may emerge, potentially providing support for the USD/JPY currency pair.
The 2nd support at 144.57 is another swing low support level. This adds further significance to this support level, indicating it as a potential area where buyers might become active.
On the resistance side, the 1st resistance at 147.59 is categorized as an overlap resistance. This suggests that it’s a significant barrier where selling interest could intensify, potentially limiting the upward movement for USD/JPY.
The 2nd resistance at 148.77 is also noted as an overlap resistance, adding to the potential resistance factors for the currency pair.
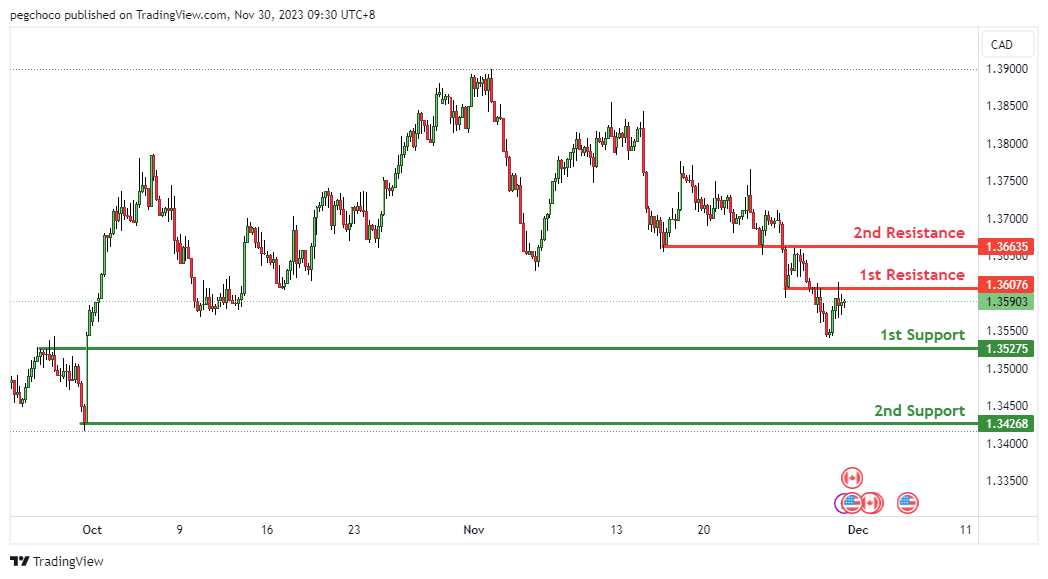
USD/CAD:
The USD/CAD, the overall momentum of the chart is currently bearish, suggesting a potential downward movement in price. In this scenario, there is a possibility that the price could potentially make a bearish continuation towards the 1st support.
The 1st support at 1.3527 is identified as a pullback support. This suggests that it’s a significant level where buying interest may emerge, providing support for the USD/CAD currency pair.
The 2nd support at 1.3426 is another support level identified as a swing low support. This adds further significance to this support level, indicating it as a potential area where buyers might become active.
On the resistance side, the 1st resistance at 1.3607 is categorized as an overlap resistance. This implies that it’s a significant barrier where selling interest could intensify, potentially limiting the upward movement for USD/CAD.
The 2nd resistance at 1.3663 is also noted as an overlap resistance, adding to the potential resistance factors for the currency pair.
AUD/USD:
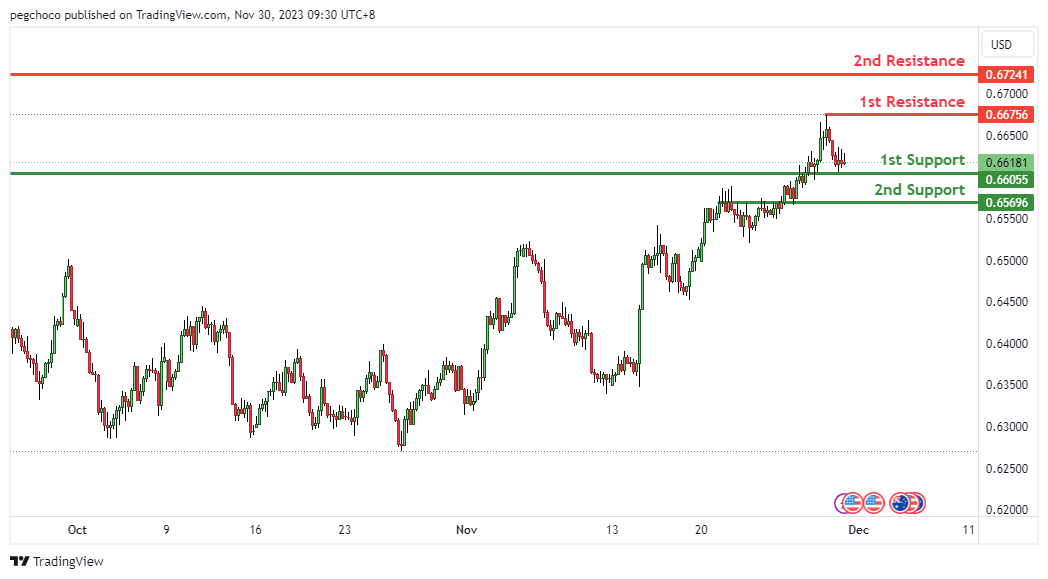
AUD/USD, the overall momentum of the chart is currently bullish, suggesting a potential upward movement in price. In this scenario, there is a possibility that the price could potentially make a bullish continuation towards the 1st resistance.
The 1st support at 0.6605 is identified as an overlap support. This suggests that it’s a significant level where buying interest may emerge, providing support for the AUD/USD currency pair.
The 2nd support at 0.6690 is another overlap support level. This adds further significance to this support level, indicating it as a potential area where buyers might become active.
On the resistance side, the 1st resistance at 0.6675 is categorized as a swing high resistance. This implies that it’s a significant barrier where selling interest could intensify, potentially limiting the upward movement for AUD/USD.
The 2nd resistance at 0.6724 is also noted as an overlap resistance, adding to the potential resistance factors for the currency pair.
NZD/USD
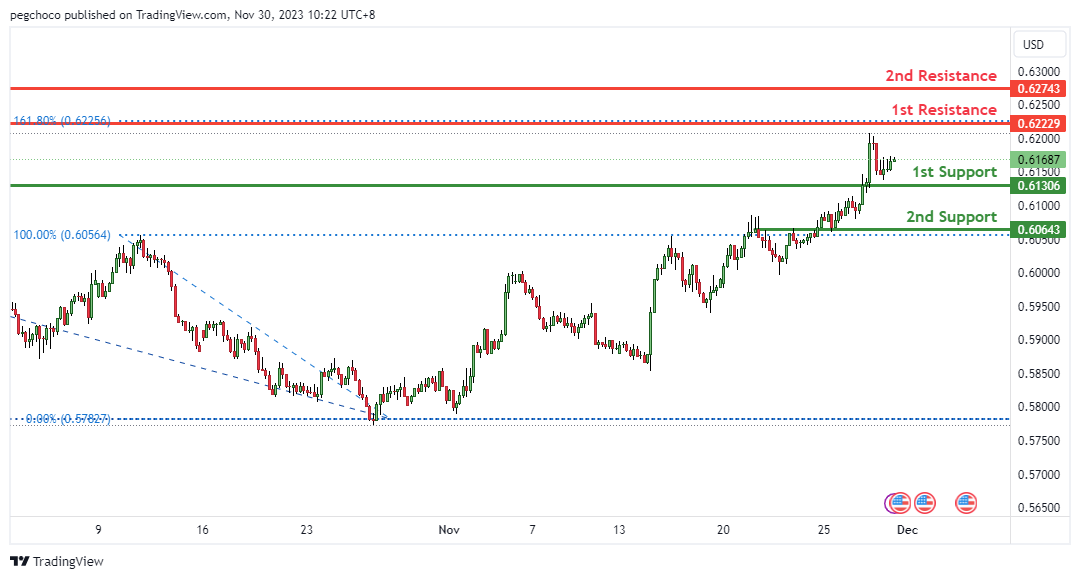
The NZD/USD, the overall momentum of the chart is currently bullish, indicating a potential upward movement in the price. In this scenario, there is a possibility that the price could potentially make a bullish continuation towards the 1st resistance.
The 1st support at 0.6130 is identified as an overlap support. This suggests that it’s a significant level where buying interest may emerge, providing support for the NZD/USD currency pair.
The 2nd support at 0.6064 is another overlap support level. This adds further significance to this support level, indicating it as a potential area where buyers might become active.
On the resistance side, the 1st resistance at 0.6274 is categorized as a swing high resistance. This implies that it’s a significant barrier where selling interest could intensify, potentially limiting the upward movement for NZD/USD.
Additionally, there is a 2nd resistance at 0.6232, identified as an overlap resistance, further reinforcing the potential resistance factors for the currency pair.
DJ30:
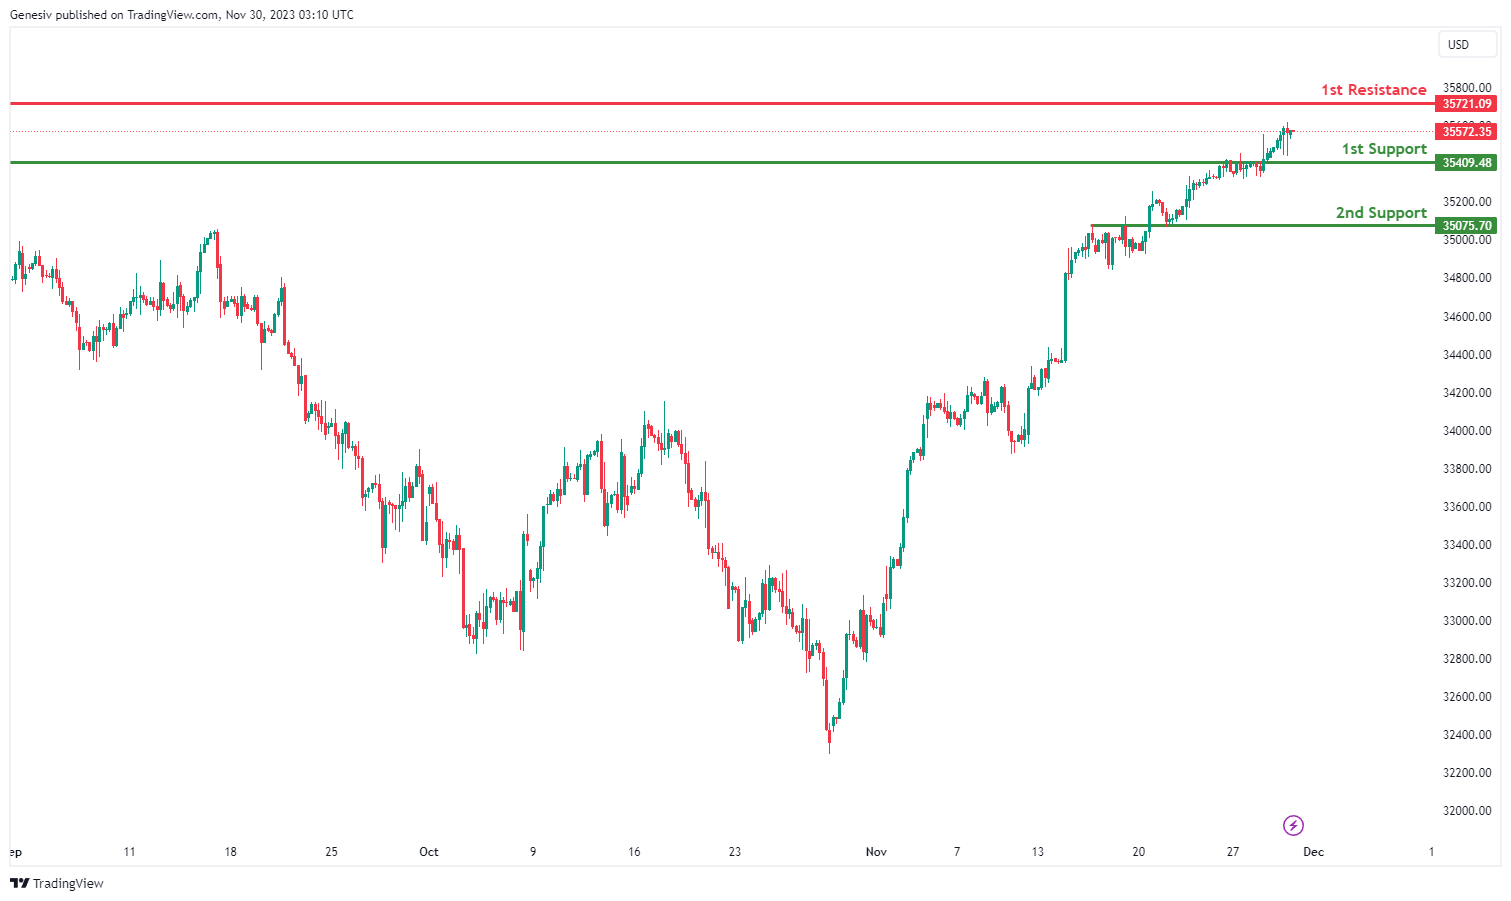
The DJ30,the momentum of the chart is bullish, suggesting a potential continuation of the upward movement in price. There is a possibility that the price could experience a bullish bounce off the 1st support level and head towards the 1st resistance.
1st support at 35409.48: This level is identified as a multi-swing low support, indicating that it has previously acted as a significant price level where buyers have stepped in. It is a level to watch for potential bullish reactions or a temporary pause in the upward momentum.
2nd support at 35075.70: The 2nd support level is marked as an overlap support, suggesting that it aligns with historical price data and is likely to be a strong support level. Traders may anticipate strong buying interest around this level.
1st resistance at 35721.09: This level is considered a pullback resistance, indicating that it could be a point where selling pressure may increase, potentially leading to a temporary halt or correction in the bullish trend.
GER40:
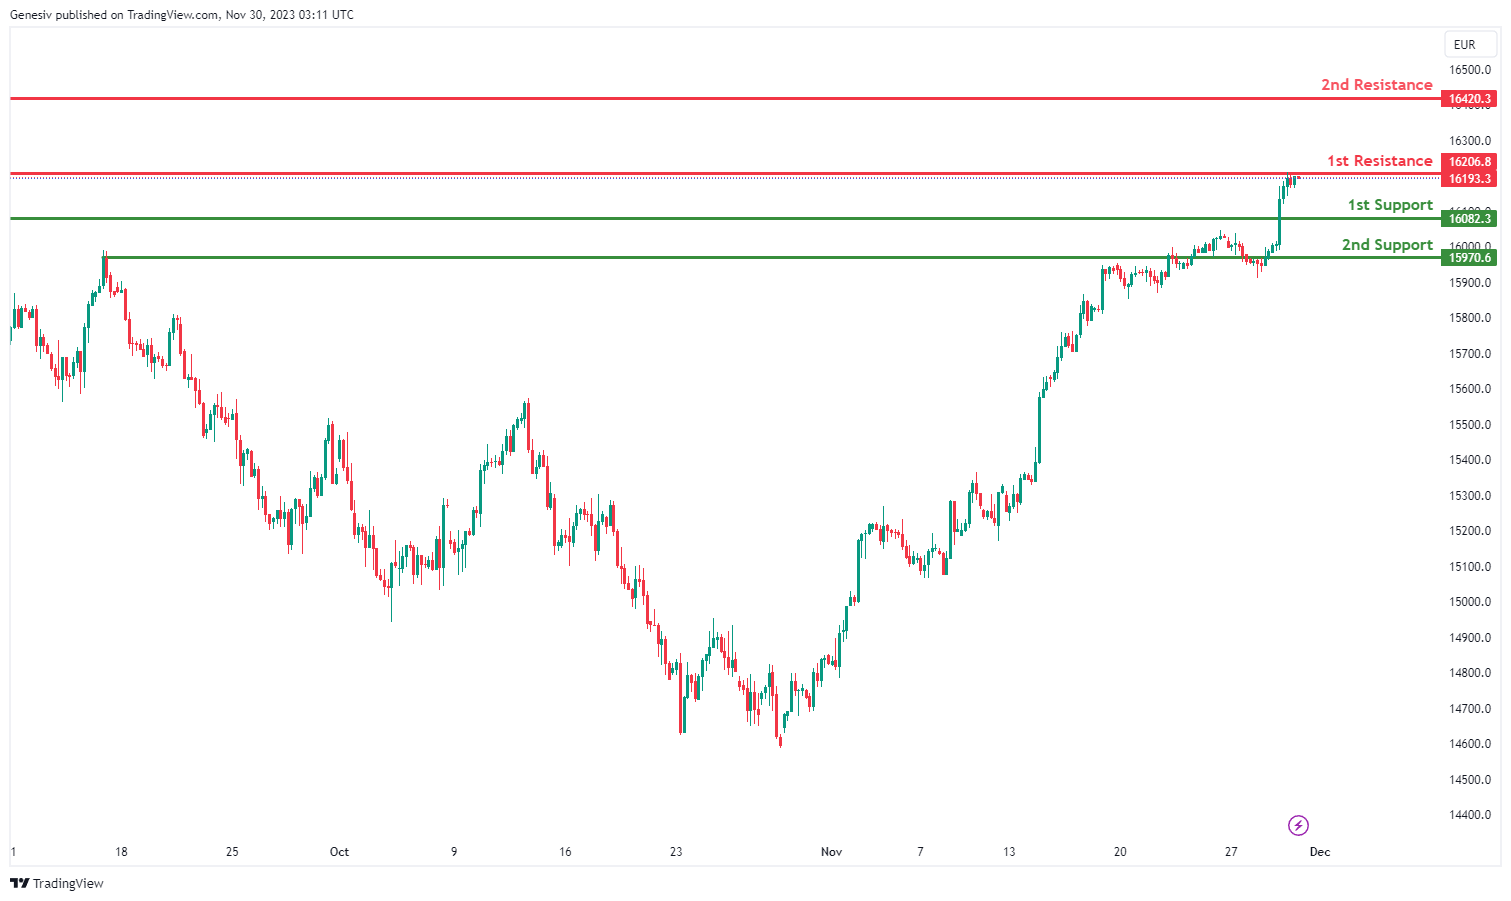
The GER40 overall momentum is bearish, suggesting a potential continuation of the downward movement in price. There is a possibility that the price could experience a bearish continuation towards the 1st support.
1st support at 16082.3: This level is identified as a swing low support, indicating that it has previously acted as a significant price level where buyers have shown interest. Traders may anticipate potential buying interest or a temporary pause in the downward momentum around this level.
2nd support at 15970.6: The 2nd support level is marked as a multi-swing low support, suggesting that it aligns with historical price data and is likely to be a strong support level. It may serve as a critical level for traders to watch for potential rebounds or consolidation.
1st resistance at 16206.8: This level is considered a pullback resistance, indicating that it could be a point where selling pressure may increase, potentially leading to a temporary halt or correction in the bearish trend.
2nd resistance at 16420.3: The 2nd resistance level is marked as a swing high resistance, suggesting it has previously acted as a barrier to upward price movements. It could serve as a strong resistance level if the price attempts to move higher.
US500:
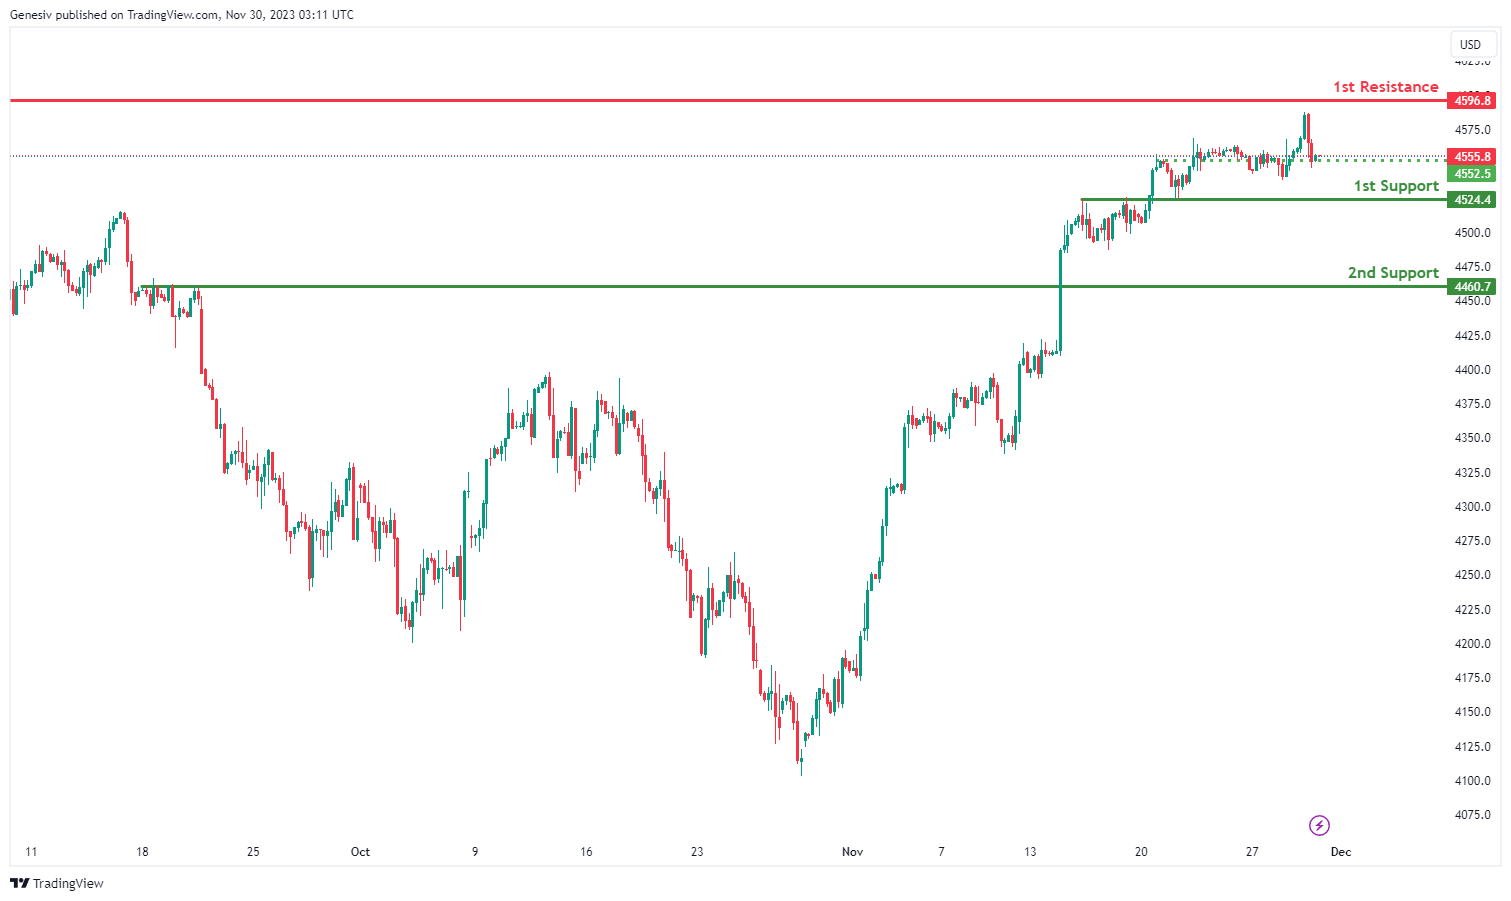
The overall momentum of US500 is weakly bearish with low confidence. There is a potential for a bearish continuation, but the confidence in this bearish move is low.
1st support at 4524.4: This level is identified as an overlap support, indicating that it has previously acted as a significant price level where buyers have shown interest. It may serve as a potential area of support where traders might look for buying opportunities or expect a temporary halt in the downward movement.
2nd support at 4460.7: The 2nd support level is marked as a multi-swing low support, suggesting that it aligns with historical price data and is likely to be a strong support level. It may be considered a critical level for traders to watch for potential rebounds or consolidation.
1st resistance at 4596.8: This level is considered a pullback resistance, indicating that it could be a point where selling pressure may increase, potentially leading to a temporary correction within the bearish trend.
Intermediate support at 4553.3: This level is marked as pullback support, indicating that it may provide support during a potential pullback or correction. Traders might monitor this level for potential buying opportunities.
BTC/USD:
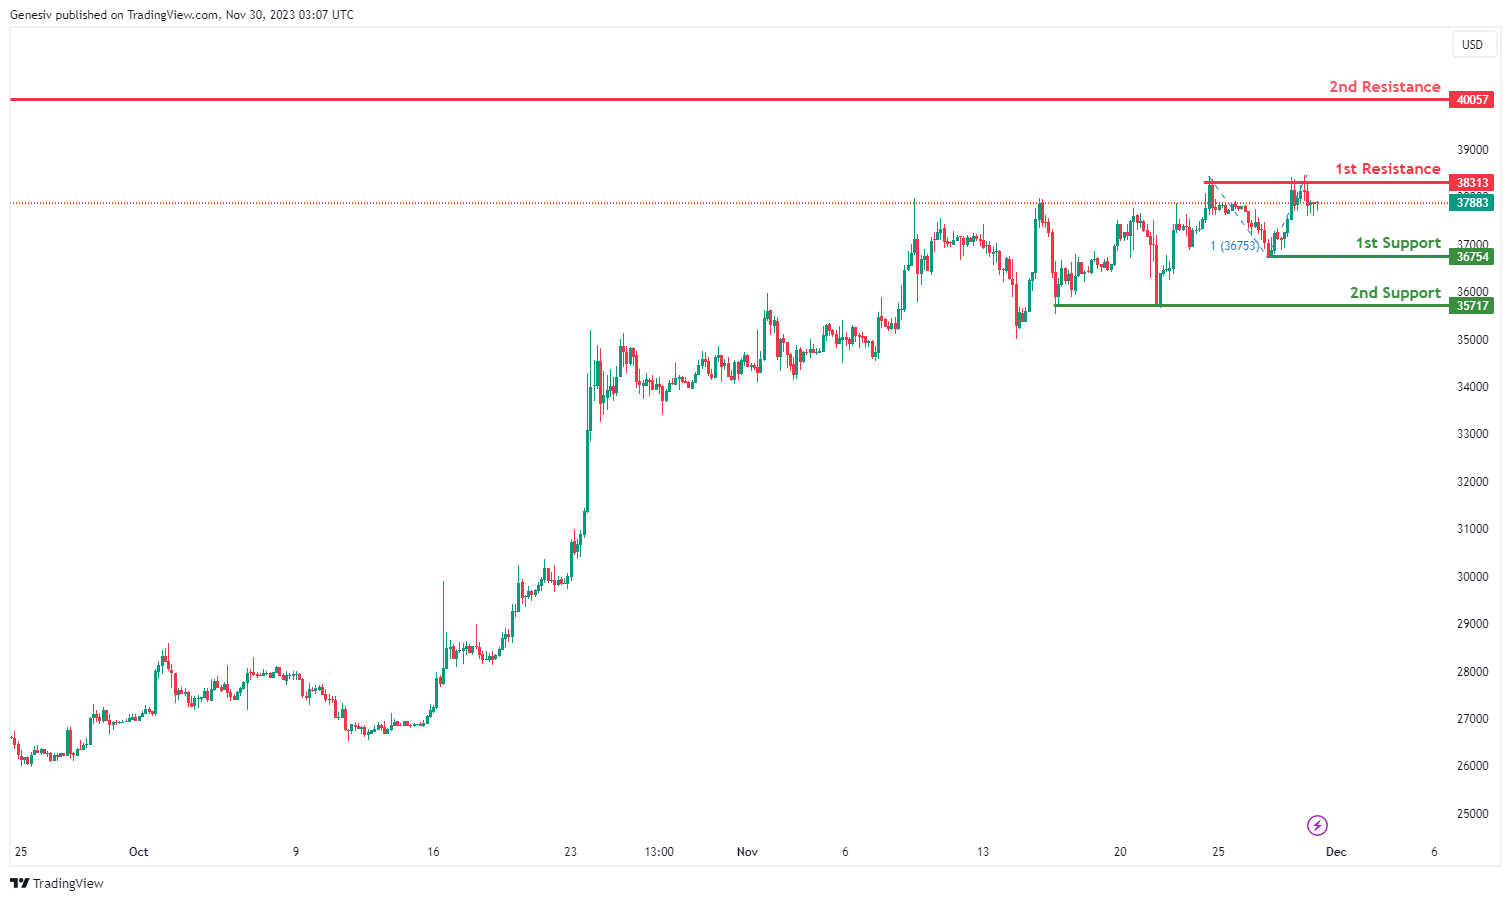
The analyzed instrument is BTC/USD, and the overall momentum of the chart is currently bearish.
There is a potential for the price to make a bearish continuation towards the 1st support.
The 1st support level is identified at 36754, and its favorable characteristic is attributed to being a swing low support, coinciding with the 100% Fibonacci Projection.
The 2nd support level is situated at 35717, and its favorable aspect is derived from being a multi-swing low support.
On the resistance side, the 1st resistance is positioned at 38313, and it is considered significant due to being a multi-swing high resistance.
The 2nd resistance is located at 40057, and its significance is derived from being a swing high resistance.
ETH/USD:
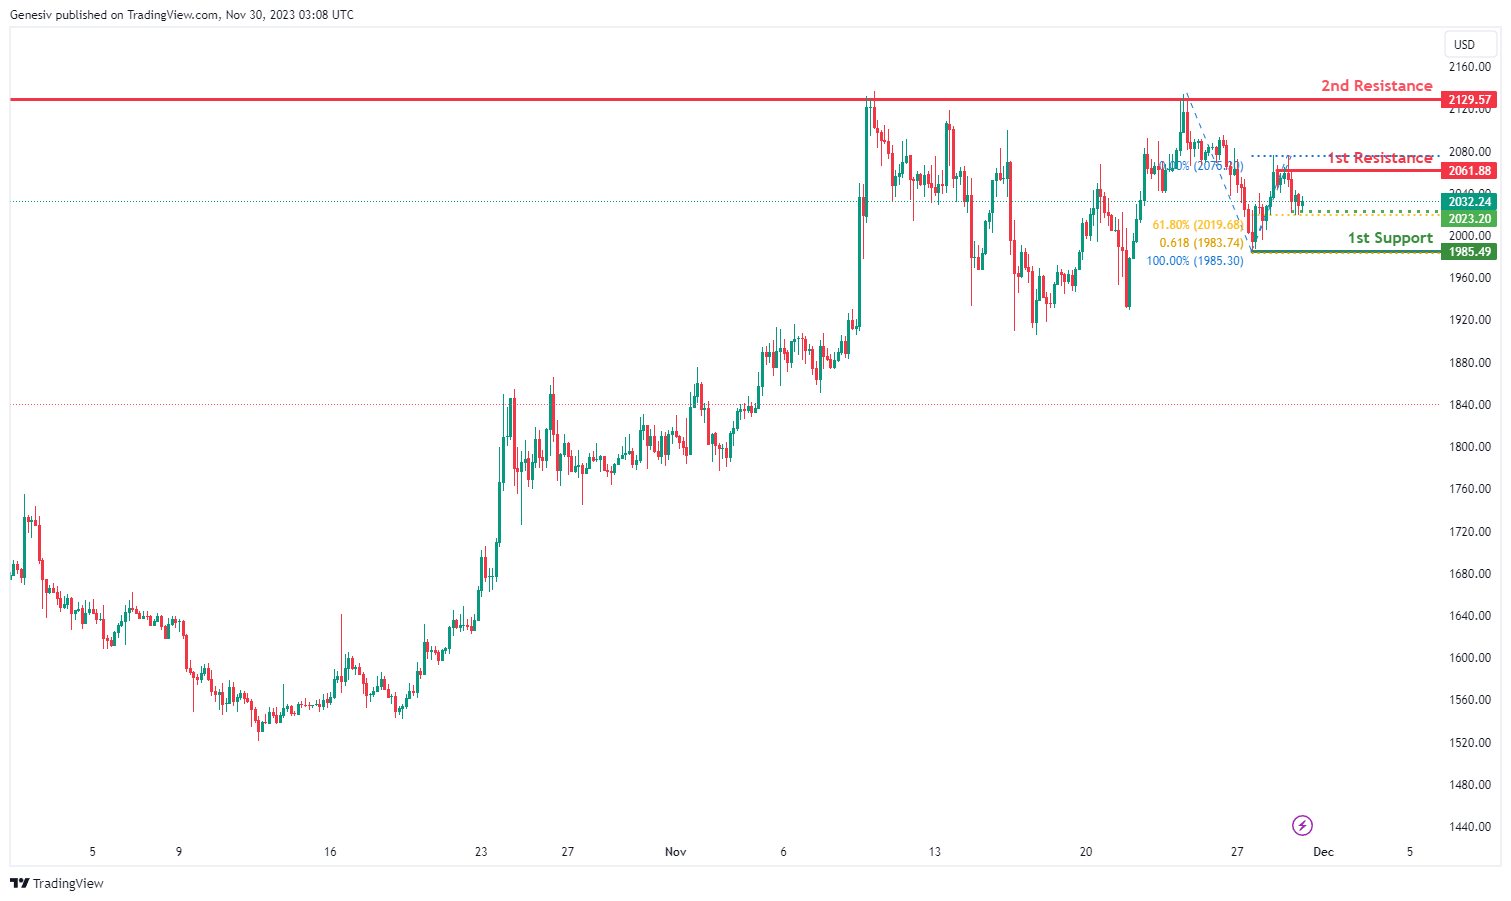
The analyzed instrument is ETH/USD, and the overall momentum of the chart is currently bearish.
There is a potential for the price to make a bearish continuation towards the 1st support.
The 1st support level is identified at 1985.49, and its favorable characteristic is attributed to being a swing low support, coinciding with the 61.80% Fibonacci Projection.
An intermediate support is also noted at 2023.20, and its significance is derived from being a swing low support, aligning with the 61.80% Fibonacci Retracement.
On the resistance side, the 1st resistance is positioned at 2061.88, and it is considered significant due to being a swing high resistance.
The 2nd resistance is located at 2129.57, and its significance is derived from being a multi-swing high resistance.
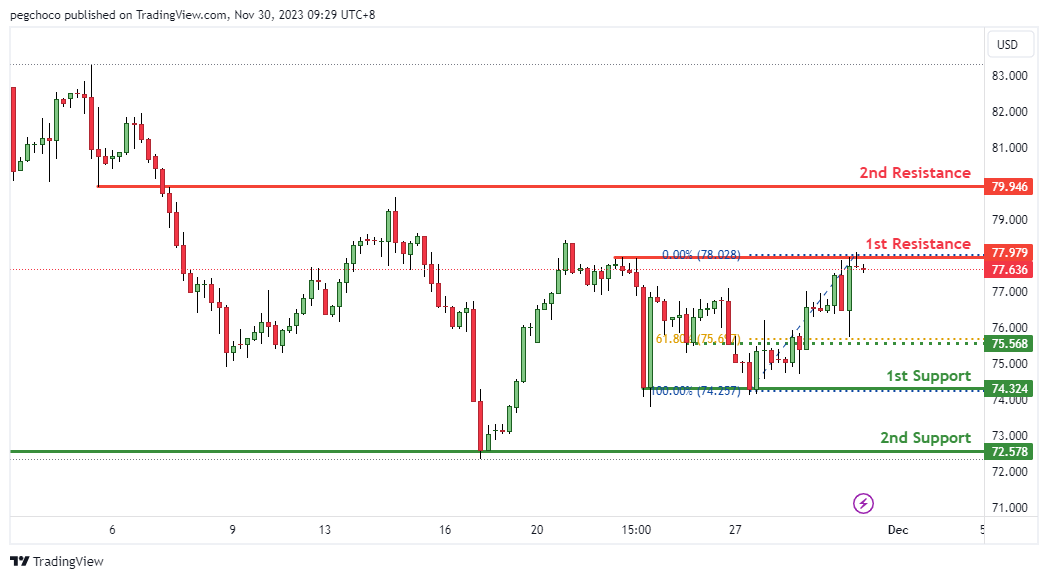
WTI/USD:
The WTI (West Texas Intermediate) crude oil, the overall momentum of the chart is bearish, In this scenario, there is a possibility that the price could potentially make a bearish continuation towards the 1st support.
The 1st support at 74.32 is identified as a multi-swing low support. This suggests that it’s a significant level where buying interest may emerge, potentially providing support for the WTI crude oil market.
The 2nd support at 72.57 is another support level identified as an overlap support. This adds further significance to this support level, indicating it as a potential area where buyers might become active.
On the resistance side, the 1st resistance at 77.97 is categorized as a multi-swing high resistance. This implies that it’s a level where selling pressure may increase, acting as a potential barrier to further upward price movement for WTI crude oil.
The 2nd resistance at 79.94 is noted as a pullback resistance, indicating that it’s a level where selling interest could intensify, potentially limiting the upward movement for the commodity.
Additionally, there is an intermediate support at 75.56, identified as an overlap support and coinciding with the 61.80% Fibonacci Retracement. This reinforces the potential support factors for the commodity.
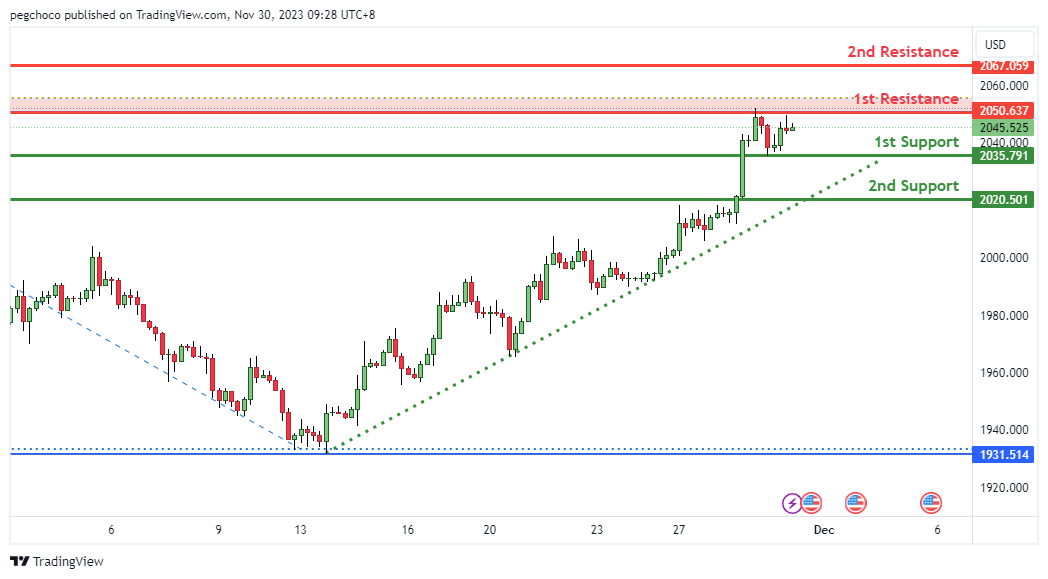
XAU/USD (GOLD):
The XAU/USD, the overall momentum of the chart is neutrall, In this scenario, there is a possibility that the price could potentially fluctuate between the 1st resistance and 1st support level.
The 1st support at 2035.79 is identified as an overlap support. This suggests that it’s a significant level where buying interest may emerge, providing support for the Gold market.
The 2nd support at 2020.50 is another support level identified as pullback support. This adds further significance to this support level, indicating it as a potential area where buyers might become active.
On the resistance side, the 1st resistance at 2050.63 is categorized as a swing high resistance, and it also coincides with the 61.80% Fibonacci Projection. This dual significance suggests that it’s a significant barrier where selling interest could intensify, potentially limiting the upward movement for Gold.
The 2nd resistance at 2067.05 is noted as a multi-swing high resistance, indicating another potential obstacle for the precious metal’s upward price movement.