Sample Category Title
US initial jobless claims rose to 218k, continuing claims hits near 2-yr high
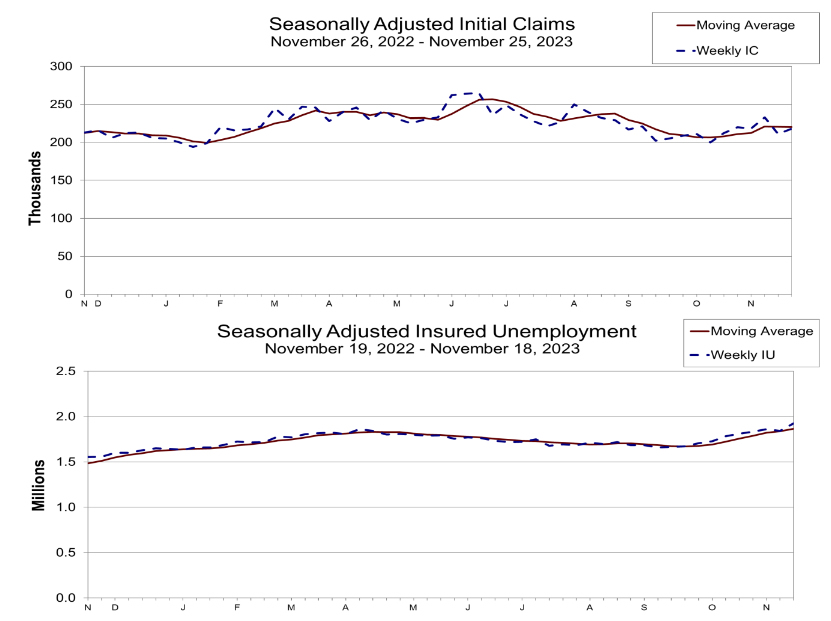
US initial jobless claims rose 7k to 218k in the week ending November 25, above expectation of 215k. Four-week moving average of initial claims fell -500 to 220k.
Continuing claims rose 86k to 1927k in the week ending November 18, highest since November 27, 2021. Four-week moving average of continuing claims rose 29k to 1866k, highest since December 11, 2021.
US PCE price index slows to 3%, core PCE down to 3.5%, match expectations
US personal income rose 0.2% mom or USD 57.1B in October, matched expectations. Persona spending rose 0.2% mom or USD 41.2B, matched expectations.
Headline PCE price index rose less than 0.1% mom. Excluding food and energy, core PCE price index rose 0.2% mom. Prices for goods fell -0.3% mom while prices for services rose 0.2% mom. Food prices rose 0.2% mom and energy prices fell -2.6% mom.
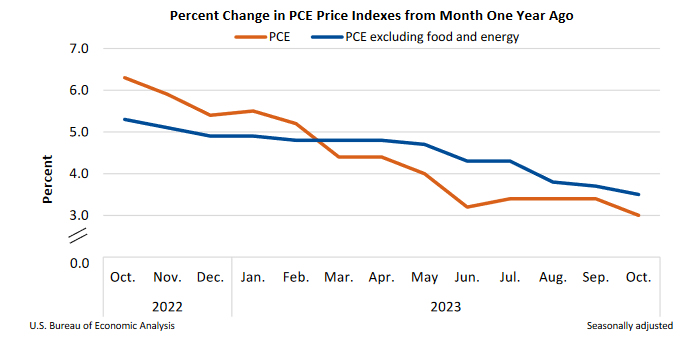
From the same month one year ago, headline PCE price index slowed from 3.4% yoy to 3.0% yoy, matched expectations. Core PCE price index slowed from 3.7% yoy to 3.5% yoy, matched expectations. Goods prices was up 0.2% yoy while services prices rose 4.4% yoy. Food prices rose 2.4% yoy and energy prices fell -4.8% yoy.
Canadian Dollar Steady ahead of GDP
- Canada’s GDP expected to remain at 0.0%
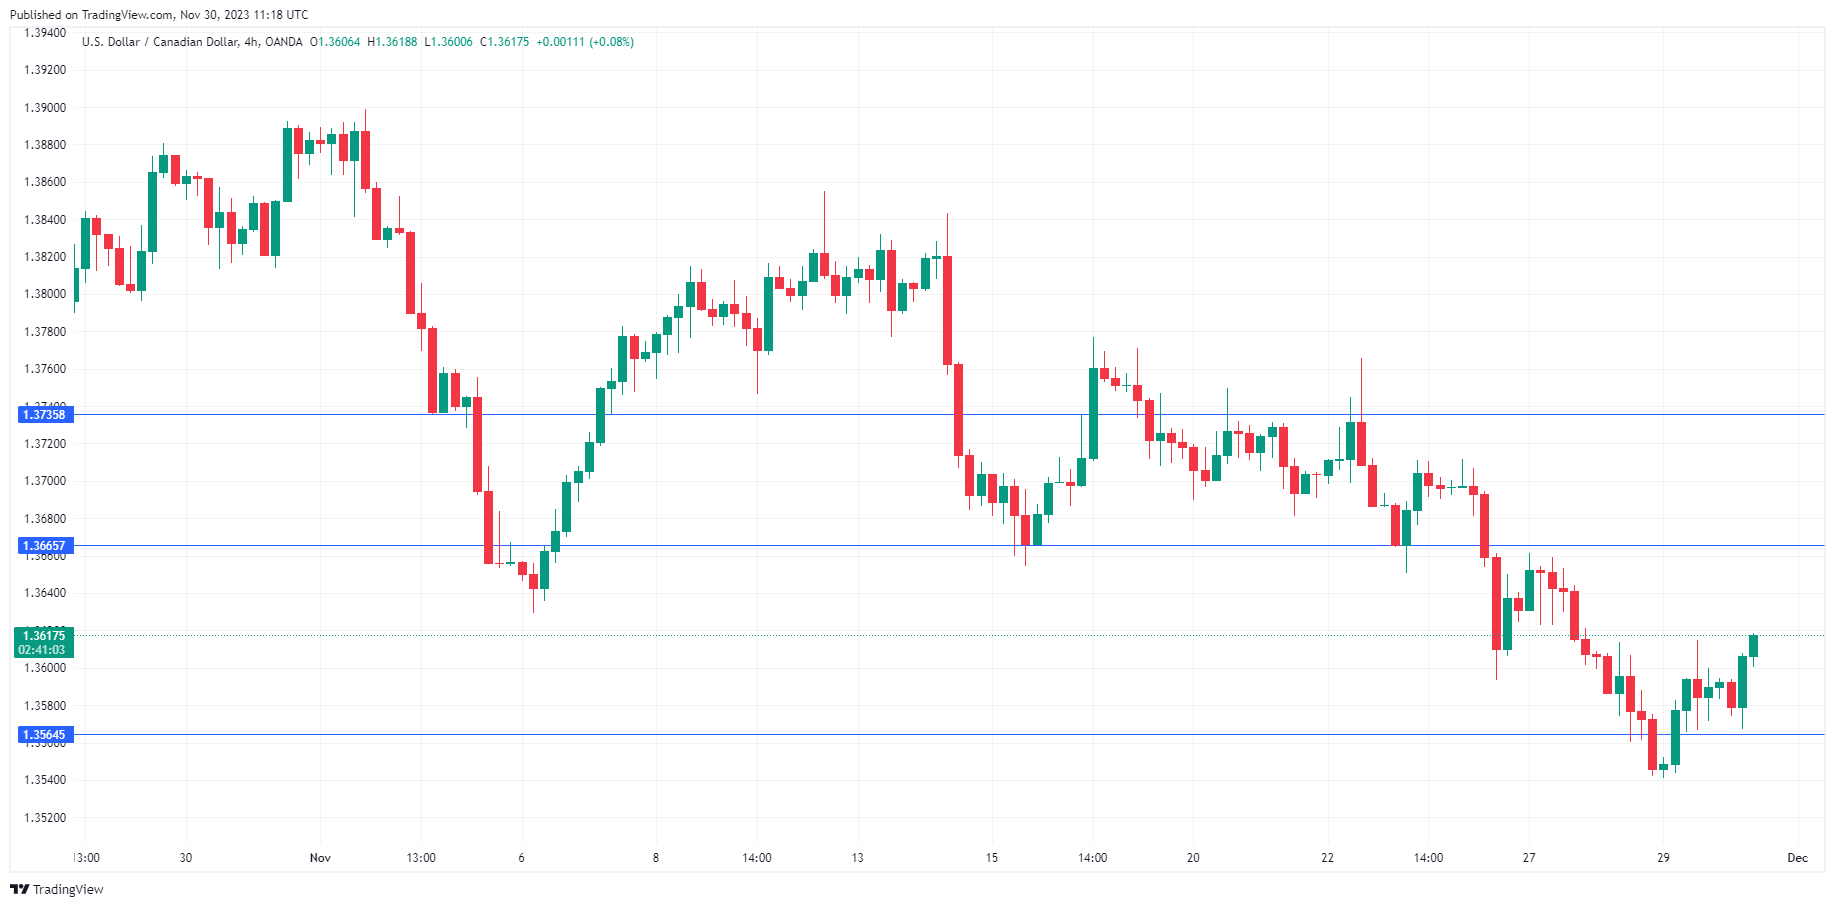
The Canadian dollar is steady on Thursday. In the North American session, USD/CAD is trading at 1.3602, up 0.11%.
Canada’s GDP expected to flatline
Canada’s economy has been stalling and today’s GDP release is expected to confirm that trend. August GDP came in at 0.0% and no change is expected for the September GDP release. The stagnation in growth fits the Bank of Canada’s view that elevated borrowing costs have dampened demand and growth. The economy recorded a modest contraction in the second quarter and the third quarter is expected to be flat. This backdrop makes a rate hike unlikely, as inflation has been dropping and eased to 3.1% in October, down from 3.8% a month earlier.
The lack of growth has not escaped the watchful eyes of rating agencies. Earlier this week, S&P cut Canada’s GDP growth for this year from 1.2% to 1.1% and from 1.2% to 0.8% in 2024. S&P said Canada would experience a “sluggish growth path for the next several quarters” due to higher interest rates and weak global demand. As a result, S&P says the Bank of Canada has wound up its tightening cycle and will start to cut rates in the second quarter of 2024, and expects the BoC to cut rates by 100 basis points in 2024.
In the US, second-estimate GDP for the third quarter was revised to 5.2%, up from the initial estimate of 4.9%. The sharp gain should ease fears of a recession in the US but also means that the Fed has little reason to trim rates while inflation remains well above the 2% target. The Fed has signalled a ‘higher for longer’ stance on rates but the markets are more dovish and have priced in a rate hike in March 2024 at 45%, according to the CME’s FedWatch tool.
USD/CAD Technical
- There is resistance at 1.3665 and 1.3735
- 1.3564 and 1.3494 are providing support
Crypto Market: Another Pullback Within the Framework of Growth
Market picture
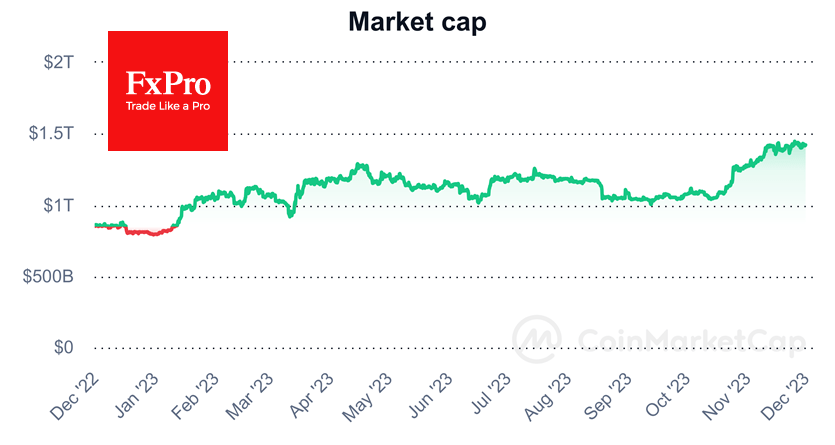
The crypto market cap fell 0.5% in 24 hours to $1.42 trillion, showing another pullback as part of a broader uptrend that started in mid-October but has slowed in the last couple of weeks.
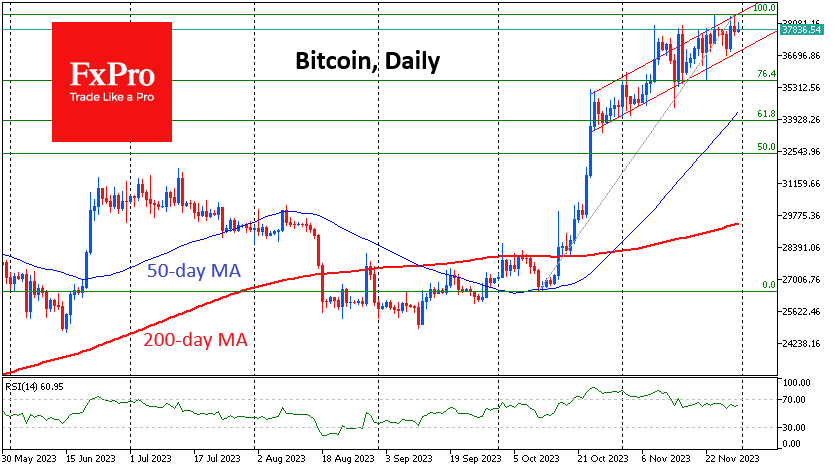
Bitcoin underwent a sell-off on Wednesday afternoon from the upper end of an upward range above $38.4K. Countless times, the market has proven that it’s not ready to accelerate, but it hasn’t found any reason to go deep down either. Only a failure below $36.7K will confirm that $38K is a solid horizontal resistance. Without this confirmation, the working scenario remains in the upward range.
News background
According to CryptoQuant, crypto whales are sending bitcoins to exchange wallets, which can be seen as a bearish signal.
Standard Chartered Bank confirmed its prediction that Bitcoin could reach $100K by the end of next year. Apart from halving, the catalyst for the rally will be the approval of several spot ETFs in the first quarter of 2024. This will pave the way for institutional investment in Bitcoin and Ethereum.
The US SEC has requested public comment on spot Bitcoin ETFs. Lawyer Scott Jonsson saw this as a signal of the regulator’s willingness to approve all applications for the instrument in a one-time manner by 10 January 2024.
Glassnode recorded Ethereum’s first post-Shanghai decline in staking, which is slowing issuance. Along with the increased rate of coin burn in light of increased network activity, inflation has been replaced by deflation.
Binance, the world’s largest crypto exchange, announced that it will delist its own BUSD stablecoin as part of a deal with US authorities and will stop supporting it starting on the 15th of December.
US presidential candidate Vivek Ramaswamy said that his ” policy will guarantee a bright future for cryptocurrencies”, which will give freedom to Americans.
GBP/USD: Bulls Loosen Grip Ahead of Key US Data
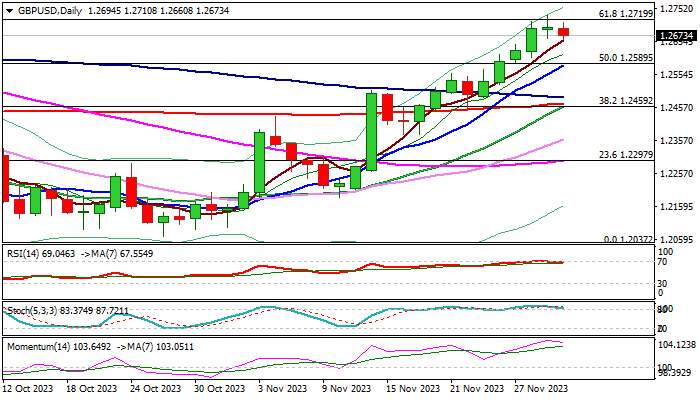
Cable eases from new three-month high in European trading on Thursday, as daily Doji candle on Wednesday signaled indecision and overbought daily studies prompted a partial profit-taking.
Failure to register a daily close above 1.2719 Fibo barrier (61.8% of 1.3141/1.2037) and subsequent weakness add to initial signals of bull trap and increases risk of pullback.
Initial support lays at 1.2655 (5DMA), followed by rising 10DMA (1.2581) which should ideally contain dips to keep larger bulls intact, with deeper correction to expose pivotal supports at 1.2466/58 (converging 200 and 20DMA’s / broken Fibo 38.2%).
Markets await release of key economic indicator today – US PCE price index – Fed’s preferred inflation gauge, which is expected to provide fresh direction signals.
Core PCE is forecasted to rise 3.5% y/y and 0.2% m/m in October, down from September’s 3.7% y/y and 0.3% m/m, with dollar expected to remain under pressure on results in line with expectations but may accelerate lower if inflation in October falls more than expected.
In such scenario, Cable may rally through1.2700/19 pivots for test of 1.2800/18 (Aug 10/22 tops) and 1.2881 (Fibo 76.4% of 1.3141/1.2037) in extension.
Res: 1.2719; 1.2733; 1.2800; 1.2818.
Sup: 1.2655; 1.2581; 1.2500; 1.2485.
Eurozone CPI falls more than expected to 2.4% in Nov, core CPI down to 3.6%
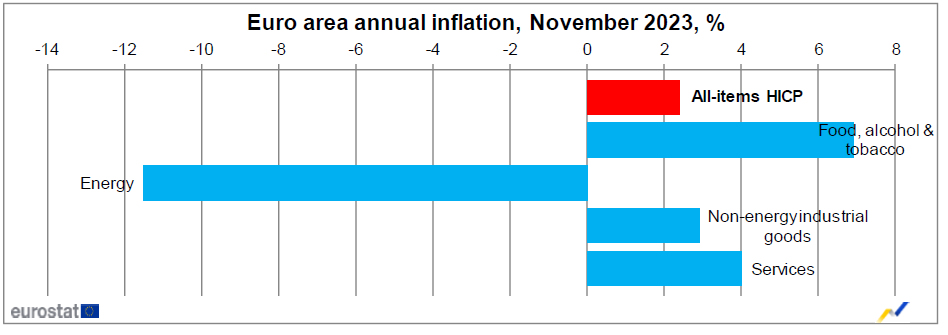
Eurozone CPI slowed notably from 2.9% yoy to 2.4% yoy in November, below expectation of 2.7% yoy. CPI core ( excluding energy, food, alcohol & tobacco) slowed from 4.2% yoy to 3.6% yoy, below expectation of 3.9% yoy.
Looking at the main components, food, alcohol & tobacco is expected to have the highest annual rate in November (6.9%, compared with 7.4% in October), followed by services (4.0%, compared with 4.6% in October), non-energy industrial goods (2.9%, compared with 3.5% in October) and energy (-11.5%, compared with -11.2% in October).
WTI Oil Futures in a Fierce Battle With 200-day SMA
- WTI futures fall to a 4-month low before attempting a recovery
- But their rebound is being held down by the 200-day SMA
- Momentum indicators suggest that positive momentum is picking up
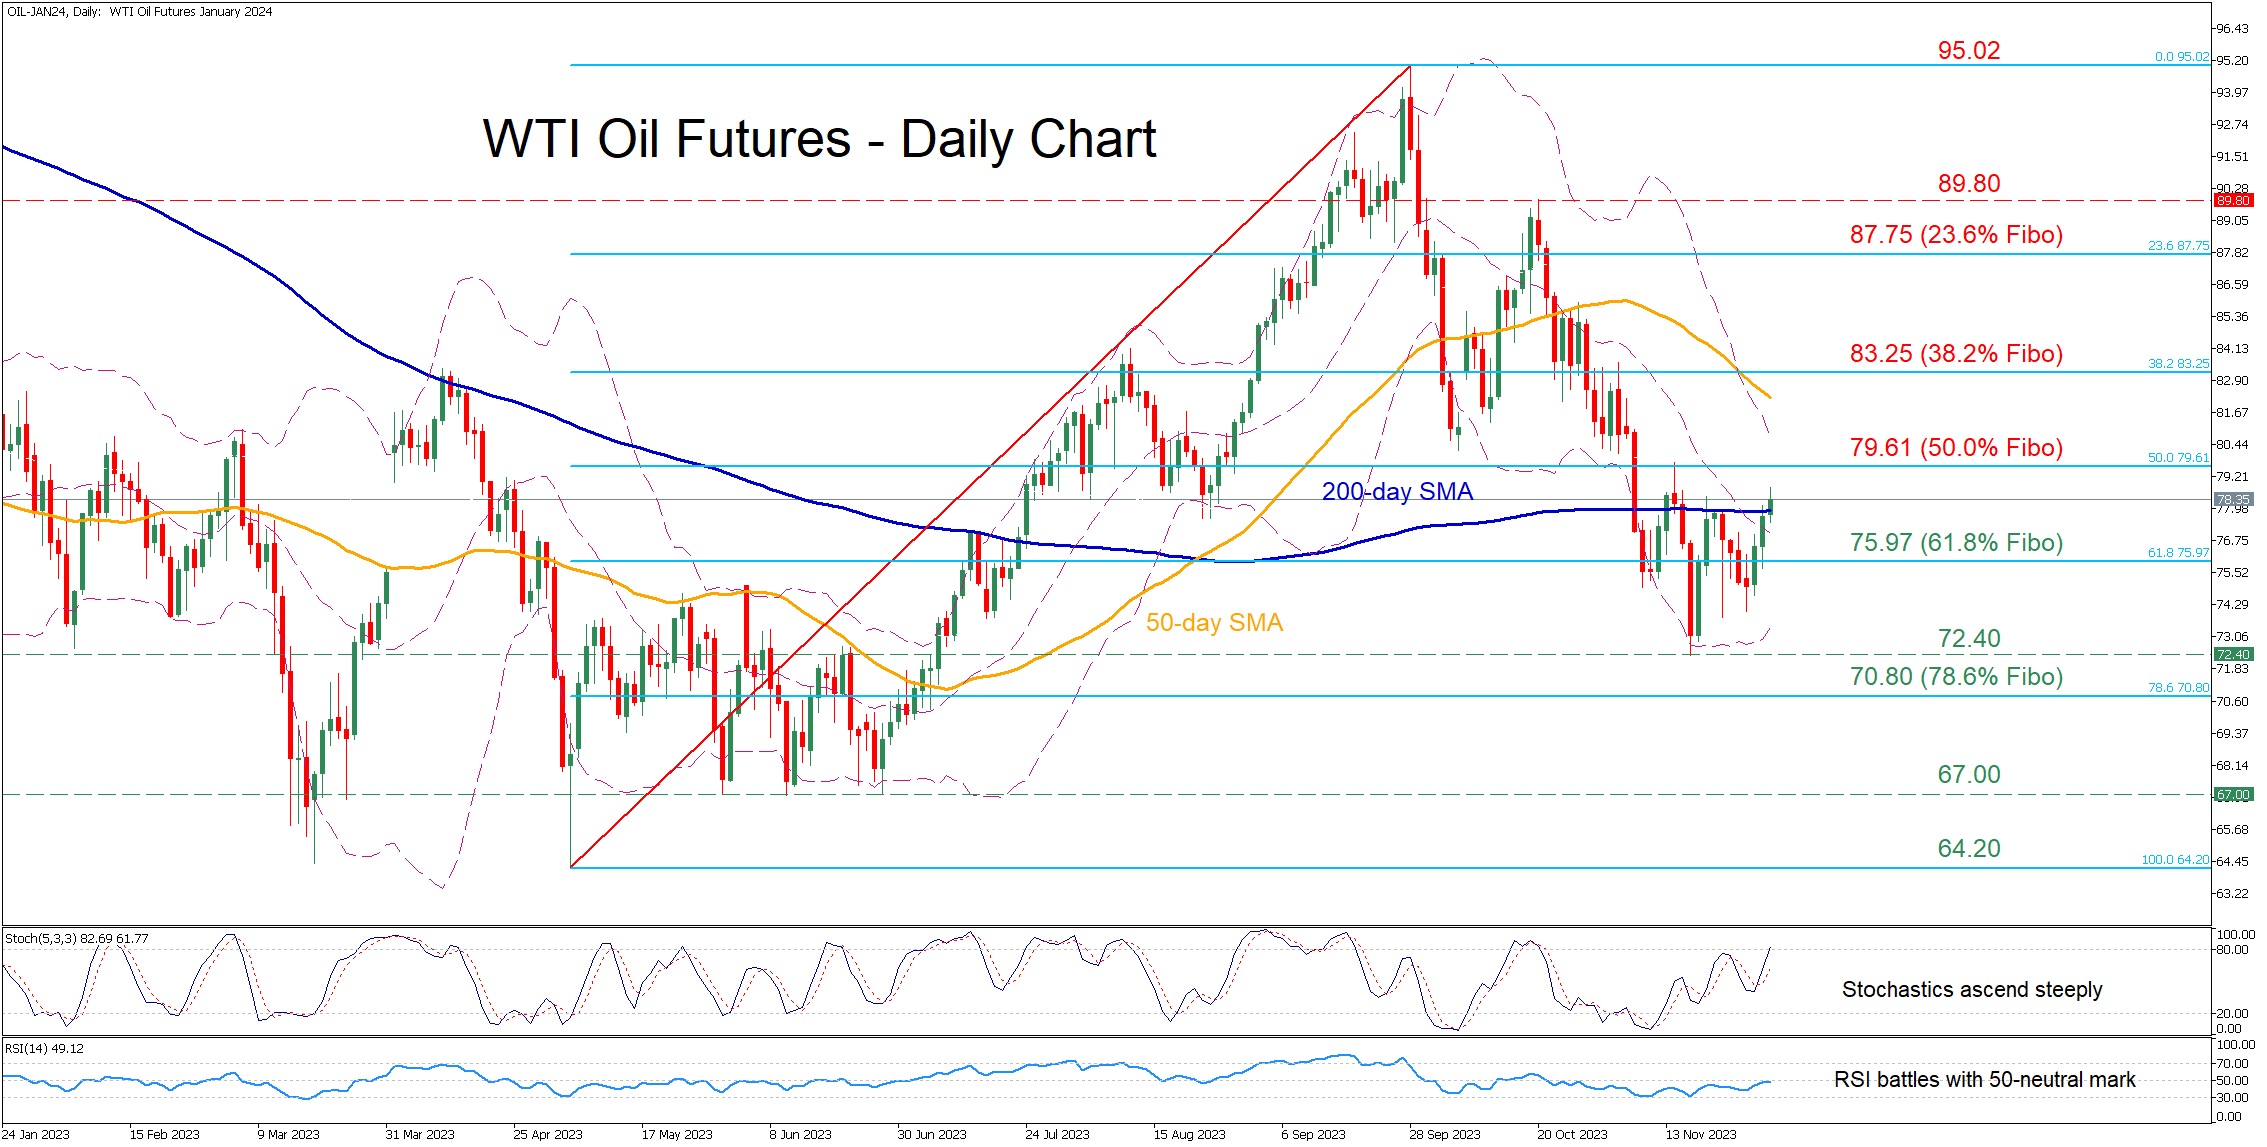
WTI oil futures (January delivery) have been on the retreat since their October peak of 89.85, breaking aggressively below historical support zones. Although the price managed to find its feet at the four-month low of 72.40, the 200-day simple moving average (SMA) has been repeatedly curbing its upside.
If the bulls manage to conquer the 200-day SMA, immediate resistance could be met at 79.61, which is the 50.0% Fibonacci retracement of the 64.20-95.02 upleg. Piercing through that area, the price could advance towards the 38.2% Fibo of 83.25. Further upside attempts could then stall around the 23.6% Fibo of 87.75.
On the flipside, should the 200-day SMA hold its ground, the price might reverse lower towards the 61.8% Fibo of 75.97. A break beneath that region could pave the way for the recent four-month bottom of 72.40. Even lower, the 78.6% Fibo of 70.80 could provide downside protection.
In brief, WTI oil futures are stuck in a bearish short-term pattern, appearing unable to stage a solid rebound. However, a clear jump above the 200-day SMA could shift the short-term picture back to bullish.
Today OPEC+ May Announce New Oil Production Cuts
According to WSJ, the reduction could be 1 million barrels per day. Saudi Arabia is in favour of cuts, but the idea causes disagreements among other members of the organisation.
In anticipation of news about the OPEC+ decision, the price of oil is rising - this indicates that market participants assess the possibility of new production cuts as quite real, even if we are not talking about 1 million barrels per day. The price is approaching its maximum for November.
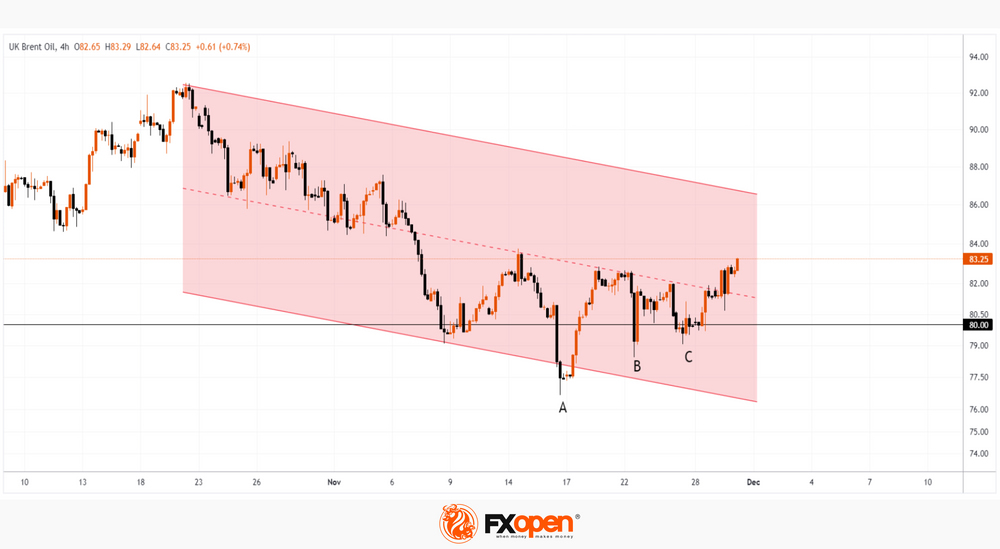
The Brent oil price chart shows that:
→ the level of 80 dollars per barrel acts as support. In the twenties, the price dropped to the level more than once, but each time the bulls found the strength to recover;
→ rising lows A-B-C indicate the predominance of demand around the mentioned psychological level;
→ the price has been within the descending channel (shown in red) for more than a month, but is trying to consolidate above the median line. This is another sign of the bulls' persistence.
However, it should be recognized that the current bullish sentiment could easily change if OPEC+ fails to reach a consensus on significant restrictions on oil production aimed at supporting commodity prices.
This article represents the opinion of the Companies operating under the FXOpen brand only. It is not to be construed as an offer, solicitation, or recommendation with respect to products and services provided by the Companies operating under the FXOpen brand, nor is it to be considered financial advice.
BTC/USD Analysis: New High for the Year Shows Bulls Are Indecisive
During November, the price of bitcoin increased by approximately 10% in anticipation of the launch of a bitcoin ETF. But the positive sentiment of crypto investors is seriously overshadowed by news regarding Binance:
→ Changpeng Zhao resigned as head of Binance.US, pleading guilty to money laundering charges. He also agreed to pay $50 million in a lawsuit from the US Department of Justice, and his company will have to pay $4.3 billion. This fine to Binance was one of the largest in the history of punishment of corporations. In addition, Zhao faces up to 10 years in prison. The judges banned him from leaving the United States until the proceedings are completed.
→ Cristiano Ronaldo was sued for $1 billion for advertising Binance. This was done by people who claim they suffered losses by buying unregistered securities that the sports star was promoting.
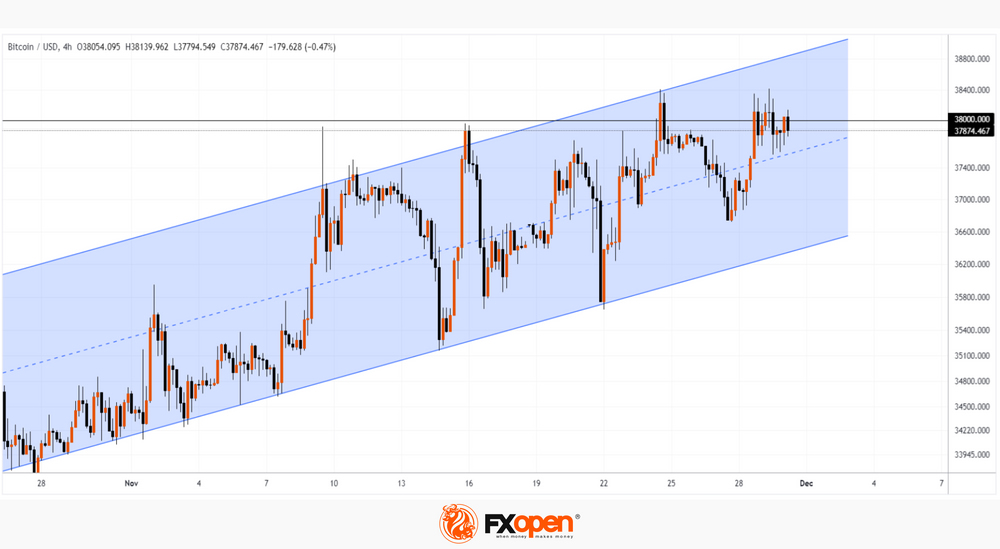
Meanwhile, the BTC/USD chart shows signs that demand forces are losing confidence, although the price is moving within an ascending channel (shown in blue).
Notice that the November 29 top was only a few dollars higher than the previous November 24 top. This short-term excess suggests that there is no sustainable predominance of demand over supply in the market around the level of $38 thousand per Bitcoin, and the top on November 29 is nothing more than a bull trap.
In such conditions, perhaps more attention should be paid to the idea of testing the lower boundary of the current channel.
This article represents the opinion of the Companies operating under the FXOpen brand only. It is not to be construed as an offer, solicitation, or recommendation with respect to products and services provided by the Companies operating under the FXOpen brand, nor is it to be considered financial advice.
EUR/USD Drops Ahead of Eurozone CPI
- Eurozone inflation expected to decline to 2.7%
- ECB’s Lagarde delivers remarks later today
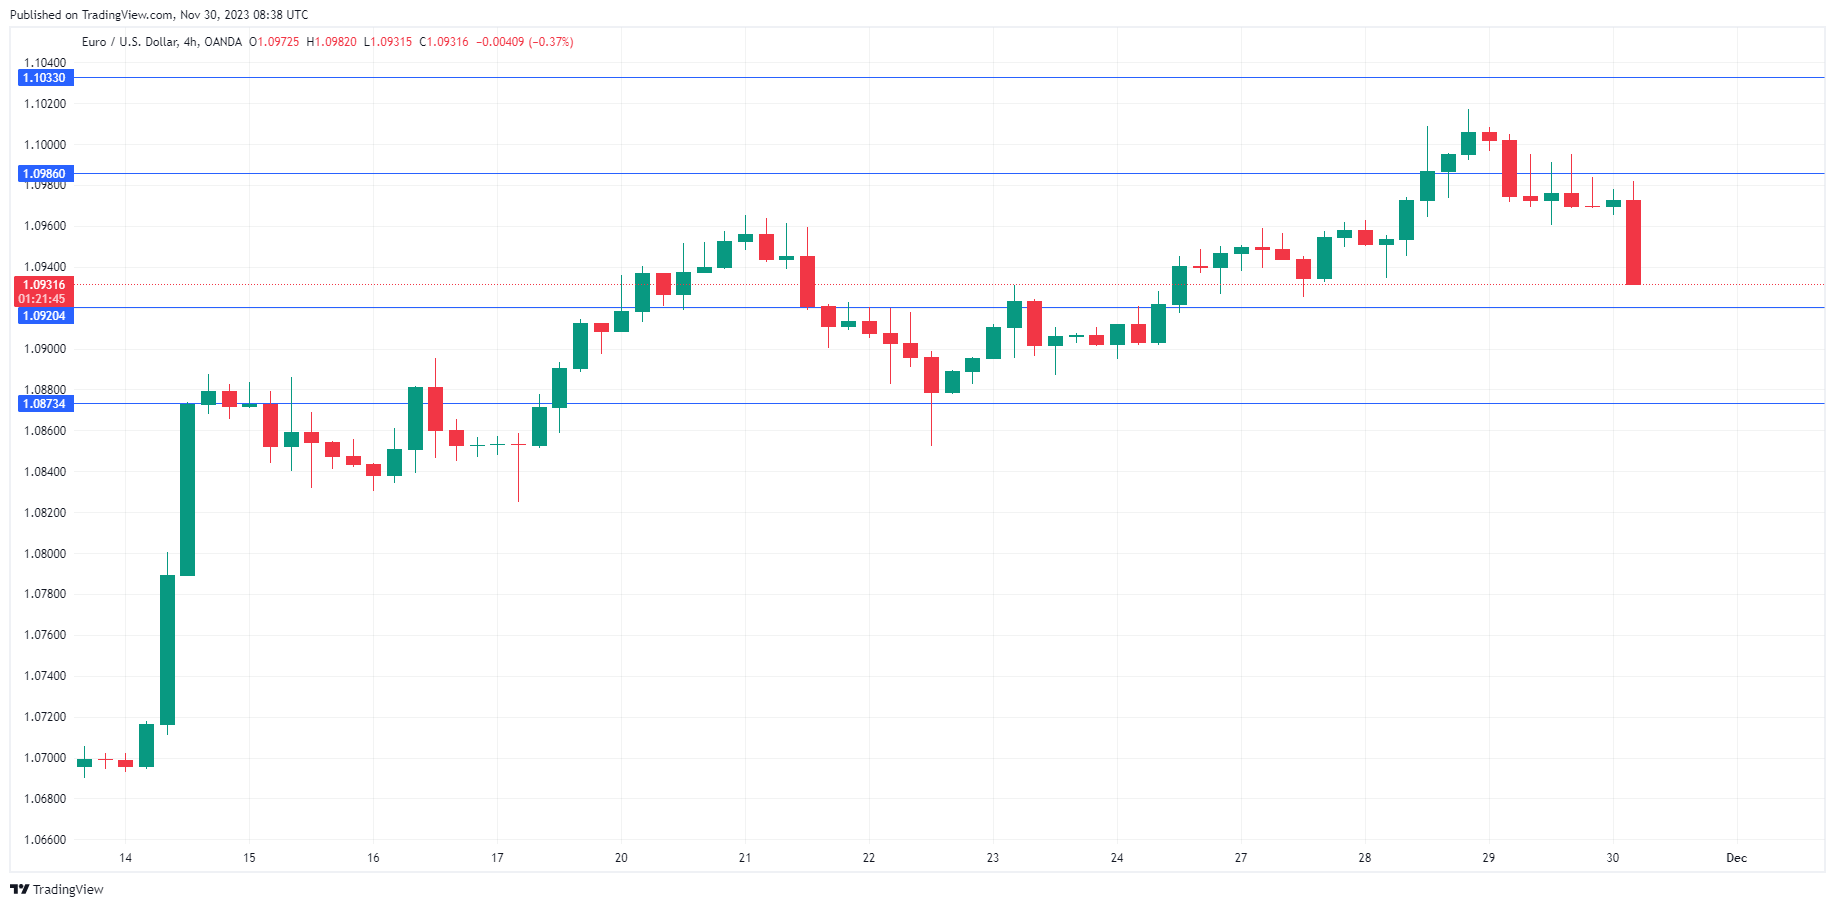
The euro is in negative territory in Thursday trade. In the European session, EUR/USD is trading at 1.0940, down 0.27%.
Eurozone inflation expected to ease to 2.7%
Germany’s inflation rate declined sharply in November and the eurozone is up next, with the November inflation report later today. German inflation dropped to 3.2% y/y in November, down from 3.8% in October and below expectations. This was the lowest inflation rate since June 2021 and was driven by lower food and energy inflation.
Will eurozone inflation follow suit? The markets are expecting a modest decline for November. Headline inflation is expected to fall to 2.7%, down from 2.9% in October, and the core is expected to ease to 3.9%, down from 4.2% in October. If inflation falls modestly as expected, it is unlikely to cause the ECB to reconsider its rate policy. The markets have priced in a rate cut in May 2024 and a softer-than-expected print would likely result in the odds of a rate cut being brought forward.
The ECB has signalled a ‘higher for longer policy’, as have the Federal Reserve and other major central banks. Even though inflation has been dropping, it remains considerably higher than the ECB’s 2% target and the central bank hasn’t given any indications of a rate cut. Investors will be looking for hints about rate policy from ECB President Christine Lagarde, who will speak today at an ECB forum in Frankfurt after the eurozone inflation release.
In the US, second-estimate GDP for the third quarter was revised to 5.2%, up from the initial estimate of 4.9%. The strong reading should ease fears of a recession but also provides the Fed with little reason to trim rates while inflation remains well above the 2% target. The Fed has signalled a ‘higher for longer’ stance on rates but the markets are more dovish and have priced in a rate hike in March 2024 at 45%, according to the CME’s FedWatch tool.
EUR/USD Technical
- EUR/USD is putting pressure on support at 1.0920. Below, there is support at 1.0873
- 1.0986 and 1.1033 are the next resistance lines