

Sample Category Title
Top Three Trade Ideas for December 2023
Hey folks, it’s a wrap to yet another month in the 2023 calendar, and I’m guessing you know what that means - time for another episode in the “What To Trade” series. For December, I will be mapping out trade more cautiously as the market volatility often drops massively, causing the markets to slow down drastically. Having said that, these are my top three trade ideas for December, for the time being.
USDJPY - D1 Timeframe
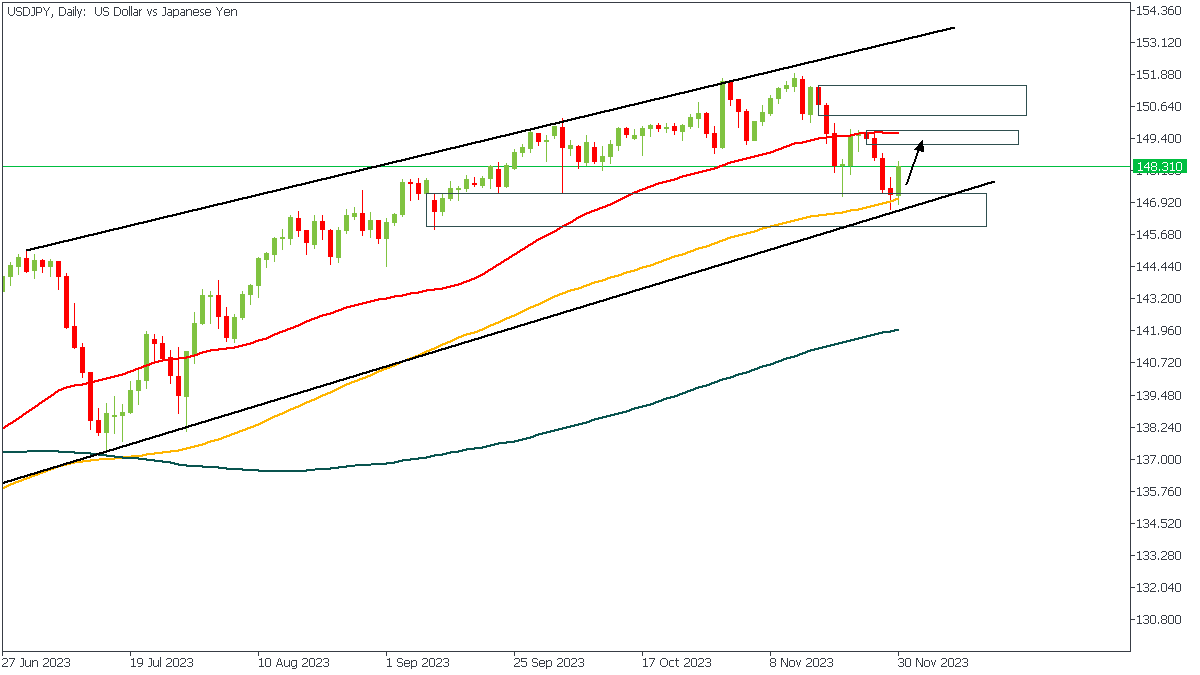
USDJPY on the Daily timeframe can be seen reacting from the confluence of the 100-Day moving average and the drop-base-rally demand zone. This confluence in conjunction with the bullish array of the moving averages indicates a likely bullish outcome - which is my sentiment in this case.
Analyst’s Expectations:
- Direction: Bullish
- Target: 150.153
- Invalidation: 146.482
AUDJPY - D1 Timeframe
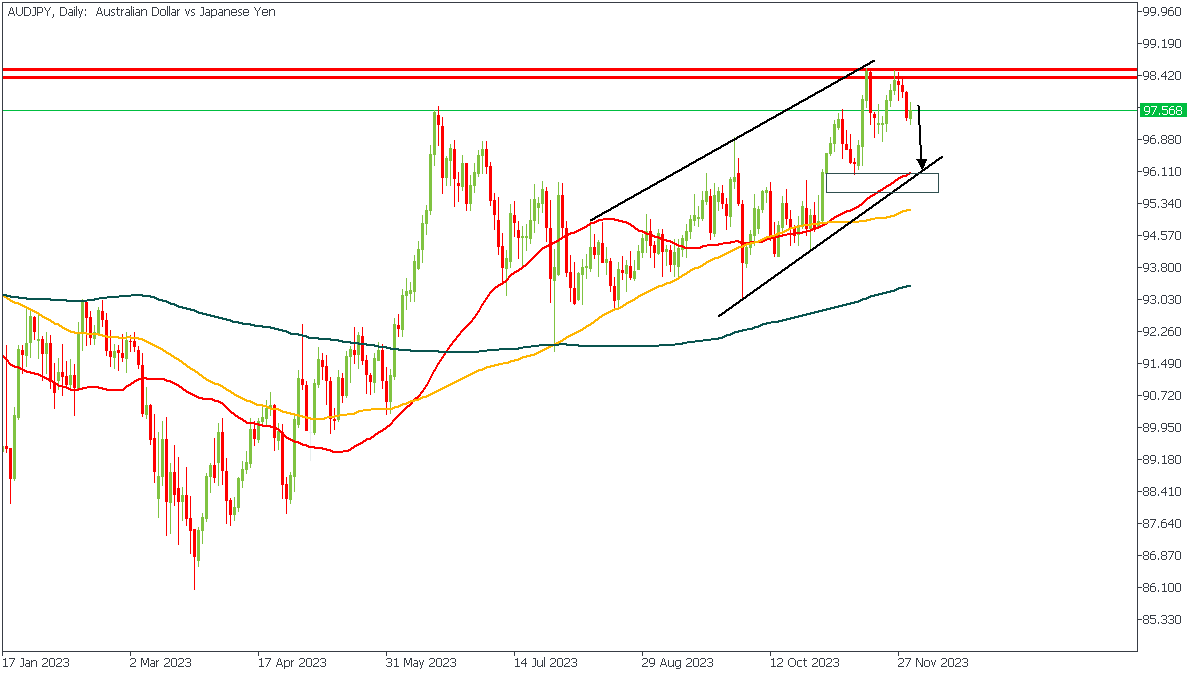
AUDJPY on the daily timeframe has already been rejected from the supply zone for a second time, this time also breaking minor structure on the H4 timeframe. In this case, my initial target is set at the intersection of the demand zone, 50-period moving average, and the trendline support.
Analyst’s Expectations:
- Direction: Bearish
- Target: 96.500
- Invalidation: 98.344
NZDJPY - D1 Timeframe
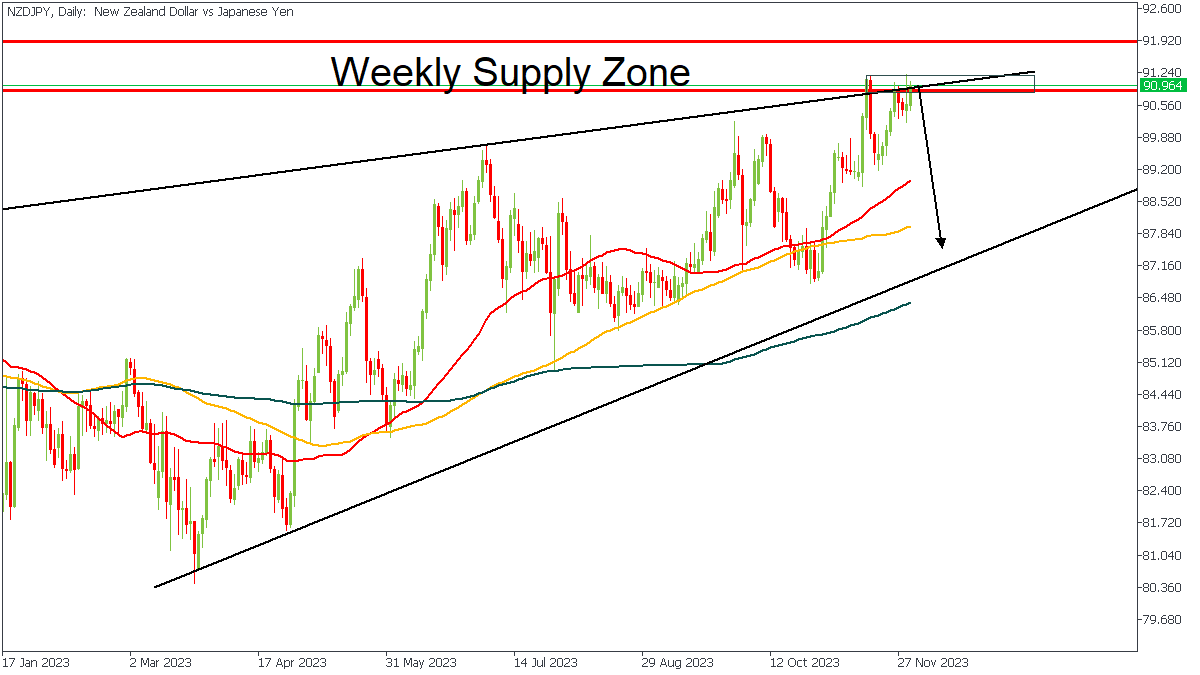
NZDJPY is currently trading within the supply zone on the weekly timeframe, and has already been rejected once from the zone. At the moment, there is also a resistance trendline intersecting the weekly supply, increasing the likelihood of a bearish momentum from the current supply zone.
Analyst’s Expectations:
- Direction: Bearish
- Target: 87.922
- Invalidation: 92.011
CONCLUSION
The trading of CFDs comes at a risk. To succeed, you have to manage risks properly. To avoid costly mistakes while you look to trade these opportunities, be sure to do your due diligence and manage your risk appropriately.
Is Bitcoin Set to Drop?
Bitcoin's price remains stagnant despite the Fed's slightly less hawkish tone. In contrast, Bitcoin has outperformed other assets, doubling in price from $16K to nearly $38K this year. Improved fundamentals, including the resolution of Binance concerns and FTX's token performance, boost sentiment. Traders are eagerly awaiting the approval of BlackRock's ETF, a potential catalyst for Bitcoin surpassing $50,000 by year-end. Technically, Bitcoin is in an upward channel, suggesting bullish momentum unless it violates this pattern.
BTCUSD - D1 Timeframe (BEFORE & NOW)
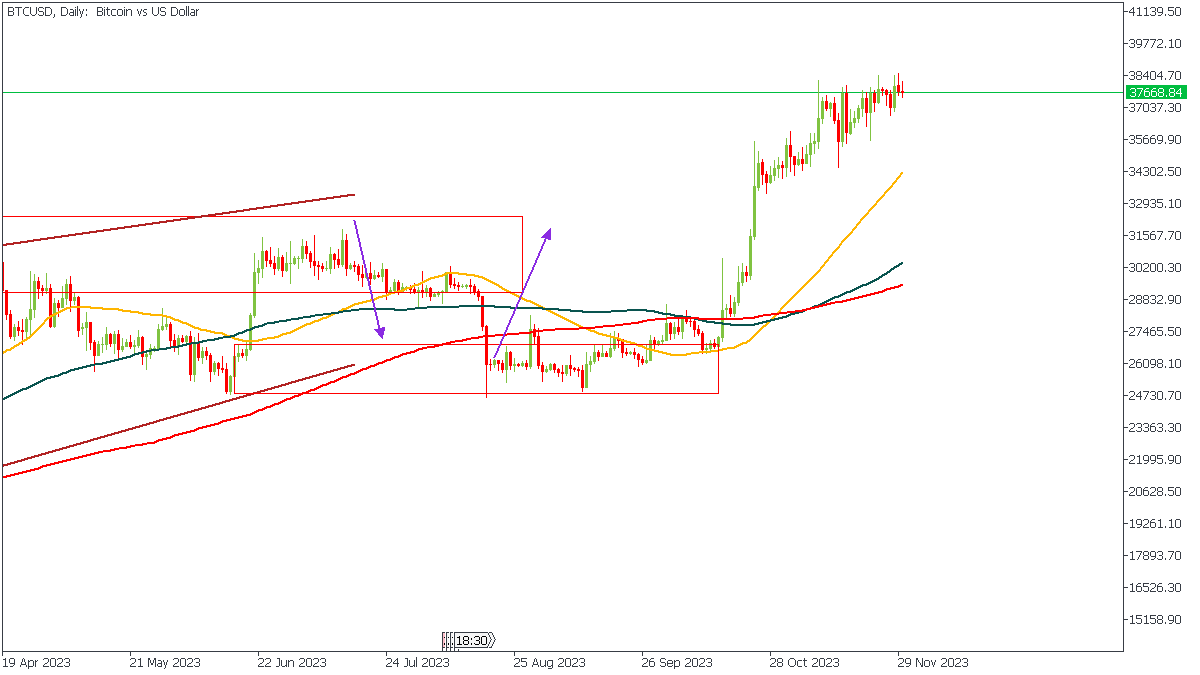
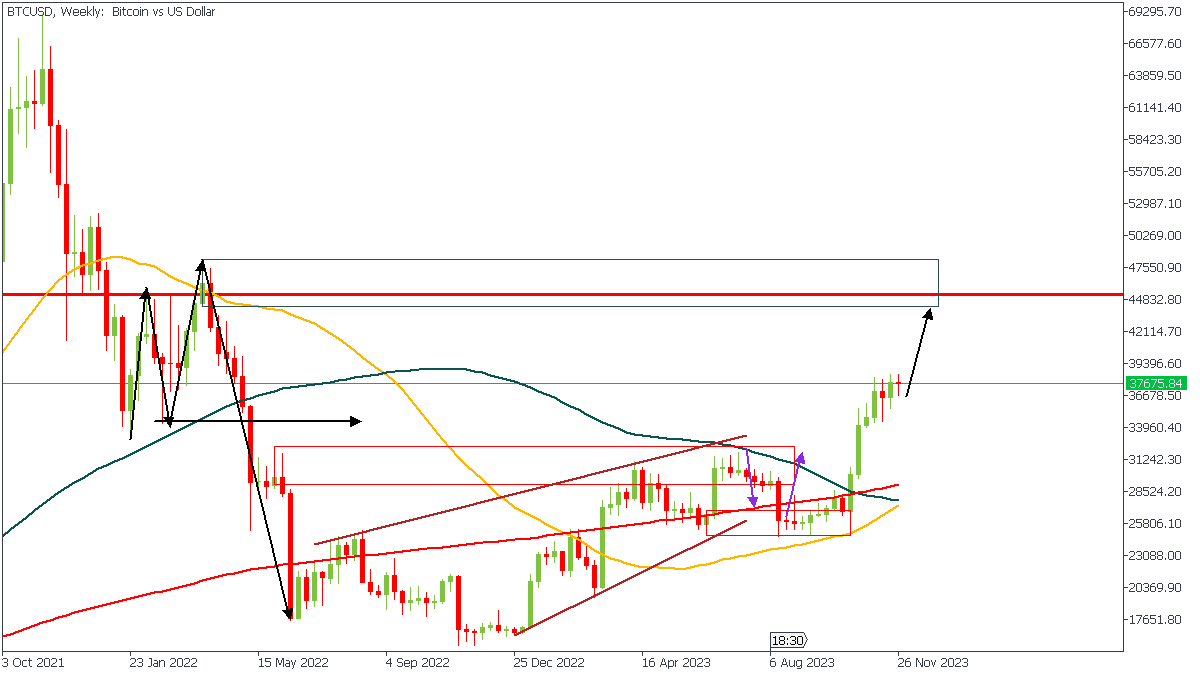
In my article dated 10th of October, I detailed my reasons for expecting a decline in BTC prices, followed by a surge from a technical point-of-view. The chart above shows the outcome of that analysis, which confirms to a large extent the degree of accuracy in such articles as this. So, follow me closely as I expound on my expectations for BTCUSD in the coming days.
BTCUSD - W1 Timeframe
Currently, on the 4-hour timeframe, BTCUSD is trading within a bullish channel, and seems poised to break out of the trendline resistance. This already signifies the likelihood of a bullish outcome. From a larger perspective, we also see that a head-and-shoulder pattern appears to be in formation on the weekly timeframe chart, as attached. This being the case means that we may get to see BTCUSD prices soar all the way to the $45,000 mark. Do note, however, that this is my personal opinion on the matter and not financial advice.
Analyst’s Expectations:
- Direction: Bullish
- Target: $45,000
- Invalidation: $36,280
CONCLUSION
Trading CFDs comes at a risk. To succeed, you have to manage risks properly. To avoid costly mistakes while you look to trade these opportunities, be sure to do your due diligence and manage your risk appropriately.
GBPCAD Wave Analysis
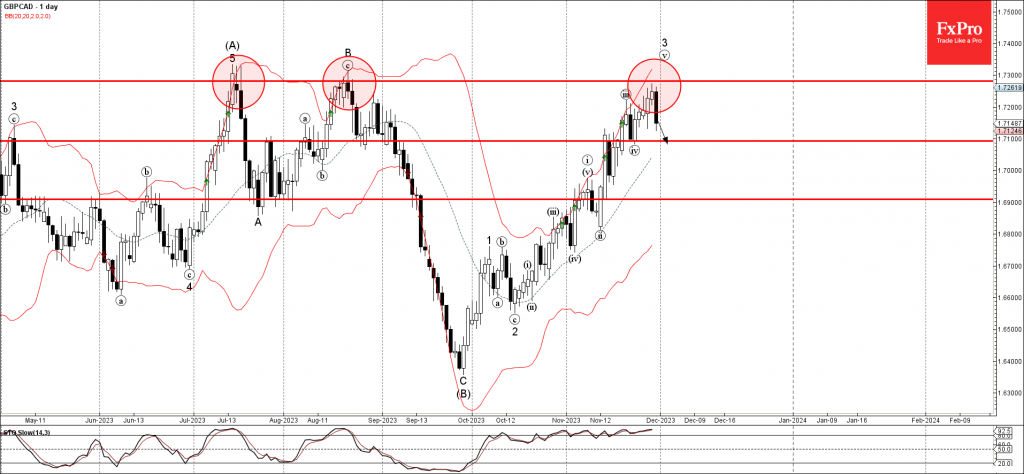
- GBPCAD reversed from resistance level 1.7280
- Likely to fall to support level 1.7100
GBPCAD currency pair recently reversed down from the long-term resistance level 1.7280 (strengthened by the upper daily Bollinger Band), which has been reversing the pair from the start of July, as can be seen below.
The pair is currently forming the daily Evening Star – strong sell signal for this currency pair.
Given the strength of the resistance level 1.7280, strongly overbought daily Stochastic, GBPCAD currency pair can be expected to fall further to the next support level 1.7100.
WTI Oil: Oil Price Extends Advance as OPEC+ Rolls Over Production Cuts
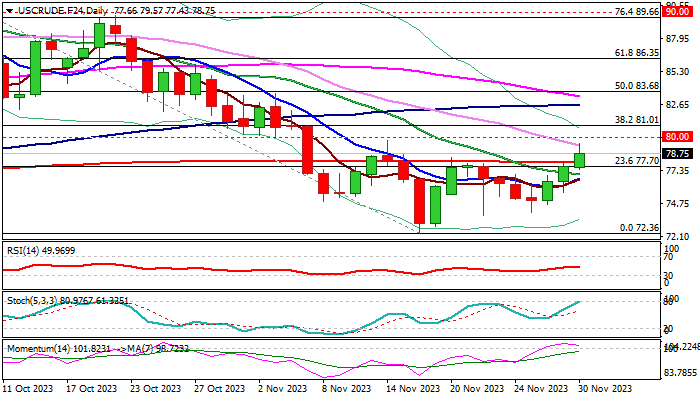
WTI oil price rose above $79 for the first time in two weeks on Thursday, as fresh bullish acceleration extends into third consecutive day.
The OPEC+ decided to extend its supply cuts in 2024, as the cartel met today, after meeting scheduled for Nov 26 was postponed, adding support to oil price.
The top world oil producers agreed preliminary cut of over 1 million barrels per day, including Saudi Arabia extending the voluntary cut since July, with smaller contribution from other members.
The OPEC+ members also discussed potential bigger cuts in 2024, with extension to 2 million barrels per day being on the table.
Tighter oil market will offer fresh support to oil and continue to underpin the price in coming months.
Today’s acceleration broke above significant barrier at $78.04 (200DMA) and cracked daily Kijun-sen ($79.12) increasing pressure on psychological $80 resistance.
Expect initial bullish signal on close above 200DMA, which reverted to solid support, with extension through $80 and $81 pivots (psychological / Fibo 38.2% of $95.00/$72.36) to further strengthen bullish structure and open way for further advance.
Improving daily technical studies add to positive near-term outlook, though bulls may face headwinds at $80 zone and enter consolidation before resuming.
Bullish bias expected to remain intact above 200DMA, while fall below converging 20/10DMA’s ($77.07/$76.78) would neutralize bulls.
Res: 79.57; 80.00; 81.00; 81.52
Sup: 78.07; 77.70; 76.78; 74.04
Sunset Market Commentary
Markets:
At the start of trading this morning, core (US) bonds showed tentative signs of taking a breather after their recent rally. However, French data again perfectly fit the recent bond friendly market momentum. French Q3 GDP growth was downwardly revised from +0.1% to -0.1%. October consumer spending fell off a cliff (-0.9% M/M) and, in line with evidence from other EMU member states, French HICP inflation printed well below expectations at -0.3% M/M and 3.8% Y/Y (from 4.5% and vs 4.1% expected). Yields across the Bund- and EMU swap curves, touched new correction low levels, with the short end taking the lead. Later, the flash estimate of EMU headline inflation printed at -0.5% M/M and 2.4% Y/Y (from 2.9%). Core inflation also eased substantially from 4.2% Y/Y to 3.6% Y/Y. This time there was no further market reaction. Too early to really call it a buy-the-rumour, sell-the fact reaction yet. Even so, especially long term yields tried to leave recent lows. German yields are changing between -1 bp (2-y) and +4 bps (30-y). In the US, the focus was on the October US income and spending data, and more in particular on the price deflators. Both spending & income (0.2% M/M) and the deflators (headline 3.0% vs 3.1% expected, core 3.5% from 3.7%) were very close to expectations. US jobless claims also brought no market moving news (218k from 211k, exactly as expected). US bonds are taking a breather from their recent rally with the 2-y rebounding 5.5 bps. The 10-y adds 9 bps (4.34%). The focus now turns the US manufacturing ISM, to be released tomorrow. The market expects a slight improvement (47.8) but still in contraction territory. Interesting to see how bond markets react in case of additional signs of a slowdown in activity. Despite some ‘hesitation’ over the previous days, especially in US indices, equities still feel supported by the hope for substantial monetary easing next year. The EuroStoxx 50 adds 0.30%, nearing the 4400 mark with the 2023 top at 4491 also coming on the radar. US indices open mixed (Dow +0.5%, Nasdaq -0.3%).
On FX markets, EUR/USD in the first place took a hit after the big miss in French data. At the same time, the dollar gradually also showed tentative signs of bottoming. At 1.09, the first attempt of the ) cross rate to regain the 1.10 probably is rejected for now. USD/JPY also tries to leave the recent lows behind (148.35). EUR/GBP in line with the broader early morning euro sell-off temporary dropped to the 0.862 area, but the move was fully reversed later (currently 0.8645). It’s a bit telling that sterling in the current environment fails to profit from broader euro weakness.
News & Views:
Saudi Arabia is rallying support behind a proposal of additional OPEC+ production supply cuts of 1 million barrels a day (1% of global supply) in an effort to prevent the oil market returning to a surplus next year. The Kingdom would simultaneously extend its own voluntary cutback of the same size which has been in place since July. OPEC+ has its ministerial meeting via online sessions after the physical event was delayed last week because of ongoing negotiations. One of the remaining stumbling blocks in negotiations are production for African members like Angola and Nigeria. Both countries have underproduced in recent years because of underinvestment and try to revive their output. Brent crude prices rallied from $83/b to $84.5/b on the news.
Canadian GDP unexpectedly shrank in the third quarter of the year (-0.3% Q/Q). An upward revision to the Q2 figure to 0.3% Q/Q implies that the technical recession is nevertheless avoided for now. Details showed a decrease in international exports (-1.3% Q/Q vs 0.2% decline in imports) and slower inventory accumulation being partially offset by increases in government spending and housing investment. Final domestic demand increased 0.3% Q/Q, following a similar increase in the second quarter. Business investment in non-residential structures fell by 2% Q/Q. Separate data showed compensation of employees rising by 1.3% on a nominal basis in Q3 of 2023. Canadian markets didn’t respond to the release with USD/CAD changing hands around 1.36.
Gold Breaks To New Highs. What Is Expected In December?
Gold prices, reaching the highest since May 5, are consolidating as traders await the US PCE Price Index, a key inflation indicator. The upcoming data could impact the Fed's policy, influencing the demand for the US Dollar and providing direction for gold. The Greenback sees some repositioning, recovering modestly ahead of the data risk. A positive tone in US equity futures acts as a headwind for gold, but the growing belief that the Fed might cut rates in March 2024 could limit significant dollar appreciation. Amid China's economic concerns, gold finds support in this nuanced market scenario.
XAUUSD - D1 Timeframe
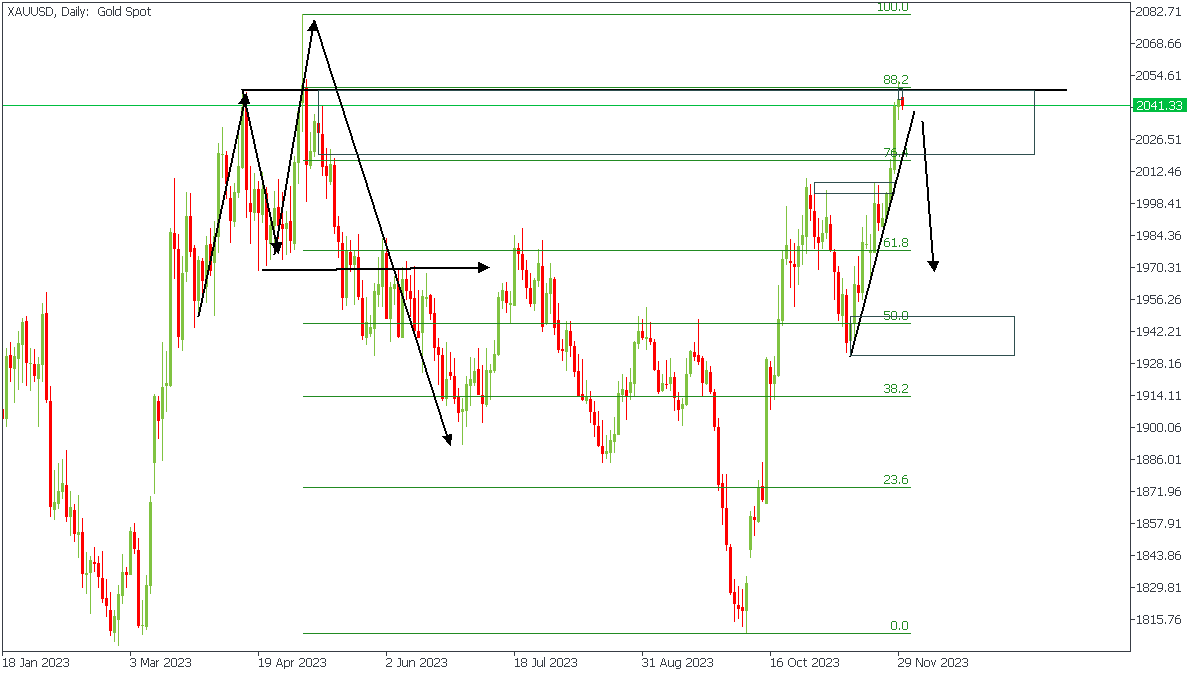
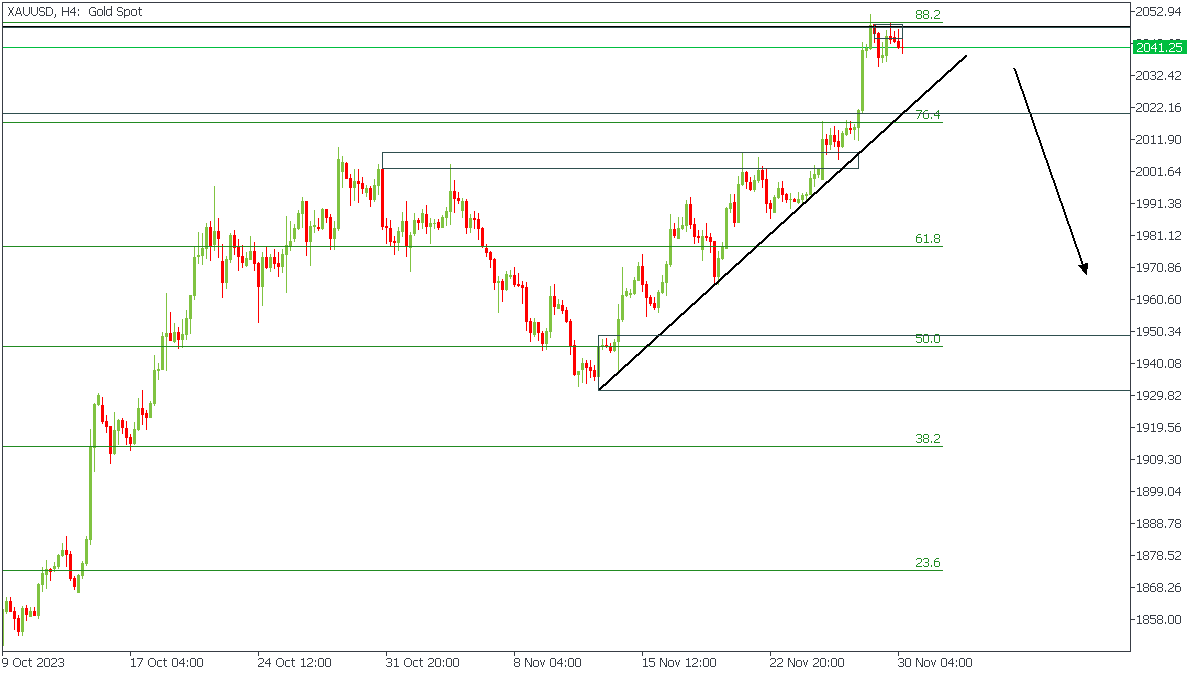
As seen on the attached chart which shows the daily timeframe of XAUUSD (Gold), price seems to have created a head-and-shoulders pattern, with an initial rejection from the 88% of the Fibonacci retracement level. Based on this, I expect to see a pause in the bullish rally, at least, until price reaches the 50% Fibonacci level.
XAUUSD - H4 Timeframe
On the 4-Hour timeframe, a more cautious approach would be to wait for the break and retest of the trendline shown in the chart above, and then the bearish trend can be considered to be in motion.
Analyst’s Expectations:
- Direction: Bearish
- Target: 1950.77
- Invalidation: 2053.42
CONCLUSION
The trading of CFDs comes at a risk. To succeed, you have to manage risks properly. To avoid costly mistakes while you look to trade these opportunities, be sure to do your due diligence and manage your risk appropriately.
WTI nears 80 psychological barrier, awaiting confirmation of OPEC+ deal
Oil market is extending near-term recovery today, driven by recent reports that OPEC+ has reached a preliminary agreement to cut oil production by over 1 million barrels per day. This development, reported by two OPEC+ sources to Reuters, has sparked optimism among traders and investors, leading to an extension in the near-term recovery of oil prices.
The proposed reduction is significant, as it includes Saudi Arabia's continuation of its voluntary cut of 1 million bpd, which has been in effect since July. Additionally, the deal involves further contributions from other OPEC+ members, marking a concerted effort to stabilize oil prices amidst global economic uncertainties.
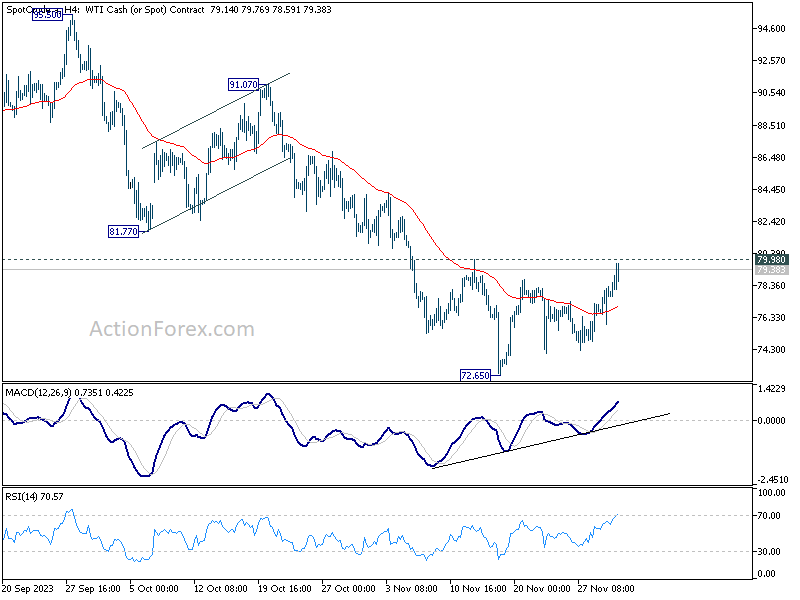
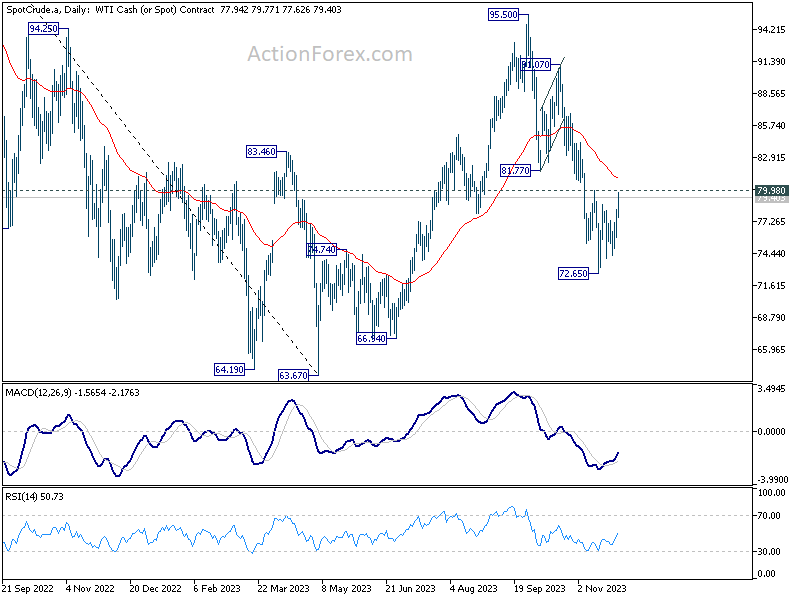
From technical analysis standpoint, WTI crude oil is now eyeing key resitsance level at 79.98, which is close to 80 psycholgoical level. Decisive break there will argue that whole corrective fall from 95.50 has completed with three waves down to 72.65. In this case, stronger rebound should be seen back to 81.77/91.07 resistance zone in the near term.
The momentum for this potential rebound in oil prices hinges on confirmation of the OPEC+ deal. Should the agreement be officially confirmed, it could act as a catalyst, triggering further upward movement in oil prices.
Fed’s Daly: Inflation hedge unnecessary, dismisses rate cuts notion
San Francisco Fed President Mary Daly, in an interview with Germany's Börsen-Zeitung newspaper, expressed confidence in the current state of monetary policy, stating that "policy is in a very good place" as Fed has "raised the key interest rate significantly."
She further mentioned, "We don't need an insurance mentality now, where we hedge against rising inflation. We should simply be patient and remain vigilant."
Regarding future rate adjustments, Daly clarified, "I'm not thinking about rate cuts at all right now." She emphasized her current focus on evaluating whether the current level of monetary tightening is sufficient to restore price stability.
Daly also provided an optimistic view of the economy, noting, "Our inflation data are improving and our real economy has not stalled." She added, "I don't see a recession on the horizon at the moment."
Eurozone Disinflation Accelerates as Markets Price in April Rate Cut
Eurozone inflation fell much further than expected in October, leaving the headline HICP rate within touching distance of the ECB's 2% target.
While policymakers have continued to push back against talk of rate cuts, the questions will be impossible to ignore now with markets pricing in one in April and at least four in total next year.
Core inflation remains higher than the headline rate at 3.6% but the pace of deceleration is extremely promising. While policymakers expect inflation to rise slightly over the coming months due to less favorable base effects, they also expected it to fall slower recently so there's every chance price growth could continue to edge lower.
One thing that been consistent during this inflation crisis has been its unpredictability and perhaps we're seeing this on the way down too. It was initially transitory, then required some rate hikes and before you knew it, it was accelerating at a much more aggressive pace than anyone expected. Now it's falling faster than policymakers assumed too.
And with the eurozone economy on the brink of recession, policymakers will have to question whether conditions are too tight based on recent evidence, almost certainly starting at the meeting in two weeks. So far we've been told that it's not the time to even have the conversation but surely that's no longer true. The December meeting has just become much bigger and forecasts will be crucial.
US inflation continues to fall ahead of December Fed meeting
US inflation is also heading in the right direction, although the bulk of the PCE readings were in line with expectations. Still, the monthly headline figure printing at 0% was another step in the right direction and below market expectations which again suggests disinflationary pressures are stronger than central banks have been willing to accept.
Policymakers at the Fed must already be considering withdrawing such a hawkish rhetoric after the meeting in two weeks and it will be interesting to see whether the jobs and CPI inflation reports in the interim tip them one way or the other.
A consensus reached among OPEC+?
Oil has continued to creep higher today but price action has been a little volatile amid all of the rumours around the virtual meeting. The most recent headlines suggest a consensus has been reached but what that number is still isn't clear. Between 1.3 and 2 million is what's been speculated but the alliance has surprised before and may do so again.