

Sample Category Title
UK PMI manufacturing finalized at 47.2, recovery remains elusive
UK PMI Manufacturing was finalized at 47.2 in November, up notably from October's 44.8. This marks the third consecutive month of rising PMI figures and the highest level since May.
Despite these gains, it is important to note that the PMI has remained below the neutral 50 mark for 16 consecutive months, indicating a prolonged period of contraction in the manufacturing sector.
Rob Dobson, Director at S&P Global Market Intelligence, commented, "Although the downturn in production eased sharply in November, the latest PMI report brings little festive cheer when the finer details are considered."
Dobson pointed out that despite improvement in production, the sector faces ongoing challenges. These include sharp declines in new order inflows and exports, along with clients destocking, which collectively suggest that a robust and sustained revival in meaningful growth is not yet on the horizon.
Dobson also noted, "Manufacturers are preparing for tough times ahead, with their continued caution leading to cutbacks in staffing, inventories, and purchasing."

USDCHF Bullish Odds Increase After 4-month Lows
- USDCHF bounces from 4-month lows
- Oversold signals create hopes for a rebound
- An advance above 0.9100 is required
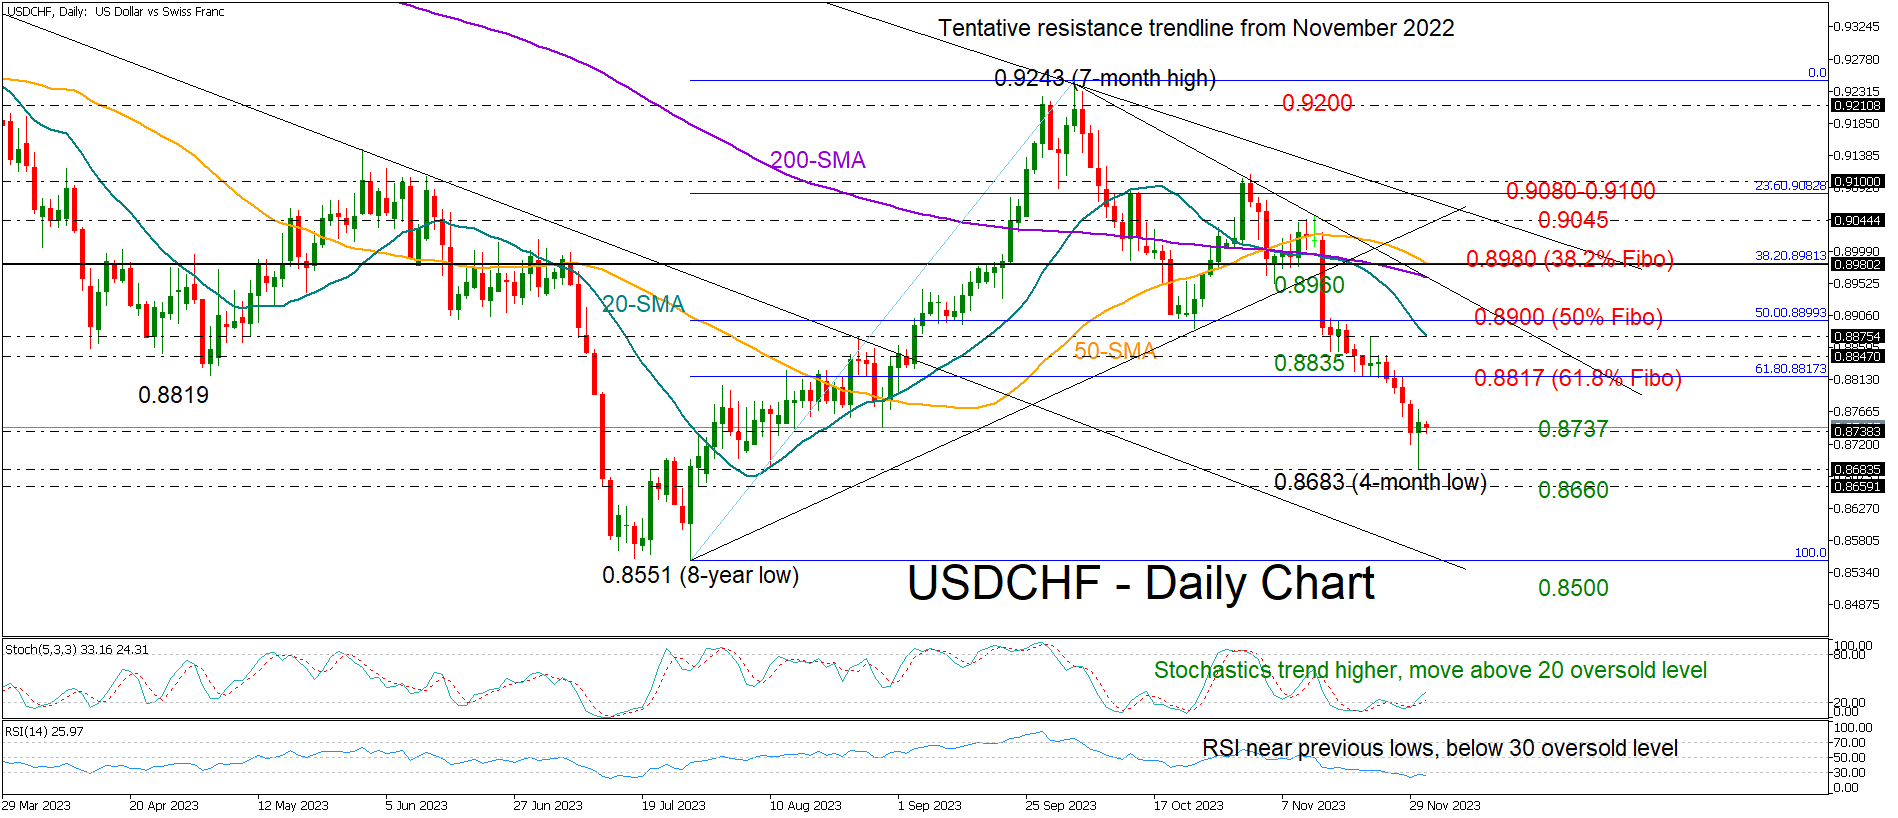
USDCHF extended its three-week bearish wave, dipping as low as 0.8683 on Thursday before closing the day with mild gains above the 0.8700 round level.
Although Friday’s session started with weak momentum ahead of the ISM business PMI figures, traders might attempt to push the pair higher according to the technical indicators. The RSI is near its previous lows in the oversold zone, while the stochastic oscillator has started to make higher highs and higher lows to exit the oversold zone below 20, both making an upside reversal or some stability likely. Moreover, Thursday’s candlestick seems to have taken the form of a bullish hammer, but more gains are required to confirm it.
On the upside, the area between 0.8815 and 0.8900 formed by the 61.8% and 50% Fibonacci retracement levels of the previous upleg could be a hurdle given the constraints within the region. A decisive close above it could underpin buying appetite, lifting the price forcefully up to the 200- and 50-day simple moving averages (SMAs), where the 38.2% Fibonacci mark is also located at 0.8980. Additional gains from there might take a breather around 0.9045 before the attention turns to the 23.6% Fibonacci level of 0.9080 and the 0.9100 psychological mark.
In the bearish case, where the price slips below 0.8737, support could commence within the 0.8660-0.8683 territory. If that base proves fragile, the pair might fall directly to July’s eight-year low of 0.8551. A continuation below 0.8500 could see a test around the January 2015 barrier of 0.8370.
All in all, USDCHF could switch into recovery mode in the short-term, though only a bounce above 0.8900 would add credence to a potential rebound.
Eurozone PMI manufacturing finalized at 44.2, continuing contraction, but slower
Eurozone's PMI Manufacturing was finalized at 44.2 in November, up from October's 43.1, reaching a six-month high. The report highlights reduction in the rate of decline for new orders, stocks, and purchasing activity, yet underscores a concerning trend of increasing employment cuts.
Breaking down the performance across Eurozone member states, Greece emerged as the only country in expansion, with PMI of 50.9. Ireland remained stable at 50.0. In contrast, other major economies like Spain (46.3), the Netherlands (44.9), Italy (44.4), France (42.9), Germany (42.6), and Austria (42.2) all registered figures indicative of ongoing contraction in their manufacturing sectors.
Cyrus de la Rubia, Chief Economist at Hamburg Commercial Bank, said, "November has not been the prettiest." He noted the continuous decline in output and the trend of workforce reductions extending for six months. While acknowledging slight improvements in various sub-indices, de la Rubia pointed out that these are insufficient to signal a robust upward trend, describing them as "timid" and lacking the necessary dynamism.
De la Rubia also highlighted the divergent conditions within the top four Eurozone economies, with Germany uniquely showing a softening in output decline. In contrast, the situation appears to be worsening in other major economies.
He emphasized, "A crucial barometer for the recovery's onset will likely be a more synchronized upward movement in the economies PMI indexes, leading to a self-reinforcing reciprocal push among countries."
USDCAD Extends Decline Towards the 200-day SMA
- USDCAD posts a fresh 2-month low in today’s session
- Decline shows no signs of easing, bears eye the 200-day SMA
- Momentum indicators endorse the resumption of the retreat
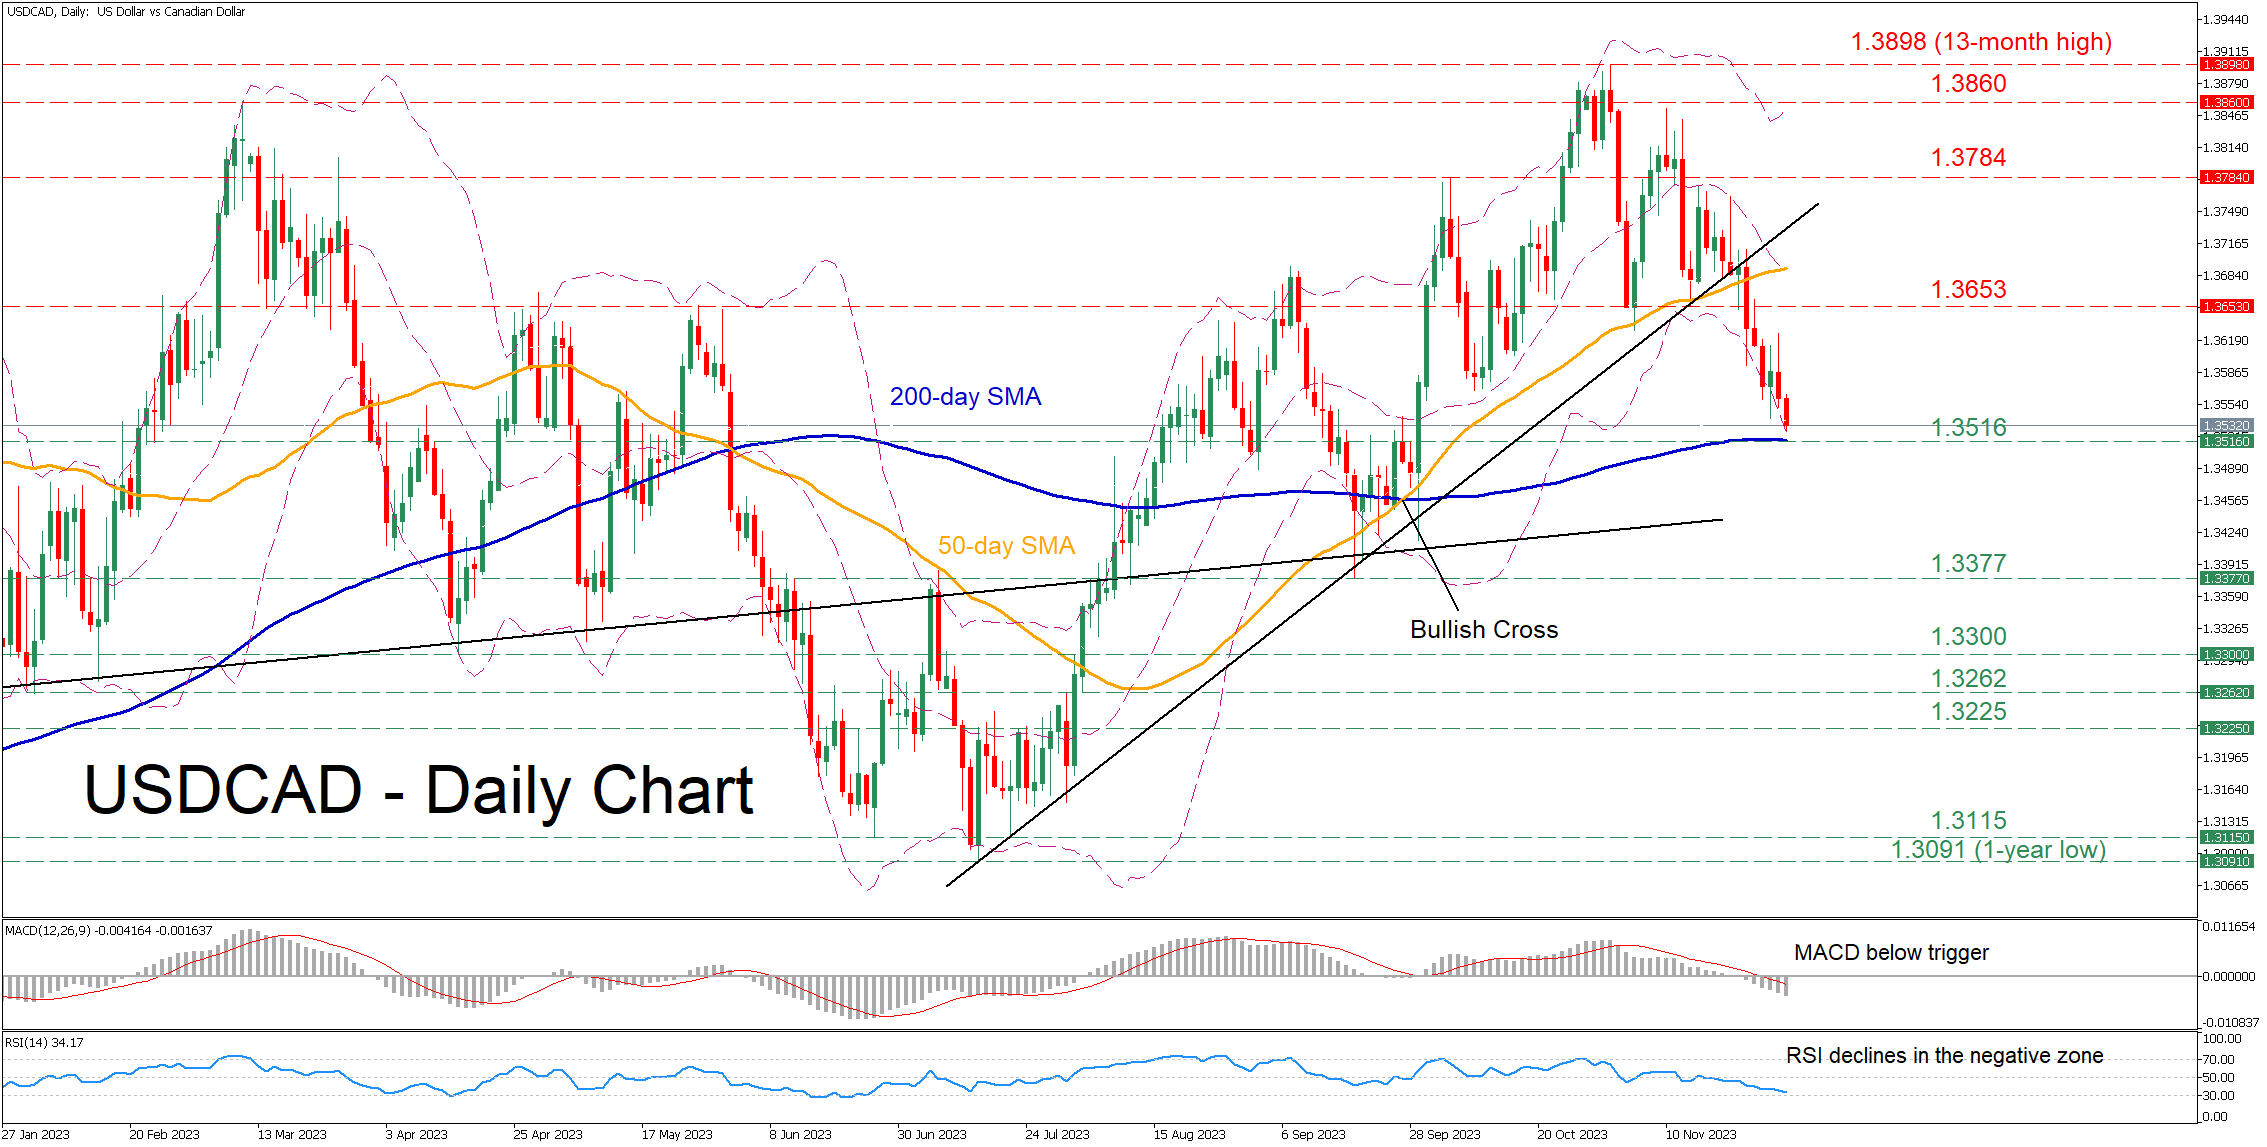
USDCAD has been constantly losing ground following its 13-month high of 1.3898 on November 11. Moreover, the pair dropped to its lowest levels in two months on Friday, with the bears setting the stage for a test of the 200-day simple moving average (SMA).
Given that the momentum indicators are heavily tilted to the downside, the pair could soon face the 200-day SMA at around 1.3516. Should that barricade fail, there is no prominent support until the September low of 1.3377. A violation of that territory could open the door for the April bottom of 1.3300.
On the flipside, if the price reverses higher, the bulls might attack the April-May resistance of 1.3653. Surpassing that zone, the pair could face the October resistance of 1.3784. Further advances may then cease at the March peak of 1.3860.
In brief, USDCAD has been under increasing downside pressures lately, generating a structure of lower lows. Moving forward, a test of the 200-day SMA could decide whether the decline has been overstretched.
EUR/USD Stands at the Back Foot Ahead of Fed Powell’s Speeches
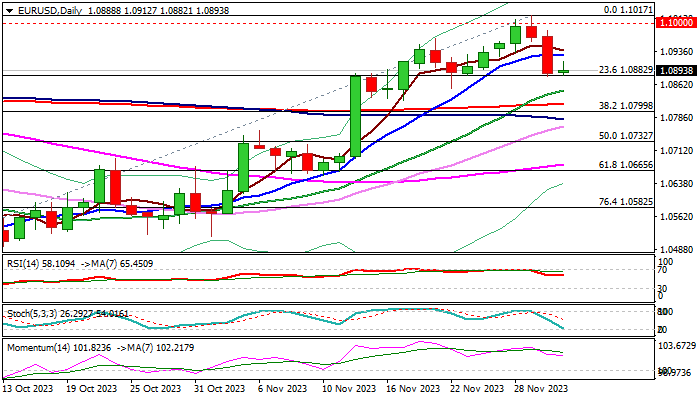
EURUSD was a tad higher on Friday morning following nearly 0.8% drop on Thursday, when the Euro was deflated by soft EU inflation numbers which may add to ECB’s dovish stance in the near future.
Additional pressure came from stronger dollar on speculations that Fed Chair Powell may surprise on hawkish shift in his speeches due later today.
Two-day pullback after a double failure at psychological 1.10 barrier, found temporary footstep on Fibo support at 1.0882 (23.6% retracement of 1.0448/1.1017 rally).
The pair is holding within a narrow consolidation above one-week low, as traders await fresh direction signals from Powell’s speeches.
Overall picture is still bullish on daily chart, but near-term structure is weak, with bearish bias to remain in play while the action stays below broken 10DMA (1.0926) and risk test of next pivotal supports at 1.0818/00 (200DMA / weekly cloud top / Fibo 38.2% of 1.0448/1.1017), violation of which would open way for deeper drop.
Friday’s close below cracked Fibo resistance at 1.0559 (61.8% of 1.1275/1.0448) would confirm bull-trap on weekly chart and add pressure on Euro.
Res: 1.0926; 1.0965; 1.1000; 1.1017.
Sup: 1.0882; 1.0847; 1.0818; 1.0800.
Swiss GDP rises 0.3% qoq in Q3, services provides support
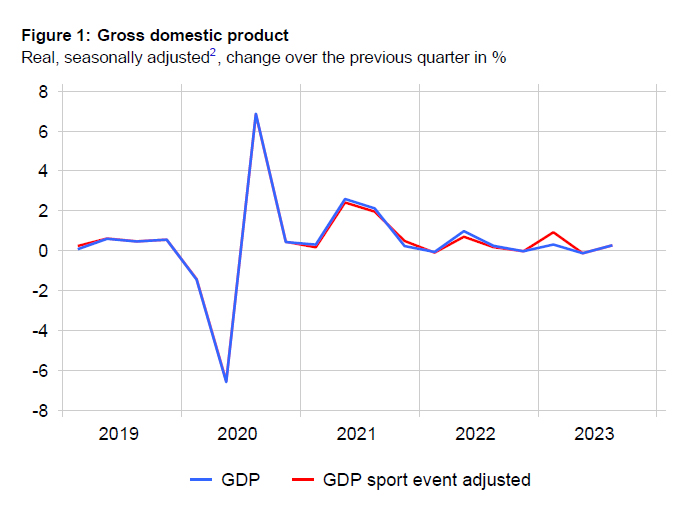
Swiss GDP grew 0.3% qoq in Q3, above expectation of 0.1% qoq. SECO said: "The international environment remains challenging, with value added in industry stagnating accordingly. However, the service sector was once again able to provide a support."
US Manufacturing ISM Taking Center Stage
Markets
Poor French growth and inflation data published at the start of European dealings caused European interest rate markets to try a new leg on recent bull run. Yields across the European/German curve touched new cycle correction lows. The EMU flash CPI estimate at -0.5% M/M and 2.4% Y/Y (headline) and 3.6% Y/Y (core) beat consensus estimates by a big margin. However, this was no real surprise given earlier releases of national data. For sure, the subsequent price action, especially in European interest rate markets, didn’t look like a genuine exhaustion move yet. Especially yields at the short-end continue to price an ever growing chance of an early ECB rate cut next year (25 bps in April fully discounted). Still, yields tentatively started looking for a bottom. German yields at the end of the day changed between -2 bps (2-y) and +1.5 bps (10-y). In the US, the highly awaited October PCE deflators (headline 0% M/M and 3% Y/Y, core 0.2% M/M and 3.5% Y/Y) and the weekly jobless claims (218k) were too close to expectations to trigger further bond gains. The MNI Chicago PMI even delivered a big upside surprise (55.8 from 44.0) with solid details. The market reaction was limited, but it helped US yields to maintain intraday gains. US yields closed between 3.5 bps (2-y) and 7.2 bps (10-y) higher. Divergence both in data and in interest rates between EMU and the US, triggered hefty profit taking on the recent EUR/USD rally. The pair closed at 1.0888 (compared to a 1.0967 close on Wednesday). The move mirrored both euro weakness and USD resilience. DXY closed at 103.5 (open 102.79). USD/JPY regained the 148 big figure (close 148.2). Sterling showed some erratic swings intraday. The BoE Chief Financial Officers survey showed UK business leaders expect inflation to hold above 3% over the next three years. UK gilts underperformed. Sterling continued outperforming the euro with EU/GBP close at 0.8625, nearing the October correction low.
Asian equities mostly trade slightly in the red this morning. US treasuries are going nowhere. The dollar eases slightly after yesterday’s rally. After mostly disappointing data of late, the China Caixin Manufacturing PMI unexpectedly returned into positive growth territory (50.7 from 49.5). Later today, there are no important data in Europe. In the US, the Manufacturing ISM is taking center stage. A slight improvement from 46.7 to 47.8 is expected. Of late, markets were mostly driven by (perceived) soft/negative data release. After yesterday’s surprise jump in the Chicago PMI, maybe we now should look at the market reaction function in case of an unexpected strong figure. Will better than expected data finally help a bottoming out process in yields? If so, it might also support the downside in the dollar. In this respect, EUR/USD dropped out of an ST upward trend channel starting begin November. Next support is coming in at 1.0825/26 (Mid November correction low/38% retracement ST). Comments by Fed Chair Powell at Spelman College are a wildcard. It’s unclear if he’ll touch on monetary policy at the final occasion ahead of the blackout period in the run-up to the December 13 policy meeting.
News & Views
The OPEC+ meeting, originally scheduled for Nov 26 in Vienna but delayed because of diverging views and replaced by online discussions, ended yesterday with a commitment by Saudi Arabia to extend its voluntary production cuts of 1 mn barrels/day through the first quarter. Additionally, member states including Russia, the UAE, Kuwait and Iraq pledged voluntary cuts as well in Q1 2024 totaling a combined 1.2 mn barrels/day. Oil prices rallied in the run-up to the decision and fell back afterwards, from $84.5/b to $80.5/b. Apart from the anticipation effect, the vague wording and non-unanimous commitment in the OPEC statement created doubt and uncertainty on actual output levels in coming months.
Hungarian Cabinet Minister Gulyas yesterday announced an extension of interest rate caps on household mortgages and on corporate loans for SME’s. They were first introduced early October in a reaction to the high MNB policy rate. Gulyas said that MNB rates are coming down but are still very high (11.5%). The interest rate cap on new loans for households at 8.5% will be extended until July 1. The cap on new loans for businesses at 12% will be prolonged until April 1.
DAX Will Open Elliott Wave Bullish Sequence Soon
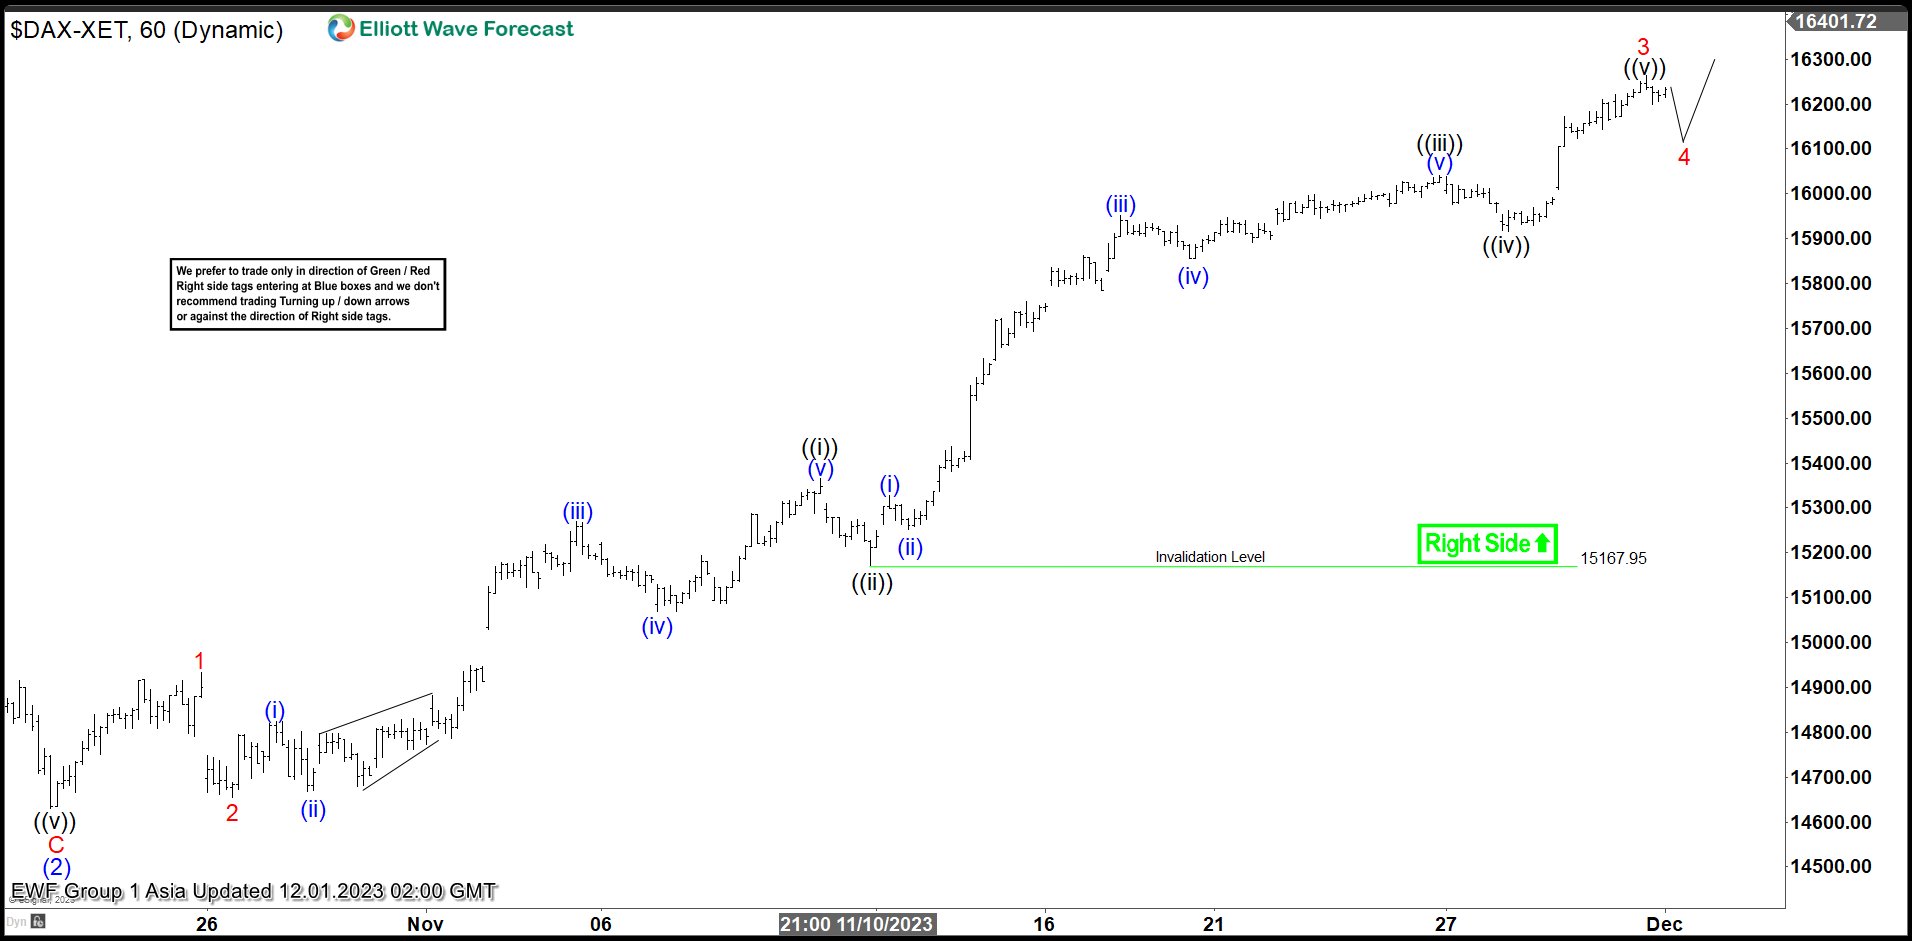
$DAX cycle from 9.29.2022 low is in progress as a 5 waves impulse Elliott Wave structure. Up from 9.29.2022 low, wave (1) ended at 16528.97 and dips in wave (2) ended at 14630.21. The Index extends higher again in wave (3). It still needs to break above wave (1) at 16528.97 to validate this view and opens up a bullish sequence.
The 1 hour chart below shows the wave (2) pullback at 14630 and the subsequent rally higher. Up from wave (2), wave 1 ended at 14933.69 and dips in wave 2 ended at 14655.08. The Index is then nesting to the upside in wave 3. Up from wave 2, wave ((i)) ended at 15364.49 and pullback in wave ((ii)) ended at 15171.58. Index then extended higher in wave ((iii)) towards 16041.17 and wave ((iv)) pullback ended at 15915.4. Expect the Index to extend higher in wave ((v)) to complete wave 3. It then should pullback in wave 4 and extends higher again afterwards in wave 5. Near term, as far as pivot at 15167.95 low stays intact, expect the Index to extend higher. Once wave 5 is done, it should complete wave (3) in higher degree.
DAX 1 Hour Elliott Wave Chart
DAX Elliott Wave Video
https://www.youtube.com/watch?v=k128NTtrFRw
WTI Oil Technical: Positive Elements Intact Ex-post OPEC+
- Earlier rally in WTI crude oil fizzled out ex-post OPEC+ meeting due to uncertainty over 2024 oil supply cut commitments from members.
- The strongest commitment came from Saudi Arabia where it will extend its its voluntary 1 million barrels per day supply through Q1 2024 while Angola has decided to go against its newly reduced supply target.
- Technical analysis suggests several positive elements in WTI crude oil despite the uncertainty over the demand and supply dynamics of the oil market.
- Watch the key support zone at US$74.30/72.40 per barrel for the week ahead.
In the recent two weeks, oil prices have exhibited wild swings of 6% to 8% as the bulls and the bears grappled with the uncertainty over oil supply cuts from OPEC+ coupled with increasing inventory stockpiles from the US and a sticky weak external demand environment.
The earlier OPEC+ ministerial meeting scheduled last Sunday has been rescheduled to yesterday, 30 November due to disagreements among African nations with leading member, Saudi Arabia on the quantum of the extended supply cuts for 2024.
In the lead-up to the outcome of yesterday’s meeting, oil prices staged an initial rally of close to 3% where the West Texas oil (a proxy of WTI crude oil futures) cleared above the 200-day moving average to print an intraday high of US$79.79/barrel due to several media reports that there was a possibility of deeper cuts enacted for 2024 before its gains were wiped out to close at a daily loss of -2.70% ex-post OPEC+ meeting.
The oil market has faced the curse of the “buy the rumour, sell the fact” due to uncertainty over the anticipated extended oil supply cuts for 2024. The strongest commitment came from Saudi Arabia where it would extend its voluntary 1 million barrels per day supply through Q1 2024 but there was an absence of a comprehensive breakdown of supply cuts among all members with only a selected few detailing their respective supply reductions.
Also, these agreed supply cuts for 2024 are voluntary which means members may defy the committed output quotas, and Angola has “revolted” against its new supply target and stated it will continue pumping as usual, increasing the risk of other OPEC+ members may not follow through on the latest set of agreed commitments.
In the lens of technical analysis, there are still several positive elements intact to potentially stall the ongoing bearish onslaught in oil prices.
Weekly price actions have formed “long-legged Doji” candlesticks
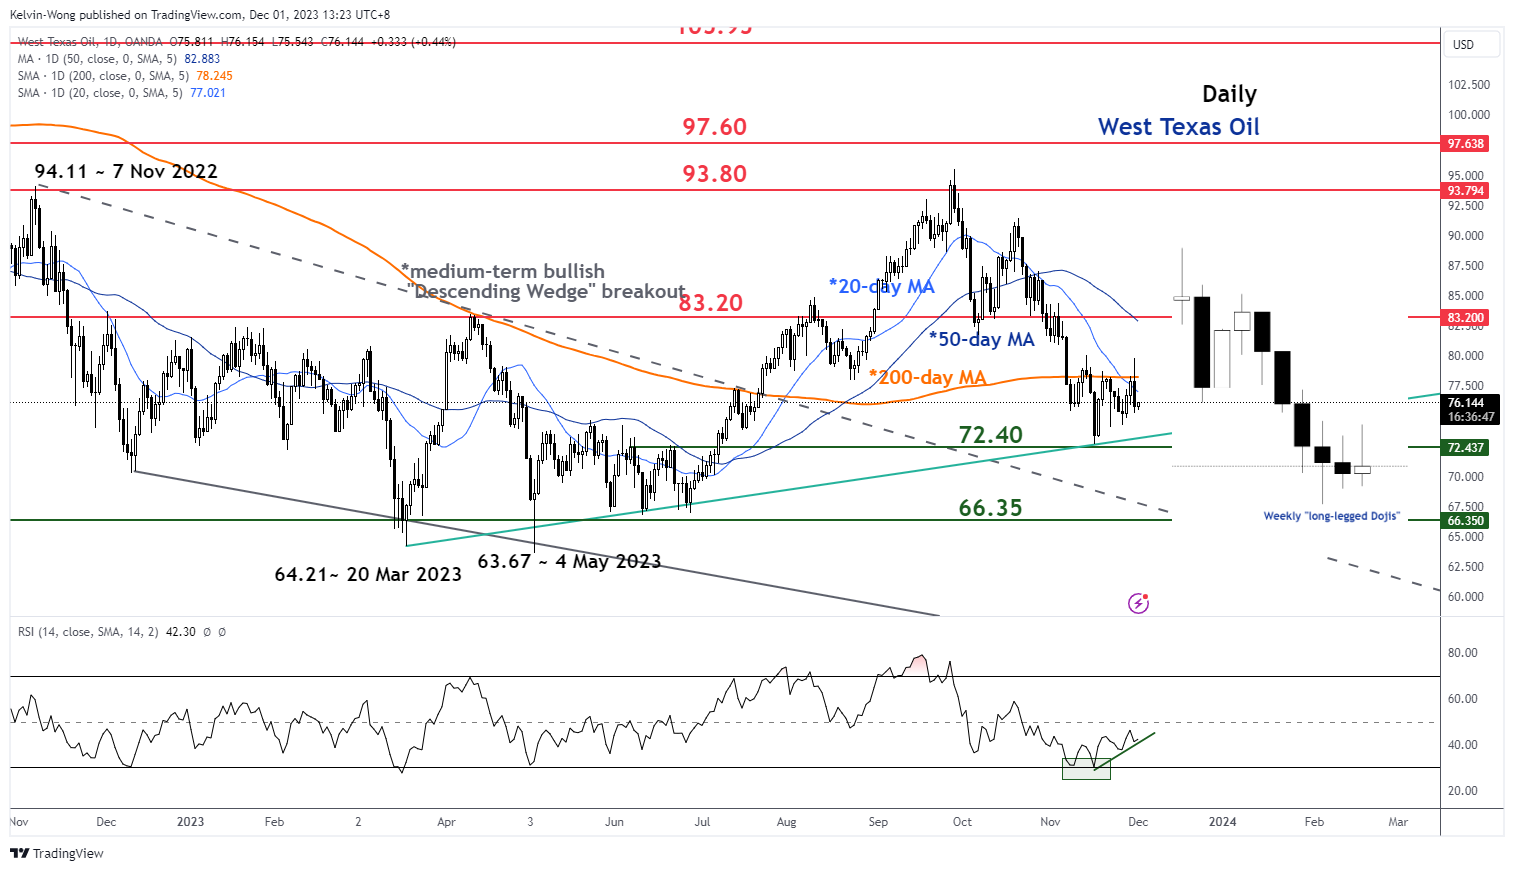
Fig 1: West Texas Oil medium-term trend as of 1 Dec 2023 (Source: TradingView, click to enlarge chart)
In the prior two weeks, the price actions of West Texas Oil have formed two weekly consecutive “long-legged Doji” candlestick patterns that suggest the current bearish sentiment has started to exhibit a form of “hesitation and indecisiveness” to potentially push prices lower.
In addition, the daily RSI momentum indicator has continued to inch higher since 16 November 2023 after it drifted down to its oversold zone.
These observations have taken shape right above a key medium-term support of US$72.40 (also the ascending trendline from the 20 March 2023 low) which suggests that the downside momentum of the two-month corrective decline of -23% from its 28 September 2023 high of US$95.50/barrel to 16 November 2023 low of US$72.68/barrel has started to abate.
Impending minor bullish reversal “Inverse Head & Shoulders” sighted
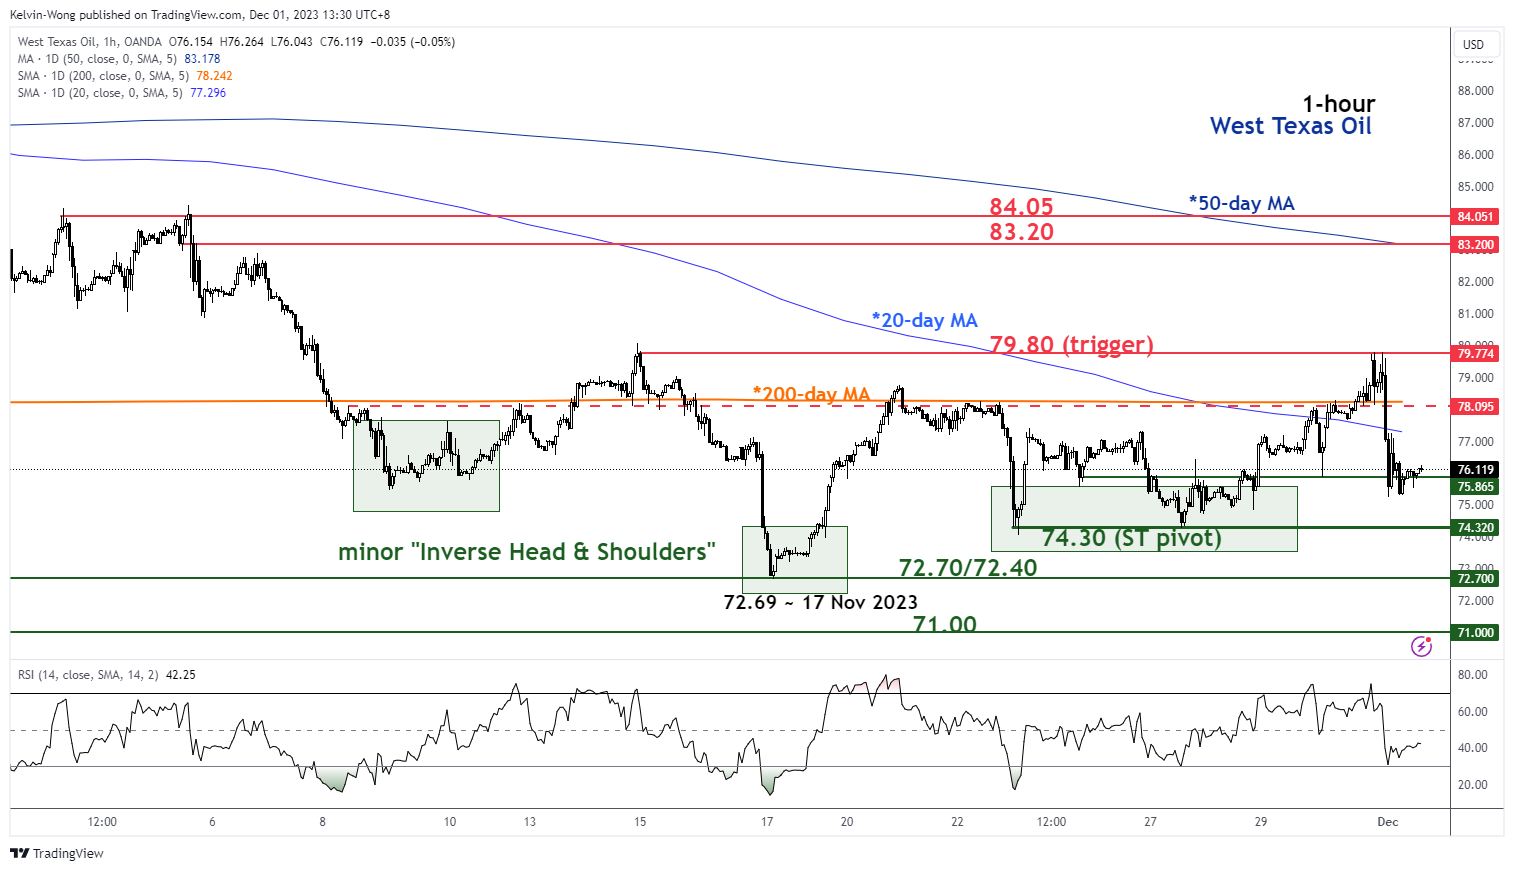
Fig 2: West Texas Oil minor short-term trend as of 1 Dec 2023 (Source: TradingView, click to enlarge chart)
On its shorter-term hourly chart, the price actions of West Texas Oil have traced out a potential minor “Inverse Head & Shoulders” bullish reversal configuration.
Watch the key short-term pivotal support at US$74.30 and a clearance above US$79.80 (neckline resistance of the “Inverse Head & Shoulders” may trigger a bullish breakout to see the next intermediate resistance coming at US$83.20/84.05 (also the downward sloping 50-day moving average).
However, failure to hold at US$74.30 exposes the medium-term support of US$72.70/72.40.
Are Equity Bulls Too Tired to Continue Running?
Here we are, saying thanks and goodbye to the excellent month of November for both bond and equity markets. US bonds rallied, and the bond yields melted starting from the end of October remember, and the melting bond yields offered to the S&P500 one of its biggest gains for a month of November. The index rallied more than 9% in November, is up by more than 10% since the end of October and Nasdaq 100 gained nearly 12% last month and is up by 15% since its October dip. Note that yields are one – and an important - part of the valuation story because when the return for low-risk assets decline, the valuations of riskier assets automatically move up. But there is also a fundamental leg to the US equity story.
Hot off the press from the US Bureau of Economic Analysis pointed at a 3.3% growth in total corporate profits during Q3, reaching an annualized rate of almost $3.3 trillion. This figure falls just short of the previous all-time peak of $3.3 trillion recorded in Q3 of 2022. And the significance lies in the fact that this profit increase demonstrates the adaptability of US companies to the post-COVID operating landscape of elevated wages and increased borrowing costs.
The debate now is, will such a strong month of November spoil our Santa rally, or the US stock markets will continue to extend gains in December? Looking at the aggregate company fundamentals, there is no reason for the rally to stop suddenly, unless shocker data pops up – like very bad jobs data or a very sharp decline in growth numbers to below-average levels. And even then, a part of the bad data would be tamed by soft Federal Reserve (Fed) expectations, right? And my past 10-year experience in the stock markets reminds me that valuations are never too high. Of course, over the past decade, the market was constantly navigating in the zero-rate regime and that’s changed since last year but it still feels like you are never thin enough, you are never rich enough, and the equities are never valued enough.
But looking at the technical indicators, US equities are now in overbought territory; they have been purchased too fast and in too short period of time and that a minor correction would be healthy in the next few sessions. But the latter doesn’t rule out a further rally when the overheated technical indicators cool down. A Santa rally is still on cards, if the Fed members continue not to mention to rapid fall in US yields to justify a more hawkish policy stance.
Good news is, inflation falls. Yesterday’s PCE data confirmed that the US PCE index fell from 3.4% to 3.0% in October, and core inflation eased from 3.7% to 3.5% - as expected. The fact that the data came in line with expectations gained little traction among bond buyers, as such we saw the US 2-year yield rebound past its 200-DMA and consolidate there this morning.
Better news is: inflation in Europe came in softer than expectations. Inflation in Eurozone fell to 2.4% in November from 2.9% printed a month earlier. It was also much better than a fall to 2.7% expected by analysts! Core inflation also eased more than expected to 3.6%. The EURUSD fell below 1.09 and losses could extend to 1.08/1.8020 region including the 200-DMA and the major 38.2% retracement on the October-November rebound.
Now, inflation can be a bit tricky and tends to make unexpected comebacks. Europe isn't completely out of the woods yet, as the jobs market remains robust, and the European Central Bank (ECB) remains cautious. However, one of the major drivers of inflation in Europe, the Russian gas nightmare, is gently over as the region has taken massive steps to prepare for this winter season: it reduced its dependence to Russian gas to only 12%. That’s a big drop from the 40% before the Ukraine war.
Moreover, OPEC seemed kind of overwhelmed with events this week, as the group announced an additional 1mbpd cut that will be shouldered by cartel members, on top of the 1mbpd cut that Saudi will extend to next year. But the latter was nowhere near appetizing to get the oil bulls running. The barrel of crude fell to $75pb and should continue finding sellers into the 200-DMA, near $78pb.