Sample Category Title
Are Equity Bulls Too Tired to Continue Running?
Here we are, saying thanks and goodbye to the excellent month of November for both bond and equity markets. US bonds rallied, and the bond yields melted starting from the end of October remember, and the melting bond yields offered to the S&P500 one of its biggest gains for a month of November. The index rallied more than 9% in November, is up by more than 10% since the end of October and Nasdaq 100 gained nearly 12% last month and is up by 15% since its October dip. Note that yields are one – and an important - part of the valuation story because when the return for low-risk assets decline, the valuations of riskier assets automatically move up. But there is also a fundamental leg to the US equity story.
Hot off the press from the US Bureau of Economic Analysis pointed at a 3.3% growth in total corporate profits during Q3, reaching an annualized rate of almost $3.3 trillion. This figure falls just short of the previous all-time peak of $3.3 trillion recorded in Q3 of 2022. And the significance lies in the fact that this profit increase demonstrates the adaptability of US companies to the post-COVID operating landscape of elevated wages and increased borrowing costs.
The debate now is, will such a strong month of November spoil our Santa rally, or the US stock markets will continue to extend gains in December? Looking at the aggregate company fundamentals, there is no reason for the rally to stop suddenly, unless shocker data pops up – like very bad jobs data or a very sharp decline in growth numbers to below-average levels. And even then, a part of the bad data would be tamed by soft Federal Reserve (Fed) expectations, right? And my past 10-year experience in the stock markets reminds me that valuations are never too high. Of course, over the past decade, the market was constantly navigating in the zero-rate regime and that’s changed since last year but it still feels like you are never thin enough, you are never rich enough, and the equities are never valued enough.
But looking at the technical indicators, US equities are now in overbought territory; they have been purchased too fast and in too short period of time and that a minor correction would be healthy in the next few sessions. But the latter doesn’t rule out a further rally when the overheated technical indicators cool down. A Santa rally is still on cards, if the Fed members continue not to mention to rapid fall in US yields to justify a more hawkish policy stance.
Good news is, inflation falls. Yesterday’s PCE data confirmed that the US PCE index fell from 3.4% to 3.0% in October, and core inflation eased from 3.7% to 3.5% - as expected. The fact that the data came in line with expectations gained little traction among bond buyers, as such we saw the US 2-year yield rebound past its 200-DMA and consolidate there this morning.
Better news is: inflation in Europe came in softer than expectations. Inflation in Eurozone fell to 2.4% in November from 2.9% printed a month earlier. It was also much better than a fall to 2.7% expected by analysts! Core inflation also eased more than expected to 3.6%. The EURUSD fell below 1.09 and losses could extend to 1.08/1.8020 region including the 200-DMA and the major 38.2% retracement on the October-November rebound.
Now, inflation can be a bit tricky and tends to make unexpected comebacks. Europe isn't completely out of the woods yet, as the jobs market remains robust, and the European Central Bank (ECB) remains cautious. However, one of the major drivers of inflation in Europe, the Russian gas nightmare, is gently over as the region has taken massive steps to prepare for this winter season: it reduced its dependence to Russian gas to only 12%. That’s a big drop from the 40% before the Ukraine war.
Moreover, OPEC seemed kind of overwhelmed with events this week, as the group announced an additional 1mbpd cut that will be shouldered by cartel members, on top of the 1mbpd cut that Saudi will extend to next year. But the latter was nowhere near appetizing to get the oil bulls running. The barrel of crude fell to $75pb and should continue finding sellers into the 200-DMA, near $78pb.
Disinflation Continues in Euro Area
Market movers today
The most important data release of the day will the November ISM Manufacturing index from the US. Consensus expects a modest rebound, as several other leading indicators for global manufacturing have shown signs of bottoming out lately, even if the US Flash PMI still ticked lower in November.
Manufacturing PMIs are due for release also for Sweden and Norway.
The Fed chair Powell will participate in a fireside chat at 17CET. The FOMC's blackout period begins tomorrow, so this will be a key opportunity to provide markets some final remarks ahead of the December meeting. We still think that the Fed is already done with hikes and will begin its cutting cycle in March.
The 60 second overview
Euro Area: The Euro area HICP inflation declined more as expected as also hinted by early country releases. The monthly decline of euro area HICP by 0.5 % m/m versus consensus of -0.2% m/m translated into a yearly growth rate of just 2.4% y/y, even below the market pricing of 2.5%. Core inflation ticked down to 3.6% y/y (cons: 3.9%, prior: 4.2%). Overall, the slowdown in inflation was broad-based and the momentum is slow which is important for the ECB. The previous base effects that have driven inflation down will fade now and therefore the low monthly price momentum is what will bring inflation to the target. Hence, this print is clearly positive for the ECB with ECB done on rate hikes, but the easy financial conditions opens for a discussion to ending full PEPP reinvestments at the upcoming December meeting, as Lagarde also hinted at earlier this week.
US: In the US the October PCE inflation was slightly below expectations (+0.0% m/m). The Fed's preferred Core Services PCE inflation continues to slow down in both m/m (+0.21%) and y/y (+4.6%) terms. We didn't find this to be major news for the markets here, albeit it is yet another signals that the Fed continues to make progress towards cooling underlying inflation.
Oil: OPEC disappointed the oil market yesterday with its decision to keep status quo and about roll over current output levels to next year. Amid deteriorating global demand, the decision not to tighten supply further was underwhelming. However, we were not surprised. We have downplayed the importance of OPEC which turned out right. Going forward, we expect the oil market to be in the hands of global growth and the dollar and look for Brent to average USD80-85/bbl.
China: Overnight, the Chinese Caixin manufacturing PMI unexpectedly rose to 50.7 from a below 50 reading last month.
Equities: Equities were higher again yesterday. This was interesting as a new relationship came back into place: Equities went up together with yields. Reason being right data being strong (manufacturing) and the "right" areas weakening (jobless claims, inflation). Value cyclicals fared well, such as industrials or banks. Thereby huge dispersion between value indices like Dow jones up 1.5% vs Nasdaq down -0.2%, as investors found financing in big tech. S&P 500 0.4% and Stoxx 600 0.6%. US are unchanged this morning.
FI: European rates were volatile yesterday where initially a rally was observed across the maturities on the back of the low French, Dutch and European inflation data. However, what seemed like a buy the rumour, sell the fact reaction on the European inflation release the markets gradually sold off through the rest of the day amid US data release which was broadly in line with expectations during the afternoon (PCE core, jobless claims). Markets took 3bp out of the rate cut pricing for 2024, and now price ECB to cut 110bp through the end of 2024. The first full 25bp cut is priced for April 2024. The decline in yields in both the US and the EA has been driven by the front end, where both jurisdictions have added a full 25bp rate cut this week to its policy expectations for next year. We do not find data compelling enough, particularly on the euro side to validate this move, and hence we look to fade this rally.
FX: EUR/USD declined below the 1.09 mark on a day where the USD broadly strengthened across the G10, despite risk assets ending a strong November with another day in the green. USD/JPY is trading just above 148 - even though the cross trended up in yesterday's session, it seems that the JPY has increasingly been reacting to the notion of a peak in global yields recently. EUR/GBP declined to the lower end of the 0.86-0.87 range. The Scandies had a bad day, with both the SEK and NOK selling off. EUR/SEK rose to around 11.40, while EUR/NOK rose above 11.75.
Credit: Credit indices drifted wider yesterday where iTraxx Xover widened 6.5bp to 373.5bp and Main widened 1.2bp to 683bp. The slight cautious tone was also visible in the primary market where the activity was subdued.
EUR/USD Daily Outlook
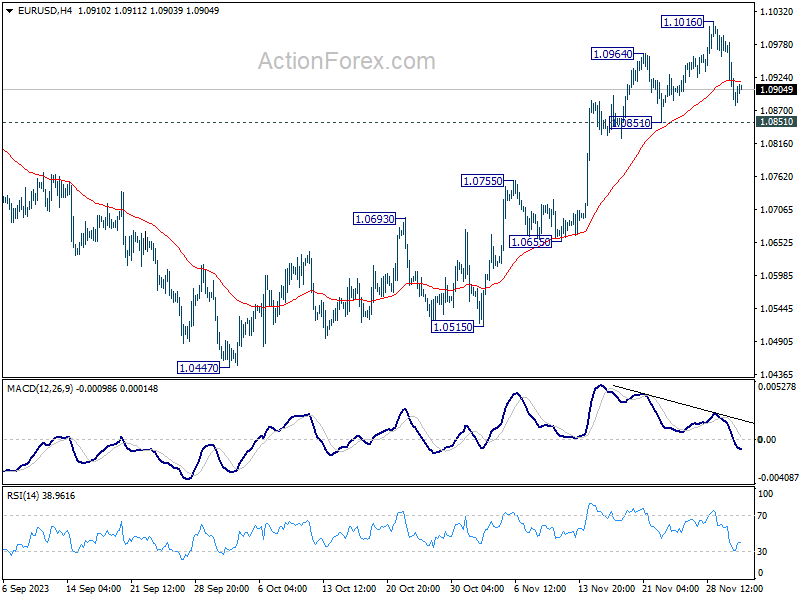
Daily Pivots: (S1) 1.0851; (P) 1.0917; (R1) 1.0956; More...
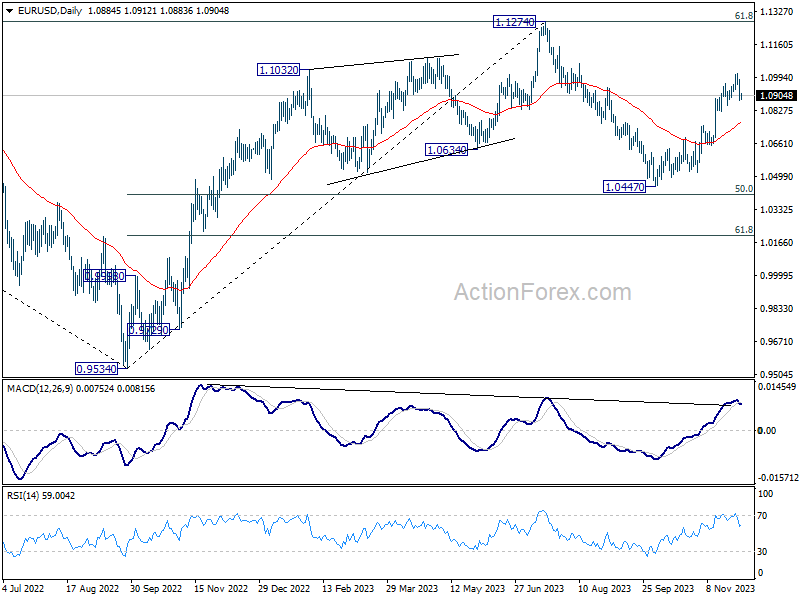
Intraday bias in EUR/USD remains neutral as consolidation from 1.1016 is extending. As long as 1.0851 support holds, further rally is still expected. On the upside, firm break of 1.1016 will resume the rise from 1.0447 to 1.1274 resistance next. But strong resistance should be seen there to limit upside. However, sustained break of 1.0851 will confirm short term topping, and turn bias back to the downside for deeper fall.
In the bigger picture, price actions from 1.1274 are viewed as a corrective pattern to rise from 0.9534 (2022 low). Rise from 1.0447 is tentatively seen as the second leg. Hence while further rally could be seen, upside should be limited by 1.1274 to bring the third leg of the pattern.
USD/JPY Daily Outlook
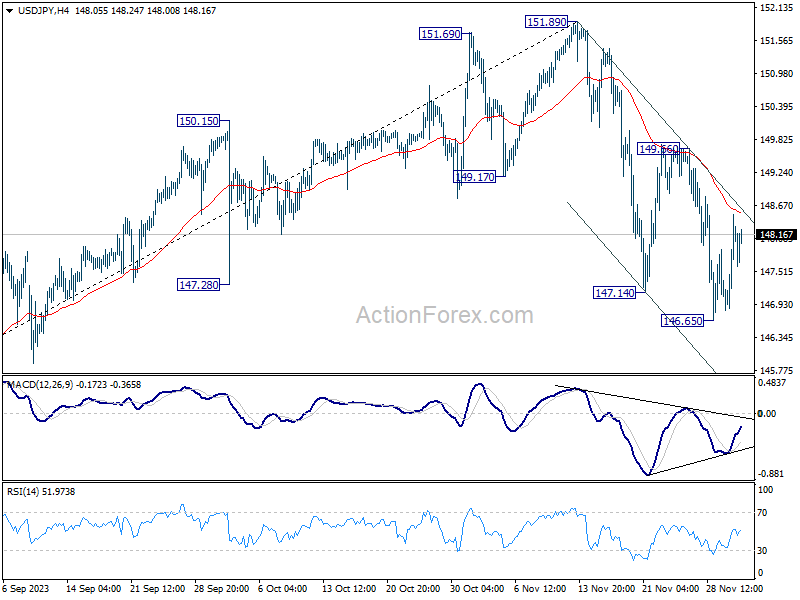
Daily Pivots: (S1) 147.21; (P) 147.86; (R1) 148.88; More...
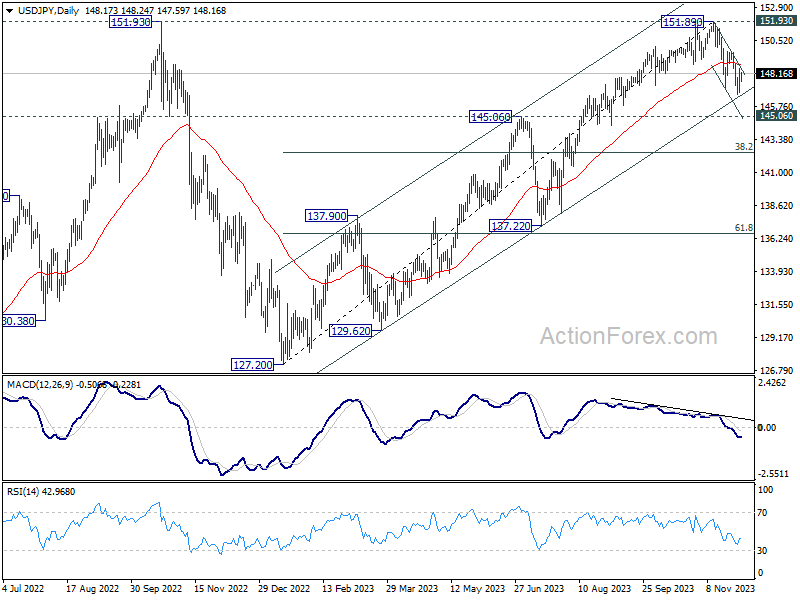
Intraday bias in USD/JPY remains neutral for the moment. On the upside, sustained break of 55 4H EMA (now at 148.54) will argue that corrective fall from 151.89 has completed with three waves down to 146.65. Intraday bias would be back on the upside for 149.66 resistance for confirmation. Nevertheless, rejection by 55 4H EMA will resume the fall from 151.89 towards 145.06 key support level.
In the bigger picture, rise from 127.20 (2023 low) is seen as the second leg of the pattern from 151.93 (2022 high). Decisive break of 145.06 resistance turned support will confirm that this second leg has completed, after rejection by 151.93. Deeper fall would be seen through 38.2% retracement of 127.20 to 151.89 at 142.45 to 61.8% retracement at 136.63. Nevertheless strong bounce from 145.06 will retain medium term bullishness for another test on 151.93 at a later stage.
GBP/USD Daily Outlook
Daily Pivots: (S1) 1.2582; (P) 1.2646; (R1) 1.2689; More...
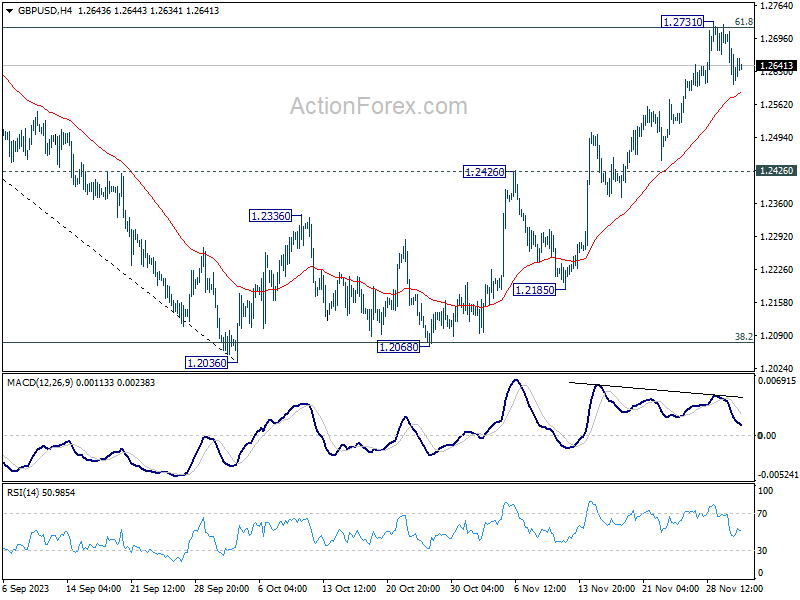
GBP/USD is staying in consolidation from 1.2731 and intraday bias remains neutral at this point. For now, further rally is in favor as long as 1.2426 resistance turned support holds. On the upside, sustained trading above 61.8% retracement of 1.3141 to 1.2036 at 1.2716 will pave the way to retest 1.3141 high.
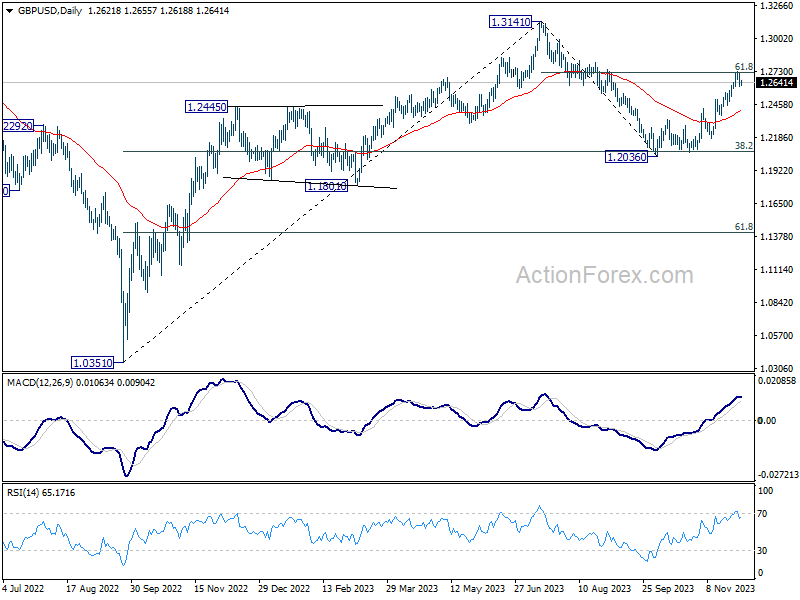
In the bigger picture, price actions from 1.3141 are seen as a corrective pattern to rise from 1.0351 (2022 low). Strong rebound from 38.2% retracement of 1.0351 (2022 low) to 1.3141 at 1.2075 suggests that current rise from 1.2036 is already the second leg. However, while further rally could be seen, upside should be limited by 1.3141 to bring the third leg of the pattern.
USD/CHF Daily Outlook
Daily Pivots: (S1) 0.8701; (P) 0.8736; (R1) 0.8787; More....
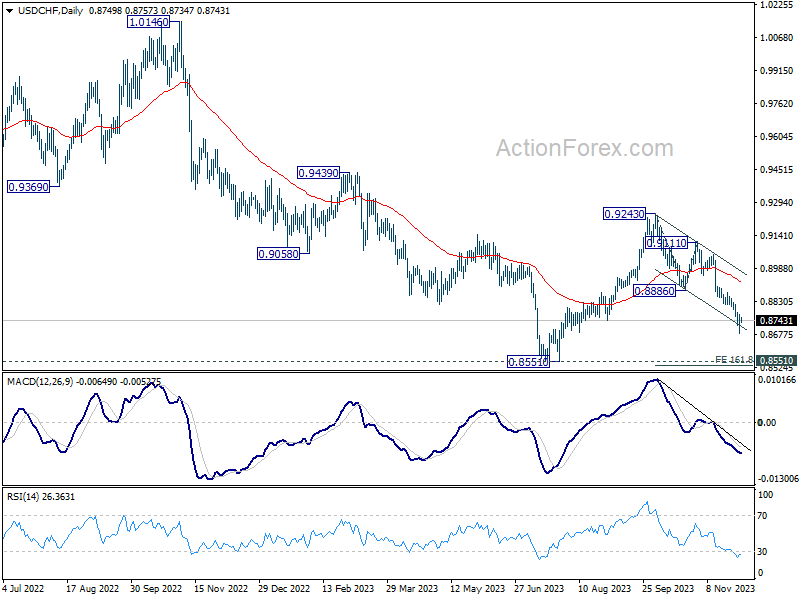
Intraday bias in USD/CHF remains neutral for the moment, and some more consolidations could be seen above 0.8716. Risk will stay on the downside as long as 0.8886 support turned resistance holds. On the downside, break of 0.8716 temporary low will resume the fall from 0.9243 to 161.8% projection of 0.9243 to 0.8886 from 0.9111 at 0.8533, which is close to 0.8551 low.
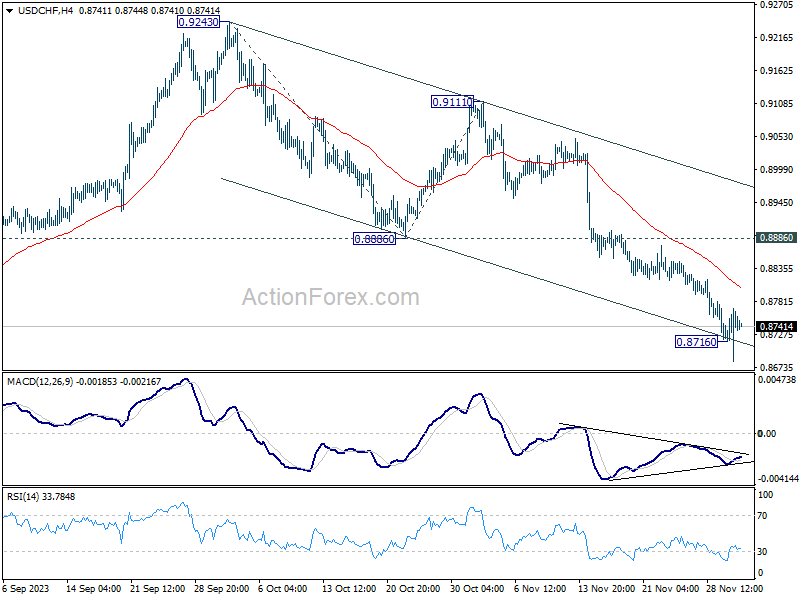
In the bigger picture, price actions from 0.8551 are currently seen as part of a corrective pattern to the decline from 1.0146 (2022 high). Fall from 0.9243 is seen as the second leg for now. Deeper decline could be seen to 0.8551 low but strong support should be seen there to bring rebound. For now, this will remain the favored case as long as 0.8886 resistance holds.
AUD/USD Daily Report
Daily Pivots: (S1) 0.6567; (P) 0.6609; (R1) 0.6647; More...
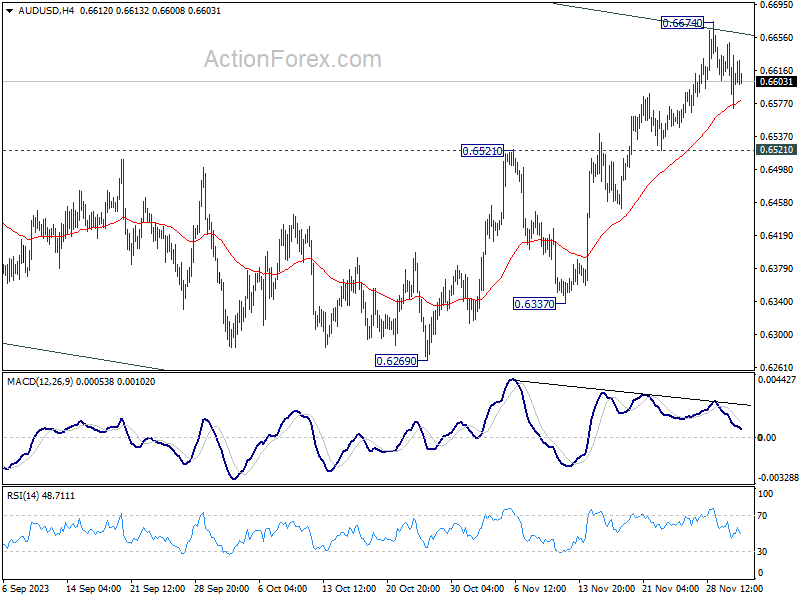
Intraday bias in AUD/USD remains neutral for the moment. Some more consolidations could be seen below 0.6674 first. But further rally is expected as long as 0.6521 resistance turned support holds. On the upside, sustained break break of channel resistance (now at 0.6661) will argue that whole decline from 0.7156 has completed with three waves down to 0.6269. Further rally should then be seen to 0.6894 resistance for confirmation.
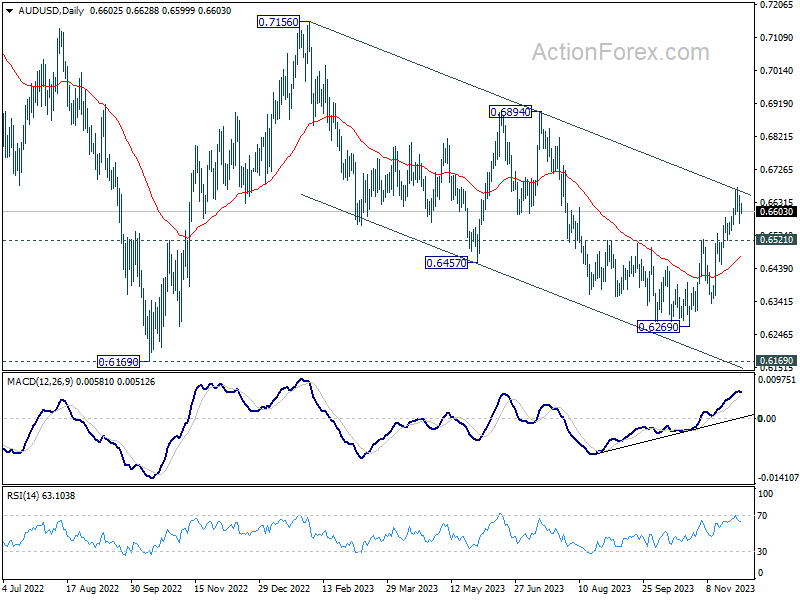
In the bigger picture, there is no confirmation that down trend from 0.8006 (2021 high) has completed. price actions from 0.6169 (2022 low) could be just a medium term corrective pattern, with rise from 0.6269 as the third leg. For now, range trading should be seen between 0.6169 and 0.7156 (2023 high), until further developments.
USD/CAD Daily Outlook
Daily Pivots: (S1) 1.3532; (P) 1.3579; (R1) 1.3606; More...
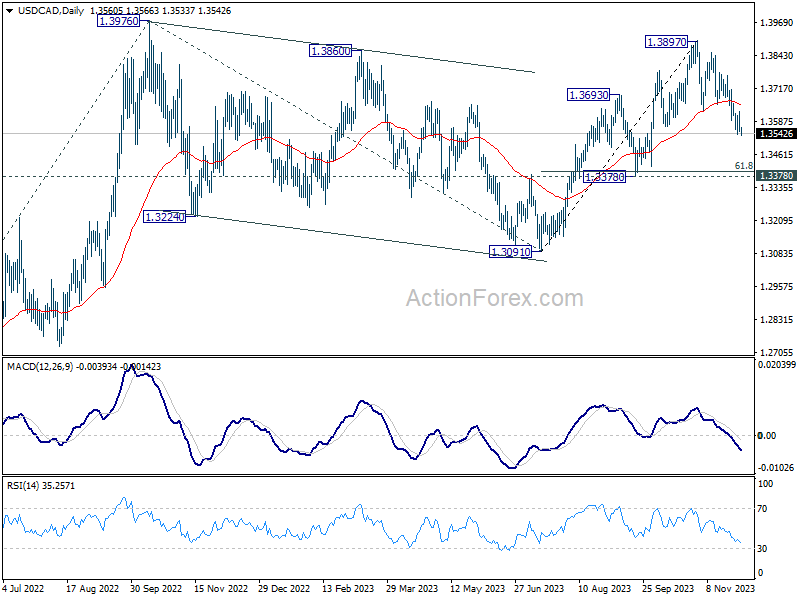
USD/CAD's fall from 1.3897 resumed after brief recovery. Intraday bias is back on the downside. Further fall should be seen to 1.3378 support next. On the upsi8de, though, above 1.3625 minor resistance will turn intraday bias neutral again first.
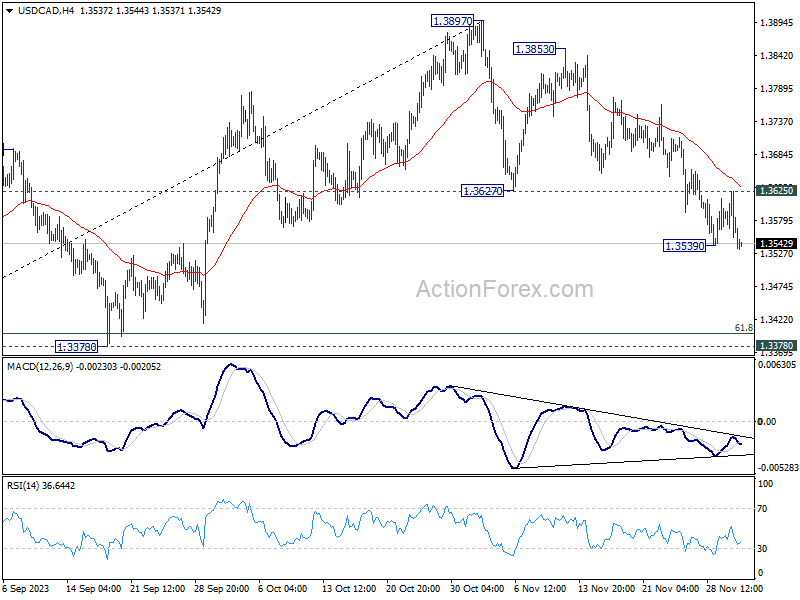
In the bigger picture, corrective pattern from 1.3976 (2022 high) should have completed with three waves down to 1.3091. Decisive break of 1.3976 high will confirm resumption of up trend from 1.2005 (2021 low). Next target is 61.8% projection of 1.2401 to 1.3976 from 1.3091 at 1.4064. This will remain the favored case as long as 1.3378 support holds.
EUR/CHF Daily Outlook
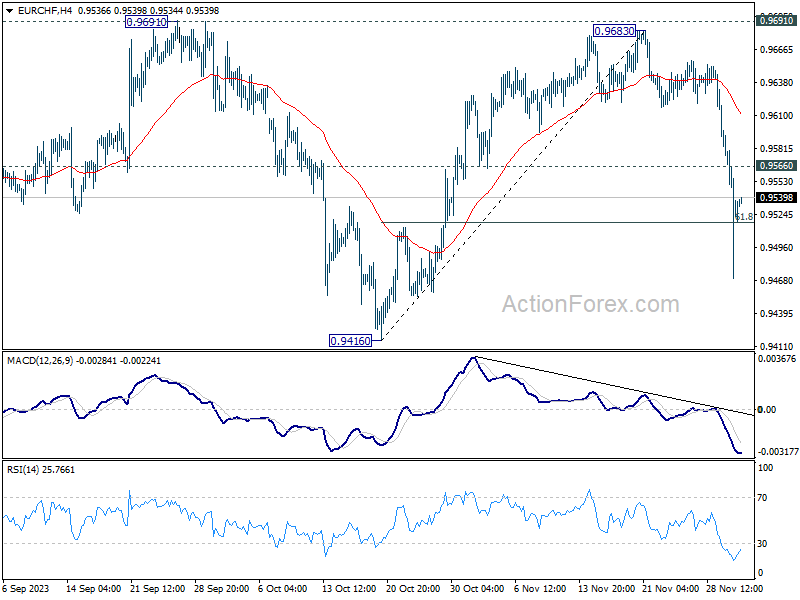
Daily Pivots: (S1) 0.9470; (P) 0.9533; (R1) 0.9593; More...
Intraday bias in EUR/CHF stays on the downside at this point. Sustained break of 61.8% retracement level of 0.9416 to 0.9683 at 0.9518 will pave the way to retest 0.9416 low. On the upside, above 0.9566 minor resistance will turn intraday bias neutral first.
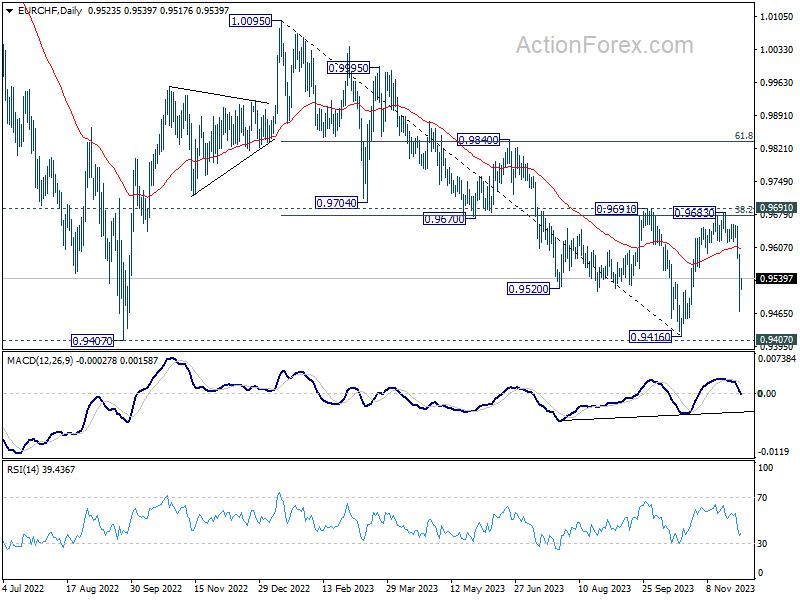
In the bigger picture, rejection by 0.9691 cluster resistance (38.2% retracement of 1.0095 to 0.9416 at 0.9675) maintains medium term bearishness in EUR/CHF. That is, down trend from (1.0095) might not be over yet. Deeper decline would be seen back to 0.9407.16 key support zone. Firm break there will resume long term down trend. For now, outlook will be neutral at best as long as 0.9691 holds.
GBP/JPY Daily Outlook
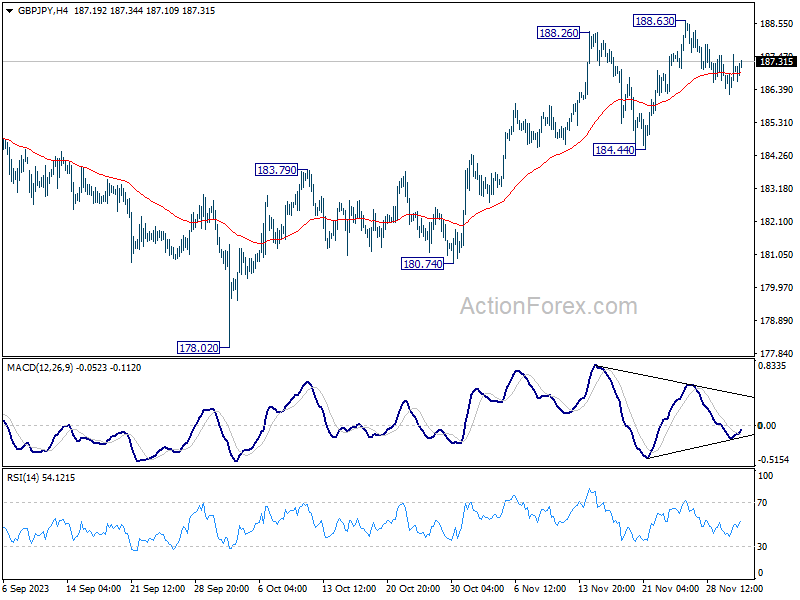
Daily Pivots: (S1) 186.36; (P) 186.97; (R1) 187.70; More...
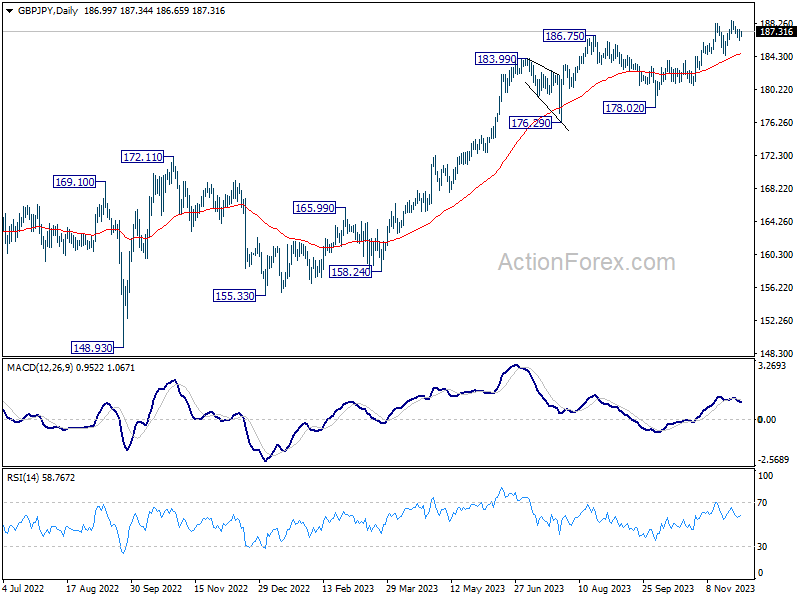
GBP/JPY is staying in consolidation below 188.63 and intraday bias remains neutral for the moment. While deeper retreat cannot be ruled out, near term outlook will stay bullish as long as 184.44 support holds. On the upside, break of 188.63 will resume larger up trend.
In the bigger picture, as long as 184.44 support holds, larger up trend from 123.94 (202 low) should still be in progress, next target is 195.86 (2015 high). However, firm break of 184.44 will now argue that a medium term top is formed, possibly in bearish divergence condition in D MACD, and bring deeper fall back to 178.02 support.