Sample Category Title
USD/CAD Mid-Day Outlook
Daily Pivots: (S1) 1.3532; (P) 1.3579; (R1) 1.3606; More...
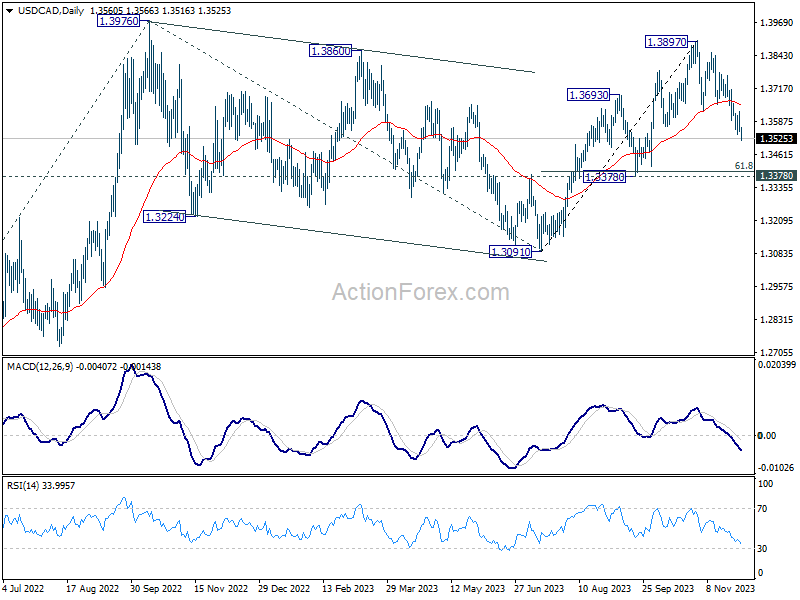
Intraday bias in USD/CAD remains on the downside at this point. Current fall from 1.3897 is in progress, and should target 1.3378 support next. On the upside, though, above 1.3625 minor resistance will turn intraday bias neutral again first.
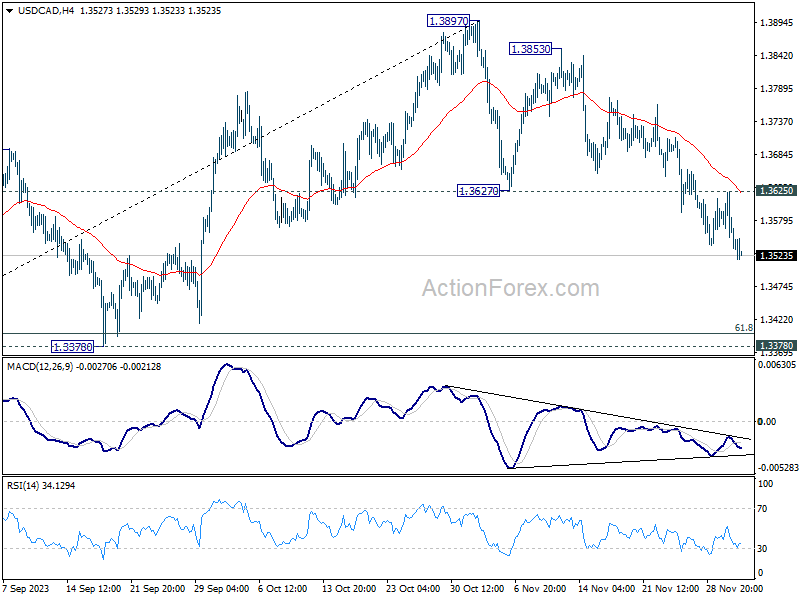
In the bigger picture, corrective pattern from 1.3976 (2022 high) should have completed with three waves down to 1.3091. Decisive break of 1.3976 high will confirm resumption of up trend from 1.2005 (2021 low). Next target is 61.8% projection of 1.2401 to 1.3976 from 1.3091 at 1.4064. This will remain the favored case as long as 1.3378 support holds.
Canadian Dollar Rises on Jobs Data, Dollar Soft, Euro Worse
Canadian Dollar is firming slightly up in early US session, bolstered by stronger-than-expected Canadian job growth data. Despite the weakness in oil prices following disappointment over OPEC's production cut decisions, Loonie is displaying resilience. However, in the weekly performance chart, while Canadian Dollar is outshining Australian Dollar, it still lags behind the New Zealand Dollar (Kiwi).
In contrast, Euro is on track to be the week's weakest performer, with fresh selling pressure emerging. There is a potential for extending the selloff in the near term, particularly as EUR/GBP and EUR/AUD break through key near-term support levels. A critical point of focus in the currency markets is whether EUR/USD will manage to defend 1.0851 support level.
Turning to Dollar, it remains the second worst performer of the week. The market is anticipating Fed Chair Jerome Powell's final speech before Fed's blackout period. But it is unlikely that he will deliver any significant new information. From this point forward, the Dollar's trajectory is expected to be heavily data-dependent, leading up to FOMC rate decision on December 23. Key data releases that will likely influence Dollar's movement include today's ISM manufacturing data, next week's ISM services and non-farm payroll reports, and CPI data in the following week.
In Europe, at the time of writing, FTSE is up 0.64%. DAX is up 0.71%. CAC is up 0.25%. Germany 10-year yield is down -0.0115 at 2.437. Earlier in Asia, Nikkei fell -0.17%. Hong Kong HSI fell -1.25%. China Shanghai SSE rose 0.06%. Singapore Strait Times rose 0.56%. Japan 10-year JGB yield rose 0.0256 to 0.700.
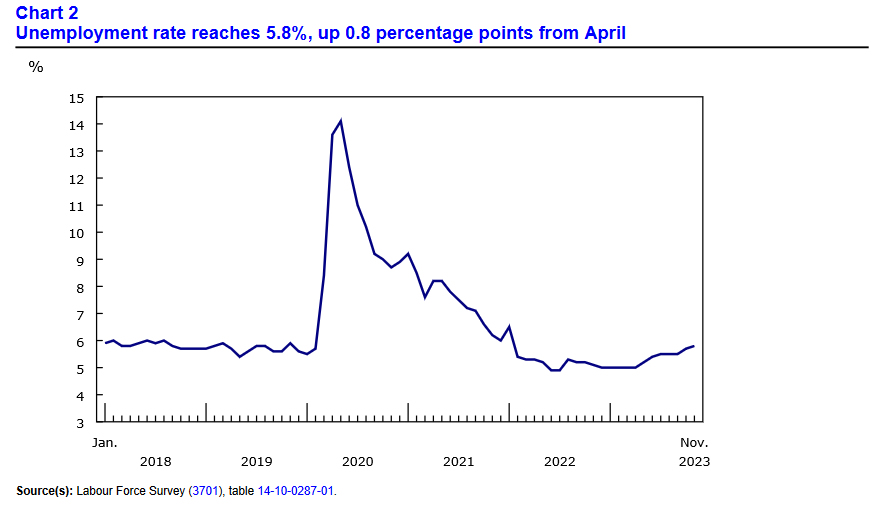
Canada's employment rises 24.9k in Nov, unemployment rate ticks up to 5.8%
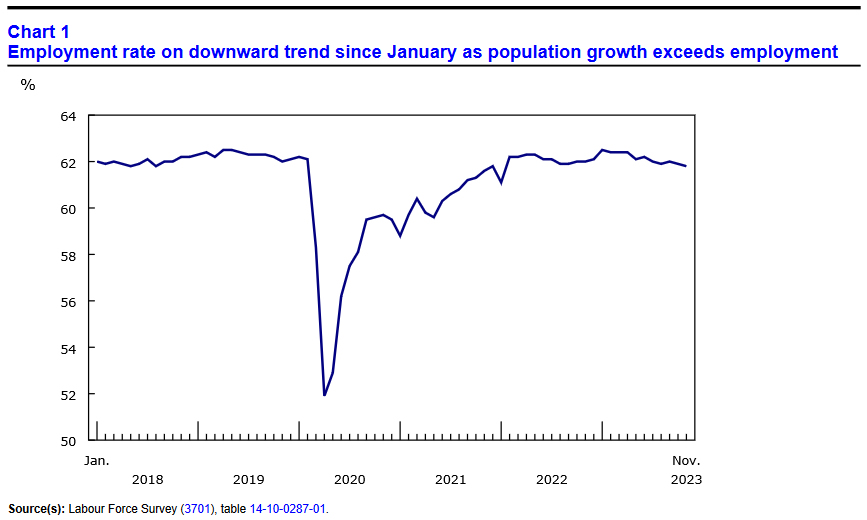
Canada's employment grew 24.9k in November, better than expectation of 14.2k.
Unemployment rate rose from 5.7% to 5.8%, matched expectations, and continuing an upward trend observed since April.
Total hours worked fell -0.7% mom and were up 1.3% on a year-over-year basis.
On a year-over-year basis, average hourly wages rose 4.8%, similar to the increase recorded in October.
UK PMI manufacturing finalized at 47.2, recovery remains elusive
UK PMI Manufacturing was finalized at 47.2 in November, up notably from October's 44.8. This marks the third consecutive month of rising PMI figures and the highest level since May.
Despite these gains, it is important to note that the PMI has remained below the neutral 50 mark for 16 consecutive months, indicating a prolonged period of contraction in the manufacturing sector.
Rob Dobson, Director at S&P Global Market Intelligence, commented, "Although the downturn in production eased sharply in November, the latest PMI report brings little festive cheer when the finer details are considered."
Dobson pointed out that despite improvement in production, the sector faces ongoing challenges. These include sharp declines in new order inflows and exports, along with clients destocking, which collectively suggest that a robust and sustained revival in meaningful growth is not yet on the horizon.
Dobson also noted, "Manufacturers are preparing for tough times ahead, with their continued caution leading to cutbacks in staffing, inventories, and purchasing."
Eurozone PMI manufacturing finalized at 44.2, continuing contraction, but slower
Eurozone's PMI Manufacturing was finalized at 44.2 in November, up from October's 43.1, reaching a six-month high. The report highlights reduction in the rate of decline for new orders, stocks, and purchasing activity, yet underscores a concerning trend of increasing employment cuts.
Breaking down the performance across Eurozone member states, Greece emerged as the only country in expansion, with PMI of 50.9. Ireland remained stable at 50.0. In contrast, other major economies like Spain (46.3), the Netherlands (44.9), Italy (44.4), France (42.9), Germany (42.6), and Austria (42.2) all registered figures indicative of ongoing contraction in their manufacturing sectors.
Cyrus de la Rubia, Chief Economist at Hamburg Commercial Bank, said, "November has not been the prettiest." He noted the continuous decline in output and the trend of workforce reductions extending for six months. While acknowledging slight improvements in various sub-indices, de la Rubia pointed out that these are insufficient to signal a robust upward trend, describing them as "timid" and lacking the necessary dynamism.
De la Rubia also highlighted the divergent conditions within the top four Eurozone economies, with Germany uniquely showing a softening in output decline. In contrast, the situation appears to be worsening in other major economies.
He emphasized, "A crucial barometer for the recovery's onset will likely be a more synchronized upward movement in the economies PMI indexes, leading to a self-reinforcing reciprocal push among countries."
Swiss GDP rises 0.3% qoq in Q3, services provides support
Swiss GDP grew 0.3% qoq in Q3, above expectation of 0.1% qoq. SECO said: "The international environment remains challenging, with value added in industry stagnating accordingly. However, the service sector was once again able to provide a support."
China's Caixin PMI manufacturing rises to 50.7, back to growth amidst challenges
China's Caixin PMI Manufacturing index climbed from 49.5 to 50.7 in November, surpassing the expected 49.3. According to Caixin's release, this improvement is attributed to sustained rise in total new work, which helped push production back into growth territory. Additionally, there was softer reduction in employment and uptick in business confidence, reaching a four-month high.
Wang Zhe, Senior Economist at Caixin Insight Group, noted, "Overall, the manufacturing sector improved in November." He cited several factors contributing to this improvement: expansion in supply and demand, stable prices, improved logistics, increased purchasing quantities, and a more optimistic outlook among manufacturers. However, he also pointed out some ongoing challenges, such as sluggish external demand, weak employment, and cautious inventory management by manufacturers.
Wang also commented on the broader macroeconomic context, stating, "The macro economy has been recovering." He observed improvements in household consumption, industrial production, and market expectations. Despite these positive signs, he cautioned that both domestic and foreign demand remain insufficient, employment pressures are high, and the economic recovery is still searching for a solid footing.
Japan's PMI manufacturing finalized at 48.3, contraction continues yet optimistic
November saw Japan's Manufacturing PMI finalized at 48.3, a slight decline from October's 48.7. This figure, reported by S&P Global, indicates a continued contraction in the manufacturing sector, with more pronounced decreases in output and new order inflows. The PMI reaching its lowest since February signals a challenging phase for the sector, primarily due to weakened demand both domestically and internationally.
Usamah Bhatti of S&P Global Market Intelligence commented on the sector's performance, noting, "The headline PMI slipped deeper into contraction territory, largely due to quicker deteriorations in output and new order inflows." He identified weak customer demand across both domestic and international markets as key factors behind this downturn.
On the inflation front, although inflationary pressures remained high, there was a noticeable easing. Input cost inflation slowed down to a three-month low, and selling price inflation reduced to its softest since July 2021. This easing in inflation suggests some relief in cost pressures for manufacturers.
Despite the current contraction, Japanese manufacturers are holding onto a sense of optimism for the future. Bhatti emphasized this positive outlook, stating, "Manufacturers remained optimistic that muted demand and production conditions would lift over the coming year." This confidence is underpinned by expectations of a boost in demand, spurred by new product launches, particularly in the semiconductor sector.
RBNZ's Hawkesby highlights inflation pressure from record migration
RBNZ Deputy Governor Christian Hawkesby provided insights into the central bank's current monetary policy and the economic outlook in an interview today. He discussed timing of rate cuts, and impact of rising immigration.
RBNZ's revised forecast does not foresee rate cuts until mid-2025. Explaining the rationale behind the delayed rate cuts, Hawkesby emphasized the need for RBNZ to ensure that inflation expectations are securely re-anchored. He also pointed out that the New Zealand economy had experienced overheating and now requires a period of cooling, marked by a negative output gap.
The interview also highlighted the impact of recent demographic shifts on the The RBNZ had initially perceived rising immigration as a mitigating factor for inflation risk, considering its potential to alleviate labor shortages and reduce wage pressure. However, Hawkesby revealed that the immigration surge has been more significant than anticipated, now contributing to increased demand in the economy.
Hawkesby remarked, "Net migration has peaked at higher levels, so that's news in itself, important news." He further explained that the "demand-side impacts" of this trend are becoming more evident. He added, "The fact you have got to house a bigger population and the impact that that has, particularly on rental inflation and things like that."
New Zealand's population witnessed a substantial increase of 2.7% in the year through September, the largest in over three decades, with net annual immigration reaching a record high of 118,835.
USD/CAD Mid-Day Outlook
Daily Pivots: (S1) 1.3532; (P) 1.3579; (R1) 1.3606; More...
Intraday bias in USD/CAD remains on the downside at this point. Current fall from 1.3897 is in progress, and should target 1.3378 support next. On the upside, though, above 1.3625 minor resistance will turn intraday bias neutral again first.
In the bigger picture, corrective pattern from 1.3976 (2022 high) should have completed with three waves down to 1.3091. Decisive break of 1.3976 high will confirm resumption of up trend from 1.2005 (2021 low). Next target is 61.8% projection of 1.2401 to 1.3976 from 1.3091 at 1.4064. This will remain the favored case as long as 1.3378 support holds.
Economic Indicators Update
| GMT | Ccy | Events | Actual | Forecast | Previous | Revised |
|---|---|---|---|---|---|---|
| 23:30 | JPY | Unemployment Rate Oct | 2.50% | 2.60% | 2.60% | |
| 23:50 | JPY | Capital Spending Q3 | 3.40% | 3.40% | 4.50% | |
| 00:30 | JPY | Manufacturing PMI Nov F | 48.3 | 48.1 | 48.1 | |
| 01:45 | CNY | Caixin Manufacturing PMI Nov | 50.7 | 49.3 | 49.5 | |
| 08:00 | CHF | GDP Q/Q Q3 | 0.30% | 0.10% | 0.00% | -0.10% |
| 08:30 | CHF | Manufacturing PMI Nov | 42.1 | 42 | 40.6 | |
| 08:45 | EUR | Italy Manufacturing PMI Nov | 44.4 | 45.5 | 44.9 | |
| 08:50 | EUR | France Manufacturing PMI Nov F | 42.9 | 42.6 | 42.6 | |
| 08:55 | EUR | Germany Manufacturing PMI Nov F | 42.6 | 42.3 | 42.3 | |
| 09:00 | EUR | Manufacturing PMI Nov F | 44.2 | 43.8 | 43.8 | |
| 09:30 | GBP | Manufacturing PMI Nov F | 47.2 | 46.7 | 46.7 | |
| 13:30 | CAD | Net Change in Employment Nov | 24.9K | 14.2K | 17.5K | |
| 13:30 | CAD | Unemployment Rate Nov | 5.80% | 5.80% | 5.70% | |
| 14:30 | CAD | Manufacturing PMI Nov | 48.6 | |||
| 14:45 | USD | Manufacturing PMI Nov F | 49.4 | 49.4 | ||
| 15:00 | USD | ISM Manufacturing PMI Nov | 47.7 | 46.7 | ||
| 15:00 | USD | ISM Manufacturing Prices Paid Nov | 46.2 | 45.1 | ||
| 15:00 | USD | ISM Manufacturing Employment Index Nov | 46.8 | |||
| 15:00 | USD | Construction Spending M/M Oct | 0.40% | 0.40% |
Canada’s employment rises 24.9k in Nov, unemployment rate ticks up to 5.8%
Canada's employment grew 24.9k in November, better than expectation of 14.2k.
Unemployment rate rose from 5.7% to 5.8%, matched expectations, and continuing an upward trend observed since April.
Total hours worked fell -0.7% mom and were up 1.3% on a year-over-year basis.
On a year-over-year basis, average hourly wages rose 4.8%, similar to the increase recorded in October.
EURCAD Technical Analysis – Price Action Forecast and Important Levels to Watch
This article goes over different tools and indicators covering EURCAD, in some cases, cross-pairs can provide trade setups of a different nature as the US Dollar is partially taken out of the equation. Trading in financial markets requires an overview of different types of tools and the same applies to forex trading.
Talking points
- Inflation Rate Overview – European Union and Canada
- Daily Chart Technical analysis
- Sentiment Indicators: Commitment of Traders report, and OANDA’s order book.
- Relative Rotation Graph
Inflation Rate Overview – European Union and Canada
Source: Bloomberg Terminal
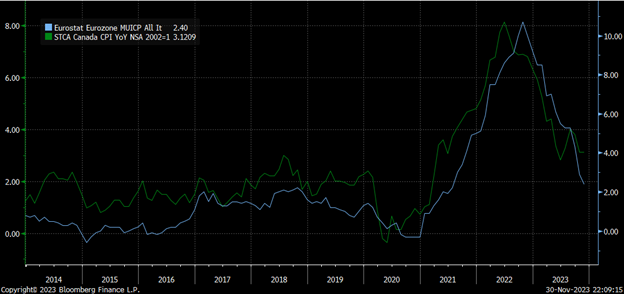
Inflation Rates globally are declining faster than expected and as global Central banks continue to tread carefully, traders continue to speculate on Central banks’ moves and are sometimes overwhelmed by conflicting central bankers’ comments or analyst’s opinions. Many Market participants are convinced that the recent decline in inflation suggests that Central banks should consider rate cuts, but Central banks still have concerns about inflation returning in any form.
The latest CPI report from the EU shows inflation continues to decline reaching 2.4%, close to The European Central Bank (ECB) target of 2%. The current CPI may suggest that the ECB can hold interest rates at its current level but doesn’t warrant any rate cuts. ECB Nagel commented this morning that “Inflation risks are skewed to the upside”. The next CPI release is scheduled for December 19th, 2023, please check the economic calendar and your local time. In Canada, it’s a slightly different story, although the inflation rate is also declining the same as it is globally, it is declining at a slower pace than the EU. The inflation rate currently stands at 3.1%, down from its highs of 8.0% seen in June 2022.
Daily Chart Technical analysis
Source: Tradingview.com
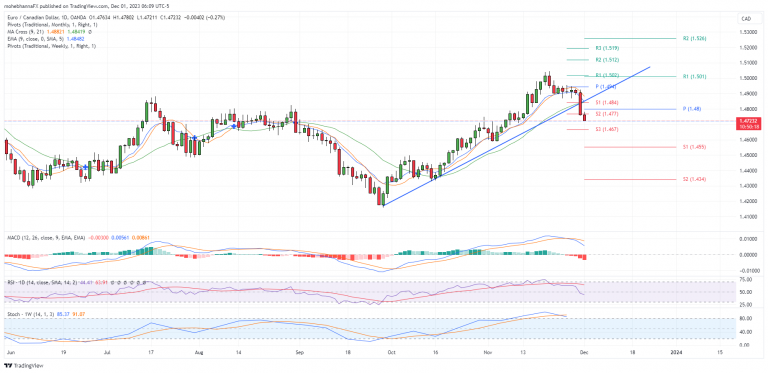
- EURCAD price broke and closed below an intermediate trendline identified on the above daily timeframe chart, with no pullback to retest the broken level so far. The broken level was also a confluence of Support represented by 3 commonly used Moving average periods, EMA9, MA,9, MA21, and the monthly pivot point at 1.4800
- Applying the weekly Stochastic indicator onto the Daily timeframe to smooth the readings suggests that EURCAD may be overbought and shows that %K just crossed below %D along with the break below the intermediate trendline mentioned above.
- Applying Daily RSI with its default period of 14 shows that RSI is so far in line with price action, however, it is currently neutral near level 50.
- MACD line crossed below its signal line and the Histogram is also turning bearish.
Sentiment Indicators: Commitment of Traders report, and OANDA’s order book.
COT Report
Source: Tradingview.com
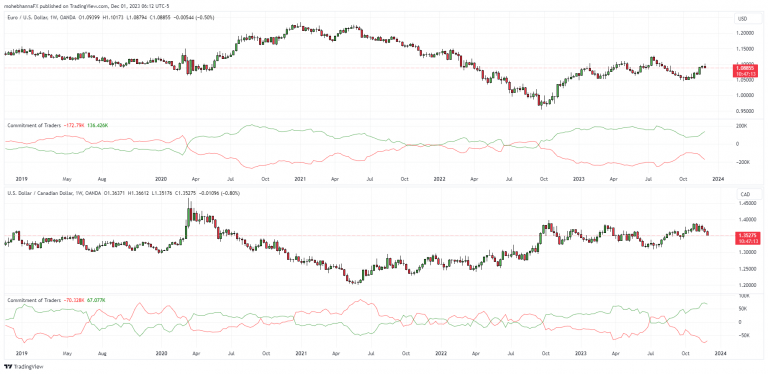
The Commitment of Traders report offers insights about positioning changes in the futures market, although delayed, it still helps as a sentiment tool in a trader’s arsenal. Comparing Position levels on the latest COT report shows that Large Speculators on both currencies are favoring long positions, however, it also suggests that the Canadian Dollar is closer to its extreme than the Euro, thus a higher probability of Sentiment change. The above chart is for EURUSD and USDCAD side by side with the COT report applied to both. (COT for Canadian Dollar is inverted, CADUSD)
OANDA’s Orderbook Indicator
Source: OANDA.com
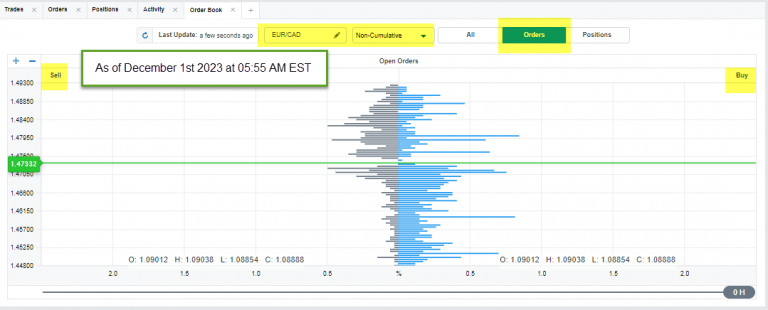
Another sentiment tool is the OANDA Orderbook Indicator, the above image reflects an aggregate view of pending entry orders on EURCAD for OANDA’s clients, the data falls under the Retail Traders category. The above image suggests that Retail traders are looking to buy as the price falls and sell as it rises, this is the typical retail trader sentiment and needs to be thought of carefully as Retail Traders can sometimes be in the opposite direction in trendy markets. The order book also reflects price levels that have the highest number of pending orders, these levels can be critical as the price continues to move regardless of direction. It is also important to note that the order book percentages include exit orders such as Stops and limits, we can continue to follow up on position percentage changes.
Relative Rotation Graph
Source: Optuma.com
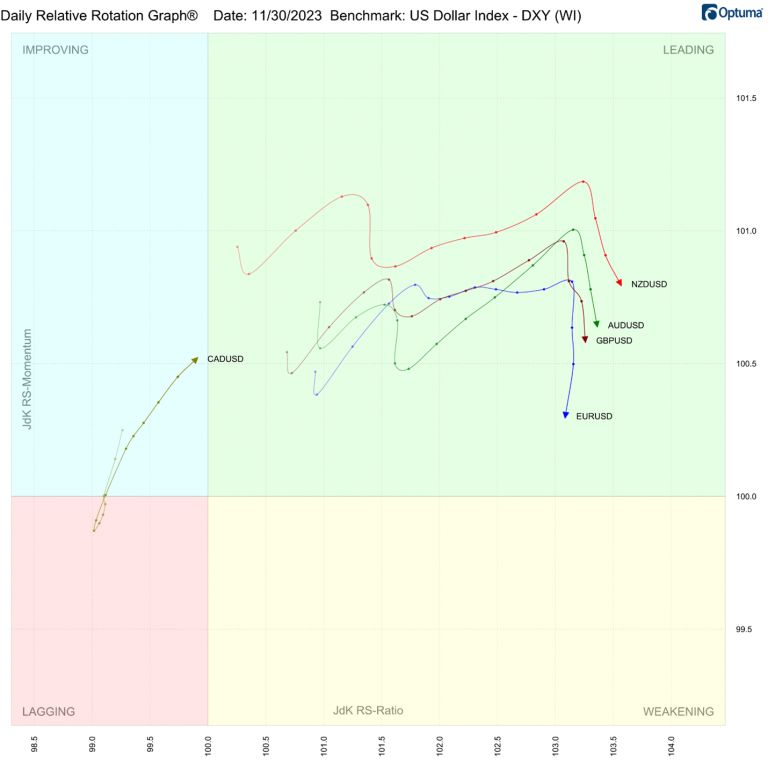
The Relative Rotation graph RRG (A measurement for Momentum and Relative strength) on the daily time frame shows EURUSD, GBPUSD, AUDUSD, and NZDUSD are currently in the Leading Quadrant, with EURUSD leading the pack and CADUSD attempting to catch up from the Improving quadrant. The arrow direction for all pairs except CAD is so far pointing south towards the weakening quadrant.
Crude Oil Can Resume to 70-72 Support
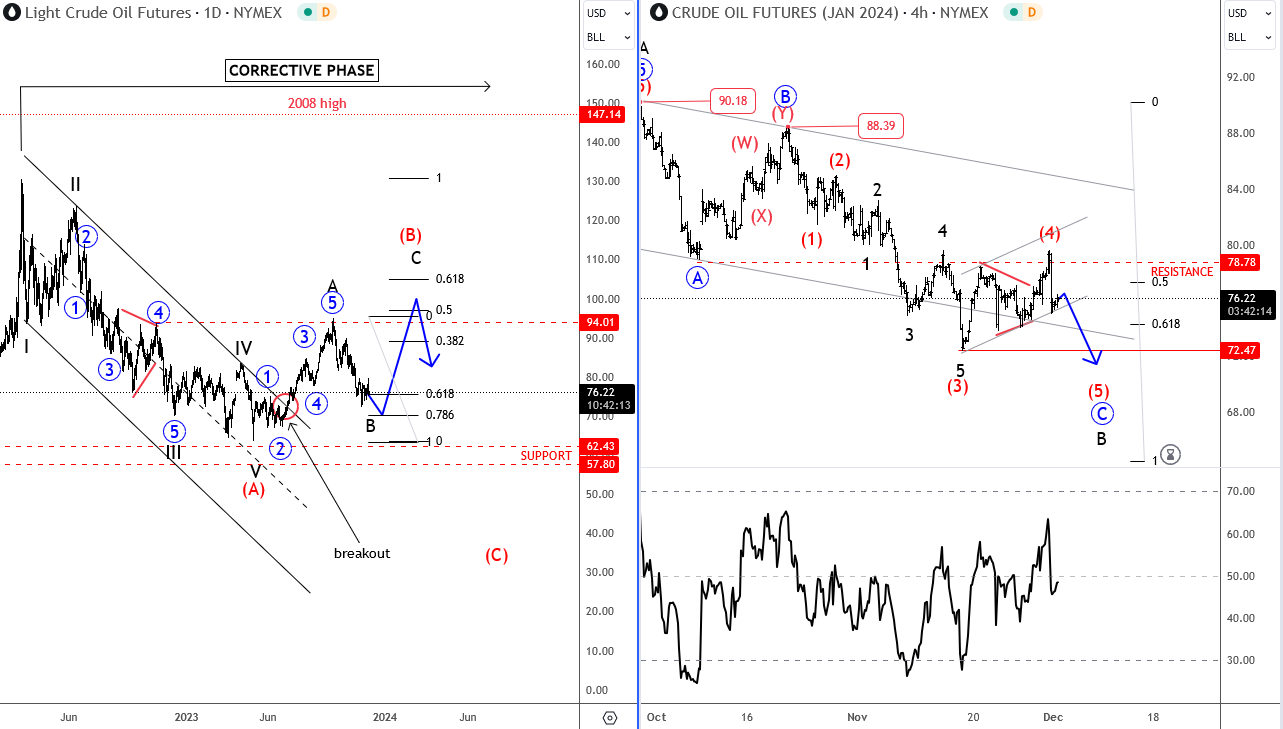
On a daily chart, we see a drop in crude oil from 130 area as a five-wave move within wave A that bottomed at 62 - 57 support area. It was a strong drop and spike back in May, when energy bottomed, so we are tracking a higher degree correction from there; wave (B), which can be much higher than firstly thought; there can be room for 100. And the reason is a strong bullish trend back in September, which is looking impulsive, labeled as completed A, so be aware of more gains after current deep set-back in B is completed.
Looking at the 4h time frame (right) oil is coming down despite OPEC that can be trying to stabilize the prices after countries agrees to deepen voluntary oil output cuts down to 70-72 area as recent bounce to 79/80 resistance unfolded as subwave (4). If we are correct, then there can still be some itneresting bounce-back later this month.
EUR/JPY: Completion of Failure Swing Pattern to Signal Deeper Pullback
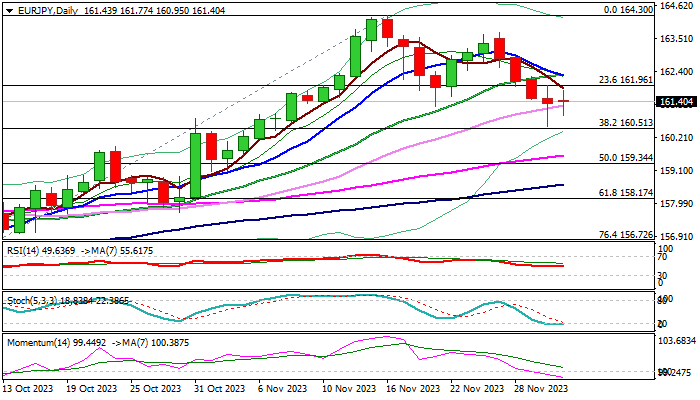
EURJPY remains in red and holding near three-week low on Friday, on track for the first weekly loss in five week and the biggest drop since the second week of March.
Initial signal of larger rally stall was also generated by November’s monthly Doji with long upper shadow and overbought conditions on monthly chart.
Daily studies already turned bearish as 14-d momentum moved into negative territory and double bear-cross (5/20 and 10/20DMA) formed on daily chart.
However, fresh bears still look for confirmation of failure swing pattern on daily chart, as pullback faced headwinds on approach to pivotal Fibo support at 160.51 (38.2% of 154.38/164.30 bull-leg) which resulted in a second daily Doji candle, signaling indecision.
Firm break of 160.51 to confirm bearish near-term stance for extension through 160 (psychological) towards 159.34 (50% retracement of 154.38/164.30).
Daily Tenkan-sen (162.15) marks upper pivot and break higher would sideline near-term bears.
Res: 161.96; 162.15; 162.44; 162.88.
Sup: 161.00; 160.51; 160.00; 159.61.
EUR/GBP: Steep Fall Extends Below Thick Daily Ichimoku Cloud
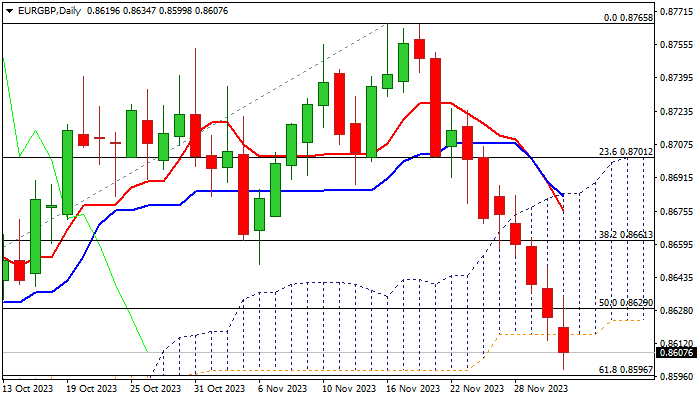
EURGBP continues to trend south and hit new 3 ½ month low on Friday, in extension of steep and uninterrupted downtrend from 0.8765 (Nov 16 peak).
The pair is on track to complete the second week of heavy losses, after November’s close in red marked the biggest monthly loss since May.
Fresh signals that the ECB will start cutting interest rates before BoE, after the latest comments from Bank of England’s hawks that rates may stay elevated for longer, additionally weighed on the pair.
Friday’s break below the base of thick daily cloud (0.8616) generated fresh bearish signal, which requires confirmation on weekly close below the cloud.
Daily studies are in full bearish setup but overextended and warning about possible corrective action in coming sessions.
Cloud base and 100DMA (0.8616/38 respectively) reverted to resistances which should ideally cap upticks and guard 0.8650/61 (Nov 16 former higher low / broken Fibo 38.2%).
Res: 0.8616; 0.8638; 0.8661; 0.8674.
Sup: 0.8596; 0.8567; 0.8556; 0.8523.
USD/CAD Eyes Canadian Job Data, US PMI
- Canada’s job growth expected to expand by 15,000
- US ISM Manufacturing PMI projected to accelerate to 47.6
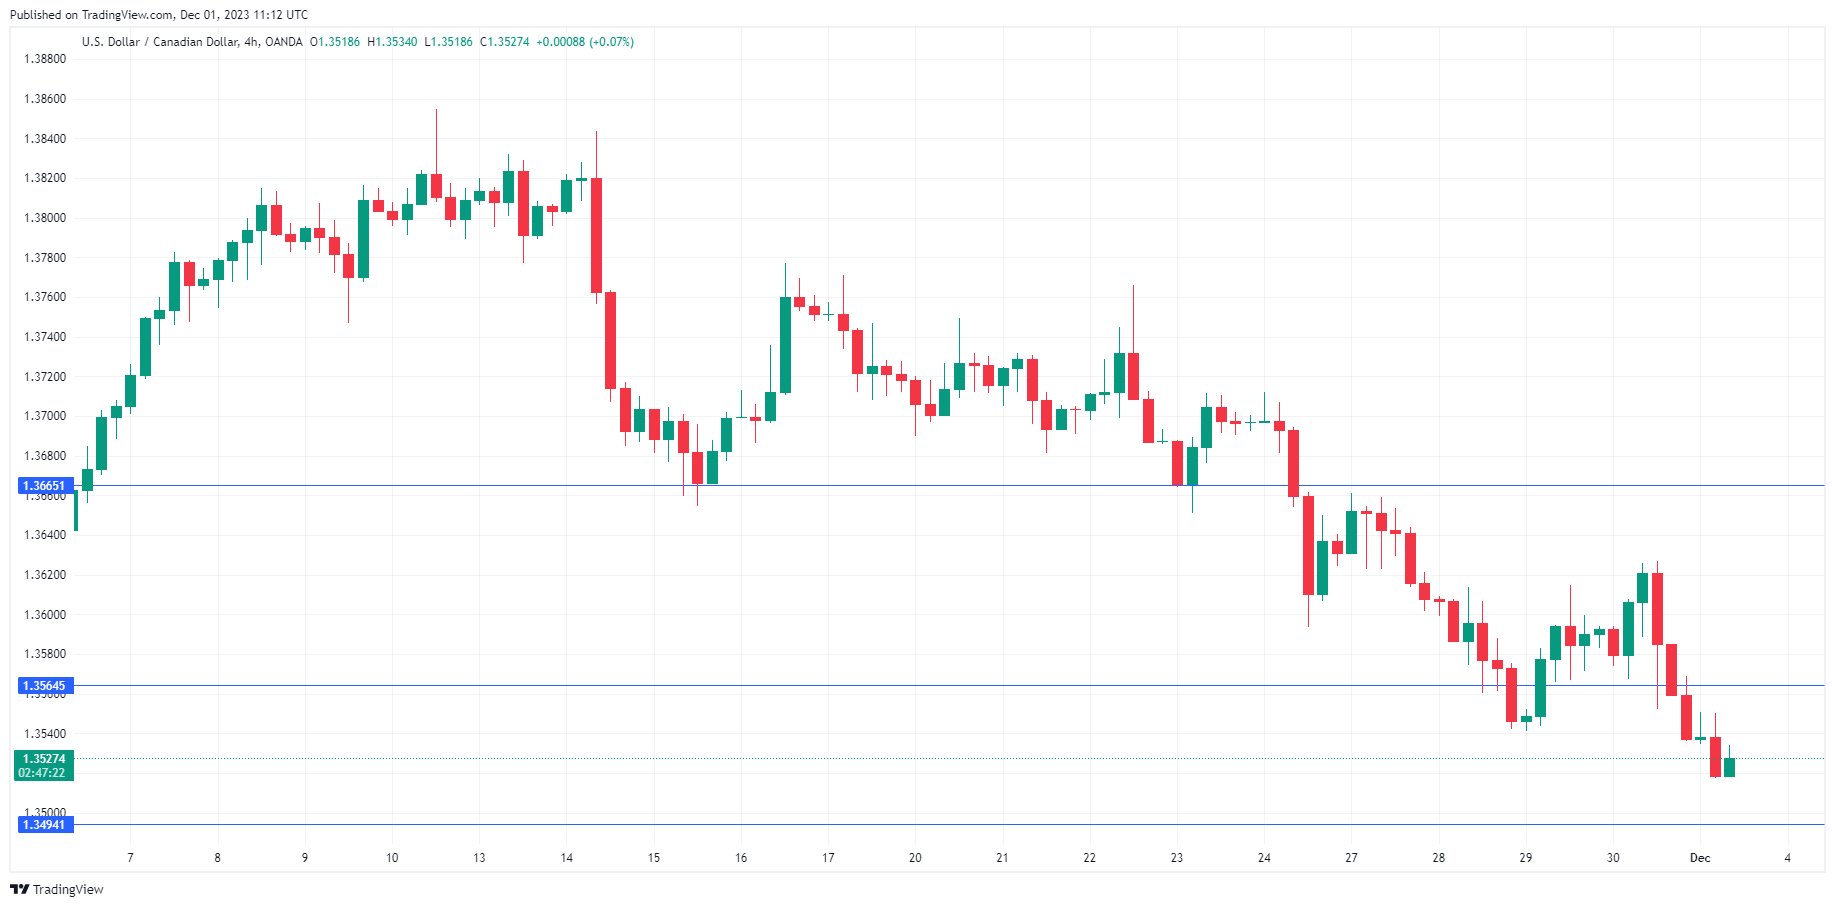
The Canadian dollar continues to gain ground against a slumping US dollar. In the European session, USD/CAD is trading at 1.3529, down 0.23%.
The Canadian currency is poised to post a third straight winning week against the greenback and soared 2.25% in November. It is a busy Friday, with Canada releasing the employment report, the US publishing the ISM Manufacturing PMI and Fed Chair Powell speaking at an event in Atlanta.
Canada’s labour market has softened but remains in good shape and has shown expansion for three straight months. The economy is expected to have added 15,000 jobs in November, slightly lower than the 17,500 reading in October. The market consensus for the unemployment rate stands at 5.8%, compared to 5.7% in October.
Canada’s GDP posts negative growth
This week’s GDP report was another reminder that the economy remains weak. Third-quarter GDP declined by 0.3% q/q, below the revised o.3% gain in Q2 and the first decline since the second quarter of 2021. High interest rates have cooled the economy and exports were down in the third quarter as global demand remains weak. On an annualized basis, GDP slid 1.1% in the third quarter, compared to a revised 1.4% gain in Q2 and shy of the market consensus of 0.2%.
The US wraps up the week with the ISM Manufacturing PMI. The manufacturing sector has been in a prolonged slump and the PMI has indicated contraction for twelve consecutive months. The PMI is expected to improve to 47.6 in November, compared to 46.7 in October. A reading below 50 indicates contraction.
Investors will be listening closely to Jerome Powell’s remarks today, looking for hints about upcoming rate decisions. Powell has stuck to his script of a ‘higher for longer’ rate policy, but the markets have priced in a rate cut in May at 84%.
USD/CAD Technical
- USD/CAD tested resistance at 1.3564 in the Asian session. Above, there is resistance at 1.3665
- 1.3494 and 1.3434 are providing support
Vibrant Crypto Market
Market picture
The crypto market has added 1.5% in the last 24 hours, bringing the capitalisation back to the 1.44 trillion level, which has been acting as resistance for the last three weeks. The upward movement has intensified since the beginning of December.
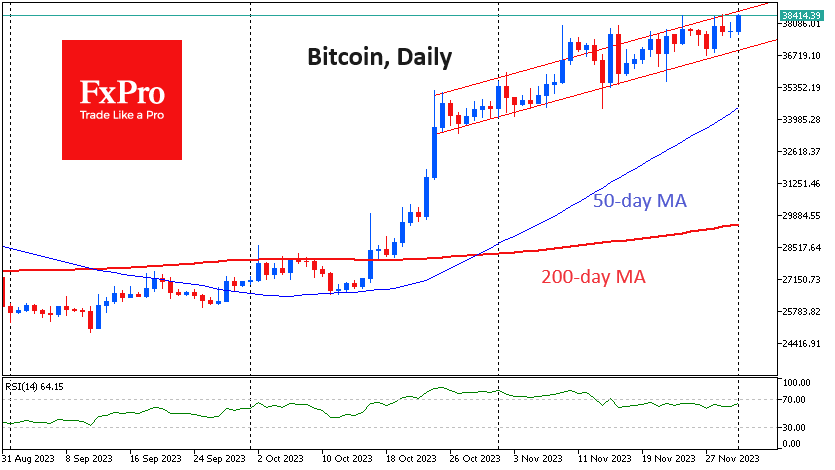
Bitcoin rose 9.4% to $37.7K in November, strengthening for the third consecutive month. In terms of seasonality, December is considered a relatively neutral month of the year, adding half the time over the past 12 years. The average gain is 30.8%, while the average decline is 12.8%.
December started on the upside, returning BTCUSD to another test of highs near $38.4K. The price went up with the start of a new day and month before touching the lower boundary of the trading channel. Such dynamics look like an attempt to accelerate the growth trend.
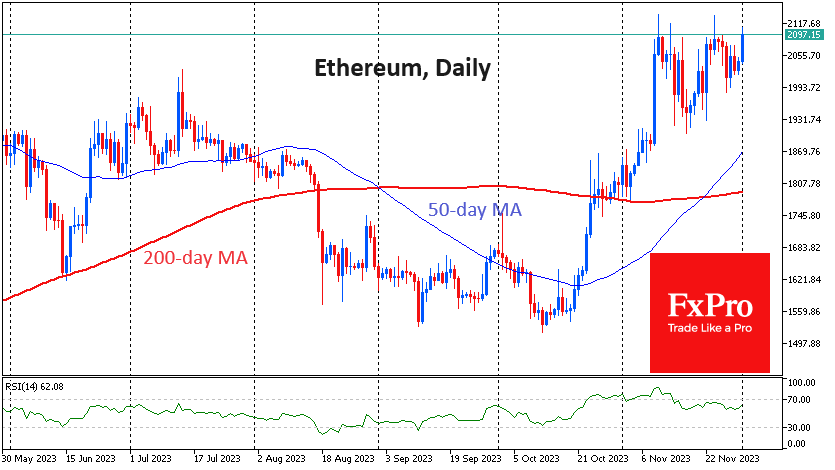
Ethereum is adding 3.8% over the day, having returned to test $2100 – a horizontal resistance which withstood the bulls’ onslaught several times in November and was a turning point in April. A move above opens up a wide untraded range, giving ETH freedom of movement all the way to $3500.
News background
SEC chief Gary Gensler said the agency is working closely on numerous applications for spot Bitcoin ETFs. Still, it is not helpful to comment on timing or anticipate future decisions on them. He reiterated the Commission’s position that bitcoin is a commodity.
Coinbase’s team has met with the SEC 30 times in a year and a half but has not received an answer to the question of whether certain assets belong to securities, said Brian Armstrong, the exchange’s CEO.
MicroStrategy bought 16,130 BTC in November at an average price of $36,785. The company’s total reserves reached 174,530 BTC. In total, the company has about 174.5K BTC on its balance sheet, with an average purchase price of $30.2K.
The U.S. Treasury Department has asked lawmakers to give the agency expanded powers to fight illegal financing through cryptocurrencies. Cryptocurrency services and mixers could be used for this purpose.
Bankrupt cryptocurrency exchange FTX received bankruptcy court approval and began selling $744 million worth of crypto assets to Grayscale Investments.
Mining pool AntPool, which received a record $3.1 million Bitcoin transaction fee, said it was willing to reimburse it.
Swiss Franc Hits 4-month High, GDP Beats Forecast
- Swiss franc climbs to 4-month high
- Swiss GDP rises 0.3%
- US ISM Manufacturing PMI expected to rise slightly
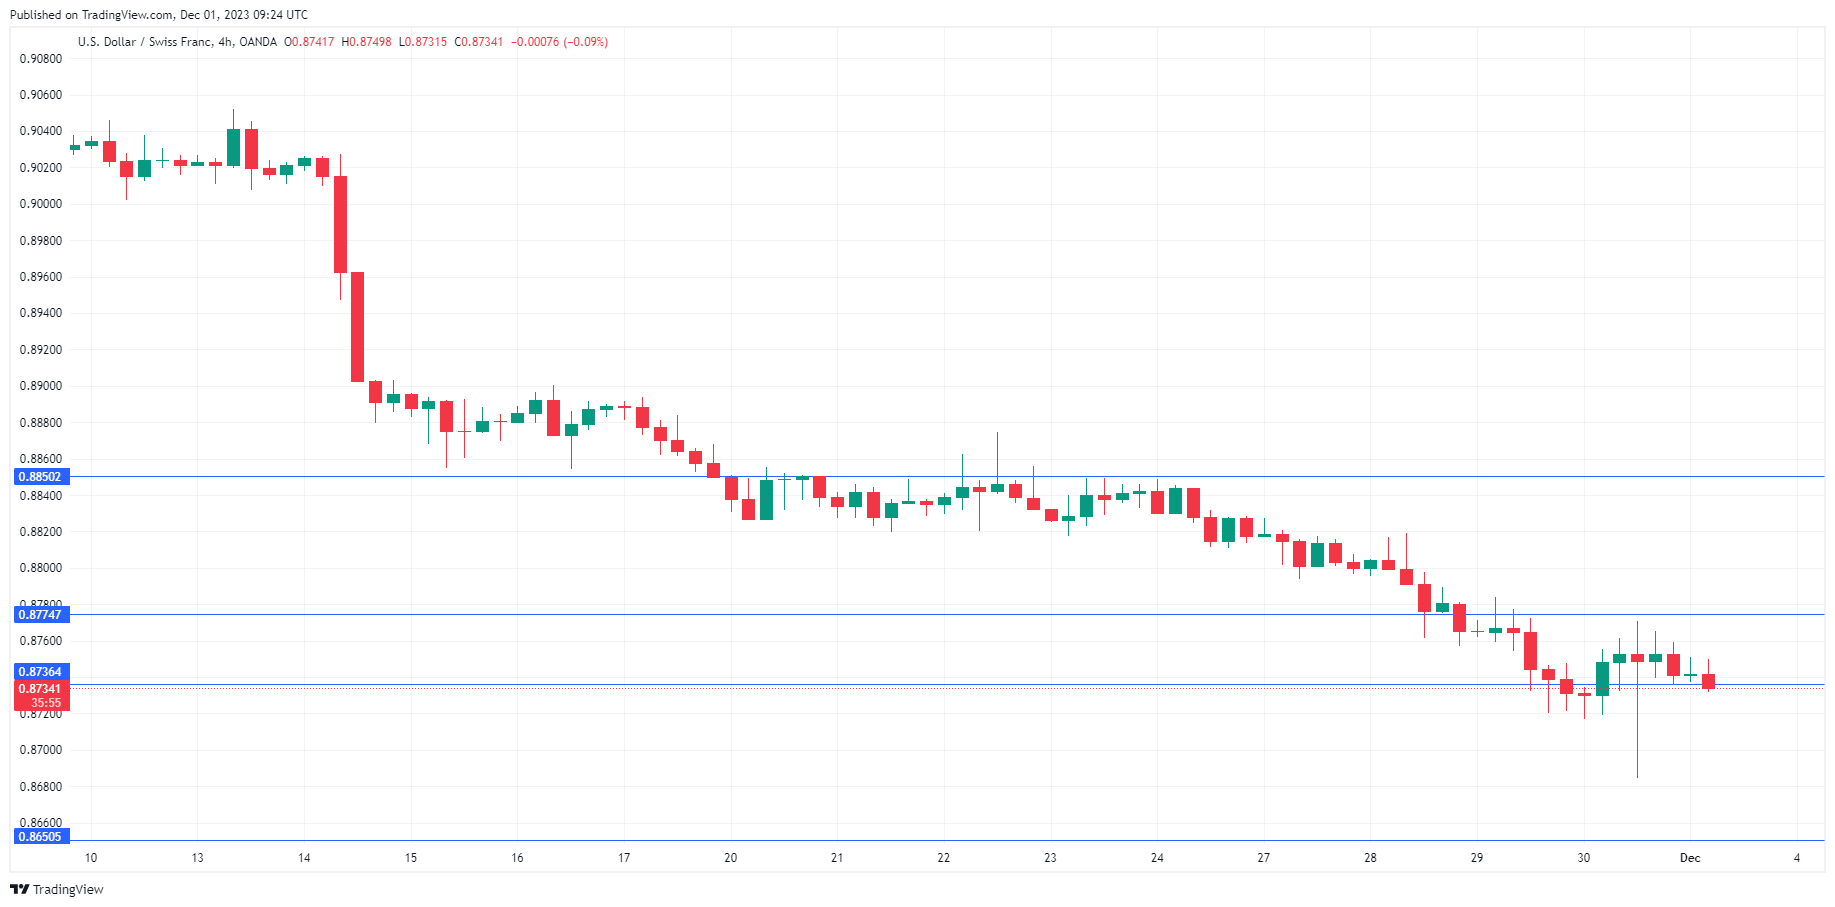
The Swiss franc is lower on Friday. In the European session, USD/CHF is trading at 0.8723, down 0.22%.
Swiss franc continues to climb
The Swiss franc continues to power higher against a slumping US dollar. USD/CHF has fallen 1% this week and plunged 3.8% in November. On Thursday, USD/CHF touched a low of 0.8684, its lowest level since July 31.
The Swissie’s rapid appreciation is likely causing sleepless nights at the Swiss National Bank. Policy makers at the central bank follow the exchange rate carefully and have not hesitated to intervene in the currency markets as a monetary policy tool. The stronger Swiss franc has helped dampen inflation but the SNB doesn’t want the currency to be too strong since that hurts the crucial export sector. If the Swiss franc continues to lose ground, the SNB could respond with some verbal intervention and express concern about the Swiss franc’s high value.
Swiss inflation is in a good place, within the 0%-2% target, but the economy remains weak. Swiss GDP rose by just 0.3% q/q in the third quarter, up from a revised -0.1% in Q2 and above the consensus estimate of 0.1%. The services sector was the main driver of growth as manufacturing was flat and consumer spending posted modest growth. The GDP report noted that the “international environment remains challenging”. Global demand remains weak, and the EU, which is Switzerland’s largest export market, posted 0% growth in the third quarter.
The US wraps up the week with the ISM Manufacturing PMI. The manufacturing sector has been in a deep slump and the PMI has indicated contraction for twelve consecutive months. The PMI is expected to improve to 47.6 in November, compared to 47.6 in October. A reading below 50 indicates contraction.
We will also hear from Federal Reserve Chair Powell later today. Investors will be looking for hints about upcoming rate decisions. Powell has stuck to his script of a ‘higher for longer’ rate policy, but the markets have fully priced in a rate cut by May, up from 65% a week ago.
USD/CHF Technical
- USD/CHF is testing resistance at 0.8736. Below, there is support at 0.8650
- 0.8736 and 0.8774 are the next resistance lines