

Sample Category Title
EUR/JPY Daily Outlook
Daily Pivots: (S1) 160.68; (P) 161.31; (R1) 162.02; More....
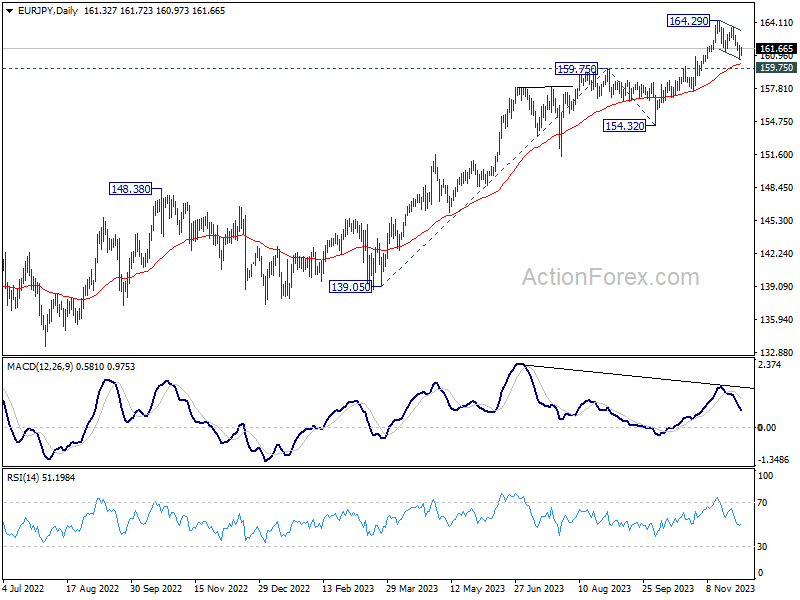
EUR/JPY recovered after hitting 100% projection of 164.29 tot 161.22 from 163.77 at 160.63. Intraday bias is turned neutral first. While further decline cannot be ruled out, downside should be contained by 159.75 key support to complete the correction from 164.29. Meanwhile, break of 162.24 minor resistance will turn bias back to the upside for retesting 163.70/164.29 resistance zone.
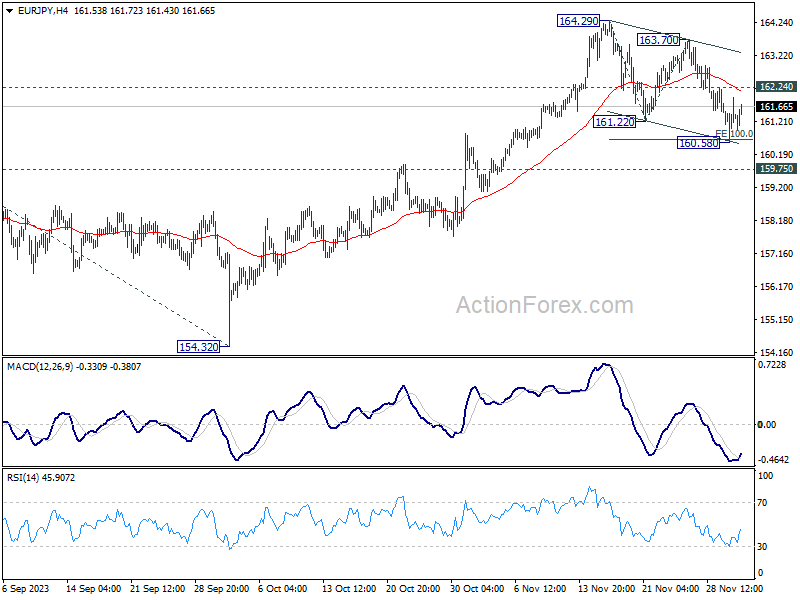
In the bigger picture, rise from 114.42 (2020 low) is in progress. Next target is 169.96 (2008 high). On the downside, break of 159.75 resistance turned support is needed to be the first sign of medium term topping. Otherwise, outlook will remain bullish even in case of deep pullback.
EUR/GBP Daily Outlook
Daily Pivots: (S1) 0.8609; (P) 0.8630; (R1) 0.8645; More....
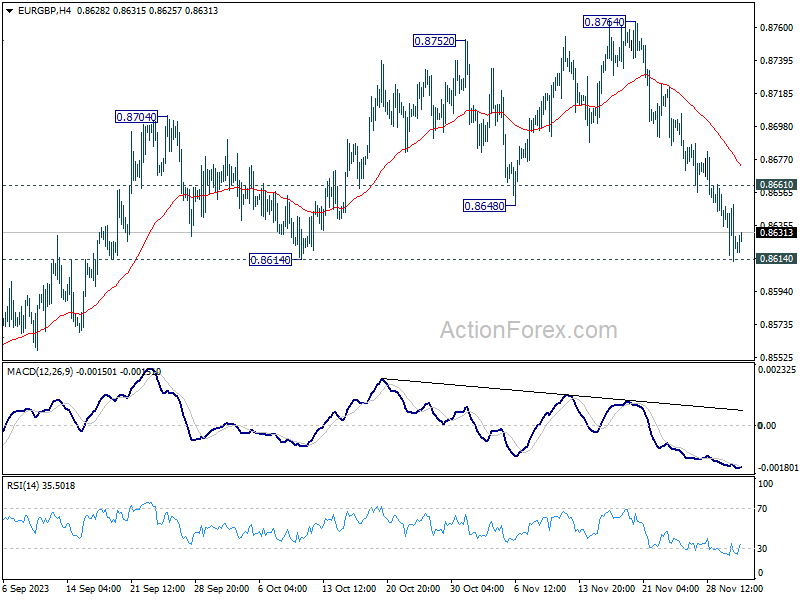
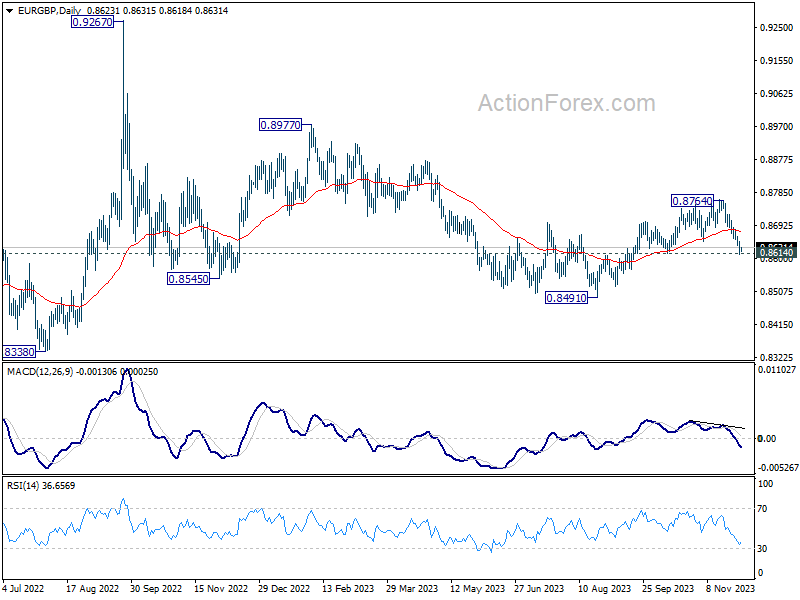
Intraday bias in EUR/GBP remains on the downside at this point. As noted before, corrective rebound from 0.8491 could have completed at 0.8764 already. Decisive break of 0.8614 support will target a retest on 0.8491 low. On the upside, above 0.8661 minor resistance will turn intraday bias neutral first.
In the bigger picture, outlook is mixed up by deeper than expected fall from 0.8764. On the downside, firm break of 0.8614 support will argue that down trend from 0.9267 (2022 high) is still in progress. Deeper fall would be seen through 0.8941 low. Nevertheless, break of 0.8764 will revive that case of medium term bullish reversal.
EUR/AUD Daily Outlook
Daily Pivots: (S1) 1.6425; (P) 1.6506; (R1) 1.6567; More...
EUR/AUD's fall from 1.6844 is still in progress and intraday bias stays on the downside, with focus on 1.6449 support. Decisive break there will argue that corrective pattern from 1.6319 has completed at 1.6844. More importantly, decline from 1.17062 is ready to resume through 1.6319 next. On the upside, above 1.6601 minor resistance will turn intraday bias neutral first.
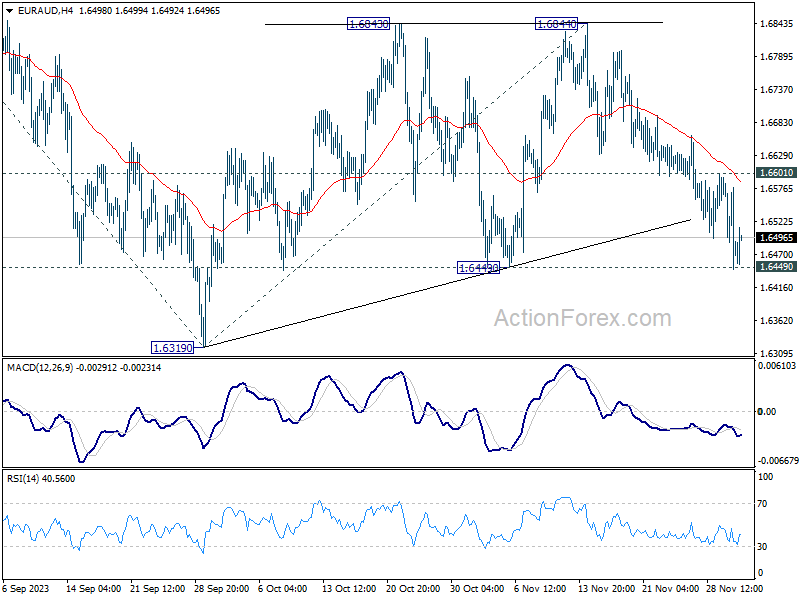
In the bigger picture, the break of medium term trend line support now suggests that a medium term top was already formed at 1.7062. Fall from there is seen as correcting the whole up trend from 1.4281 (2022 low). Firm break of 1.6449 support will solidify this bearish case and target 38.2% retracement of 1.4281 to 1.7062 at 1.6000.
Dollar and Euro Neck-and-Neck for Weakest Performer, Awaiting ISM Manufacturing Insights
The competition between Dollar and Euro for the title of the week's weakest performer remains intense. Current talking point is particularly on ECB, where economists are increasingly predicting an early rate cut following this week's pivotal inflation data. Goldman Sachs, aligning with this growing consensus, has updated its forecast today, now anticipating ECB to initiate a rate cut in Q2 of 2024, a quarter earlier than its previous projection. The market is now keenly observing whether this anticipation will trigger further selloff in Euro before weekly close, especially in crosses to push through additional support levels.
On the other side, Dollar's performance could hinge on upcoming ISM manufacturing data, which is a crucial indicator of the manufacturing sector's health, employment conditions, and inflationary pressures. While Dollar has found some support at critical near-term technical levels, it requires additional positive drivers to sustain or extend its current rebound. The likelihood of a sustained rebound largely depends on market expectations regarding the timing of potential rate cuts by Fed. If the market perceives a delay in rate cuts, it could provide the necessary bullish stimulus for the greenback.
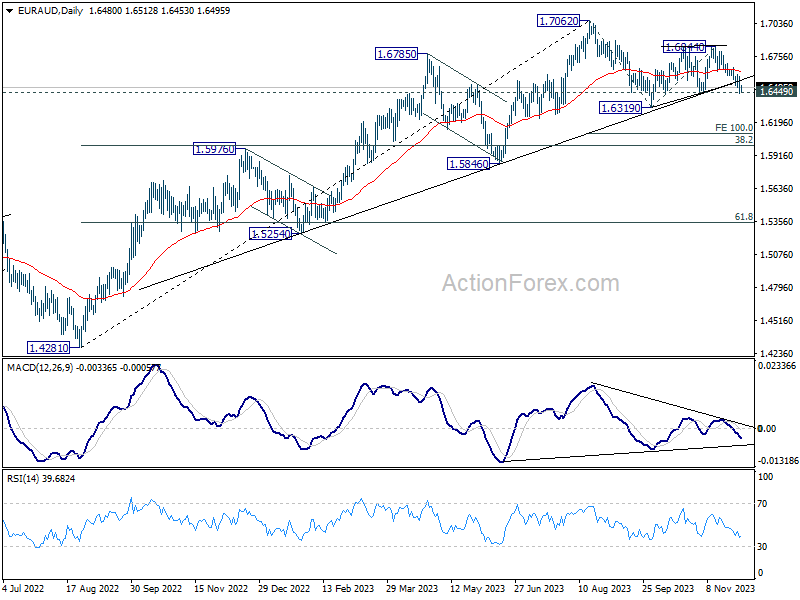
Technically, Dollar Index is showing signs that it might have established a short-term bottom at 102.46, particularly after breaching breaching 61.8% retracement of 99.57 to 107.34 at 102.53 briefly. For confirmation of this scenario, however, Dollar Index would need to surpass 104.21 resistance. Such a move could trigger a stronger rise, aiming for 55 D EMA (now at 104.74). The ISM manufacturing data could be the catalyst Dollar needs to challenge these levels. If not, the market may shift its focus to next week's non-farm payroll data for further direction.
In Asia, at the time of writing, Nikkei is down -0.12%. Hong Kong HSI is down -0.30%. China Shanghai SSE is down -0.10%. Singapore Strait Times is up 0.36%. Japan 10-year JGB yield is up 0.038 at 0.712. Overnight, DOW rose 1.47%. S&P 500 rose 0.38%. NASDAQ fell -0.23%. 10-year yield rose 0.081 to 4.352.
China's Caixin PMI manufacturing rises to 50.7, back to growth amidst challenges
China's Caixin PMI Manufacturing index climbed from 49.5 to 50.7 in November, surpassing the expected 49.3. According to Caixin's release, this improvement is attributed to sustained rise in total new work, which helped push production back into growth territory. Additionally, there was softer reduction in employment and uptick in business confidence, reaching a four-month high.
Wang Zhe, Senior Economist at Caixin Insight Group, noted, "Overall, the manufacturing sector improved in November." He cited several factors contributing to this improvement: expansion in supply and demand, stable prices, improved logistics, increased purchasing quantities, and a more optimistic outlook among manufacturers. However, he also pointed out some ongoing challenges, such as sluggish external demand, weak employment, and cautious inventory management by manufacturers.
Wang also commented on the broader macroeconomic context, stating, "The macro economy has been recovering." He observed improvements in household consumption, industrial production, and market expectations. Despite these positive signs, he cautioned that both domestic and foreign demand remain insufficient, employment pressures are high, and the economic recovery is still searching for a solid footing.
Japan's PMI manufacturing finalized at 48.3, contraction continues yet optimistic
November saw Japan's Manufacturing PMI finalized at 48.3, a slight decline from October's 48.7. This figure, reported by S&P Global, indicates a continued contraction in the manufacturing sector, with more pronounced decreases in output and new order inflows. The PMI reaching its lowest since February signals a challenging phase for the sector, primarily due to weakened demand both domestically and internationally.
Usamah Bhatti of S&P Global Market Intelligence commented on the sector's performance, noting, "The headline PMI slipped deeper into contraction territory, largely due to quicker deteriorations in output and new order inflows." He identified weak customer demand across both domestic and international markets as key factors behind this downturn.
On the inflation front, although inflationary pressures remained high, there was a noticeable easing. Input cost inflation slowed down to a three-month low, and selling price inflation reduced to its softest since July 2021. This easing in inflation suggests some relief in cost pressures for manufacturers.
Despite the current contraction, Japanese manufacturers are holding onto a sense of optimism for the future. Bhatti emphasized this positive outlook, stating, "Manufacturers remained optimistic that muted demand and production conditions would lift over the coming year." This confidence is underpinned by expectations of a boost in demand, spurred by new product launches, particularly in the semiconductor sector.
RBNZ's Hawkesby highlights inflation pressure from record migration
RBNZ Deputy Governor Christian Hawkesby provided insights into the central bank's current monetary policy and the economic outlook in an interview today. He discussed timing of rate cuts, and impact of rising immigration.
RBNZ's revised forecast does not foresee rate cuts until mid-2025. Explaining the rationale behind the delayed rate cuts, Hawkesby emphasized the need for RBNZ to ensure that inflation expectations are securely re-anchored. He also pointed out that the New Zealand economy had experienced overheating and now requires a period of cooling, marked by a negative output gap.
The interview also highlighted the impact of recent demographic shifts on the The RBNZ had initially perceived rising immigration as a mitigating factor for inflation risk, considering its potential to alleviate labor shortages and reduce wage pressure. However, Hawkesby revealed that the immigration surge has been more significant than anticipated, now contributing to increased demand in the economy.
Hawkesby remarked, "Net migration has peaked at higher levels, so that's news in itself, important news." He further explained that the "demand-side impacts" of this trend are becoming more evident. He added, "The fact you have got to house a bigger population and the impact that that has, particularly on rental inflation and things like that."
New Zealand's population witnessed a substantial increase of 2.7% in the year through September, the largest in over three decades, with net annual immigration reaching a record high of 118,835.
Looing ahead
Swiss GDP and PMI manufacturing will be released in Euroepan session, along with Eurozone and UK PMI manufacturing final. Later in the day, Canada's employment daata and US ISM manufacturing will be the main focuses.
EUR/AUD Daily Outlook
Daily Pivots: (S1) 1.6425; (P) 1.6506; (R1) 1.6567; More...
EUR/AUD's fall from 1.6844 is still in progress and intraday bias stays on the downside, with focus on 1.6449 support. Decisive break there will argue that corrective pattern from 1.6319 has completed at 1.6844. More importantly, decline from 1.17062 is ready to resume through 1.6319 next. On the upside, above 1.6601 minor resistance will turn intraday bias neutral first.
In the bigger picture, the break of medium term trend line support now suggests that a medium term top was already formed at 1.7062. Fall from there is seen as correcting the whole up trend from 1.4281 (2022 low). Firm break of 1.6449 support will solidify this bearish case and target 38.2% retracement of 1.4281 to 1.7062 at 1.6000.
Economic Indicators Update
| GMT | Ccy | Events | Actual | Forecast | Previous | Revised |
|---|---|---|---|---|---|---|
| 23:30 | JPY | Unemployment Rate Oct | 2.50% | 2.60% | 2.60% | |
| 23:50 | JPY | Capital Spending Q3 | 3.40% | 3.40% | 4.50% | |
| 00:30 | JPY | Manufacturing PMI Nov F | 48.3 | 48.1 | 48.1 | |
| 01:45 | CNY | Caixin Manufacturing PMI Nov | 50.7 | 49.3 | 49.5 | |
| 08:00 | CHF | GDP Q/Q Q3 | 0.10% | 0.00% | ||
| 08:30 | CHF | Manufacturing PMI Nov | 42 | 40.6 | ||
| 08:45 | EUR | Italy Manufacturing PMI Nov | 45.5 | 44.9 | ||
| 08:50 | EUR | France Manufacturing PMI Nov F | 42.6 | 42.6 | ||
| 08:55 | EUR | Germany Manufacturing PMI Nov F | 42.3 | 42.3 | ||
| 09:00 | EUR | Italy GDP Q/Q Q3 | 0% | 0% | ||
| 09:00 | EUR | Manufacturing PMI Nov F | 43.8 | 43.8 | ||
| 09:30 | GBP | Manufacturing PMI Nov F | 46.7 | 46.7 | ||
| 13:30 | CAD | Net Change in Employment Nov | 14.2K | 17.5K | ||
| 13:30 | CAD | Unemployment Rate Nov | 5.80% | 5.70% | ||
| 14:30 | CAD | Manufacturing PMI Nov | 48.6 | |||
| 14:45 | USD | Manufacturing PMI Nov F | 49.4 | 49.4 | ||
| 15:00 | USD | ISM Manufacturing PMI Nov | 47.7 | 46.7 | ||
| 15:00 | USD | ISM Manufacturing Prices Paid Nov | 46.2 | 45.1 | ||
| 15:00 | USD | ISM Manufacturing Employment Index Nov | 46.8 | |||
| 15:00 | USD | Construction Spending M/M Oct | 0.40% | 0.40% |
Technical Outlook and Review
DXY:
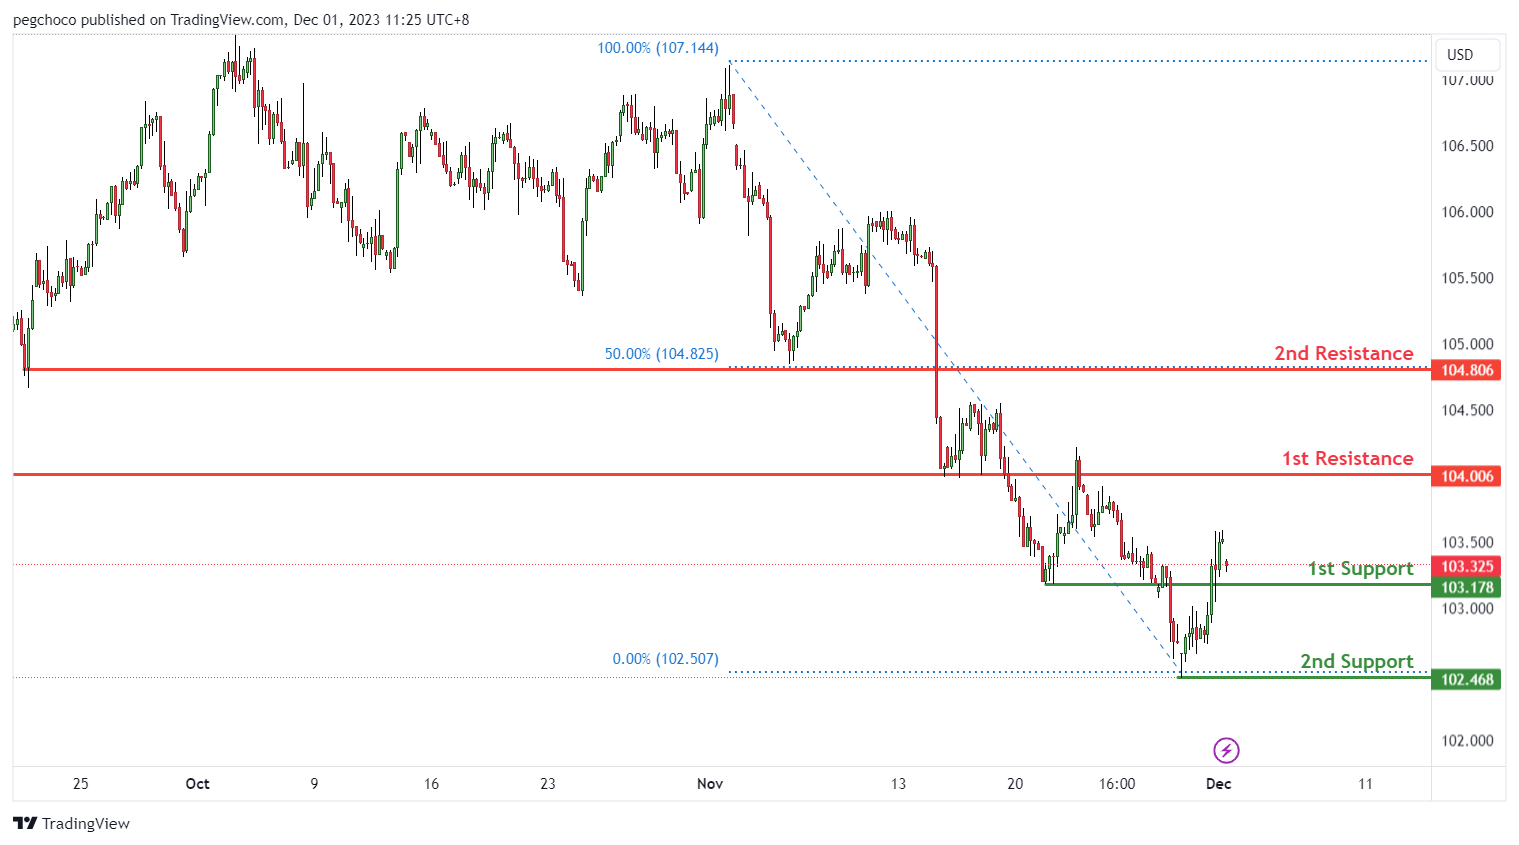
The chart for DXY (US Dollar Index) displays a bullish overall momentum. Potential price action suggests a bullish bounce off the 1st support.
The 1st support at 103.17 is identified as a pullback support. It’s a significant level where buying interest may emerge, potentially propelling the DXY towards further gains.
The 2nd support at 102.46 is another support level, characterized as a swing low support, reinforcing its importance as a potential area of buying interest.
On the resistance side, the 1st resistance at 104.00 is categorized as a pullback resistance, serving as a significant barrier where selling interest could intensify, potentially slowing the DXY’s upward movement.
The 2nd resistance at 104.80 is noted as another pullback resistance, further reinforcing potential resistance factors for the currency index.
EUR/USD:
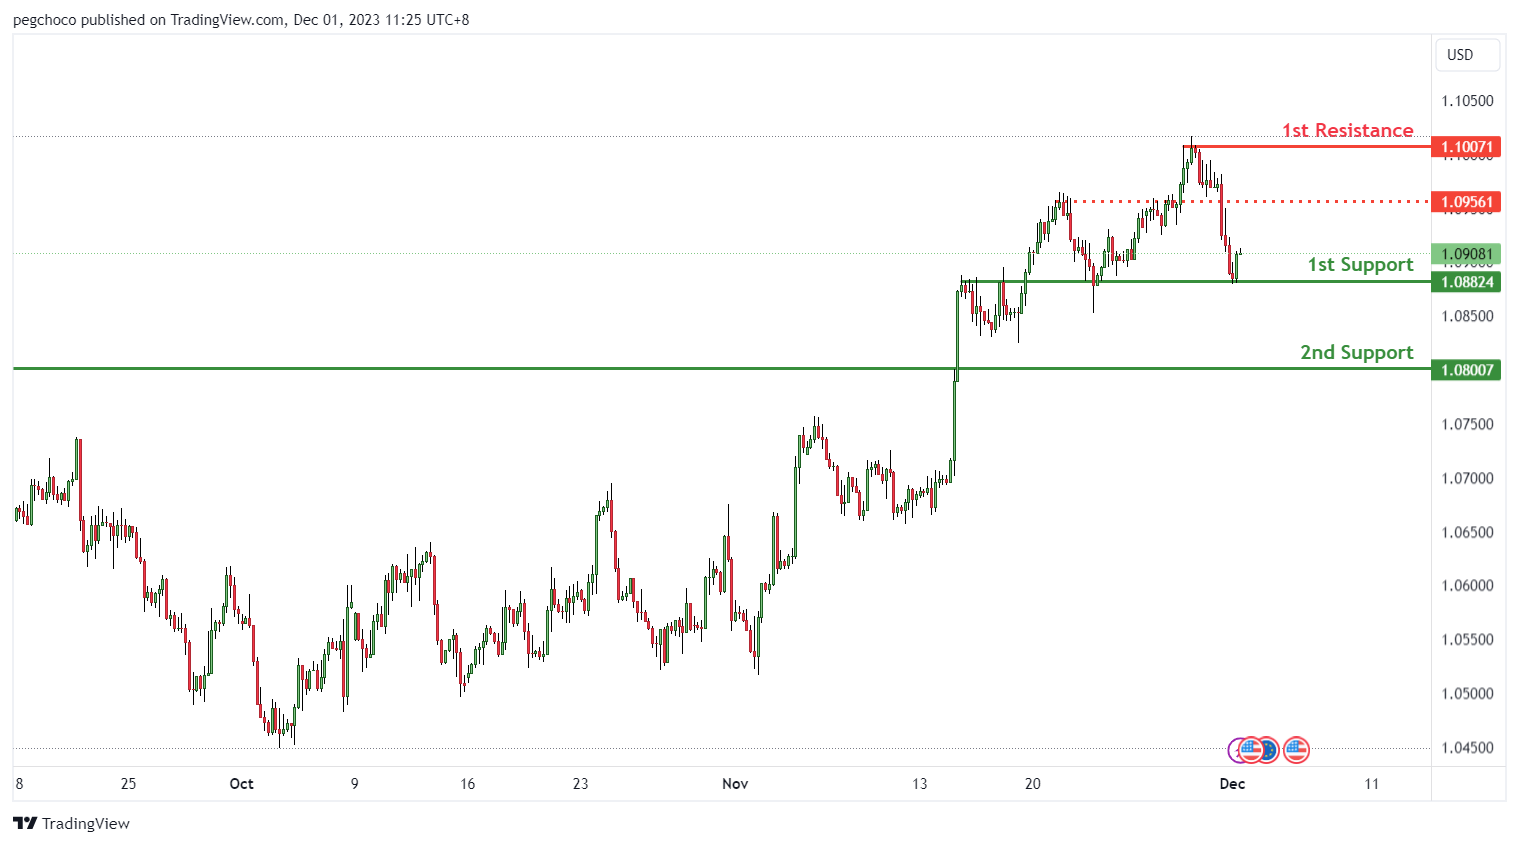
The EUR/USD chart exhibits a bullish overall momentum, indicating potential for a bullish continuation towards the 1st resistance.
The 1st support at 1.0882 is identified as an overlap support, a significant level where buying interest may emerge, providing essential backing for the currency pair.
The 2nd support at 1.08 is categorized as pullback support, reinforcing its importance as a potential area of buying interest.
On the resistance side, the 1st resistance at 1.1007 is a swing high resistance, serving as a substantial barrier where selling interest could intensify, potentially slowing EUR/USD’s upward movement.
Additionally, there is an intermediate resistance at 1.0956, characterized as pullback resistance, further reinforcing potential resistance factors for the currency pair.
EUR/JPY:
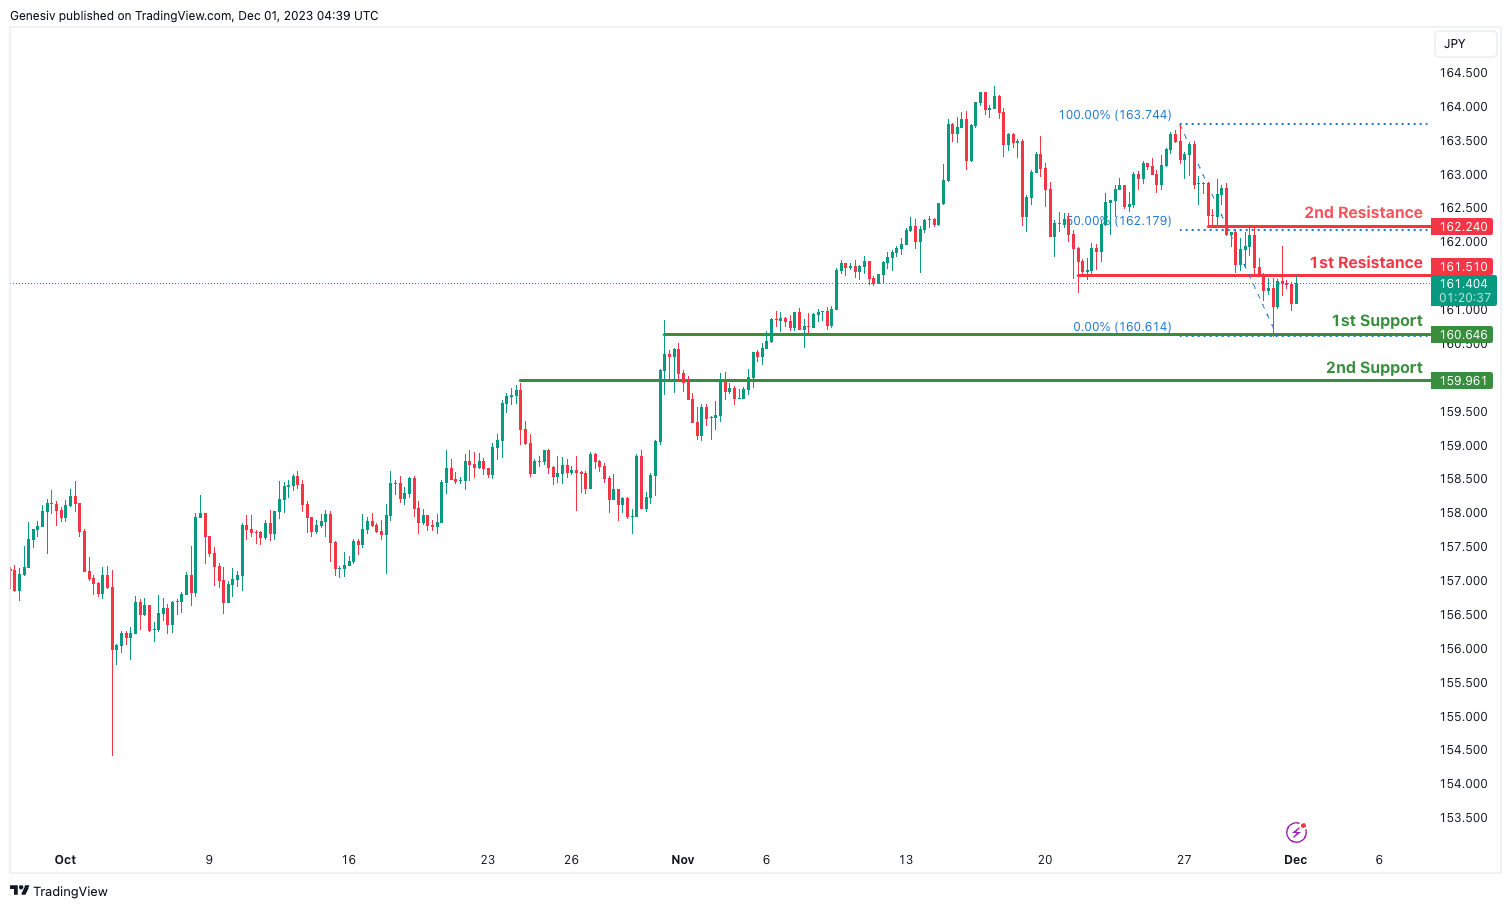
The analyzed instrument is EUR/JPY, and the overall momentum of the chart is currently bearish.
There is a potential for the price to make a bearish reaction off the 1st resistance and drop to the 1st support.
The 1st support level is identified at 160.64, and its favorable characteristic is attributed to being an overlap support.
The 2nd support level is situated at 159.96, and its favorable aspect is derived from being a pullback support.
On the resistance side, the 1st resistance is positioned at 161.51, and it is considered significant due to being an overlap resistance.
The 2nd resistance is located at 162.24, and its significance is derived from being an overlap resistance and aligning with the 50% Fibonacci Retracement.
EUR/GBP:
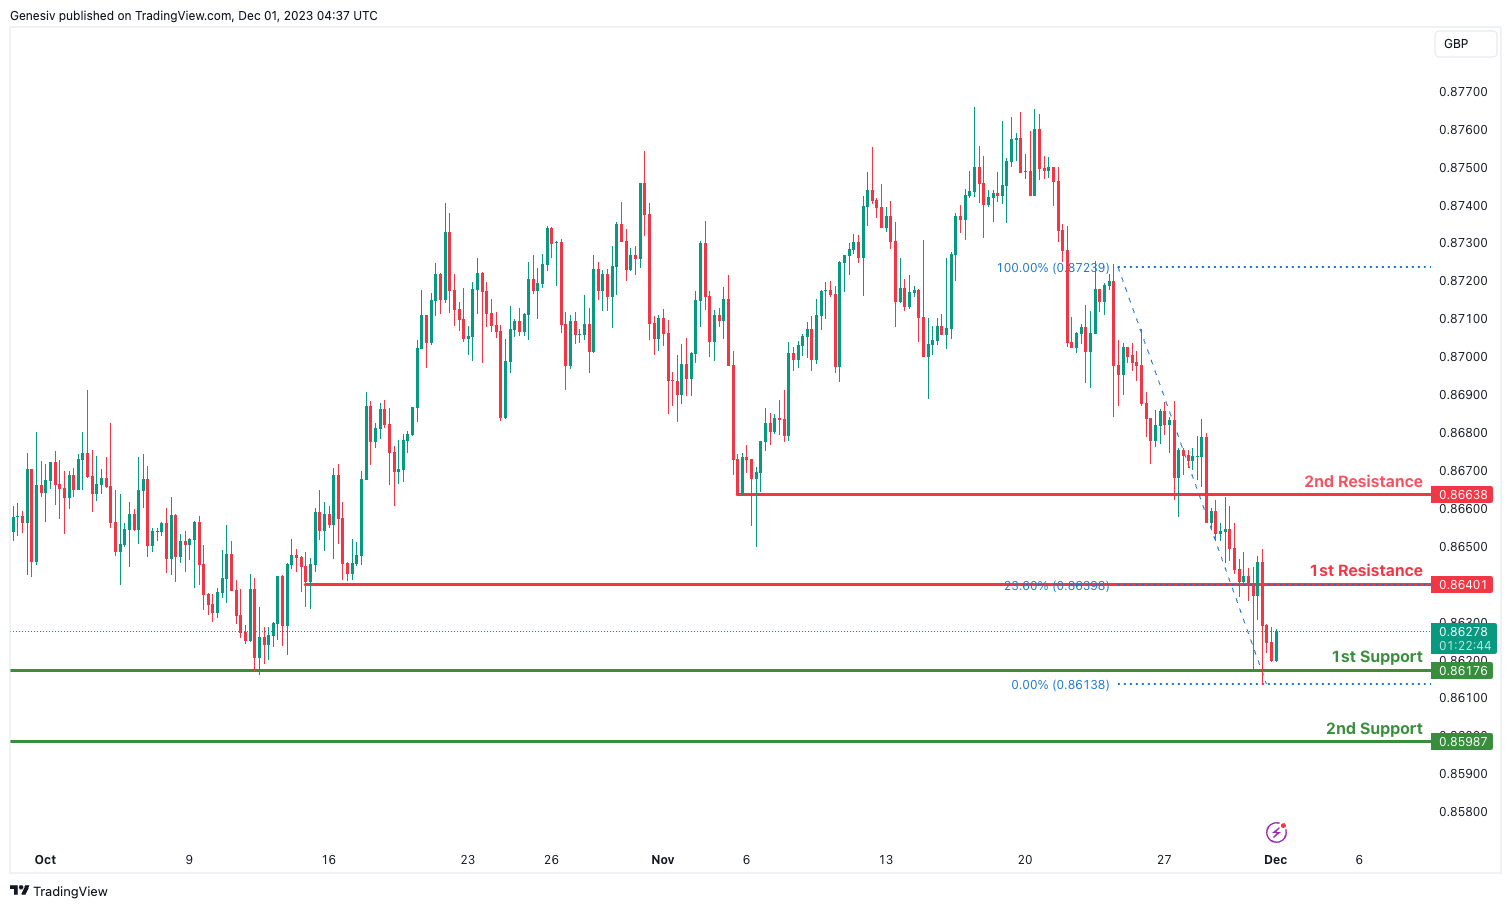
The analyzed instrument is EUR/GBP, and the overall momentum of the chart is currently bullish.
There is a potential for the price to make a bullish continuation towards the 1st resistance.
The 1st support level is identified at 0.8617, and its favorable characteristics include being a multi-swing low support.
The 2nd support level is situated at 0.8598, and its favorable aspect is derived from being a swing low support.
On the resistance side, the 1st resistance is positioned at 0.8640, and it is considered significant due to being a pullback resistance and coinciding with the 23.60% Fibonacci Retracement.
The 2nd resistance is located at 0.8663, and its significance is derived from being an overlap resistance.
GBP/USD:
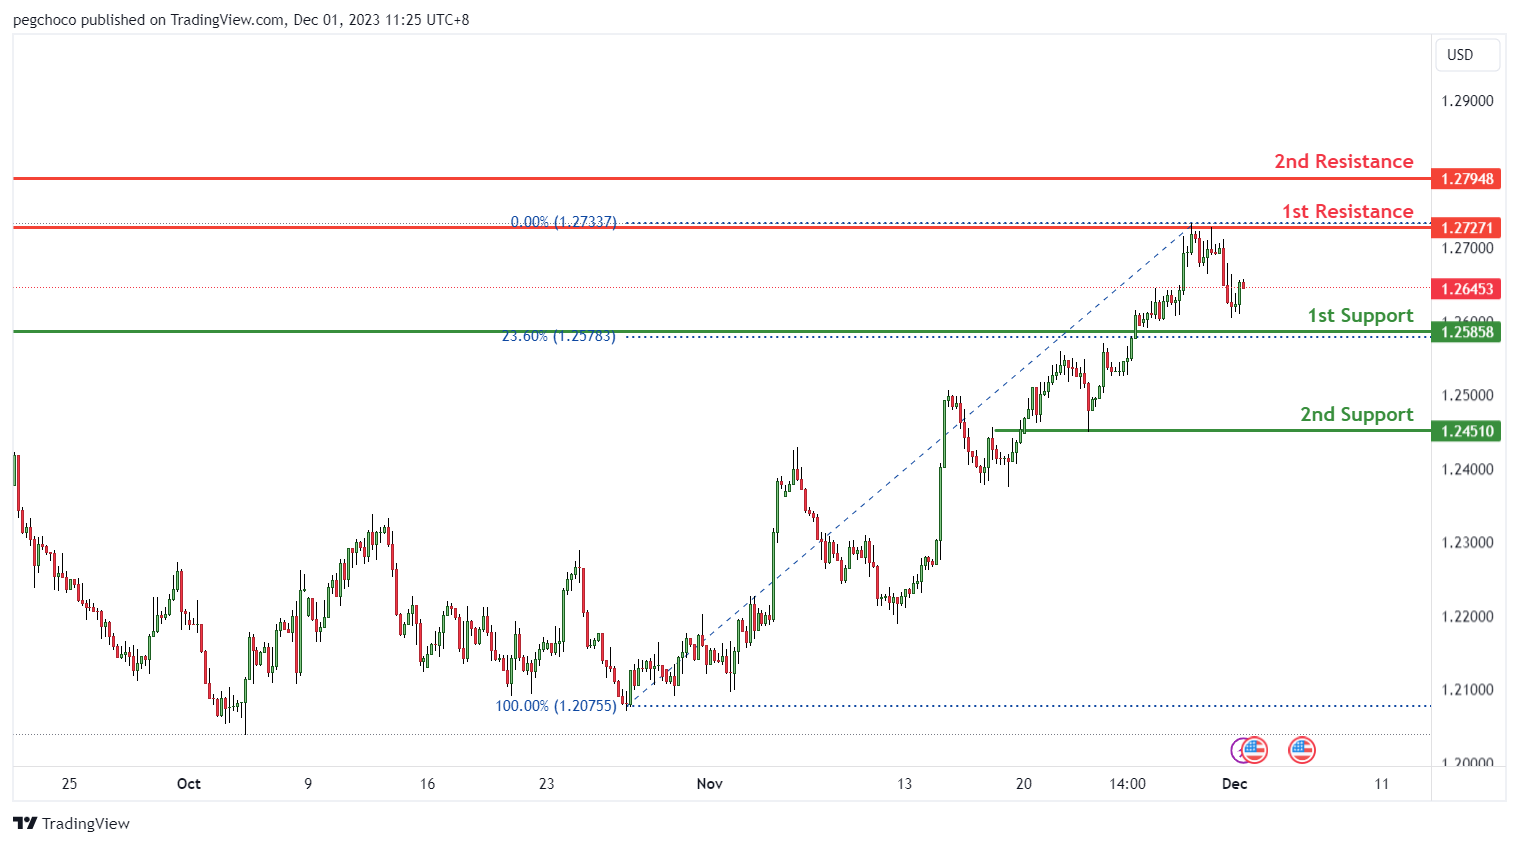
The GBP/USD chart maintains a bullish overall momentum, suggesting potential for a bullish continuation towards the 1st resistance.
The 1st support at 1.2585 is identified as an overlap support, featuring a 23.60% Fibonacci retracement, signifying its significance as a level where buying interest may emerge and reinforce GBP/USD’s upward movement.
The 2nd support at 1.2451 is another overlap support level, adding to its importance as a potential area for buyer activity.
On the resistance side, the 1st resistance at 1.2727 is characterized as an overlap resistance, representing a notable barrier where selling interest could intensify, potentially limiting the currency pair’s upward ascent.
The 2nd resistance at 1.2794 is also noted as an overlap resistance, further strengthening the potential resistance factors for GBP/USD.
GBP/JPY:
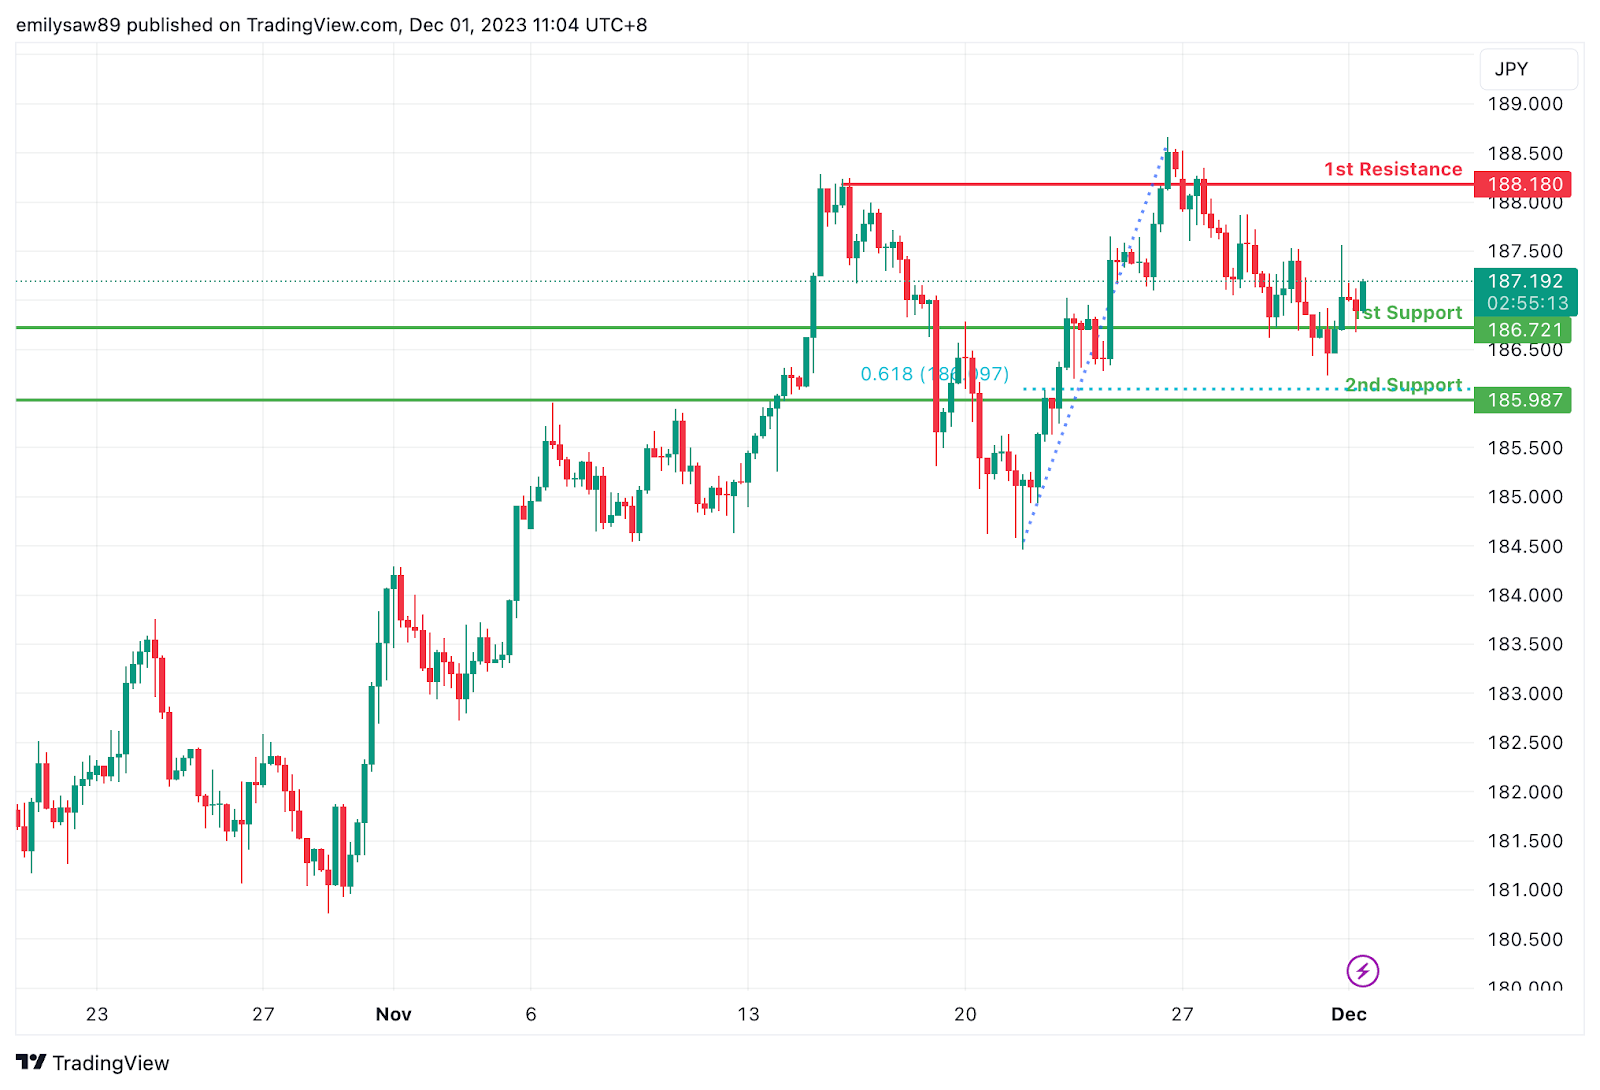
The overall momentum of GBP/JPY is bullish, suggesting a potential continuation of the upward movement in price. There is a possibility that the price could make a bullish bounce off the 1st support and head towards the 1st resistance.
1st support at 186.72: This level is identified as a pullback support, suggesting that it has previously acted as a significant price level where buyers have shown interest. It’s a level to watch for potential bullish reactions or a temporary halt in the bearish momentum.
2nd support at 185.99: The 2nd support level is marked as multi-swing low support, indicating its importance as a potential area of buying interest. Additionally, this level aligns with the 61.8% Fibonacci Retracement, adding strength to the support level. Traders may anticipate potential support around this level.
1st resistance at 188.18: This level is characterised as pullback resistance, as it could indicate a potential pause or correction in the bullish trend.
USD/CHF:
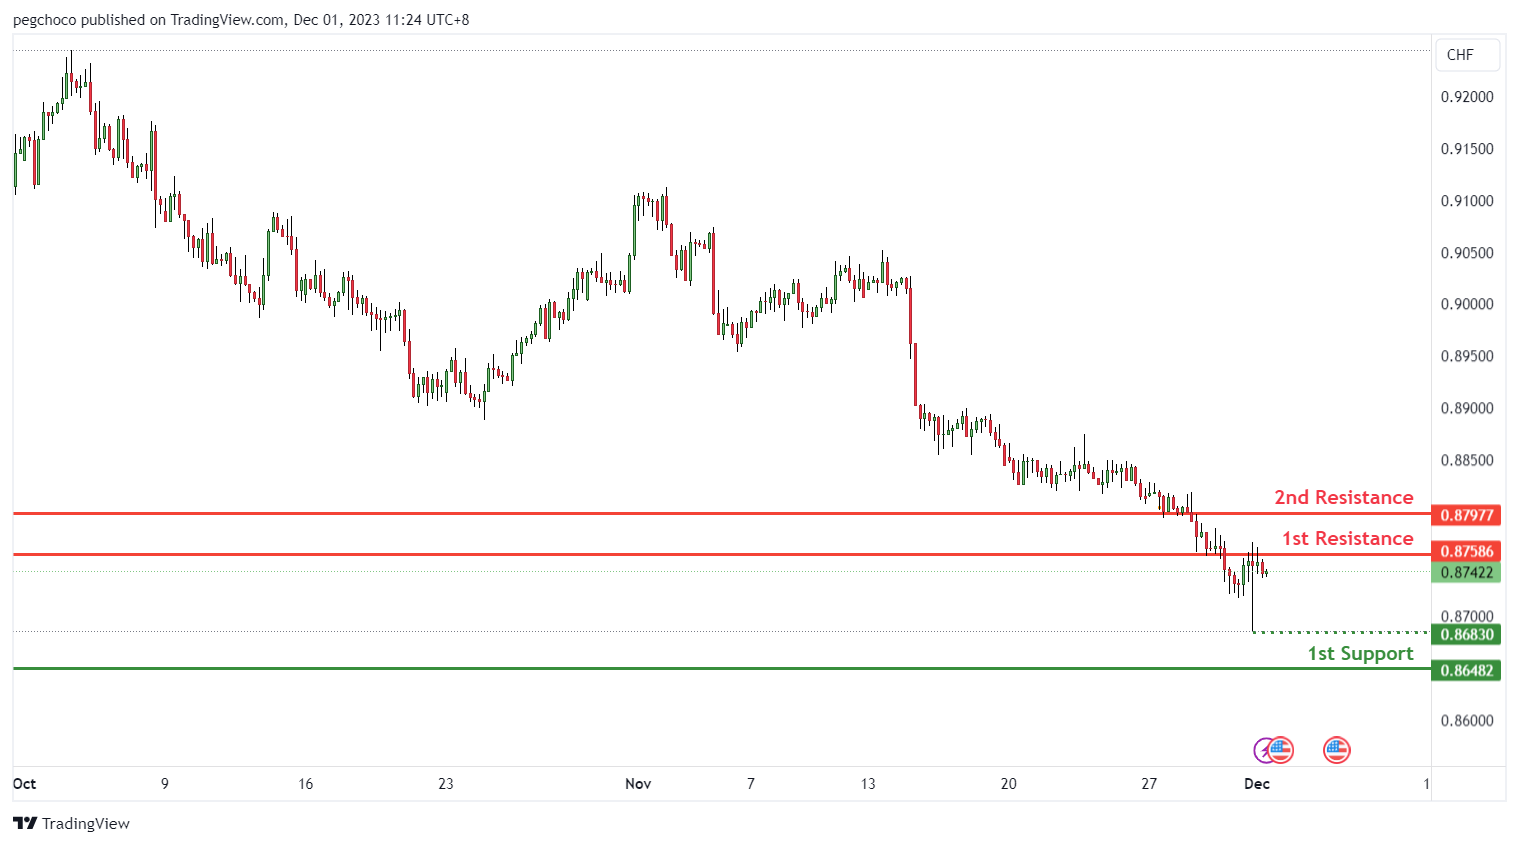
The USD/CHF chart exhibits a bearish overall momentum, indicating potential price action where it may initially rise towards the 1st resistance in the short term before reversing off it and moving downward towards the 1st support.
The 1st support at 0.8648 is identified as a pullback support, signifying its importance as a significant level where buying interest may emerge, potentially providing support for USD/CHF.
An intermediate support level at 0.8683, characterized as a swing low support, adds further significance, potentially reinforcing the support for the currency pair.
On the resistance side, the 1st resistance at 0.8758 is categorized as an overlap resistance, serving as a significant barrier where selling interest could intensify, potentially leading to a reversal in the USD/CHF movement.
Additionally, there is a 2nd resistance at 0.8797, noted as a pullback resistance, further strengthening potential resistance factors for the currency pair.
USD/JPY:
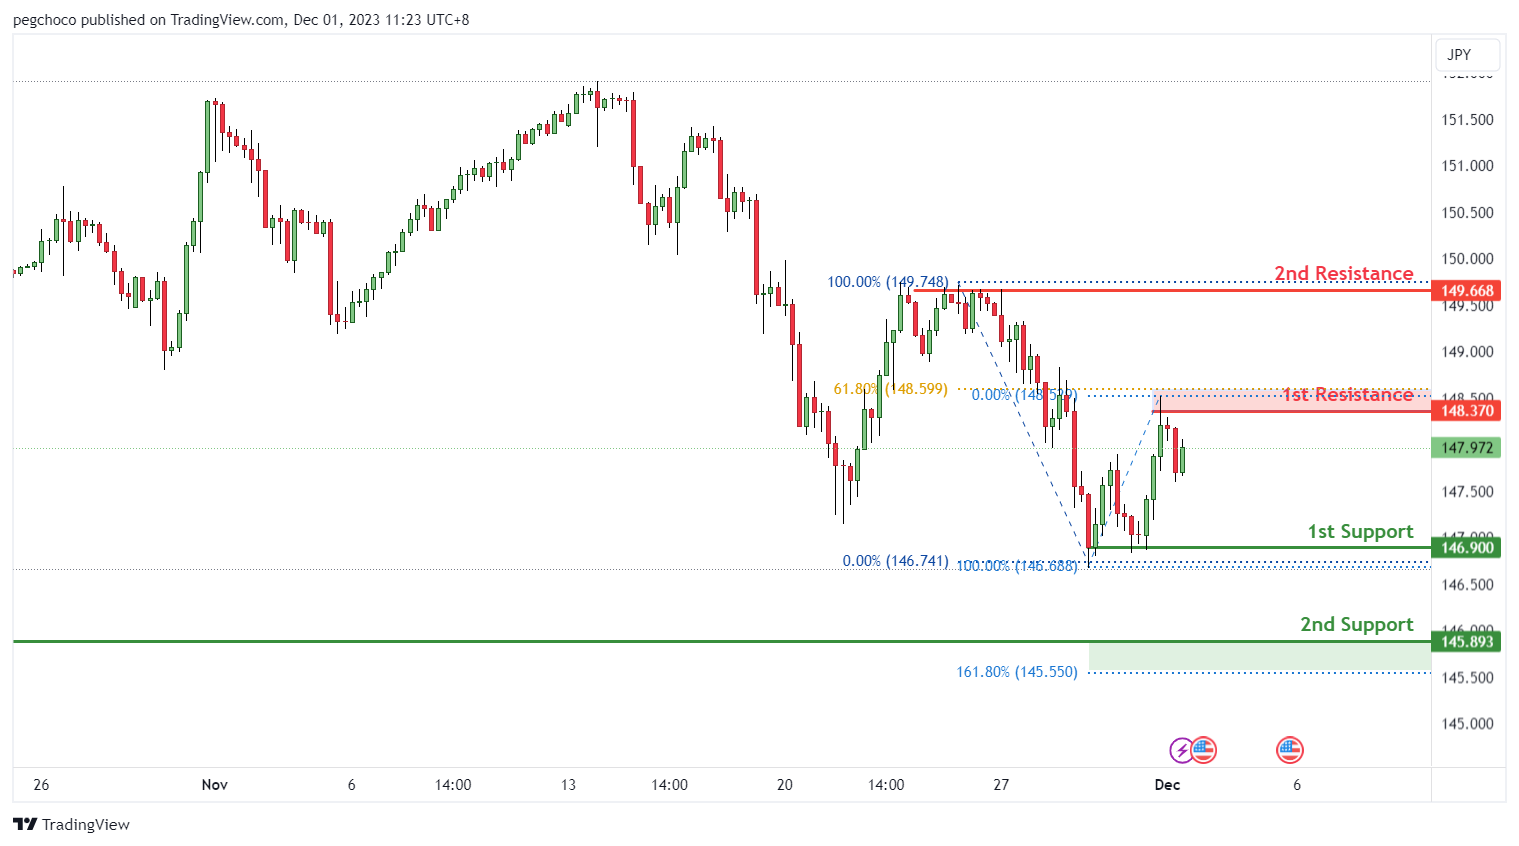
The USD/JPY chart maintains a bearish overall momentum, suggesting potential for a bearish continuation towards the 1st support.
The 1st support at 146.90 is identified as a multi-swing low support, signifying its significance as a level where buying interest may emerge, potentially providing essential support for USD/JPY.
The 2nd support at 145.89 is characterized as a swing low support, adding to its importance as a potential area for buyer activity.
On the resistance side, the 1st resistance at 148.37 is categorized as a swing high resistance, featuring a 61.80% Fibonacci retracement, representing a notable barrier where selling interest could intensify, potentially limiting the currency pair’s upward movement.
The 2nd resistance at 149.66 is also noted as a multi-swing high resistance, further strengthening potential resistance factors for USD/JPY
USD/CAD:
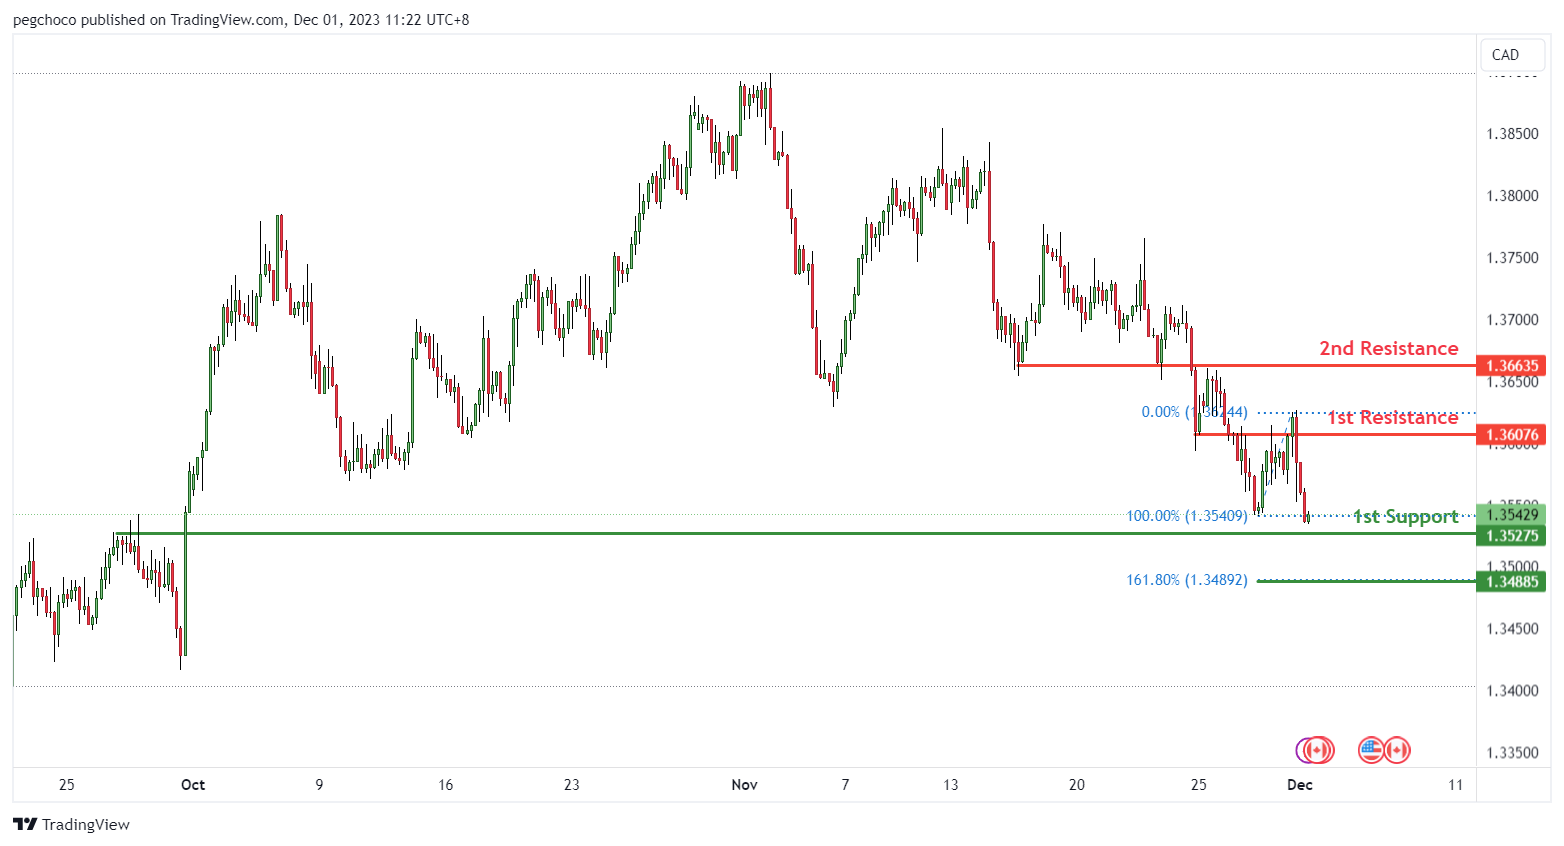
The USD/CAD chart currently displays a bullish overall momentum, indicating potential price action where it may experience a bullish bounce off the 1st support and move towards the 1st resistance.
The 1st support at 1.3527 is identified as a pullback support, signifying its importance as a significant level where buying interest may emerge, potentially providing essential support for USD/CAD.
The 2nd support at 1.3488 features a 161.80% Fibonacci extension, adding to its significance as a potential area for buyer activity, strengthening the support.
On the resistance side, the 1st resistance at 1.3607 is categorized as an overlap resistance, representing a notable barrier where selling interest could intensify, potentially hindering USD/CAD’s upward movement.
Additionally, there is a 2nd resistance at 1.3663, noted as an overlap resistance, further reinforcing potential resistance factors for the currency pair.
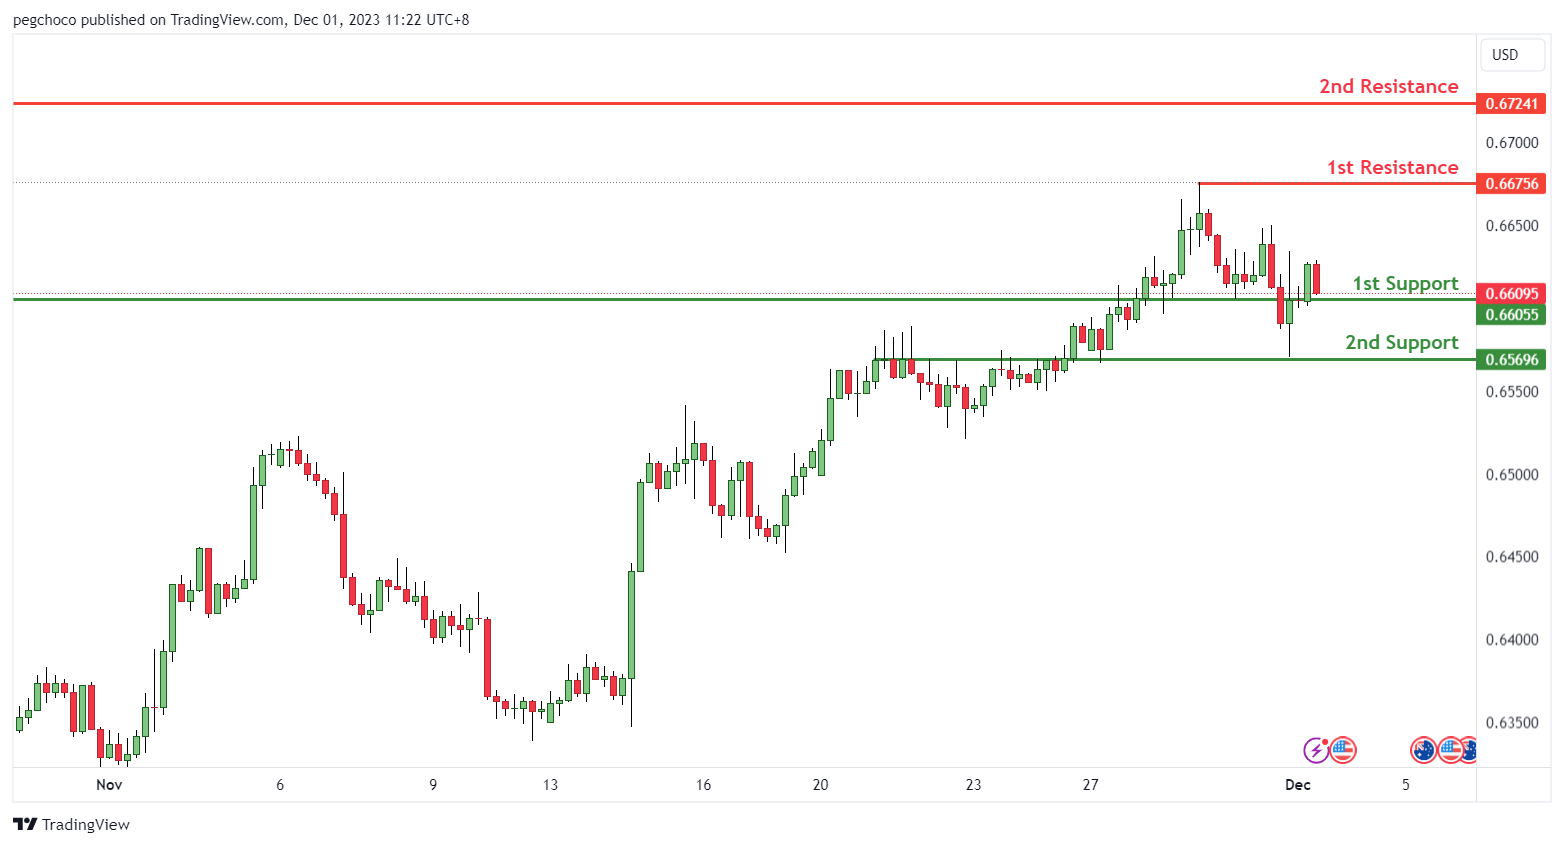
AUD/USD:
The AUD/USD chart currently presents a bearish overall momentum, suggesting potential price action where it may undergo a bearish break off the 1st support and move downward towards the 2nd support.
The 1st support at 0.6605 is identified as an overlap support, signifying its importance as a significant level where buying interest may emerge. However, the bearish momentum could potentially overpower this level.
The 2nd support at 0.6569 is characterized as an overlap support, reinforcing its significance as another potential area for buyer activity.
On the resistance side, the 1st resistance at 0.6675 is categorized as a swing high resistance, representing a notable barrier where selling interest could intensify, potentially preventing AUD/USD from making significant upward progress.
Additionally, there is a 2nd resistance at 0.6724, noted as an overlap resistance, further reinforcing potential resistance factors for the currency pair.
NZD/USD
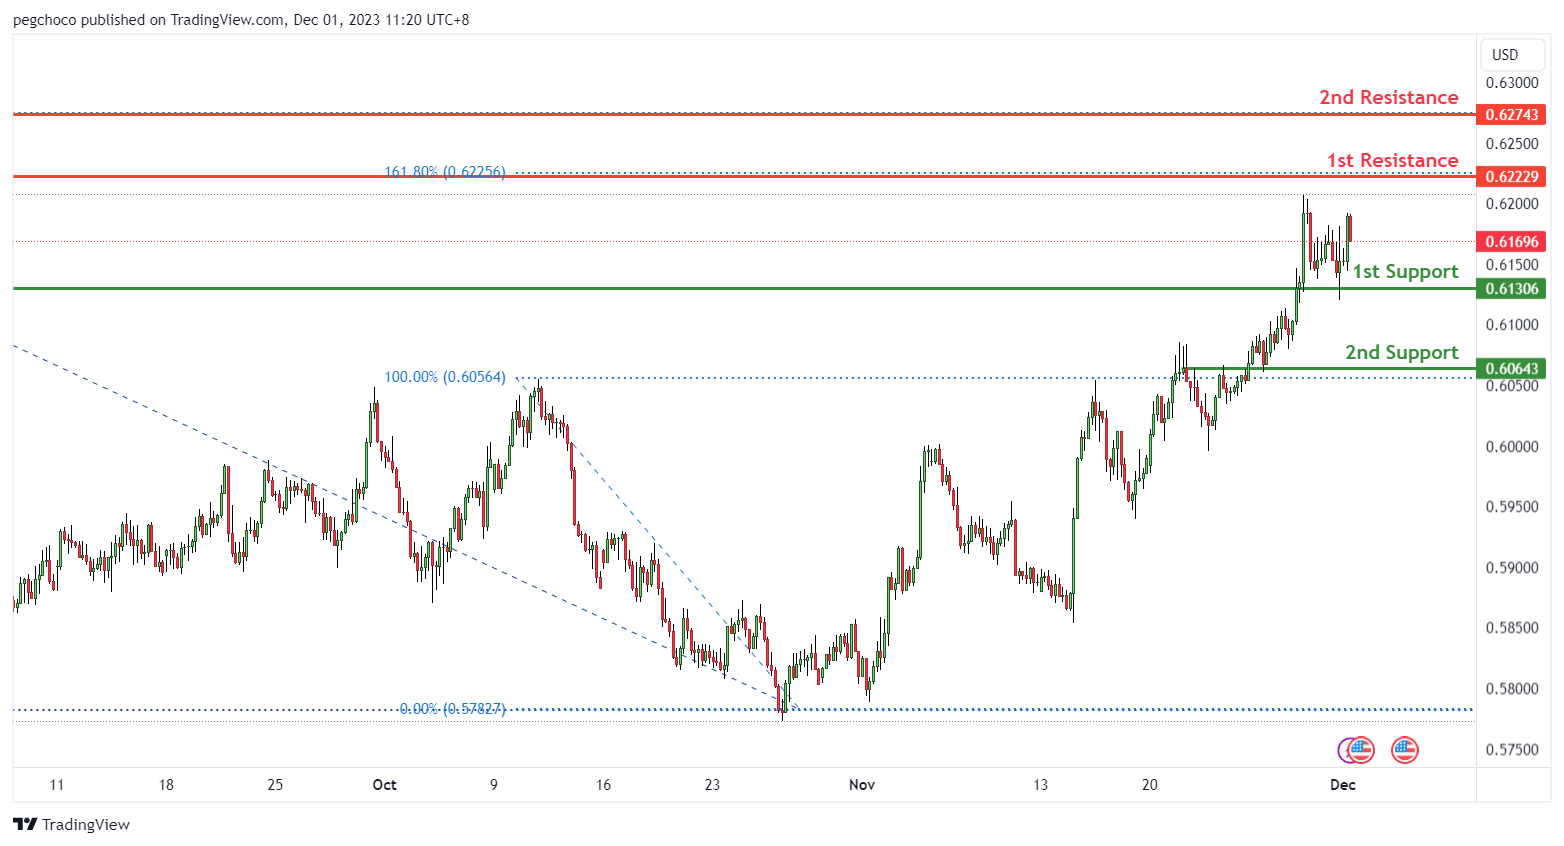
The NZD/USD chart currently exhibits a neutral overall momentum, suggesting potential price action where it may fluctuate between the 1st resistance and the 1st support level.
The 1st support at 0.6130 is identified as an overlap support, signifying its importance as a significant level where buying interest may emerge, potentially providing essential backing for NZD/USD.
The 2nd support at 0.6064 is characterized as an overlap support, adding to its significance as a potential area for buyer activity.
On the resistance side, the 1st resistance at 0.6222 is categorized as a swing high resistance, featuring a 161.80% Fibonacci extension, representing a notable barrier where selling interest could intensify, potentially limiting the currency pair’s upward movement.
Additionally, there is a 2nd resistance at 0.6274, noted as an overlap resistance, further reinforcing potential resistance factors for NZD/USD.
DJ30:
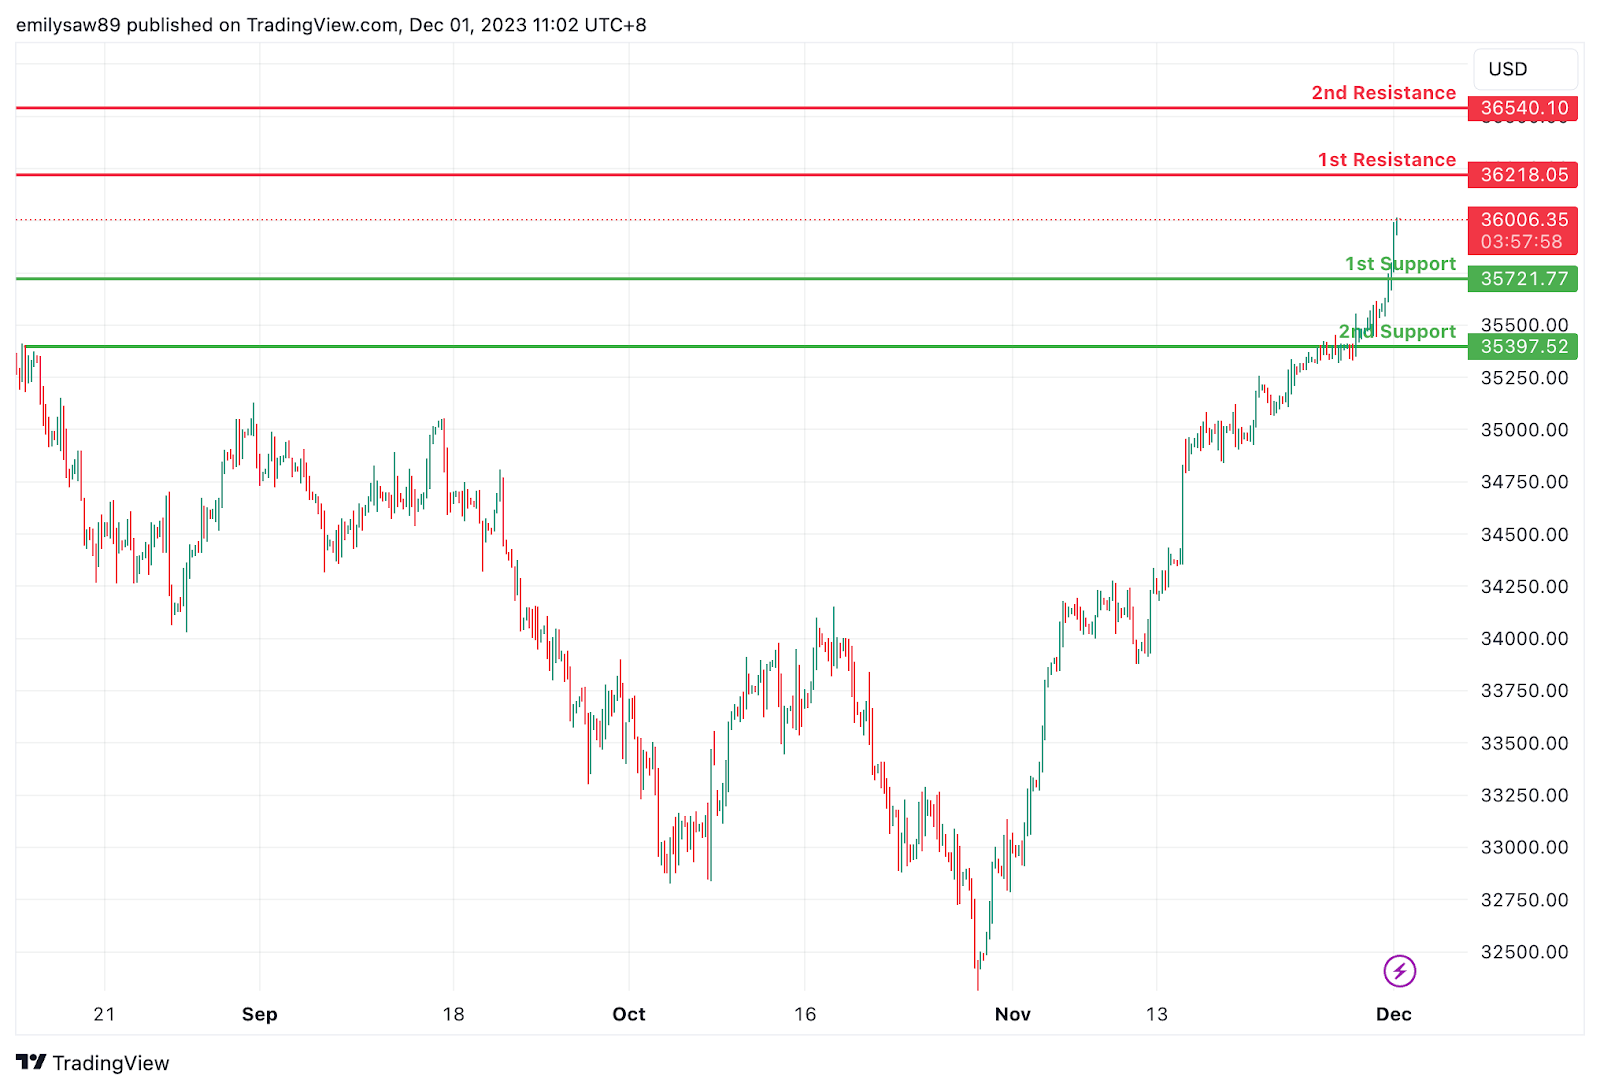
The DJ30,the momentum of the chart is bullish, suggesting a potential continuation of the upward movement in price. There is a possibility that the price could experience a bullish bounce off the 1st support level and head towards the 1st resistance.
1st support at 35721.77: This level is identified as a multi-swing low support, indicating that it has previously acted as a significant price level where buyers have stepped in. It is a level to watch for potential bullish reactions or a temporary pause in the upward momentum.
2nd support at 35721.77: The 2nd support level is marked as a pullback support, suggesting that if the price experiences a pullback, it may find support at this level. Pullback supports are significant in maintaining the overall upward momentum.
1st resistance at 36218.05: This level is considered a pullback resistance, this level may pose a temporary challenge for the price movement. Traders should monitor how the price reacts around this level, as it could indicate a potential pause or correction in the bullish trend.
2nd resistance at 36540.10: This level is considered as swing high resistance, representing a historical point where the market previously faced selling pressure. Breaking through this resistance could signify a strong bullish move.
GER40:
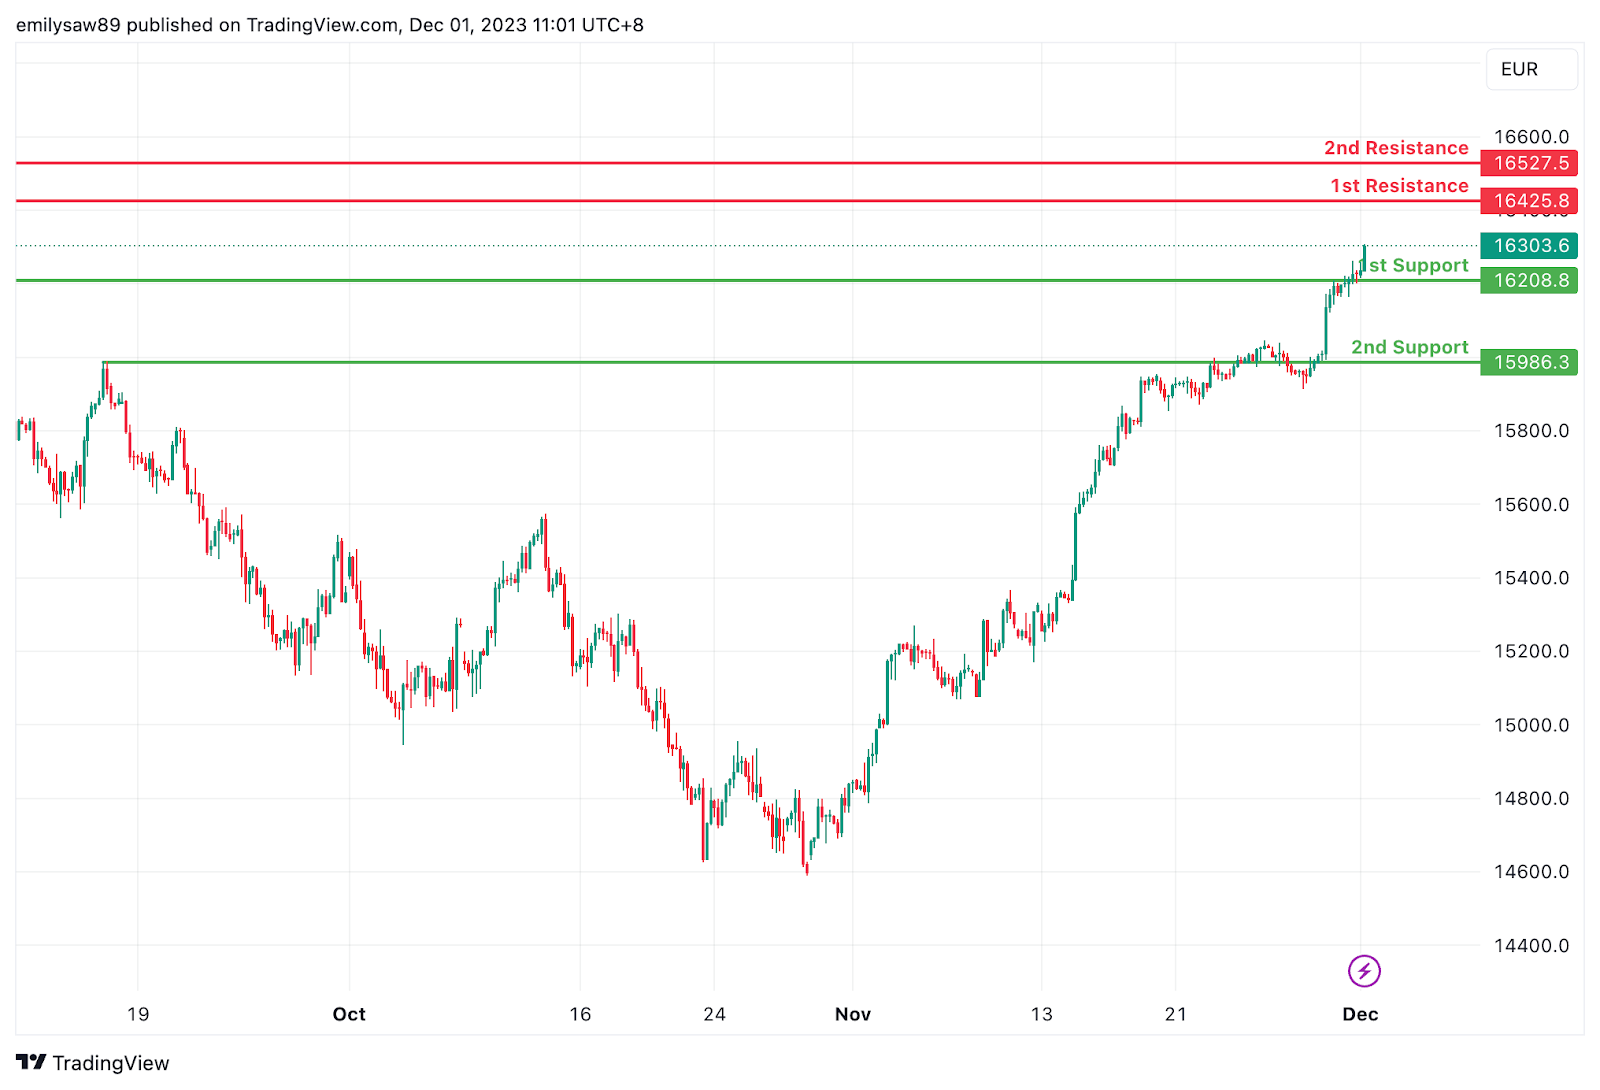
The GER40 overall momentum is bullish, suggesting a potential continuation of the upward movement in price.There is a possibility that the price could experience a bullish bounce off the 1st support and head towards the 1st resistance.
1st support at 16208.8: This level is identified as a pullback support, indicating that it has previously acted as a significant price level where buyers have shown interest.This level is expected to provide support during a potential pullback in the price.
2nd support at 15986.3: The 2nd support level is marked as a multi-swing low support, suggesting that it aligns with historical price data and is likely to be a strong support level. It may serve as a critical level for traders to watch for potential rebounds or consolidation.
1st resistance at 162425.8: This level is considered a pullback resistance, indicating that it could be a point where selling pressure may increase, potentially leading to a temporary halt or correction in the bearish trend.
2nd resistance at 16527.5: The 2nd resistance level is marked as a swing high resistance, suggesting it has previously acted as a barrier to upward price movements. It could serve as a strong resistance level if the price attempts to move higher.
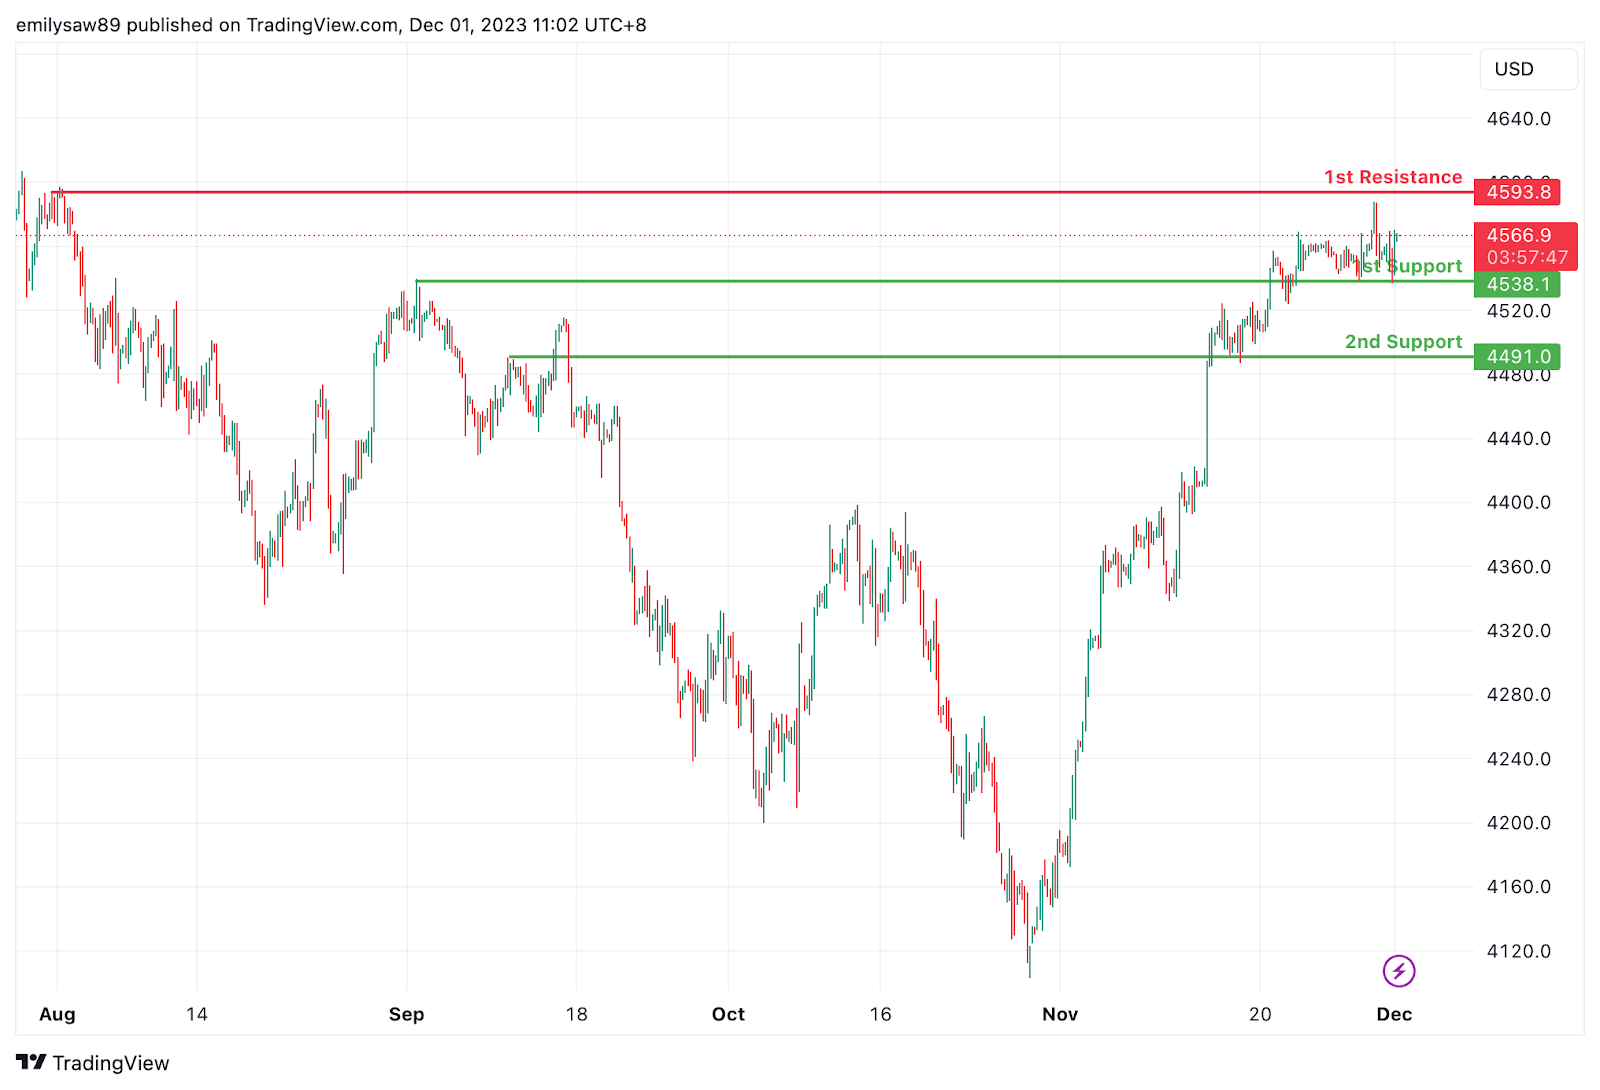
US500:
The overall momentum of US500 is bullish, suggesting a potential continuation of the upward movement in price.
1st support at 4538.1: This level is identified as a pullback support, indicating that it has previously acted as a significant price level where buyers have shown interest. It may serve as a potential area of support This level is expected to provide support during potential pullbacks in the price.
2nd support at 4491.0: The 2nd support level is marked as a multi-swing low support, suggesting that it aligns with historical price data and is likely to be a strong support level. It may be considered a critical level for traders to watch for potential rebounds or consolidation.
1st resistance at 4593.8: This level is considered a pullback resistance, indicating that it could be a point where selling pressure may increase, potentially leading to a temporary correction within the bearish trend.
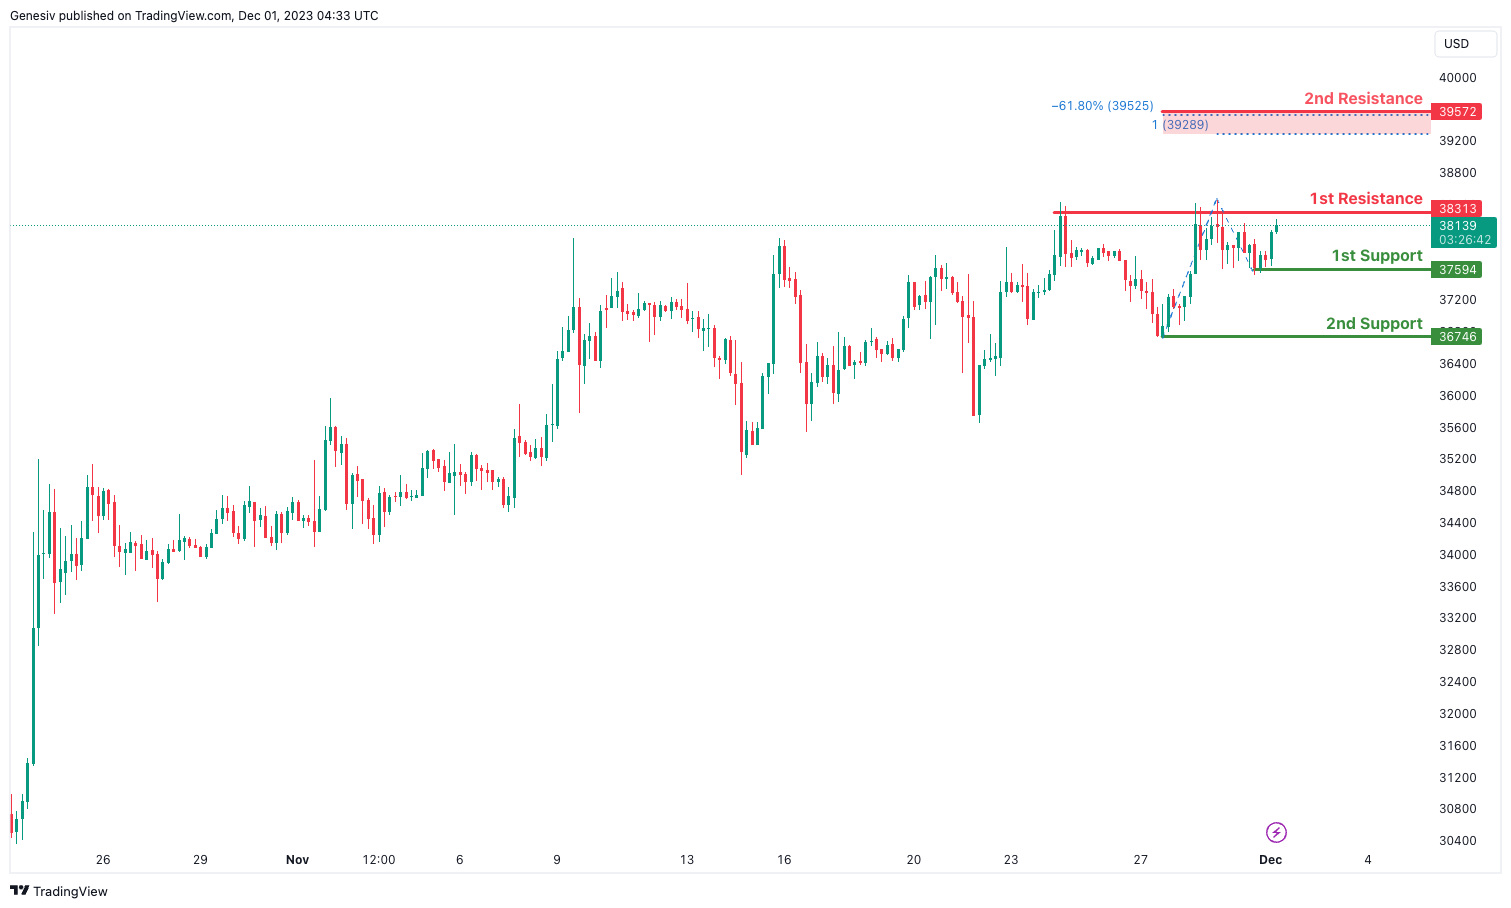
BTC/USD:
The analyzed instrument is BTC/USD, and the overall momentum of the chart is currently bullish.
There is a potential for the price to make a bullish continuation towards the 1st resistance.
The 1st support level is identified at 37594, and its favorable characteristic is attributed to being a swing low support.
The 2nd support level is situated at 36746, and its favorable aspect is derived from being a swing low support.
On the resistance side, the 1st resistance is positioned at 38313, and it is considered significant due to being a multi-swing high resistance.
The 2nd resistance is located at 39752, and its significance is derived from coinciding with the 61.80% Fibonacci Expansion and the 100% Fibonacci Projection, indicating Fibonacci confluence.
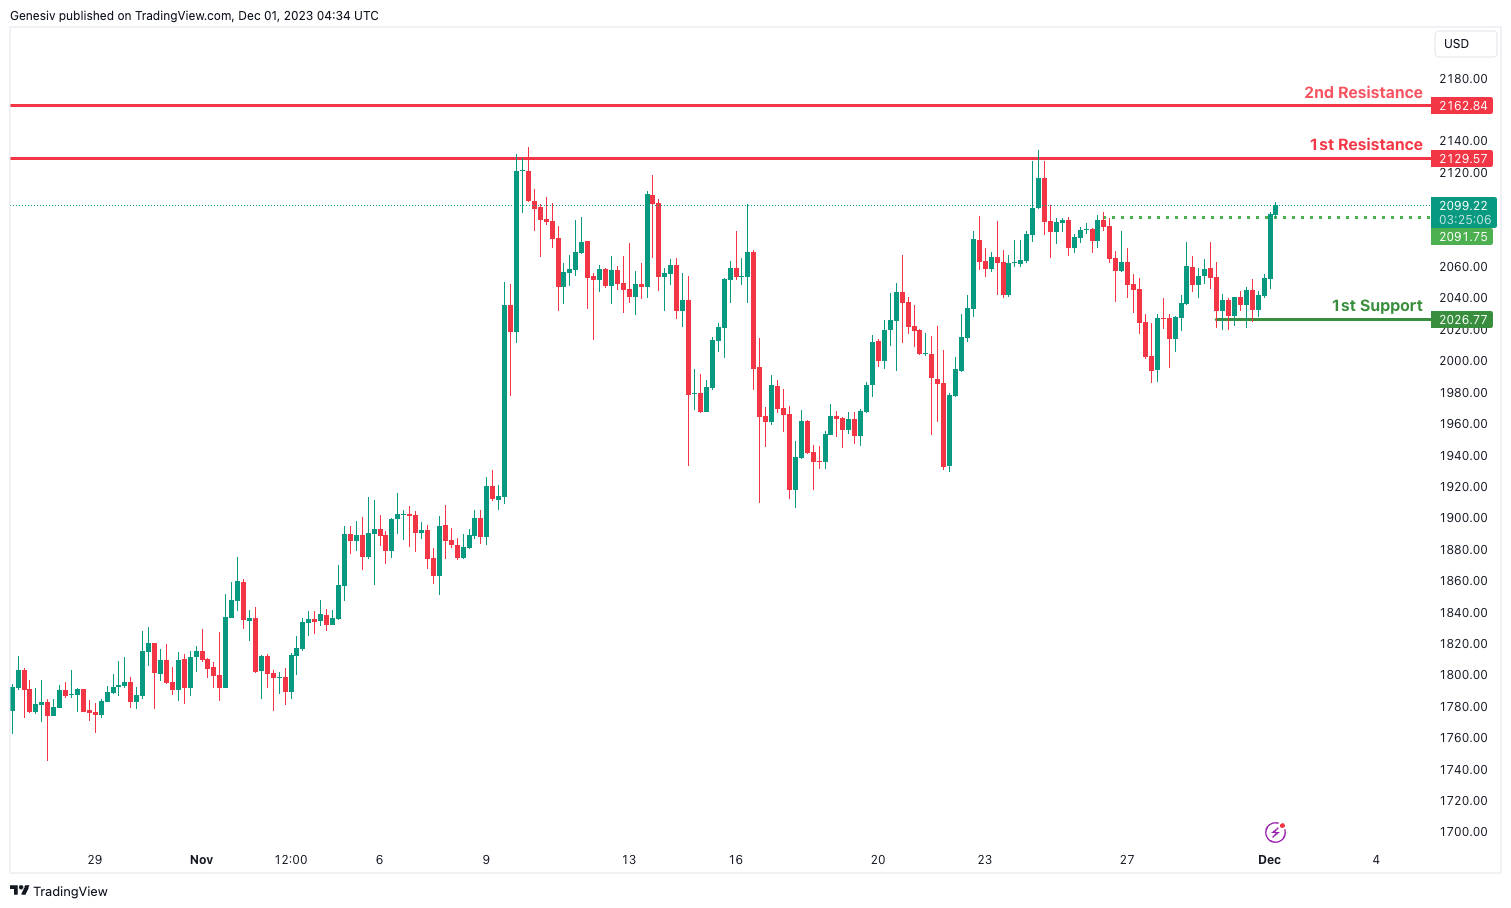
ETH/USD:
The analyzed instrument is ETH/USD, and the overall momentum of the chart is currently bullish.
There is a potential for the price to make a bullish continuation towards the 1st resistance.
The 1st support level is identified at 2026.77, and its favorable characteristic is attributed to being a multi-swing low support.
An intermediate support is also noted at 2091.75, and its significance is derived from being a pullback support.
On the resistance side, the 1st resistance is positioned at 2129.57, and it is considered significant due to being a multi-swing high resistance.
The 2nd resistance is located at 2162.84, and its significance is derived from being an overlap resistance.
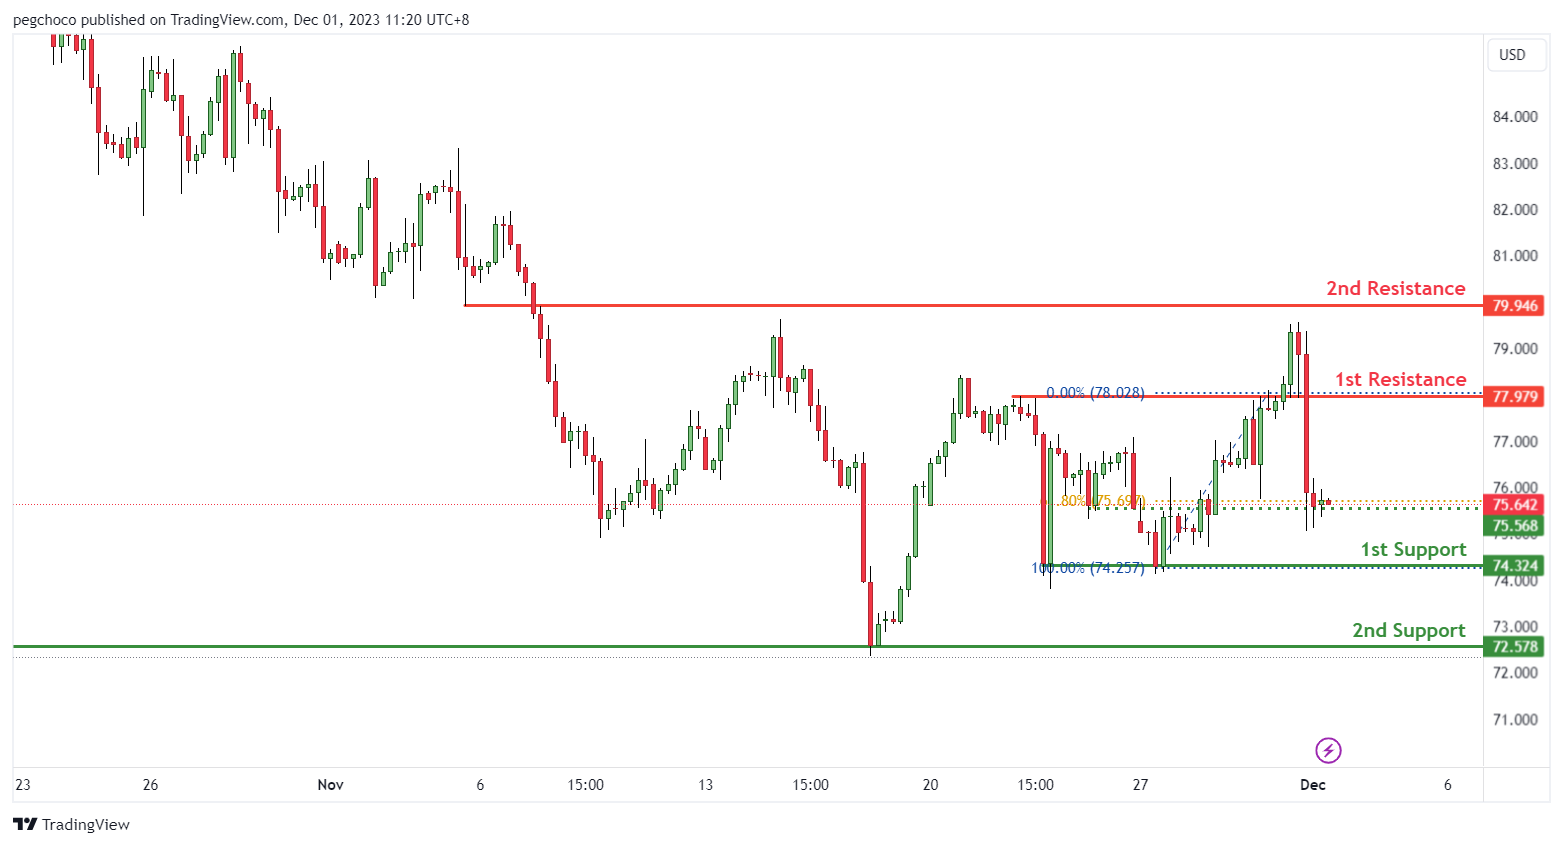
WTI/USD:
The WTI (West Texas Intermediate) chart currently displays a bearish overall momentum, indicating the potential for a bearish continuation towards the 1st support.
The 1st support at 74.32 is identified as a multi-swing low support, signifying its importance as a significant level where buying interest may emerge, potentially providing crucial support for WTI’s price.
The 2nd support at 72.57 is characterized as an overlap support, reinforcing its significance as a potential area for buyer activity.
On the resistance side, the 1st resistance at 77.97 represents a multi-swing high resistance, serving as a notable barrier where selling interest could intensify, potentially hindering further upward movement in the price of WTI.
Additionally, there is a 2nd resistance at 79.94, noted as a pullback resistance, further reinforcing potential resistance factors for the commodity.
Furthermore, an intermediate support level at 75.56 is identified as an overlap support with a 61.80% Fibonacci retracement, adding to its significance as a potential support level.
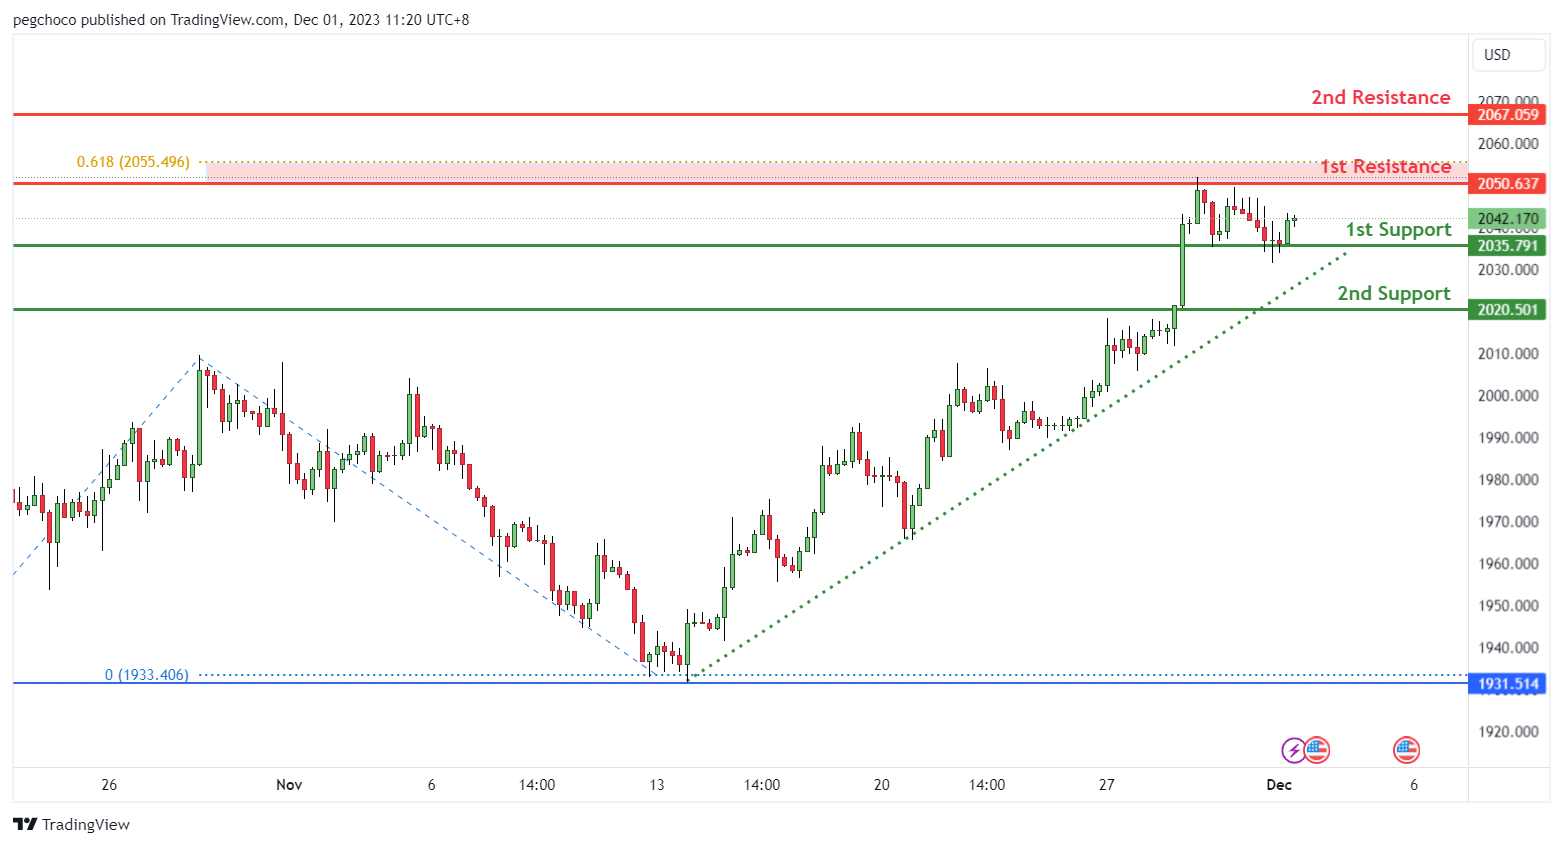
XAU/USD (GOLD):
The XAU/USD (Gold) chart demonstrates a bullish overall momentum, suggesting potential for a bullish bounce off the 1st support and movement towards the 1st resistance.
The 1st support at 2035.79 is identified as an overlap support, signifying its importance as a significant level where buying interest may emerge, potentially providing essential backing for XAU/USD.
The 2nd support at 2020.50 is categorized as pullback support, reinforcing its significance as a potential area for buyer activity.
On the resistance side, the 1st resistance at 2050.63 is characterized as a swing high resistance, featuring a 61.80% Fibonacci projection, representing a notable barrier where selling interest could intensify, potentially slowing XAU/USD’s upward movement.
The 2nd resistance at 2067.05 is also noted as a multi-swing high resistance, further reinforcing potential resistance factors for the precious metal.
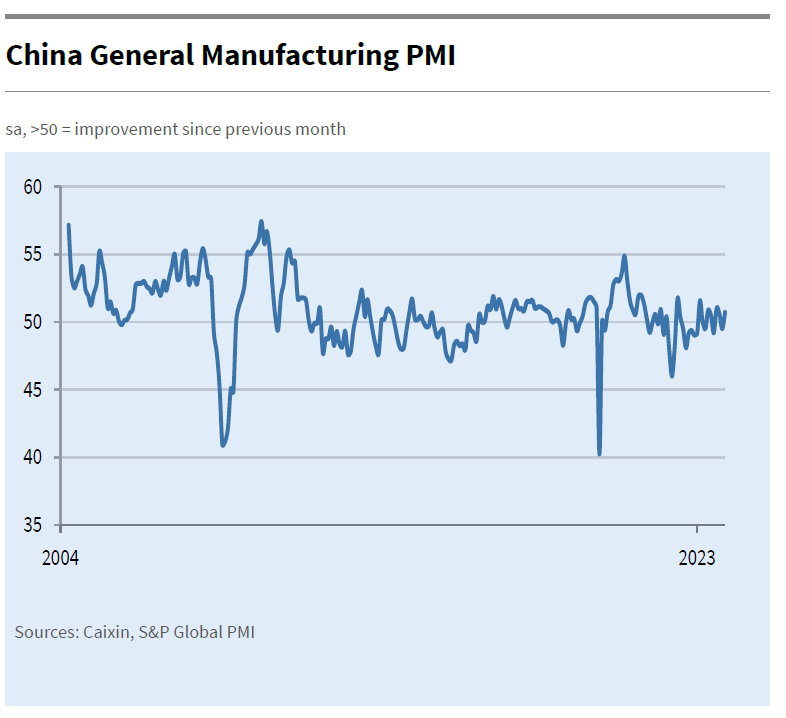
China’s Caixin PMI manufacturing rises to 50.7, back to growth amidst challenges
China's Caixin PMI Manufacturing index climbed from 49.5 to 50.7 in November, surpassing the expected 49.3. According to Caixin's release, this improvement is attributed to sustained rise in total new work, which helped push production back into growth territory. Additionally, there was softer reduction in employment and uptick in business confidence, reaching a four-month high.
Wang Zhe, Senior Economist at Caixin Insight Group, noted, "Overall, the manufacturing sector improved in November." He cited several factors contributing to this improvement: expansion in supply and demand, stable prices, improved logistics, increased purchasing quantities, and a more optimistic outlook among manufacturers. However, he also pointed out some ongoing challenges, such as sluggish external demand, weak employment, and cautious inventory management by manufacturers.
Wang also commented on the broader macroeconomic context, stating, "The macro economy has been recovering." He observed improvements in household consumption, industrial production, and market expectations. Despite these positive signs, he cautioned that both domestic and foreign demand remain insufficient, employment pressures are high, and the economic recovery is still searching for a solid footing.
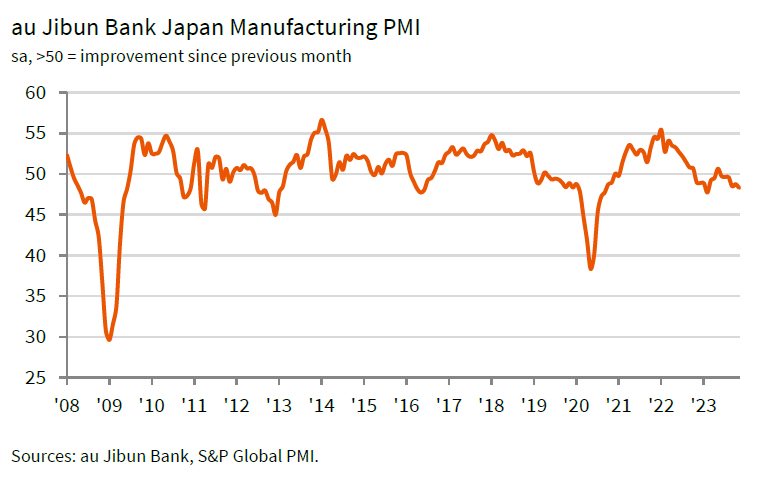
Japan’s PMI manufacturing finalized at 48.3, contraction continues yet optimistic
November saw Japan's Manufacturing PMI finalized at 48.3, a slight decline from October's 48.7. This figure, reported by S&P Global, indicates a continued contraction in the manufacturing sector, with more pronounced decreases in output and new order inflows. The PMI reaching its lowest since February signals a challenging phase for the sector, primarily due to weakened demand both domestically and internationally.
Usamah Bhatti of S&P Global Market Intelligence commented on the sector's performance, noting, "The headline PMI slipped deeper into contraction territory, largely due to quicker deteriorations in output and new order inflows." He identified weak customer demand across both domestic and international markets as key factors behind this downturn.
On the inflation front, although inflationary pressures remained high, there was a noticeable easing. Input cost inflation slowed down to a three-month low, and selling price inflation reduced to its softest since July 2021. This easing in inflation suggests some relief in cost pressures for manufacturers.
Despite the current contraction, Japanese manufacturers are holding onto a sense of optimism for the future. Bhatti emphasized this positive outlook, stating, "Manufacturers remained optimistic that muted demand and production conditions would lift over the coming year." This confidence is underpinned by expectations of a boost in demand, spurred by new product launches, particularly in the semiconductor sector.
RBNZ’s Hawkesby highlights inflation pressure from record migration
RBNZ Deputy Governor Christian Hawkesby provided insights into the central bank's current monetary policy and the economic outlook in an interview today. He discussed timing of rate cuts, and impact of rising immigration.
RBNZ's revised forecast does not foresee rate cuts until mid-2025. Explaining the rationale behind the delayed rate cuts, Hawkesby emphasized the need for RBNZ to ensure that inflation expectations are securely re-anchored. He also pointed out that the New Zealand economy had experienced overheating and now requires a period of cooling, marked by a negative output gap.
The interview also highlighted the impact of recent demographic shifts on the The RBNZ had initially perceived rising immigration as a mitigating factor for inflation risk, considering its potential to alleviate labor shortages and reduce wage pressure. However, Hawkesby revealed that the immigration surge has been more significant than anticipated, now contributing to increased demand in the economy.
Hawkesby remarked, "Net migration has peaked at higher levels, so that's news in itself, important news." He further explained that the "demand-side impacts" of this trend are becoming more evident. He added, "The fact you have got to house a bigger population and the impact that that has, particularly on rental inflation and things like that."
New Zealand's population witnessed a substantial increase of 2.7% in the year through September, the largest in over three decades, with net annual immigration reaching a record high of 118,835.
Cliff Notes: Constructive Policy Developments
Key insights from the week that was.
In Australia, the Monthly CPI Indicator fell 0.3% in October, pulling the annual rate of inflation down from 5.6%yr to 4.9%yr; encouragingly for policy, there were no convincing upside surprises within the detail. Indeed, goods prices – which constitute the bulk of the new information at this point in the quarter – reportedly fell 0.1% in the month, with weakness across household contents (–1.6%mth) and certain footwear/garment prices that are measured quarterly. The main driver of the headline result was a decline in services inflation (–0.7%mth); note though, a partial reversal could be seen next month when a larger portion of the services basket is surveyed.
Other consumer data received this week was also on the softer side. Nominal retail sales declined by 0.2% in October after September’s 0.9% gain. Abstracting from inflation and population growth, real per capita retail spending is experiencing a sharp decline in the realm of –4.5%yr to –5.0%yr. Another ‘noisy’ month for dwelling approvals did little to shift the underlying narrative: approvals are holding at weak levels and signs of a sustainable recovery are limited, suggesting that housing availability and affordability will continue to have a significant bearing on prices and rents. For a comprehensive update on the current state of Australia’s housing market and its prospects, see the latest edition of Westpac’s Housing Pulse.
As discussed by Chief Economist Luci Ellis, the data flow since the RBA’s November meeting has not provided any further material upside surprises. But, over the last few weeks, RBA Governor Bullock has devoted much effort to explaining the nuances around Australia’s inflation outlook. The take-away message is that if inflation threatens to take any longer to return to target than currently expected, the RBA Board would respond by tightening policy further. Such risks will certainly be front-of-mind early next year, though we still believe inflation will most likely decelerate through year-end and 2024, removing the need for further increases in the cash rate. Once inflation is convincingly heading towards target, there will be room to begin easing policy, most likely from Q3 2024. Over this period and into the medium-term, labour and capital’s cost and productivity will remain critical for policy.
In the lead-up to the Q3 GDP report, this week the ABS also released two partial indicators of investment.
It was revealed that construction activity lifted by 1.3% in the quarter, spot on Westpac’s forecast. The detail continues to highlight a growing contribution from public works (+4.2%qtr), centred on infrastructure projects; while private construction is tracking a flattening trend at an elevated level (–0.7%qtr). Housing activity continues to experience mixed fortunes, with new dwelling construction still 0.7% below its pre-COVID level while renovation activity is 16.1% higher.
The Q3 CAPEX survey subsequently delivered an upside surprise relative to our expectations, with a 0.6% lift in current activity. The 0.5% gain in aggregate equipment spending was constructive, though the mining and non-mining sector performances were distinct (+5.9% vs. –0.5%). On spending intentions, the fourth estimate for 2023/24 CAPEX plans remained optimistic, up 10% compared to the fourth estimate a year ago. In our view, that implies a 9% rise in nominal CAPEX spending over the financial year. However, momentum is likely to fade as the impetus from tax incentives wanes and the drag from softer demand becomes increasingly evident.
Following the stronger result on equipment spending, we have lifted our Q3 GDP forecast slightly to 0.4% (1.8%yr).
In the US, anecdotes from the 12 Federal Reserve districts were captured in the latest Beige Book. On activity, goods demand was perceived to have weakened, but services held up. Scaling the turn in aggregate momentum, “two [Districts indicated] conditions were flat to slightly down, and six [noted] slight declines in activity” compared to only “four Districts reporting modest growth”. Signs of labour market cooling were also evident with applicants more readily available and firms comfortable letting go of weak performers. Businesses also sought fewer loans while consumer credit remained robust; that said, delinquencies among consumers ticked up according to some banks. In this context, FOMC members' comments through the week indicated optimism that a soft landing was being achieved and that present policy settings were sufficient to rein in inflation.
Adding weight to this view was October’s PCE deflator which came in flat month-on-month, 3%yr. The components were in line with the recent CPI outcome and suggest that inflation’s next leg down will need to come from the shelter component. Personal income and spending both rose 0.2%mth; but over the year, income growth has outpaced spending, highlighting consumer restraint. The pace of real income growth will be critical in determining the degree to which consumption and GDP fall below trend in 2024 and the likely recovery thereafter. Significant job shedding, which the Beige Book hints is a risk, would destabilise income growth and lead to much weaker GDP outcomes. Financial and credit conditions are also critical.
Over in Europe, the flash CPI slowed to 2.4%yr in November from 2.9%yr, the core measure also improving materially to 3.6%yr from 4.2%yr. The deceleration was driven by a surprisingly large slowdown in services inflation from 4.6%yr to 4.0%yr. While on the surface the result supports the case for a near-term pivot to rate cuts, the European Central Bank's Nagel made clear that risks remain “skewed to the upside” and would not rule out further hikes if inflation accelerated once more.
In Asia, China's NBS PMIs were broadly unchanged in November. Manufacturing input prices declined 1.9pts, reflecting the impact of excess capacity in the economy alongside easing global supply pressures. Output prices improved, but the index remained below 50. Further downward pressure on prices will support global goods deflation; it is important to recognise that this trend stems as much from increased capacity, productivity and efficiency as it does soft demand. The non-manufacturing PMI meanwhile held just above 50. Helpfully, employment and new orders look to be stabilising, albeit at a weak level.
USD/JPY Faces Resistance While Oil Prices Recover
Key Highlights
- USD/JPY is facing many hurdles near 148.00.
- A major bearish trend line is forming with resistance near 148.10 on the 4-hour chart.
- Gold prices jumped toward $2,050 before it faced resistance.
- Crude oil prices are recovering losses and trading above $75.50.
USD/JPY Technical Analysis
The US Dollar saw a major decline from well above 149.50 against the Japanese Yen. USD/JPY declined below the 148.50 and 148.00 support levels to enter a bearish zone.
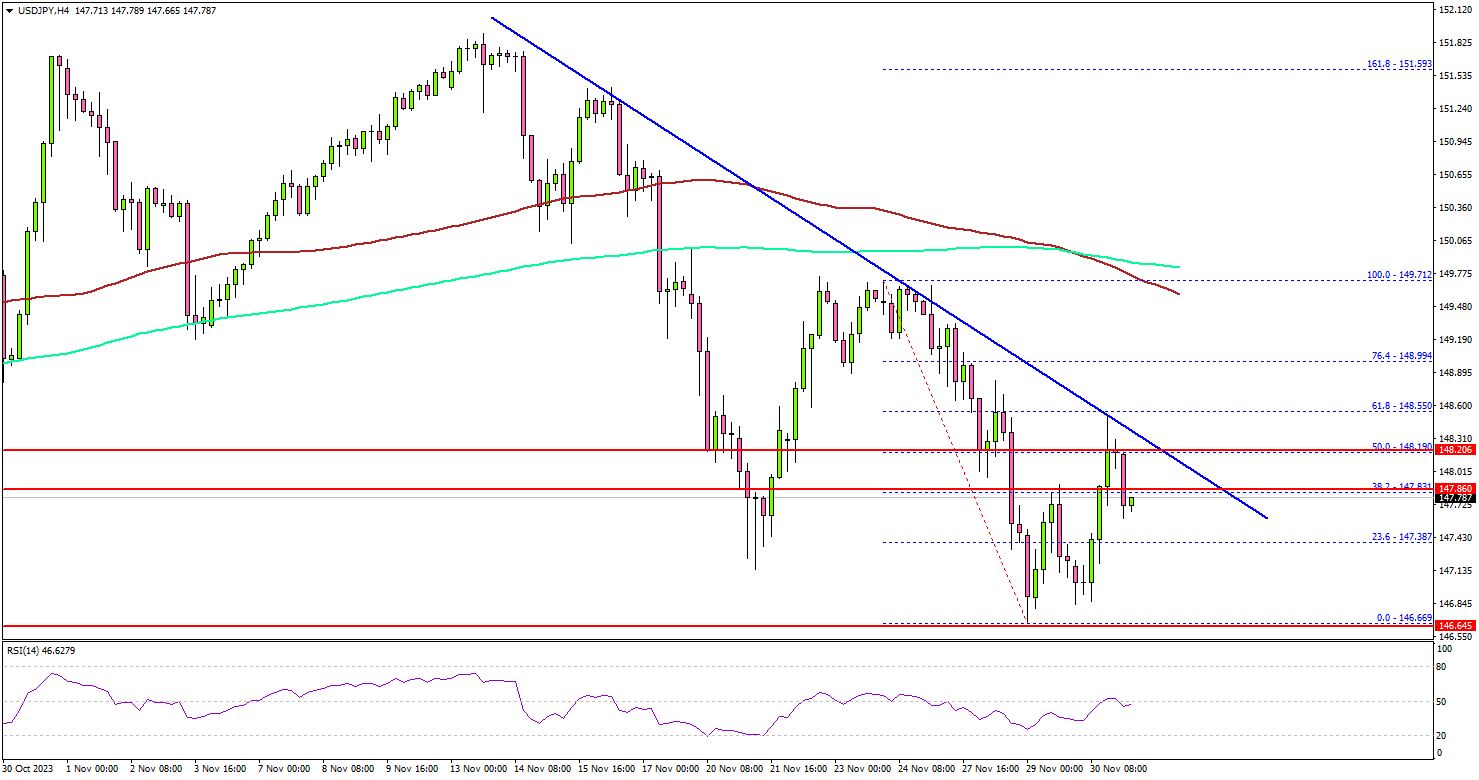
Looking at the 4-hour chart, the pair settled below the 148.00 level, the 100 simple moving average (red, 4 hours), and the 200 simple moving average (green, 4 hours).
It even spiked below the 147.00 level. A low was formed near 146.6 before the pair started an upside correction. There was a minor increase above the 147.20 level. The pair surpassed the 23.6% Fib retracement level of the downward move from the 149.71 swing high to the 146.66 low.
On the upside, immediate resistance is near the 148.00 level. The next key resistance is near the 148.20 level or the trend line. It coincides with the 50% Fib retracement level of the downward move from the 149.71 swing high to the 146.66 low.
A close above the 148.20 zone could open the doors for more upsides. The next stop for the bulls might be 148.80. If not, USD/JPY might resume its decline. Immediate support is near the 147.00 level.
The next key support sits at 146.65, below which the pair could test the 145.00 pivot level in the near term. Any more losses might call for a move toward 143.20.
Looking at Gold, there was a strong increase above the $2,025 resistance but the bears remained active near $2,050.
Economic Releases
- Germany Manufacturing PMI for Nov 2023 - Forecast 42.3, versus 42.3 previous.
- Euro Zone Manufacturing PMI for Nov 2023 – Forecast 43.8, versus 43.8 previous.
- UK Manufacturing PMI for Nov 2023 – Forecast 46.6, versus 46.7 previous.
- US Manufacturing PMI for Nov 2023 – Forecast 49.4, versus 49.4 previous.
- US ISM Manufacturing PMI for Nov 2023 – Forecast 47.6, versus 46.7 previous.