Sample Category Title
Oil Hits 111 USD/bbl as Iran Rejects US Ceasefire Proposal
In focus today
Focus continues to be on tensions in the Middle East, keeping oil markets and risk sentiment on edge.
Swedish inflation tops the domestic agenda, where we expect core inflation at 1.5% whilst higher energy prices will push CPIF up to 2.2%, from previously 1.7%. Compared to our previous forecast, the inflation path has been revised upwards, reflecting our view that traffic through the Strait of Hormuz will remain subdued for an extended period, exerting pressure on supply chains. Note that as this is the flash inflation print, we will not receive any details but must wait another week for them. Additionally, we also receive services, and composite, PMIs today.
In the euro area, final services PMI and composite PMI for March will be released. The flash estimate showed the composite PMI declining to 50.5 from 51.9 in February, while the services PMI fell to 50.1 from 51.9, indicating near-stalling growth in the sector.
In Denmark, Danmarks Nationalbank's press release on March FX reserves will be published in the afternoon, revealing whether the central bank intervened in the FX market in March.
Overnight, we expect the Reserve Bank of New Zealand (RBNZ) to keep its monetary policy unchanged in line with market pricing and consensus. Markets expect RBNZ to hike rates most likely in Q3 this year.
For the rest of the week, developments in the Iran war will continue to be the main market driver. Furthermore, from the US, we will look out for the minutes from the FOMC's March meeting released on Wednesday evening, and both February PCE and final Q4 GDP figures released on Thursday. Friday will bring flash inflation figures for March from China, Denmark, Norway and the US.
Economic and market news
What happened since Wednesday
The US-Iran conflict escalated further on Monday as Iran rejected a US ceasefire proposal brokered by Pakistan, which called for an immediate halt to hostilities followed by broader peace talks to be concluded within 15 to 20 days. Instead, Iran issued a response consisting of 10 clauses, demanding a permanent end to the war with the US and Israel, the lifting of sanctions, and safe passage through the Strait of Hormuz. President Trump dismissed the Iranian response and issued a stark warning threatening massive strikes if his demands for Iran to reopen the Strait of Hormuz are not met by Tuesday evening. Trump has repeatedly threatened strikes on Iranian energy and transport infrastructure, while experts have noted that strikes on civilian infrastructure, such as power plants and bridges, would constitute war crimes. At the time of writing, Brent crude prices have risen to 111 USD/bbl as markets assess the risks to global energy supply.
In the US, Friday's March jobs report came in stronger than expected, with payrolls growing by 178k (cons: +65k, Danske: +30k), while the unemployment rate fell to 4.3% (cons: 4.4%, Danske: 4.5%). However, February's figures were revised down further to show a decline of 133k jobs instead of 92k. Average hourly earnings growth eased to 0.2% from 0.4% in February, and the average work week dipped slightly to 34.2 hours from 34.3. Despite these softer details, the overall report was robust, reflecting a rebound from February, which was affected by bad weather and a nurses' strike. Importantly, the data primarily reflects the second week of March, so the impact of the Iran conflict and surging oil prices is not yet visible. However, recent indicators, including a decline in job postings and softer employment in the March PMI, suggest potential headwinds for the labour market in the months ahead.
US February retail sales also surprised to the upside, with headline growth at 0.6% m/m SA and core retail sales (control group) rising by 0.5% m/m SA. However, the February retail sales data do not yet reflect potential sentiment effects from the ongoing conflict in Iran. The ISM manufacturing report for March also revealed notable developments, with the prices paid index surging to 78.3 (cons: 73.0, prior: 70.5), while new orders declined to 53.5 from 55.8 in February. The ISM services PMI also disappointed, falling to 54.0 in March (cons: 54.9, prior: 56.1). The prices paid component jumped to 70.7, the highest since October 2022, likely reflecting inflationary pressures from both the Iran conflict and lingering tariff effects.
Also in the US, St. Louis Fed President Musalem (non-voter) stated on Wednesday that the current policy stance remains appropriate despite rising inflation risks tied to the Middle East conflict. He warned that persistent supply shocks could have a lasting impact on inflation expectations and highlighted the need to closely monitor core inflation
In the euro area, unemployment rose slightly to 6.2% in February from 6.1%, driven by a 137k increase in unemployed persons. The modest uptick is not a clear dovish signal for ECB given the data's monthly volatility and earlier revisions. Despite the February increase, the number of unemployed persons remains below end-2025 levels.
In Sweden, March manufacturing PMI rose to 56.3, but the details revealed signs of supply disruptions. Delivery times increased significantly, contributing most to the higher PMI, though the rise likely reflects supply chain issues rather than stronger demand. Input prices also surged to their highest level since October 2022, driven by higher energy costs and global price pressures tied to the Middle East conflict. Furthermore, new orders fell sharply.
In South Korea, Samsung Electronics reported record Q1 operating profit of 57.2 trillion won, which represents nearly triple its previous record and exceeds its entire 2025 profit. The chipmaker's semiconductor division generated 95% of total profit as supply shortages from AI data centre requirements constrained traditional chip availability while soaring AI chip demand has pushed up memory prices over 50%.
Goldman Sachs' private credit fund defied industry-wide redemption pressures with withdrawal requests of just under 5% in Q1, staying below its quarterly cap, while the broader private credit industry faces surging withdrawals. The outperformance comes as fears over AI disruption eroding software companies' earnings and loan repayment ability have rattled the sector, prompting several asset managers to cap redemptions at 5%.
Equities: Equity markets traded broadly sideways over the Easter period in the regions that remained open, following the rebound seen into the holiday. Importantly, this does not change the bigger picture: global equities are still ~4% above the recent lows, reflecting a market that is increasingly pricing when - not if - we get a de-escalation in the Middle East.
The underlying assumption remains that a ceasefire and/or broader stabilization would imply a partial (if not full) reopening of the Strait of Hormuz, easing constraints on global energy supply. This view is increasingly supported by a pick-up in bilateral agreements, particularly between Asian economies and Iran, allowing some oil flows to resume via alternative arrangements. Cyclicals have, not surprisingly, outperformed from the lows. More notably, however, volatility has declined across regions and asset classes, reinforcing the notion that investors are trying to look through the near-term noise. Markets in the US edged higher yesterday, while Asian trading this morning is mixed. European futures are slightly firmer, catching up with US moves, whereas US futures are marginally softer.
FI and FX: With most of Europe off for Easter, yesterday saw choppy price action amid thin volumes across the FX market. NOK outperformed within G10 and EUR/NOK retraced all of Friday's gains and is now back at 11.20. On the other end of the scale, we find the SEK, that continues to underperform. EUR/SEK was rejected at support around 10.85 and is back trading above 10.90 to start this morning. US yields have remained relatively stable over the Easter period, and EUR/USD held resistance at 1.1570 yesterday, and looks to start the day with a move to the lower 1.15's.
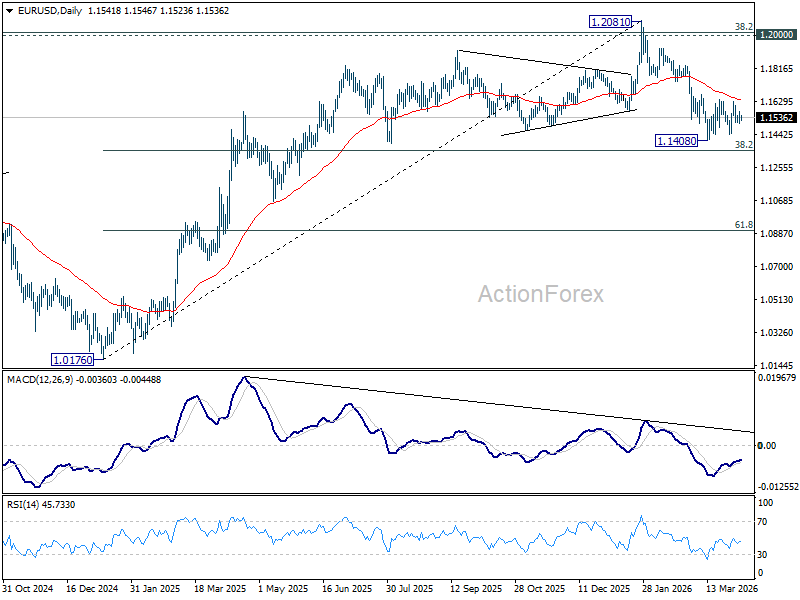
EUR/USD Daily Outlook
Daily Pivots: (S1) 1.1508; (P) 1.1540; (R1) 1.1575; More….
EUR/USD dips mildly today, but stays well inside established range above 1.1408. Intraday bias remains neutral and more consolidations could be seen. With 1.1666 cluster resistance (38.2% retracement of 1.2081 to 1.1408 at 1.1665) intact, further decline is expected. On the downside, firm break of 1.1408 will resume the fall from 1.2081 to 38.2% retracement of 1.0176 to 1.2081 at 1.1353. However, decisive break of 1.1666 will argue that the fall from 1.2081 has completed, and turn bias back to the upside for 61.8% retracement of 1.2081 to 1.1408 at 1.1824.
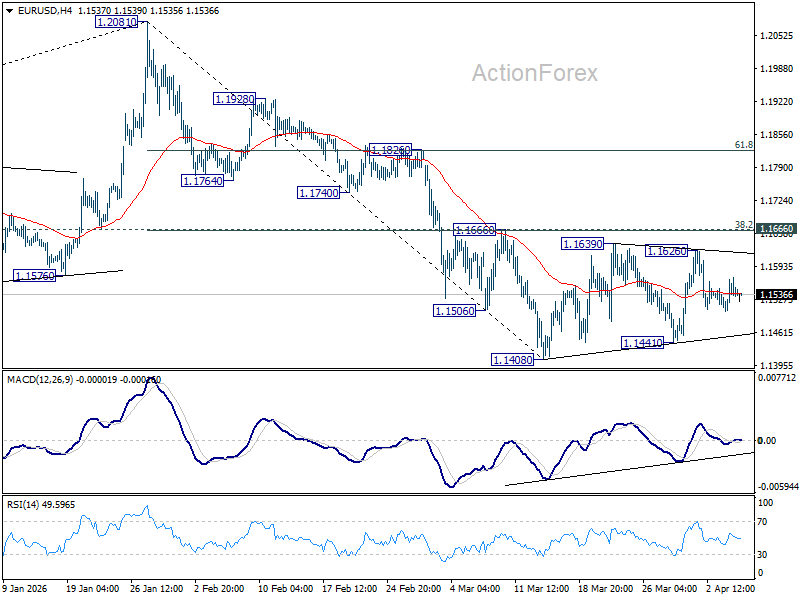
In the bigger picture, prior break of 55 W EMA (now at 1.5011) should confirm rejection by 1.2 key cluster resistance level. The whole up trend from 0.9534 (2022 low) might have completed as a three wave corrective rise too. Deeper fall is expected to long term channel support (now at 1.0535). Meanwhile, risk will stay on the downside as long as 1.2081 holds, even in case of strong rebound.
Oil Nears $120 Point of No Return as Trump Deadline Looms and Hormuz “Toll Booth” Battle Decides Outcome
Oil is nearing a $120 breaking point as US President Donald Trump’s Iran deadline looms, with markets increasingly focused on whether the US–Iran battle for Hormuz control will tip into full escalation. The urgency is rising as the “Power Plant Day” deadline approaches, with no clear resolution in sight. Markets are no longer reacting to headlines but positioning for an outcome, as the Hormuz “toll booth” battle increasingly defines the conflict. With WTI already above $116 and Brent pushing toward $115, crude is approaching the 120 escalation threshold, a level that would signal a shift from pricing risk to pricing a "generational energy crisis".
Despite ongoing diplomatic noises, including a 45-day ceasefire proposal from intermediaries, there is little sign of meaningful progress. Both the US and Iran have rejected compromise terms, reinforcing a deadlock that is increasingly driven by strategic objectives rather than short-term de-escalation. At the core of this conflict is no longer just military action, but the ownership of Hormuz. Control of the Strait has become the defining issue.
Iran’s 10-point proposal highlights this clearly. Its demand for a “safe passage protocol,” combined with a roughly $2 million fee per tanker, effectively seeks to establish a global energy “toll booth.” This is about more than security—it is an attempt to secure long-term leverage and a sanctions-proof revenue stream.
The US position is equally firm. Washington is demanding unconditional reopening of the Strait, while Trump’s suggestion of US-imposed tolls signals a competing claim to control. Both sides are now contesting not just access, but ownership and monetization.
This dynamic has created a clear "zero-sum game". Iran cannot reopen without losing leverage, while the US cannot accept Iranian control without conceding strategic ground. The result is a standoff with little room for compromise.
For markets, oil is the ultimate trigger. A decisive break above 120 would signal that disruption—not containment—is being priced. The distinction now hinges on "short war vs long siege". If strikes lead to rapid capitulation, oil could reverse sharply lower. But if retaliation targets regional energy infrastructure, the conflict risks evolving into a prolonged disruption. That is where "generational energy risk" emerges. A sustained disruption to Hormuz flows would not just lift prices—it would reshape inflation, supply chains, and policy expectations globally.
Market pricing is already hinting at this possibility. The unusual WTI premium over Brent, reflects the rise of a safe barrel trade, where US crude is viewed as the most secure supply in a fragile global system.
In the currency markets, Dollar is currently the strongest one for the day so far, followed by Loonie, and then Euro. Kiwi is worst, followed by Swiss Franc, and then Aussie. Yen and Sterling are positioning in the middle.
In Asia, at the time of writing, Nikkei is down -0.03%. Hong Kong is on holiday. China Shanghai SSE is up 0.03%. Singapore Strait Times is down -0.34%. Japan 10-year JGB Yield is down -0.021 at 2.411. Overnight, DOW rose 0.36%. S&P 500 rose 0.44%. NASDAQ rose 0.54%. 10-year yield rose 0.022 to 4.335.
Inflation “Going Toward Red,” Fed Officials Warn as Stagflation Risks Rise
Fed 's Goolsbee and Hammack are turning more concerned as inflation shifts from “orange” toward “red,” driven by oil shocks and persistent tariff pressures. With price risks rising and the labor market still stable, the outlook points to growing stagflation risks and a longer path before any rate cuts. Read More.
EUR/USD Daily Outlook
Daily Pivots: (S1) 1.1508; (P) 1.1540; (R1) 1.1575; More….
EUR/USD dips mildly today, but stays well inside established range above 1.1408. Intraday bias remains neutral and more consolidations could be seen. With 1.1666 cluster resistance (38.2% retracement of 1.2081 to 1.1408 at 1.1665) intact, further decline is expected. On the downside, firm break of 1.1408 will resume the fall from 1.2081 to 38.2% retracement of 1.0176 to 1.2081 at 1.1353. However, decisive break of 1.1666 will argue that the fall from 1.2081 has completed, and turn bias back to the upside for 61.8% retracement of 1.2081 to 1.1408 at 1.1824.
In the bigger picture, prior break of 55 W EMA (now at 1.5011) should confirm rejection by 1.2 key cluster resistance level. The whole up trend from 0.9534 (2022 low) might have completed as a three wave corrective rise too. Deeper fall is expected to long term channel support (now at 1.0535). Meanwhile, risk will stay on the downside as long as 1.2081 holds, even in case of strong rebound.
Chart Alert: Japan’s Nikkei 225 Flashing Bearish Breakdown Conditions Below 50-Day MA
Key takeaways
- Shift from outperformance to weakness: The Nikkei 225 has reversed sharply since late February, turning into one of the worst-performing indices amid rising stagflation fears driven by elevated oil prices and prolonged US–Iran tensions.
- Macro headwinds intensifying: Japan’s heavy reliance on oil imports, coupled with a weakening corporate earnings outlook (falling earnings revision index), is reinforcing bearish sentiment and downside pressure on equities.
- Bearish technical structure in play: The index remains trapped in a descending triangle below key resistance; a break below 52,070 may extend losses toward 50,160 and potentially the 200-day moving average, unless 54,095 is reclaimed.
Japan’s stock market has continued to wobble since the start of the US-Iran war on 28 February 2026, fading its initial bullish sparkle seen at the start of the year, where the Nikkei 225 was one of the top performers with a gain of 17% from 1 January 2026 to 27 February 2026.
Stagflation fear dragged down the Nikkei 225 to become an underperformer
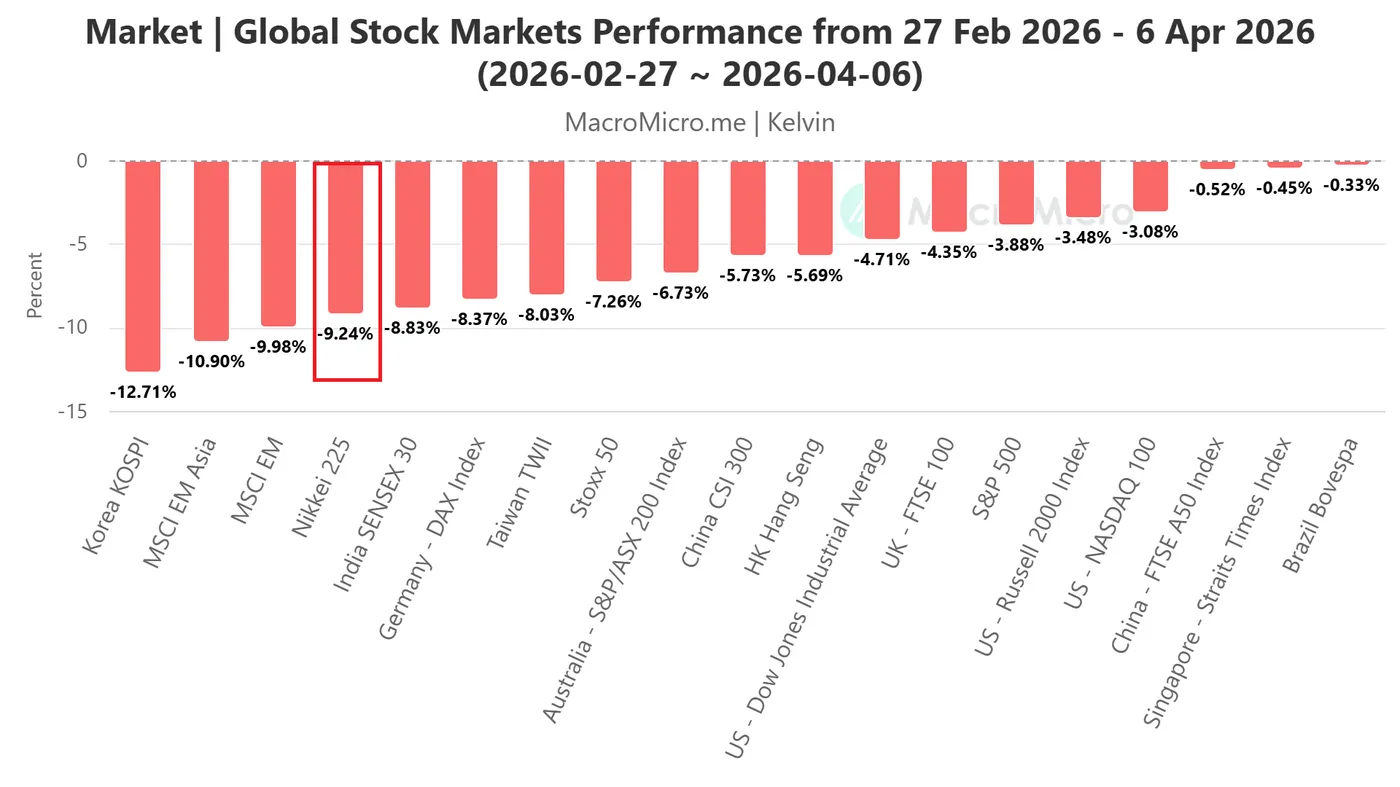
Fig. 1: Key global stock indices performances from 27 Feb 2026 to 6 Apr 2026 (Source: MacroMicro).
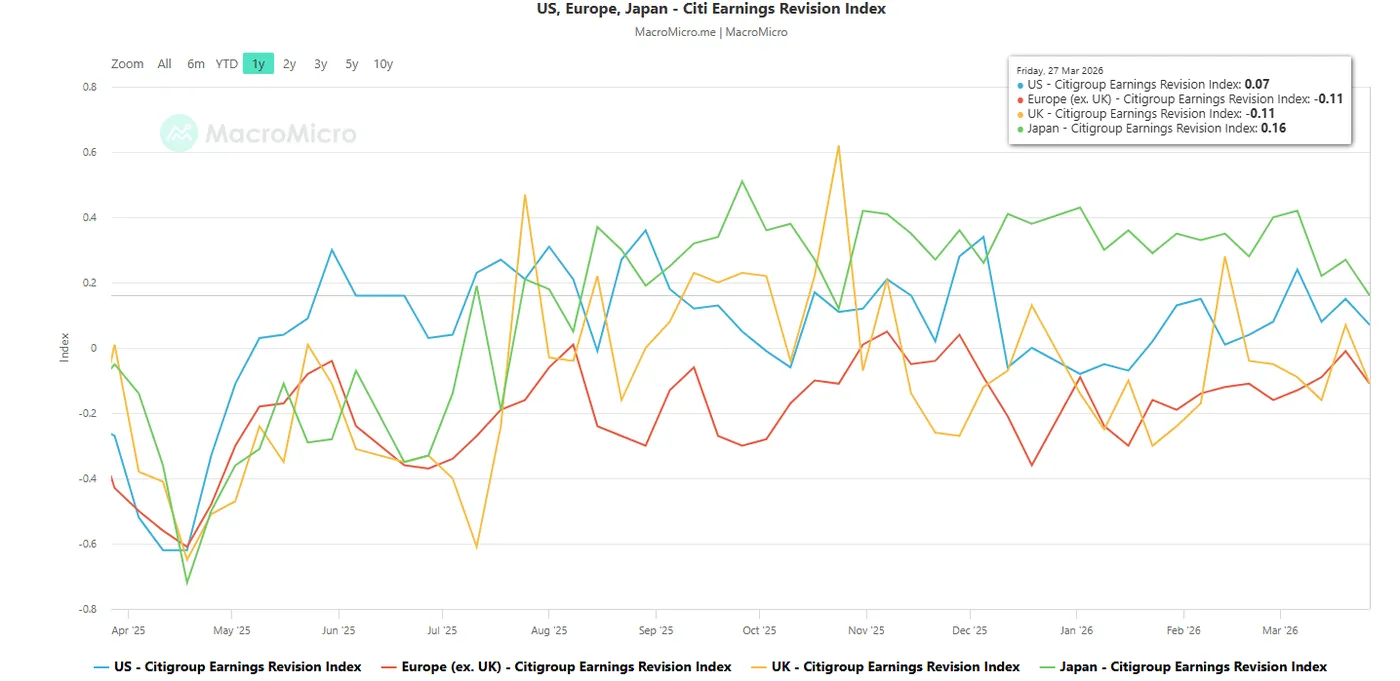
Fig. 2: Citigroup Earnings Revision Index for Japan, US & Europe as of 27 Mar 2026 (Source: MacroMicro).
In a reversal of fortune, Nikkei 225 has now fallen to the bottom, becoming one of the worst-performing stock indices, with a loss of 9.2% recorded from February 28, 2026, to April 6, 2026 (see Fig. 1).
Japan is a major oil importer, and the current US-Iran war, which is entering its 39th day, is not showing any clear signs of de-escalation at this juncture. Iran rejected a ceasefire deal yesterday after US President Trump’s latest deadline demand due today, Wednesday, 7 April at 8.00 p.m. Eastern time for Iran to open the Strait of Hormuz before US strikes on Iranian energy plants and key infrastructures.
Benchmark crude oil prices continue to trade firmly above $100/barrel, and trend-following market participants may trigger a bullish herding behaviour to continue bidding up the prices of oil.
The West Texas crude oil may rally towards the next intermediate resistances of $124.40 and $131.30/132.67.
Hence, further rallies in oil prices above $100/barrel increase the stagflation risk narrative, in turn, triggering a negative feedback loop into the Japanese economy, creating further bearish sentiment in the Nikkei 225.
In addition, the Citigroup Earnings Revision Index for Japan has slipped to a 5-month low of 0.16 as of 27 March 2026 from 0.42 printed on 6 March 2026, suggesting that sell-side analysts on average are less optimistic about the Japanese corporate earnings outlook (see Fig. 2).
Let’s now look at the technical factors to determine Nikkei 225’s potential short-term trajectory (1 to 3 days).
Nikkei 225 – Oscillating within a minor “Descending Triangle” range
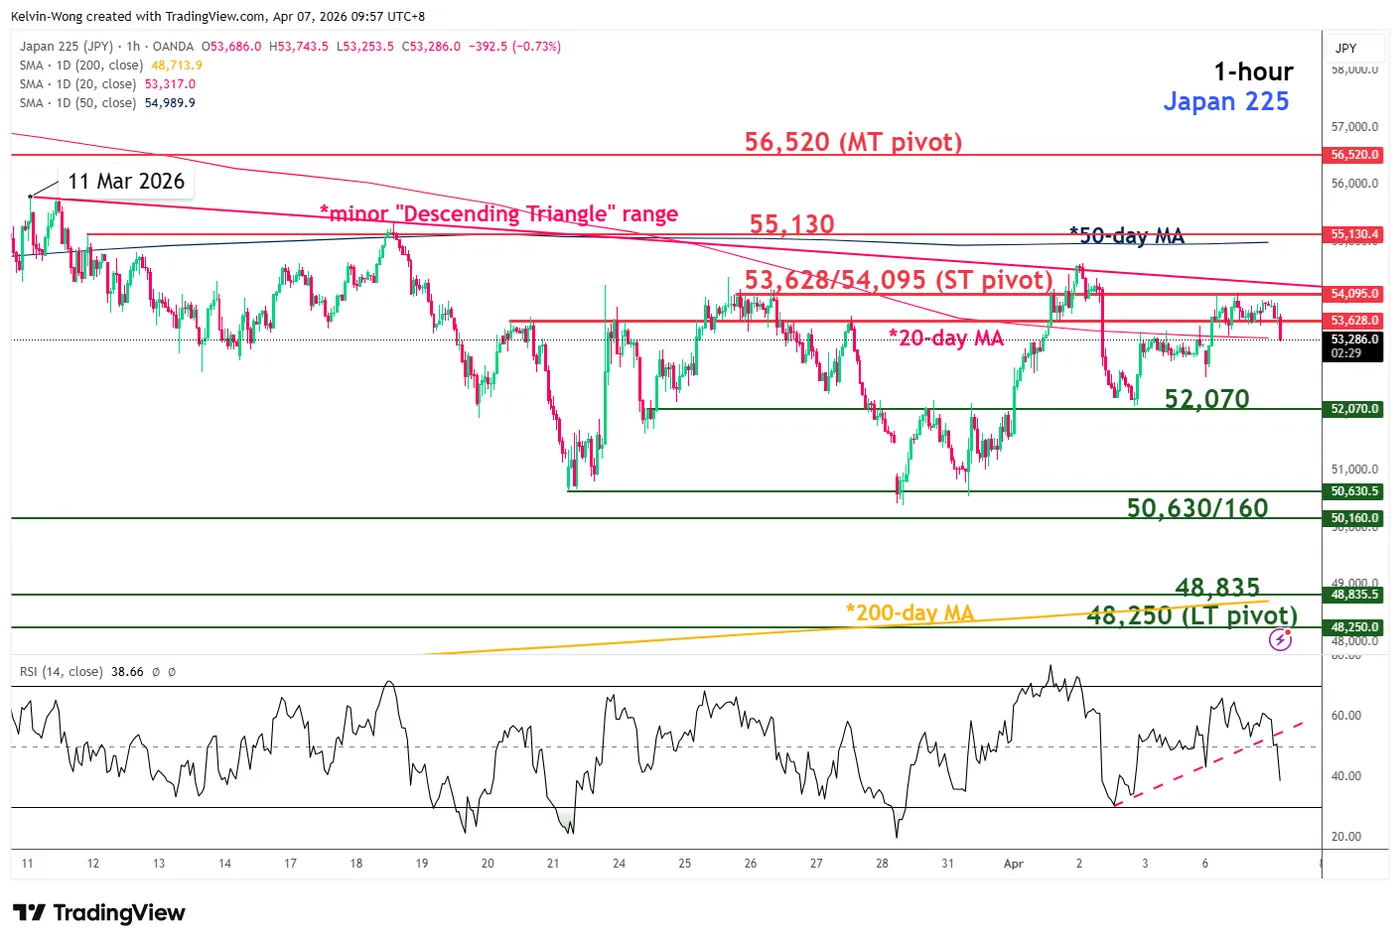
Fig. 3: Japan 225 CFD index minor trend as of 7 Apr 2026 (Source: TradingView).
Since the 11 March 2026 minor swing high, the price actions of the Japan 225 CFD index have been oscillating within a minor bearish continuation “Descending Triangle” range configuration.
The recent rebound of 8% seen from the 30 March 2026 low to 2 April 2026 high has stalled at the upper boundary of the “Descending Triangle” (see Fig. 3).
Watch the 53,628/54,095 short-term pivotal resistance zone for potential bearish reversal back down to retest the “Descending Triangle” range bottom. A break below 52,070 increases the odds of exposing the next intermediate support at 50,630/50,160 in the first step.
Below 50,160 opens scope for a bearish breakdown of the “Descending Triangle” range for a further potential down move towards the 48,835/48,250 long-term pivotal support zone (also the key 200-day moving average).
On the flip side, a clearance with an hourly close above 54,095 invalidates the bearish scenario for another leg of corrective rebound towards the next intermediate resistance at 55,130 (also the 50-day moving average).
Key elements to support the near-term bearish bias on the Nikkei 225
- The hourly RSI momentum indicator has just staged a bearish breakdown below its ascending support at the 50 level.
- The price actions of the Japan 225 have printed a “lower high” right below the “Descending Triangle” range resistance.
WTI Crude Oil Eyes Major Breakout, Surge Could Ignite Powerful Rally
Key Highlights
- WTI Crude Oil prices regained traction and cleared the $105 resistance.
- A key bullish trend line is forming with support at $106 on the 4-hour chart of XTI/USD.
- Gold is facing a major hurdle near $4,820.
- EUR/USD seems to be consolidating above the 1.1500 support.
WTI Crude Oil Price Technical Analysis
WTI Crude Oil prices started a fresh increase above $98 and $100 against the US Dollar. The price cleared many hurdles near $102 to re-enter bullish zone.
Looking at the 4-hour chart of XTI/USD, the price settled well above the 100 simple moving average (red, 4-hour) and the 200 simple moving average (green, 4-hour). On the upside, immediate resistance is near the $115.50 level.
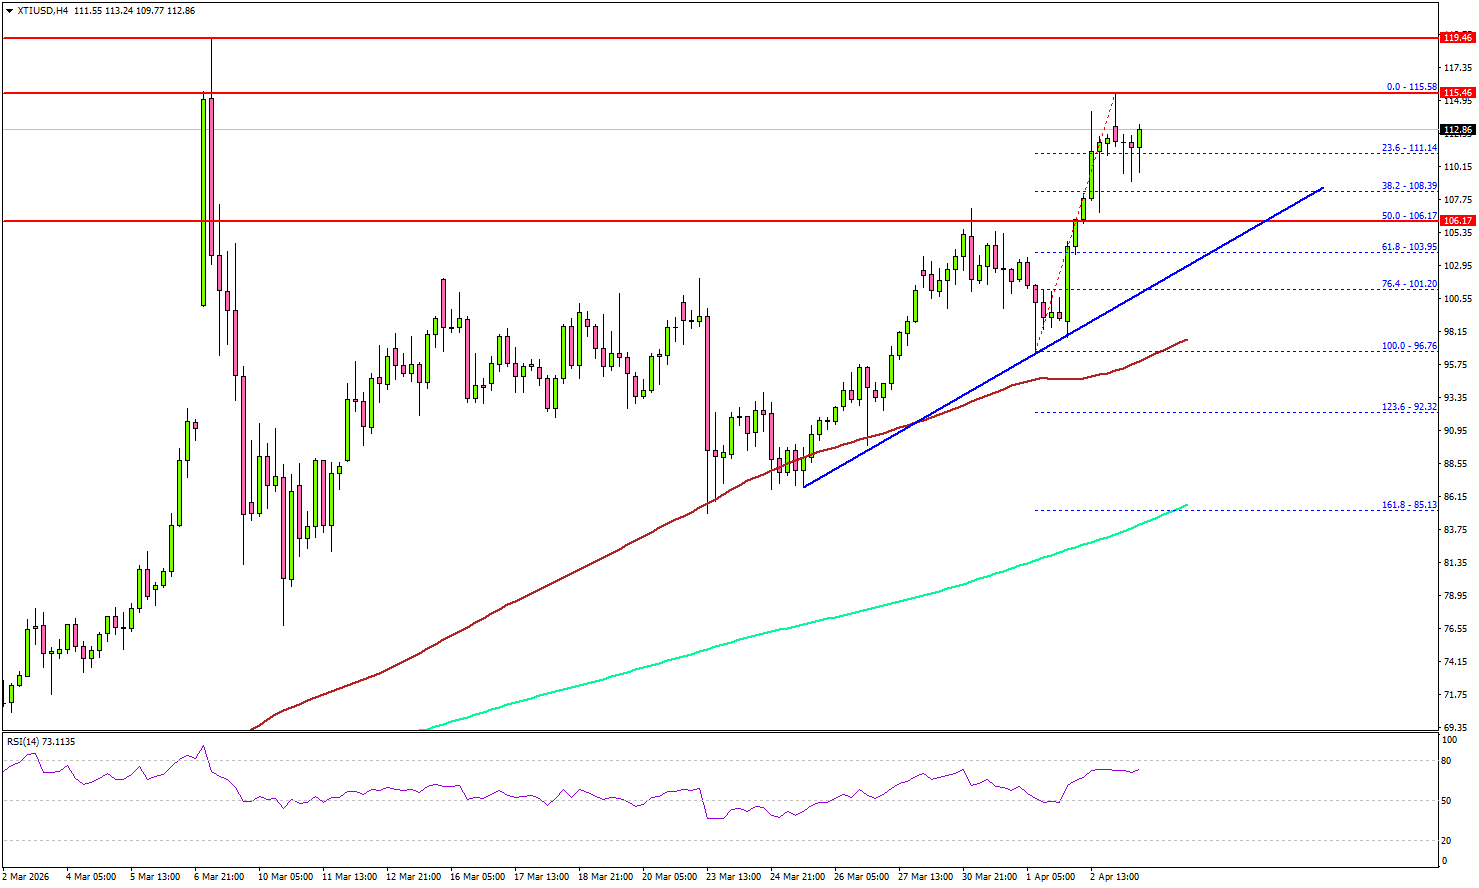
The first key hurdle for the bulls could be $118.00. A close above $118.00 might send Oil prices toward $120.00. Any more gains might call for a test of $125.00 in the near term.
On the downside, the first major support sits near the $108.20 zone. The next support could be $106.00. There is also a key bullish trend line forming with support at $106, below which the price could dive and test $102.00.
A daily close below $102.00 could open the doors for a larger decline. In the stated case, the bears might aim for a drop toward $98.00 and the 100 simple moving average (red, 4-hour).
Looking at Gold, there was a decent increase, but the bulls need to push the price above $4,820 for upside continuation.
Economic Releases to Watch Today
- Euro Zone Services PMI for March 2026 – Forecast 50.1, versus 50.1 previous.
- UK Services PMI for March 2026 – Forecast 51.2, versus 51.2 previous.
- US Durable Goods Orders for Feb 2026 – Forecast -0.5% versus 0% previous.
Inflation “Going Toward Red,” Fed Officials Warn as Stagflation Risks Rise
US inflation risks are intensifying again, with Fed officials warning that price pressures are no longer easing but turning higher as oil shocks and tariffs continue to feed through the economy. Speaking in a joint interview, Austan Goolsbee said inflation is now “going toward red,” highlighting a shift toward more persistent and troubling dynamics.
Goolsbee described the outlook as “at least orange… going from orange to red lately,” pointing to rising gasoline prices and what he called a new stagflationary shock layered on top of existing pressures. He noted that tariff-driven price increases had been expected to fade but “kind of didn’t go away,” adding to concerns that inflation could remain elevated.
Beth Hammack echoed those concerns, emphasizing that inflation has been above target for five years and largely "moving sideways" over the past two. She characterized current conditions as a “vibrant orange,” underscoring persistent price pressures that are proving difficult to bring down.
On the labor market, however, both officials pointed to relative stability. Hammack said the unemployment rate near 4.3% is close to full employment, describing conditions as a “fragile balance” in the yellow-to-green range. Goolsbee was more cautious and gave it a "yellow", noting a “low hiring, low firing” environment driven by uncertainty, but still not weak enough to force policy easing.
The color framework used here offers a simple guide to Goolbee's and Hammack's thinking: green signals an economy on track, yellow reflects balance with some caution, orange points to elevated concern, and red implies conditions that risk getting out of control. With inflation now shifting from orange toward red while the labor market remains closer to yellow, the Fed is facing a clear imbalance—rising price risks without sufficient weakness in employment to justify easing.
Markets Watch for End of War as Oil Stays Above $100 and Stocks Rise
Markets had another volatile week, with headlines around Donald Trump and tensions with Iran moving markets. Early in the week, sentiment improved as Trump talked about easing tensions, which helped U.S. stock markets move higher during the shortened holiday period.
At the same time, oil prices continued to rise, with WTI moving above the $100 level and staying there as the fighting in Iran continued. Higher oil prices helped push USD/JPY above 160, with no clear signs of intervention from the Bank of Japan. U.S. employment data was also much stronger than expected, but the market reaction was limited due to low liquidity during the holiday week.
Comments from Jerome Powell helped ease some inflation concerns and supported sentiment. However, uncertainty around Iran remained, keeping markets cautious overall and volatility high across both oil and stock markets.
Markets This Week
U.S. Stocks
The Dow Jones Industrial Average moved higher last week and broke its recent downtrend as investors started to expect that the conflict with Iran may not get worse. This brought buyers back into the market and improved overall sentiment. Some analysts are now more positive on stocks, saying that unless the situation becomes much worse, large downside moves are less likely. The focus has shifted from selling rallies to looking for buying opportunities on dips. From a technical view, as long as the market stays above the 10-day moving average, buying remains the better approach. If this level holds, short-term momentum should stay positive. Resistance levels are at 47,000, 47,500, and 48,000. Support is seen at 46,000, 45,000, 44,500 and 44,000.
Japanese Stocks
The Nikkei 225 has been volatile recently, moving within a wide range. One of the main concerns is higher oil prices, which could negatively impact the Japanese economy and keep inflation pressure high. At the same time, U.S. equities have started to look more positive, which may help support Japanese stocks in the short term. However, the yen is unlikely to weaken significantly, which could limit further upside in the Nikkei. Overall, with mixed signals from global markets and domestic risks, range trading may be the best approach this week rather than expecting a strong trend in either direction. Resistance is seen at 54,500, 56,000 and 57,000, while support is at 52,000, 51,000, 50,500, and 50,000.
USD/JPY
USD/JPY moved above 160 earlier in the week, supported by higher oil prices. However, despite no intervention, the pair later moved back below 160 as traders started to expect that the conflict with Iran may ease. At the same time, longer-term U.S. interest rates moved lower after comments from Jerome Powell, who suggested inflation may not rise as much as expected. This reduced some of the upward pressure on the dollar. The pair still remains in a slight uptrend overall, but momentum has slowed. For this week, trading the range between 158 and 160 looks like the preferred strategy. Resistance is at 160.00, 160.50, 162, and 165, while support is seen at 159.00, 158.50, 158.00, and 156.50.
Gold
Gold had a strong week as buyers came back into the market. A weaker U.S. dollar and lower long-term interest rates made gold more attractive, helping prices move higher. The short-term trend has now turned positive again after the recent drop, which is supporting more buying. The longer-term trend is still bullish, so buying is likely to continue if the conflict with Iran is expected to come to an end in the coming weeks. Resistance is at $4,800, $4,850, $5,000, and $5,100, while support is at $4,500, $4,400, $4,300, $4,200 and $4,100.
Crude Oil
WTI moved strongly higher last week, pushing well above the $100 level as Donald Trump increased pressure on Iran and concerns grew about supply risks through the Strait of Hormuz. Prices moved closer to the highs seen at the start of the conflict. The overall trend remains strong to the upside, supported by ongoing uncertainty and supply concerns. It is still difficult to predict how the situation will develop, which is keeping volatility high. In the short term, after such a strong move higher, looking for selling opportunities if there are signs the war could be coming to an end may be the easier trade. Resistance is at $120, $125, and $130, while support is at $100,00, $90, $80, $75, $70, and $67.5.
Bitcoin
Bitcoin volatility remains low as overall interest in the market is still limited, and price continues to move within a range. Technical indicators are also mostly sideways, showing no clear trend at the moment. This reflects a lack of strong momentum in either direction. For now, trading the range between $65,000 and $75,000 looks like the best strategy. Resistance is at $75,000, $80,000, and $85,000, while support is at $65,000, $60,000, and $55,000.
This Week’s Focus
- Tuesday: Japan Household Spending, E.U. HCOB Eurozone Services PMI, U.K. S&P Global Composite PMI, U.S. Durable Goods Orders
- Wednesday: Japan Current Account, U.K. S&P Global Construction PMI, U.S. FOMC Meeting Minutes
- Thursday: U.S. Core PCE Price Index and GDP
- Friday: Australia Building Approvals, China CPI and PPI, U.S. CPI, Michigan Consumer Sentiment and Factory Orders
Following the Monday holiday in the U.K. and U.S., markets have a shortened week. President Trump warned that if the Strait of Hormuz is not reopened and there is no progress on ending the conflict by 8 PM ET tomorrow, the U.S. may quickly target key infrastructure. Later in the week, U.S. inflation data will be the main focus and could drive the next move. Markets will look for a reversal if tensions ease, or more volatility if the situation gets worse.
Ethereum Wave Analysis
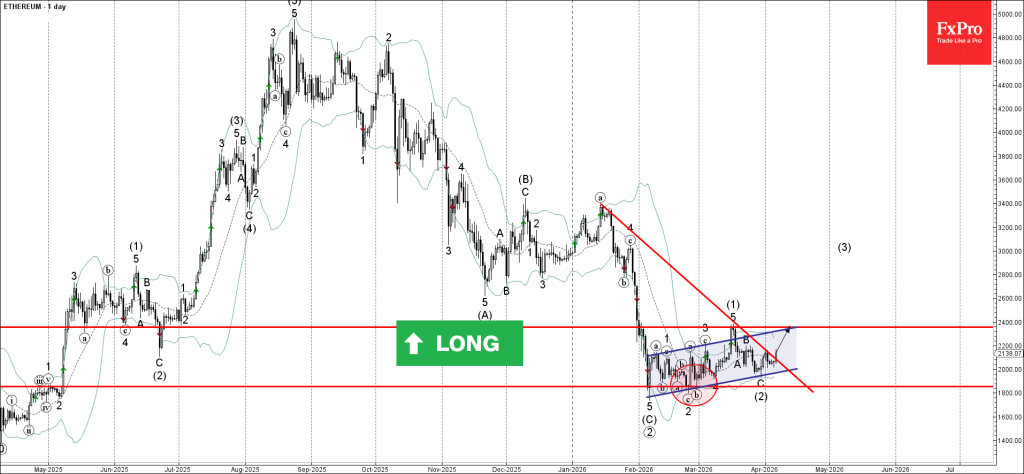
Ethereum: ⬆️ Buy
- Ethereum reversed from support zone
- Likely to rise to resistance level 2400.00
Ethereum cryptocurrency recently reversed up from the support zone between the support level 1800.00 and the support trendline of the daily up channel from February.
The upward reversal from this support zone completed the previous intermediate ABC correction (2).
Given the improved sentiment across the crypto markets and the strength of the support level 1800.00, Ethereum can be expected to rise to the next resistance level 2400.00 (top of wave (1)).
Eco Data 4/7/26
| GMT | Ccy | Events | Act | Cons | Prev | Rev |
|---|---|---|---|---|---|---|
| 23:30 | JPY | Overall Household Spending Y/Y Feb | -1.80% | -0.70% | -1.00% | |
| 00:00 | AUD | TD-MI Inflation Gauge M/M Mar | 1.30% | -0.20% | ||
| 05:00 | JPY | Leading Economic Index Feb P | 112.4 | 112.4 | 112.4 | 112.1 |
| 07:00 | CHF | Foreign Currency Reserves (CHF) Mar | 721B | 710B | ||
| 07:50 | EUR | France Services PMI Mar F | 48.8 | 48.3 | 48.3 | |
| 07:55 | EUR | Germany Services PMI Mar F | 50.9 | 51.2 | 51.2 | |
| 08:00 | EUR | Eurozone Services PMI Mar F | 50.2 | 50.1 | 50.1 | |
| 08:30 | EUR | Eurozone Sentix Investor Confidence Apr | -19.2 | -7.5 | -3.1 | |
| 08:30 | GBP | Services PMI Mar F | 50.5 | 51.2 | 51.2 | |
| 12:30 | USD | Durable Goods Orders Feb | -1.40% | -1.00% | 0.00% | |
| 12:30 | USD | Durable Goods Orders ex Transport Feb | 0.80% | 0.50% | 0.40% | |
| 14:00 | CAD | Ivey PMI Mar | 49.7 | 57.2 | 56.6 |
| 23:30 | JPY |
| Overall Household Spending Y/Y Feb | |
| Actual | -1.80% |
| Consensus | -0.70% |
| Previous | -1.00% |
| 00:00 | AUD |
| TD-MI Inflation Gauge M/M Mar | |
| Actual | 1.30% |
| Consensus | |
| Previous | -0.20% |
| 05:00 | JPY |
| Leading Economic Index Feb P | |
| Actual | 112.4 |
| Consensus | 112.4 |
| Previous | 112.4 |
| Revised | 112.1 |
| 07:00 | CHF |
| Foreign Currency Reserves (CHF) Mar | |
| Actual | 721B |
| Consensus | |
| Previous | 710B |
| 07:50 | EUR |
| France Services PMI Mar F | |
| Actual | 48.8 |
| Consensus | 48.3 |
| Previous | 48.3 |
| 07:55 | EUR |
| Germany Services PMI Mar F | |
| Actual | 50.9 |
| Consensus | 51.2 |
| Previous | 51.2 |
| 08:00 | EUR |
| Eurozone Services PMI Mar F | |
| Actual | 50.2 |
| Consensus | 50.1 |
| Previous | 50.1 |
| 08:30 | EUR |
| Eurozone Sentix Investor Confidence Apr | |
| Actual | -19.2 |
| Consensus | -7.5 |
| Previous | -3.1 |
| 08:30 | GBP |
| Services PMI Mar F | |
| Actual | 50.5 |
| Consensus | 51.2 |
| Previous | 51.2 |
| 12:30 | USD |
| Durable Goods Orders Feb | |
| Actual | -1.40% |
| Consensus | -1.00% |
| Previous | 0.00% |
| 12:30 | USD |
| Durable Goods Orders ex Transport Feb | |
| Actual | 0.80% |
| Consensus | 0.50% |
| Previous | 0.40% |
| 14:00 | CAD |
| Ivey PMI Mar | |
| Actual | 49.7 |
| Consensus | 57.2 |
| Previous | 56.6 |
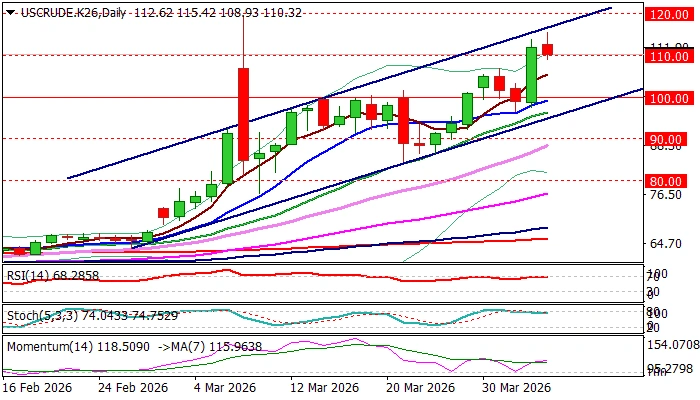
WTI Oil: Bulls Pause Under One-Month High
WTI oil price edged lower on Monday after hitting new marginally higher high ($115.42) on a partial profit taking from over 13% rally in the previous trading session on Thursday.
Traders were cautiously optimistic and awaited more details about potential peace talks between the USA and Iran but remain on high alerts on threats of more negative impact from prolonged supply disruption, in the scenario of failure of peace talks and escalation of the conflict.
Technical picture remains bullish overall on daily and weekly charts, with large bullish weekly candle adding to supportive factors, although overbought conditions warn of further headwinds bulls may face on the way towards initial targets at $120 zone.
Consolidation with limited dips (to be ideally contained at $105/$104 zone) is needed to keep broader bulls intact and mark a healthy correction of the latest upleg ($84.49/$115.42) ahead of fresh push higher.
Caution on dips below psychological $100 support (also 50% retracement of $84.49/$115.42) which may trigger deeper pullback and expose next key support at $97.00 (bull-channel support line).
Res: 113.94; 115.42; 117.08; 120.00.
Sup: 108.93; 106.82; 103.60; 100.00.