

Sample Category Title
Cliff Notes: A Central Bank Trifecta
Key insights from the week that was.
In Australia, nominal retail sales rose strongly in September, up 0.9% (2.0%yr). However, this was mostly due to transitory factors, including policy changes around medicines under the Pharmaceutical Benefits Scheme and major product releases, most notably the latest iPhone model. On a three-month rolling basis, nominal retail sales lifted 0.8% in September; underlying this, the just released quarterly data reports volumes rose 0.2% in Q3 following a 0.6% decline in Q2. Our Westpac Card Tracker suggests that through October, retail card activity partially retraced some of the gradual improvement experienced through Q3.
Turning to the housing data, the CoreLogic home value index posted another broad-based gain in October (0.9%) with solid increases reported in most of the major capital cities. Despite ongoing momentum in prices, housing finance approvals still imply a shaky recovery in transaction volumes, the total value of new loans up just 0.6% in September with the detail of the report very patchy, owner-occupier loans down 0.1% as investor loans gained 2.0%. Construction-related lending’s flat result in September and dwelling approvals 4.6% decline in the month also showcases lingering fragility for construction. Costs pressures and capacity constraints will act as a drag on building activity in the near-term, providing support for house prices and rents.
Australia’s goods trade surplus subsequently surprised to the downside in September, slipping from $10.2bn to $6.8bn. This was largely a consequence of a surprise surge in imports, up 7.5%, due to a spike in transport equipment. Exports meanwhile exhibited some softness in the month, falling –1.4%, as volatility in gold exports persisted. According to this data, the goods trade balance was soft in the quarter overall, with goods exports declining –1.4% and goods imports rising 3.0%. The Balance of Payments will provide an update on services trade in a few weeks’ time.
With a view to the medium term, Westpac Chief Economist Luci Ellis spoke this week at the Melbourne Institute 2023 Economic & Social Outlook Conference on sustaining full employment and low inflation. A copy of her presentation is now available on Westpac IQ.
First cab off the rank offshore was the
Bank of Japan who changed the 1% upper bound for 10-year Japanese Government Bond (JGB) yield from a hard cap to a “reference”, potentially allowing the 10-year JGB yield to trade modestly above that level if market conditions warrant. However, their overall commitment to Yield Curve Control and the -0.1% policy rate are unchanged. While markets took the upper bound decision to mean the BoJ may be readying for a substantial policy shift, we believe the BoJ is instead planning to remain ultra accommodative for the foreseeable future. Revised forecasts show upward revisions to inflation in FY23 and FY24 to above the 2% target, but inflation is still expected to be back below target in FY25. Importantly, the BoJ attributed the upward revisions to stronger pass through of import prices. But, as import price growth dissipates, consumer prices are also expected to ease. Evidence of demand-driven inflation meanwhile remains scant.
Committee members would have taken into consideration the trade union confederation RENGO's 'above 5%' wage demands for 2024 when they made the assessment that "if the behavior and mindset based on the assumption that wages and prices will not increase easily remain deeply entrenched, there is a risk that moves to increase wages will not strengthen as much as expected from next year and prices will deviate downward from the baseline scenario." Overall, the BoJ's decision reflects a desire to keep policy accommodative as long as necessary to encourage expectations to strengthen and inflation to hold sustainably at target.
The FOMC subsequently chose to keep rates steady and reaffirmed they believe the US economy is cooling sufficiently to meet the 2% inflation target in time. In the statement, changes to language were marginal and in response to recent data, economic activity “expanded at a strong pace” replacing “expanding at a solid pace” following Q3’s outsized 4.9% annualised gain. The tense of the revised statement is significant: yes Q3 was “strong", but momentum ahead is uncertain.
Into 2024, the balance of risks will likely shift against growth, requiring the FOMC to make real-time judgements over the appropriate degree of policy restrictiveness. This is a determination that will depend not only on the right level of the real fed funds rate but also on an assessment of the stability of term premiums and credit conditions. The US release of the week is still to come, with the October employment report due tonight. With the Q3 Employment Cost Index benign and other partial data softer than expected, the market is likely hoping for a partial reversal of last month’s payrolls strength.
In the UK, the Bank of England kept rates steady at 5.25% in a 6-3 vote. The lower-than-expected inflation print resulted in a downward revision for 2023 inflation. However, 2024 and 2025 were revised up reflecting upside risks for inflation from energy prices and a longer-than-expected unwinding of second-round effects. This likely means policy will remain restrictive for longer in line with the global narrative. Concerns about growth remain ever-present as the BoE revised down its forecast for 2024 to be flat.
In Europe, headline inflation eased to 2.9%yr in October helped by base effects with 2022’s soaring energy prices falling out of the annual inflation calculation. Core inflation held above 4% (4.2%yr from 4.5%yr last month), confirming the ECB's view that there would be a late but steep deceleration for core. These inflation outcomes were paired with a 0.1%qtr contraction in Q3 GDP following an upwardly revised 0.2% gain in Q2. While France, Italy, and Spain saw an expansion in Q3, likely fuelled by strong tourism spending, Germany posted a decline due to manufacturing sector weakness. Together these outcomes point to the ECB remaining on hold into 2024.
Technical Outlook and Review
DXY:
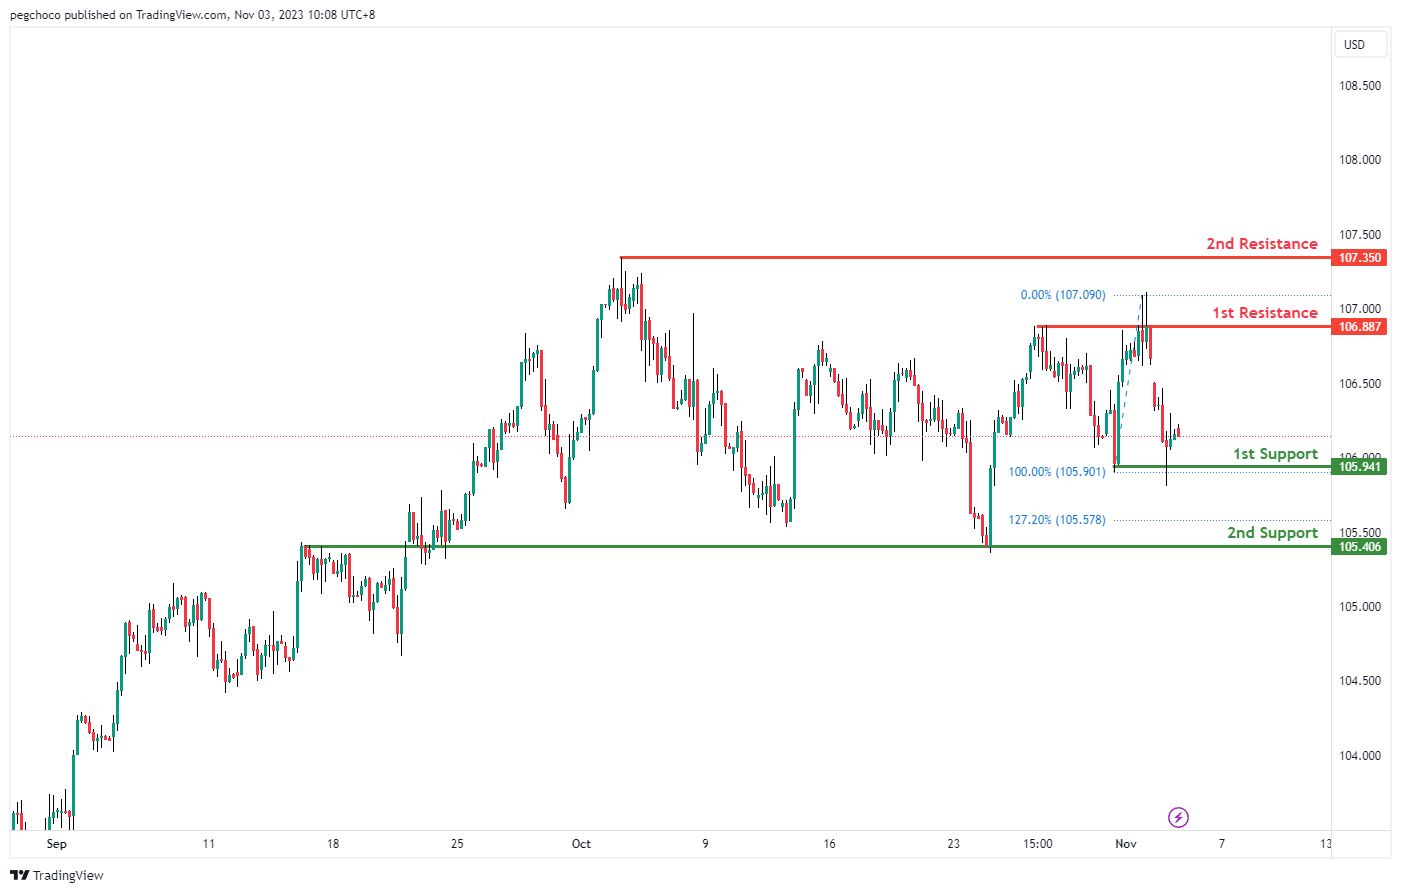
The DXY (US Dollar Currency Index) chart currently has a neutral overall momentum, indicating a lack of a strong directional bias. In this situation, it’s suggested that the price could potentially fluctuate between the 1st support and 1st resistance levels.
1st support at 105.94 is identified as a swing low support, which could act as a significant level where the price might find buying interest. The 2nd support at 105.40 is categorized as an overlap support, further reinforcing its potential as a support level.
On the resistance side, the 1st resistance at 106.88 is noted as a multi-swing high resistance, indicating it could act as a level where the price faces selling pressure.The 2nd resistance at 107.35 is categorized as a swing high resistance, suggesting it might be a level where the price encounters obstacles in its upward movement.
EUR/USD:
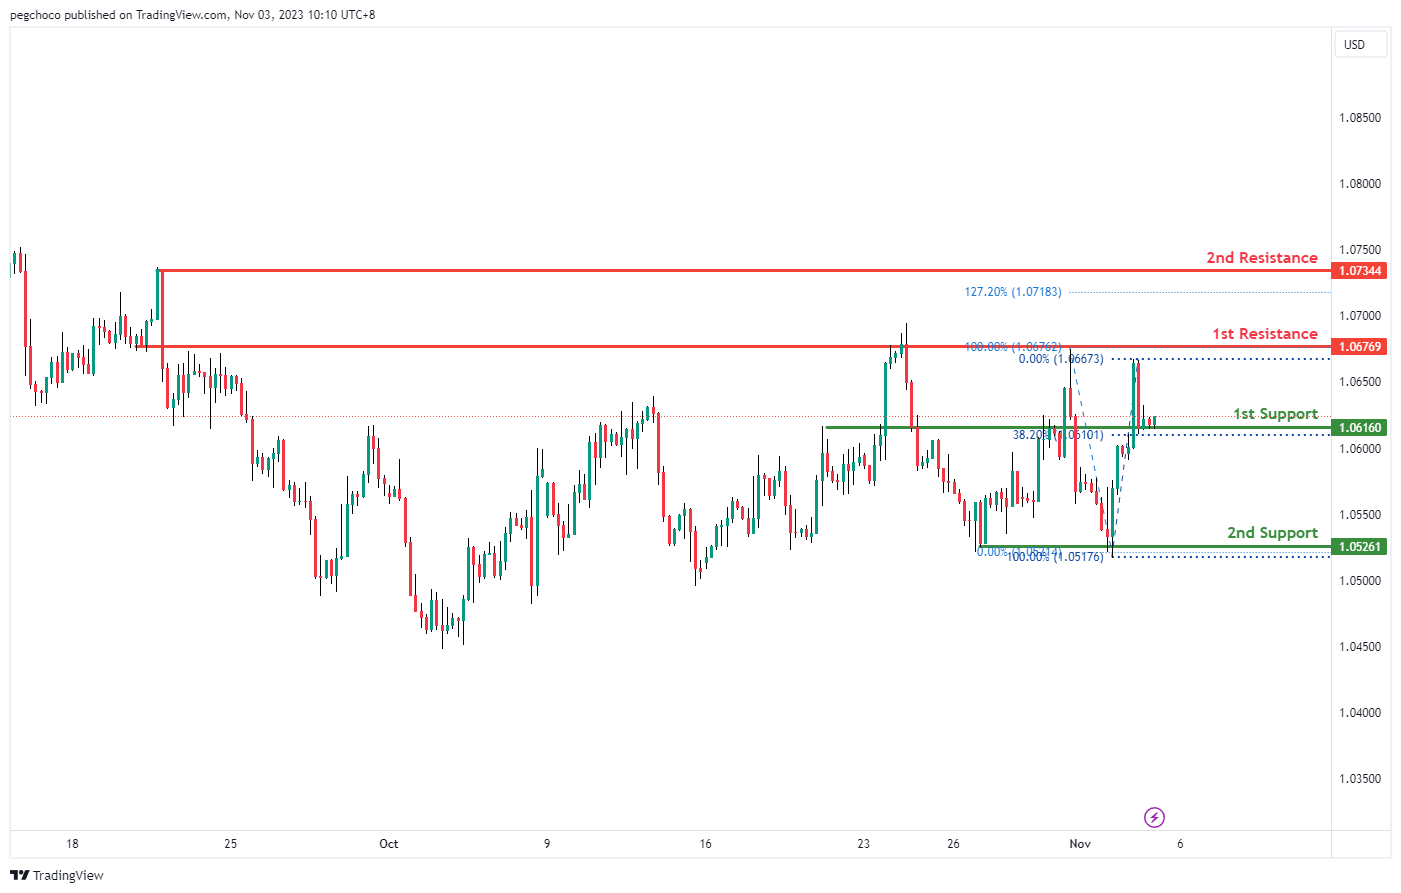
The EUR/USD chart currently exhibits a bullish overall momentum, indicating a potential upward bias. In this scenario, it’s suggested that the price could potentially make a bullish continuation towards the 1st resistance level.
1st support at 1.0526 is identified as an overlap support and coincides with the 38.20% Fibonacci Retracement level. This makes it a significant level where buyers might step in to provide support.The 2nd support at 1.0526 is categorized as a multi-swing low support, further strengthening its potential as a support level.
On the resistance side, the 1st resistance at 1.0676 is noted as a swing high resistance, indicating it could act as a level where the price faces selling pressure.The 2nd resistance at 1.0734 is also categorized as a swing high resistance, suggesting it might be a level where the price encounters obstacles in its upward movement.
EUR/JPY:
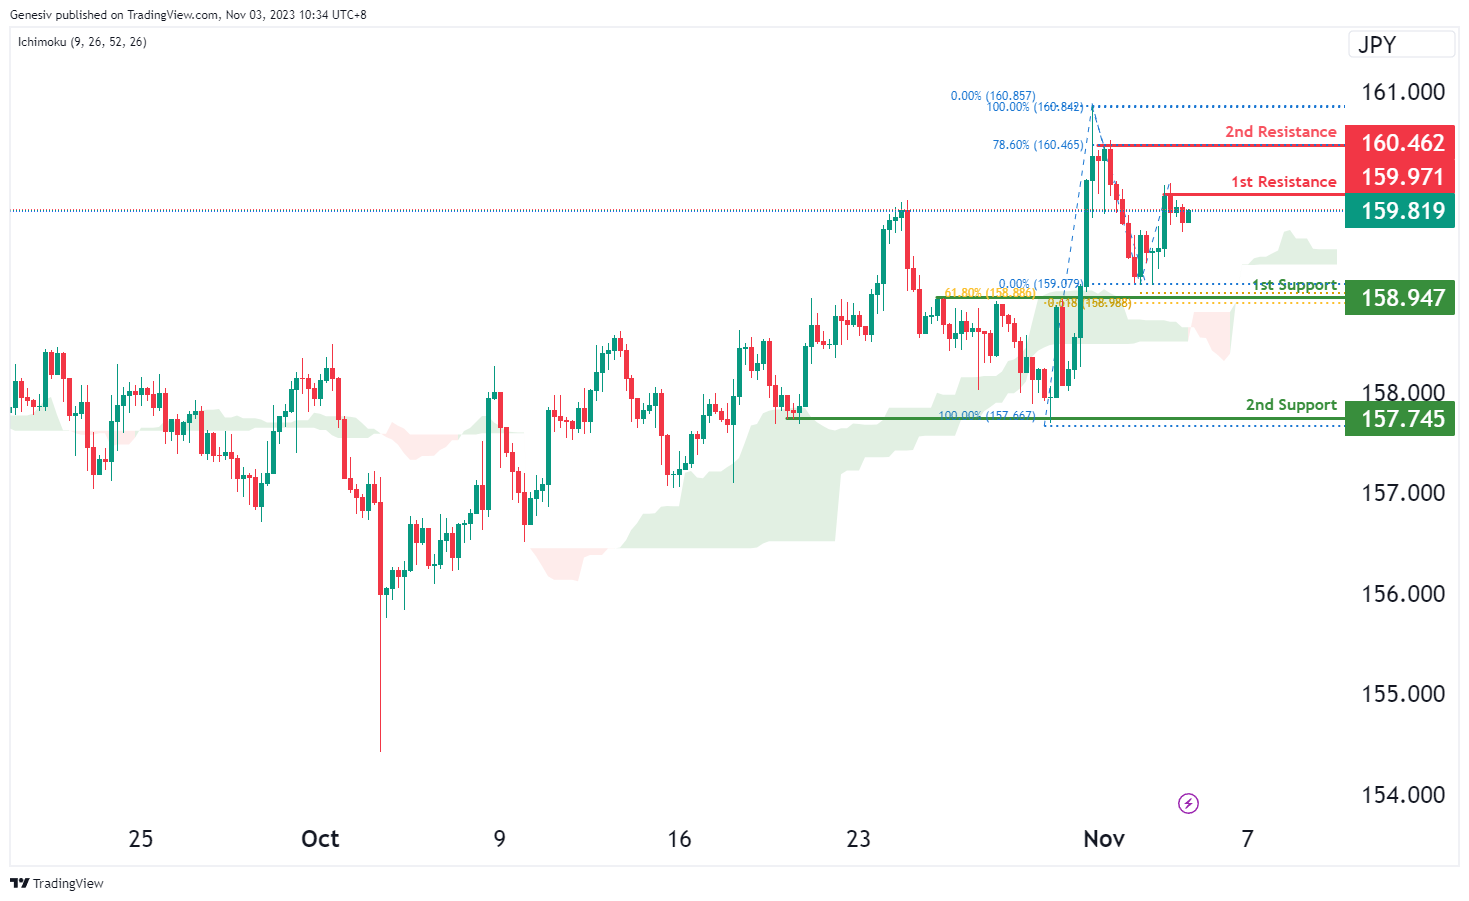
The EUR/JPY chart is currently showing a bearish momentum, suggesting a potential scenario for a bearish reaction off the first resistance at 159.97, potentially leading to a drop to the first support.
The first support at 158.94 is identified as a pullback support, highlighting a level where the price might find support during its downward movement. This level is significant due to the confluence of the 61.80% Fibonacci Retracement and the 61.80% Fibonacci Projection, indicating strong Fibonacci support.
The second support at 157.74 is recognized as multi-swing low support, offering an additional level that could potentially provide support during the bearish trend.
Regarding resistance levels, the first resistance at 159.97 is characterized as swing high resistance, representing a significant barrier to the price’s upward movement in the current bearish scenario.
The second resistance at 160.46 aligns with swing high resistance and the 78.60% Fibonacci Retracement, further reinforcing a potential barrier for the price’s upward movement within the existing bearish trend.
EUR/GBP:
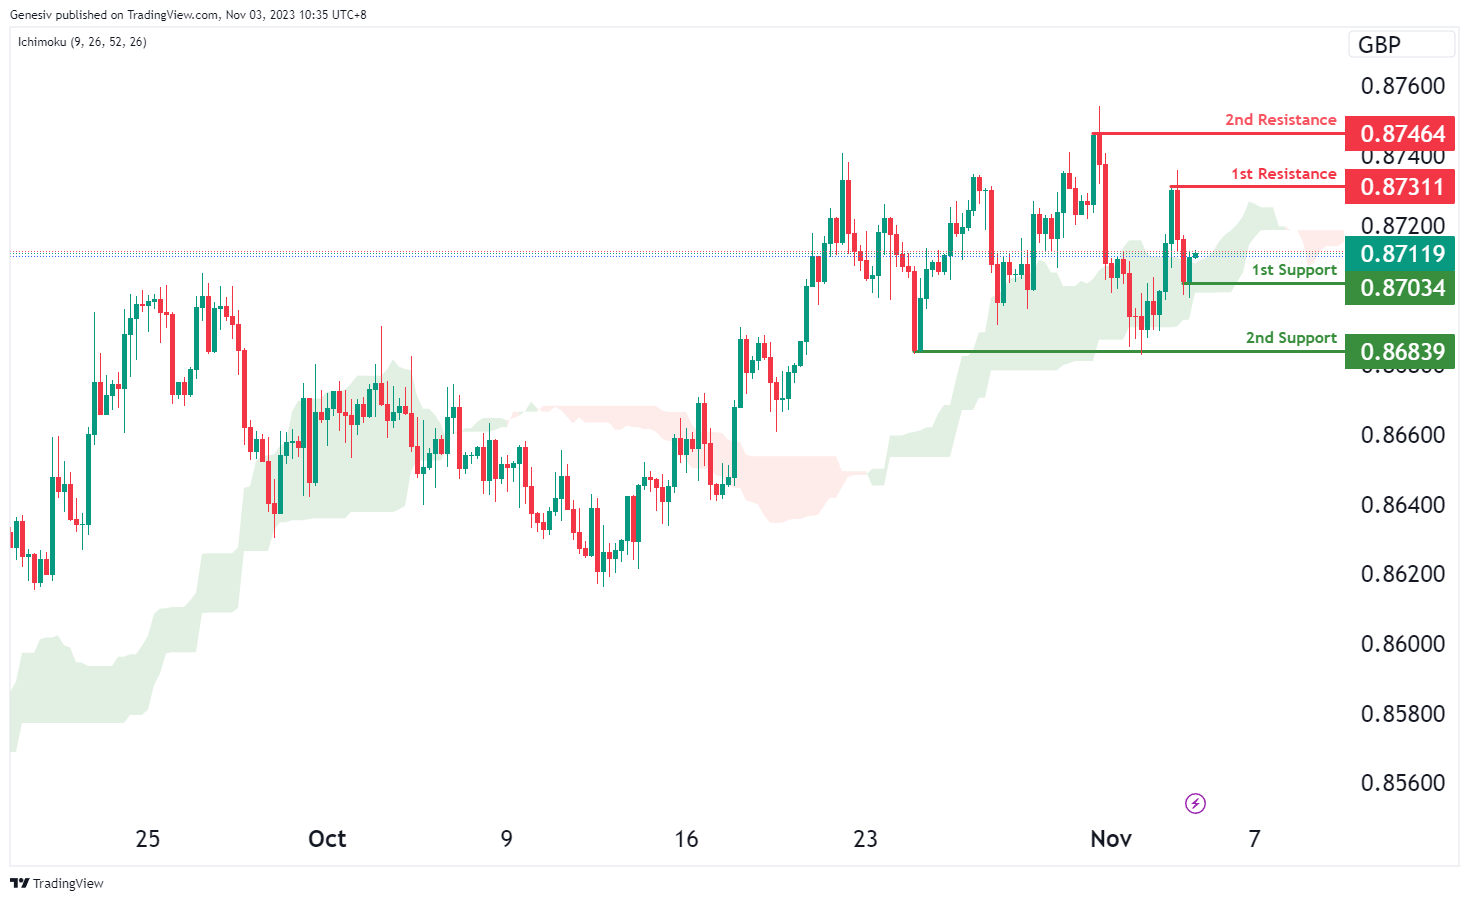
The EUR/GBP chart is currently indicating a bullish momentum, suggesting a potential scenario for a bullish continuation towards the first resistance at 0.8731.
The first support at 0.8703 is identified as swing low support, indicating a level where the price might find support during any potential retracement or decline.
The second support at 0.8683 is recognized as multi-swing low support, providing an additional level that might offer support during the bullish trend.
On the resistance side, the first resistance at 0.8731 is characterized as swing high resistance, signifying a level that could potentially act as a barrier to the price’s upward movement in the current bullish scenario.
The second resistance at 0.8746 is also identified as swing high resistance, suggesting it might pose another significant barrier to the price’s upward movement within the prevailing bullish trend.
GBP/USD:
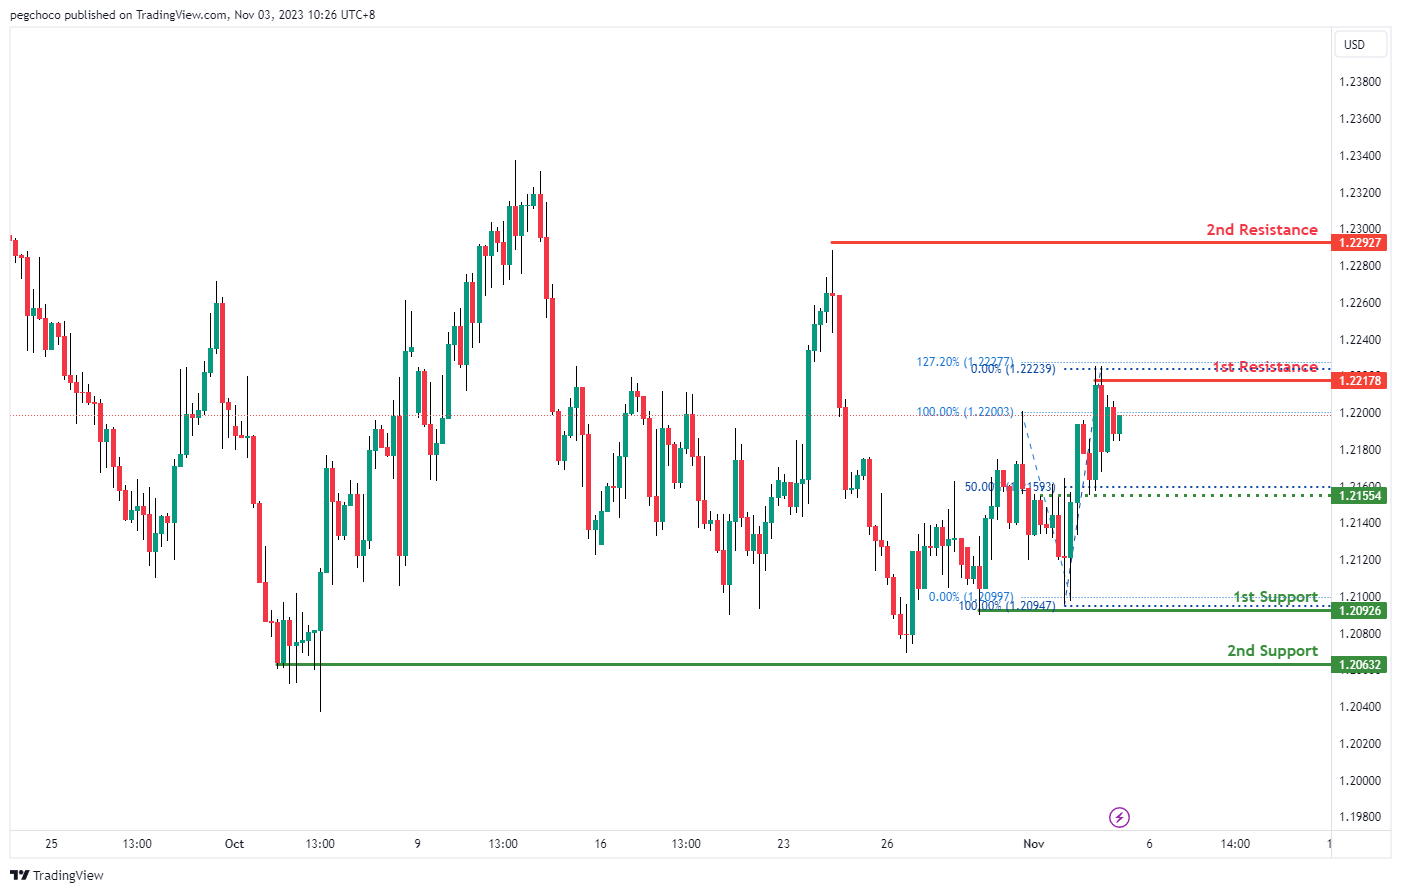
The GBP/USD chart currently has a bullish overall momentum, indicating the potential for a bullish continuation towards the 1st resistance level.
The 1st support at 1.2092 is identified as a multi-swing low support, signifying its significance as a potential level where buyers may step in.
Similarly, the 2nd support at 1.2063 is also categorized as a multi-swing low support, reinforcing its potential as a support level.
On the resistance side, the 1st resistance at 1.2217 is identified as a swing high resistance, suggesting it could act as a level where the price may face selling pressure.
Additionally, the 2nd resistance at 1.2291 is defined as a swing high resistance, further adding to the potential areas where the price might encounter obstacles in its upward movement.
Intermediate support at 1.2155 is noted as an overlap support and is associated with the 50% Fibonacci Retracement, making it another level to watch for potential price movements.
GBP/JPY:
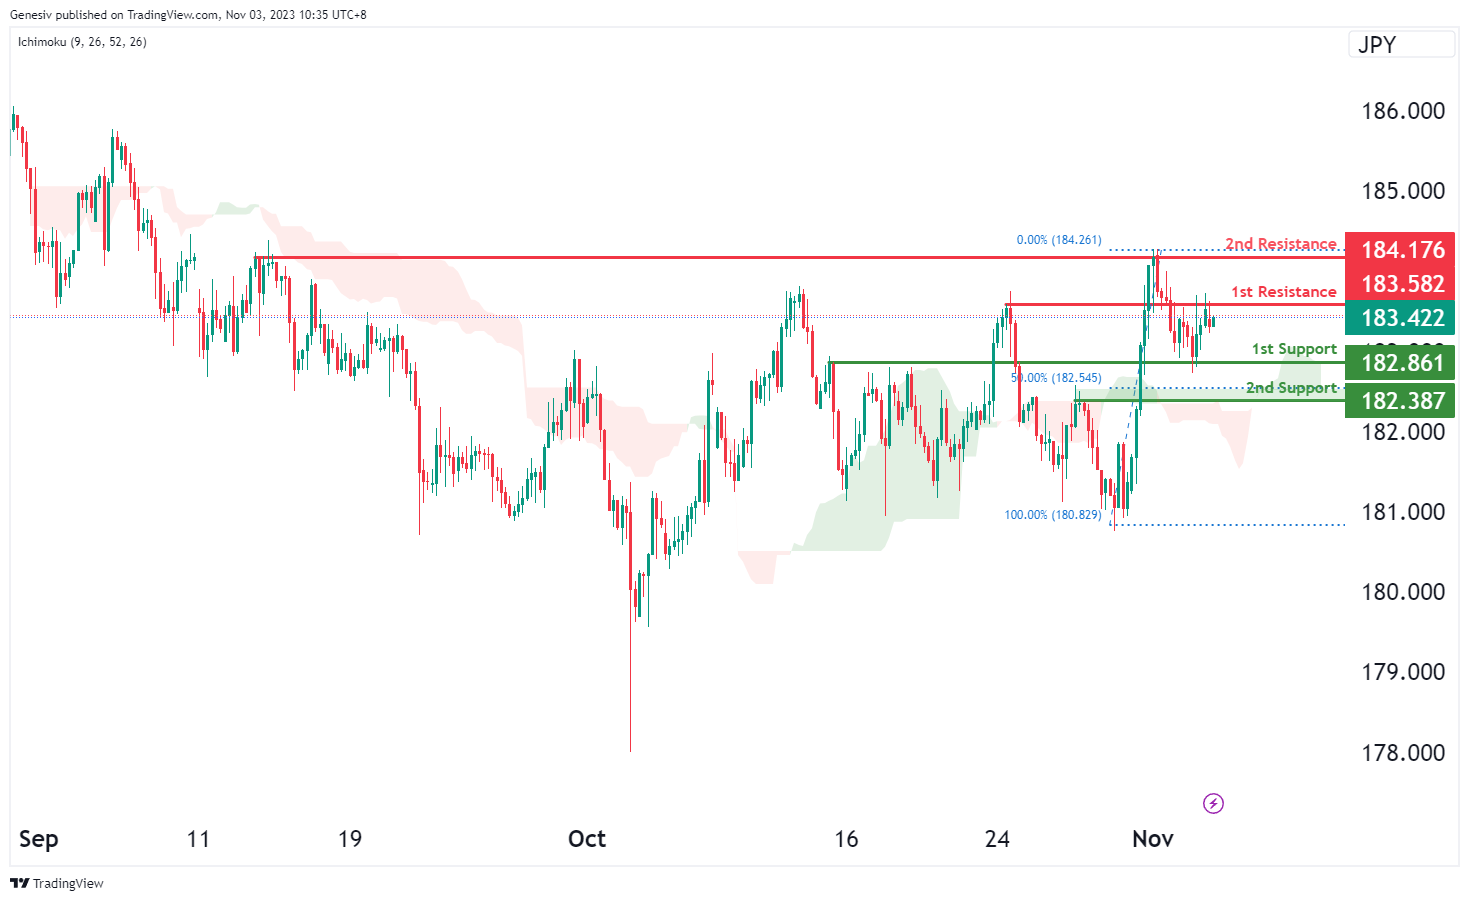
The GBP/JPY chart currently reflects a bearish momentum, indicating a potential scenario for a bearish reaction off the first resistance at 183.58, possibly leading to a drop to the first support.
The first support at 182.86 is identified as an overlap support, signifying a level where the price might find support during its potential decline.
The second support at 182.38 is recognized as pullback support and aligns with the 50% Fibonacci Retracement, indicating another level that could potentially offer support in the bearish movement.
On the resistance side, the first resistance at 183.58 is characterized as an overlap resistance, representing a significant barrier to the price’s upward movement in the current bearish scenario.
The second resistance at 184.17 is identified as multi-swing high resistance, further suggesting it might pose a substantial obstacle for the price’s upward movement within the prevailing bearish trend.
USD/CHF:
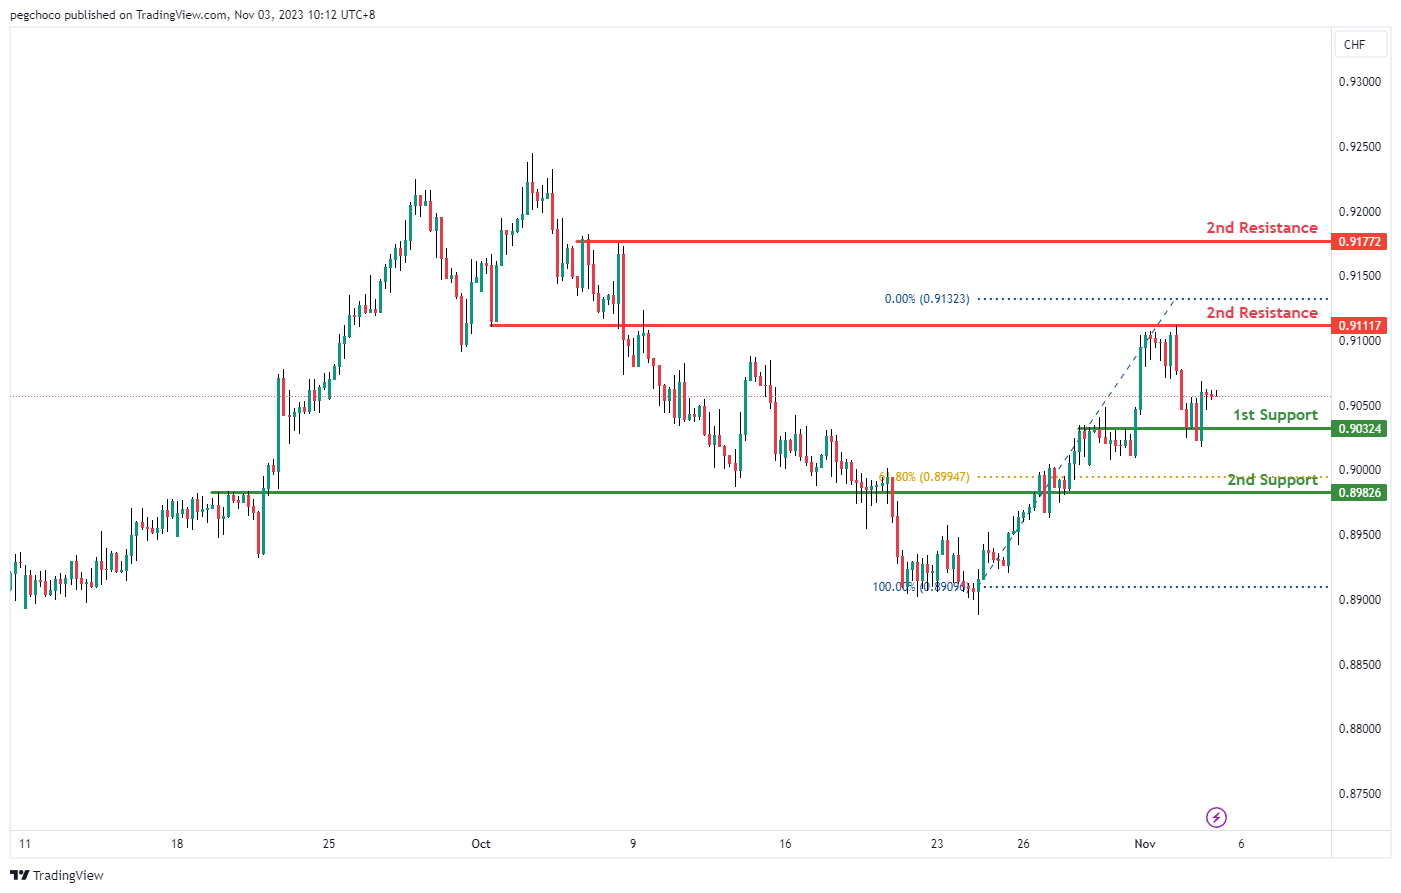
The USD/CHF chart currently exhibits a bearish overall momentum, indicating the potential for a bearish continuation towards the 1st support level at 0.9032. This support level is identified as a pullback support, suggesting it could be a significant level where buyers might step in. Furthermore, the 2nd support at 0.8982 is considered an overlap support and is reinforced by the presence of the 61.80% Fibonacci Retracement level, making it a strong potential support area.
On the resistance side, the 1st resistance at 0.9111 is categorized as an overlap resistance, indicating it may act as a level where selling interest could emerge. The 2nd resistance at 0.9177 is defined as a multi-swing high resistance, further highlighting its significance as a potential barrier to upward movement. Traders should keep a close eye on these support and resistance levels for potential price reactions and trading opportunities, in line with the overall bearish bias of the chart.
USD/JPY:
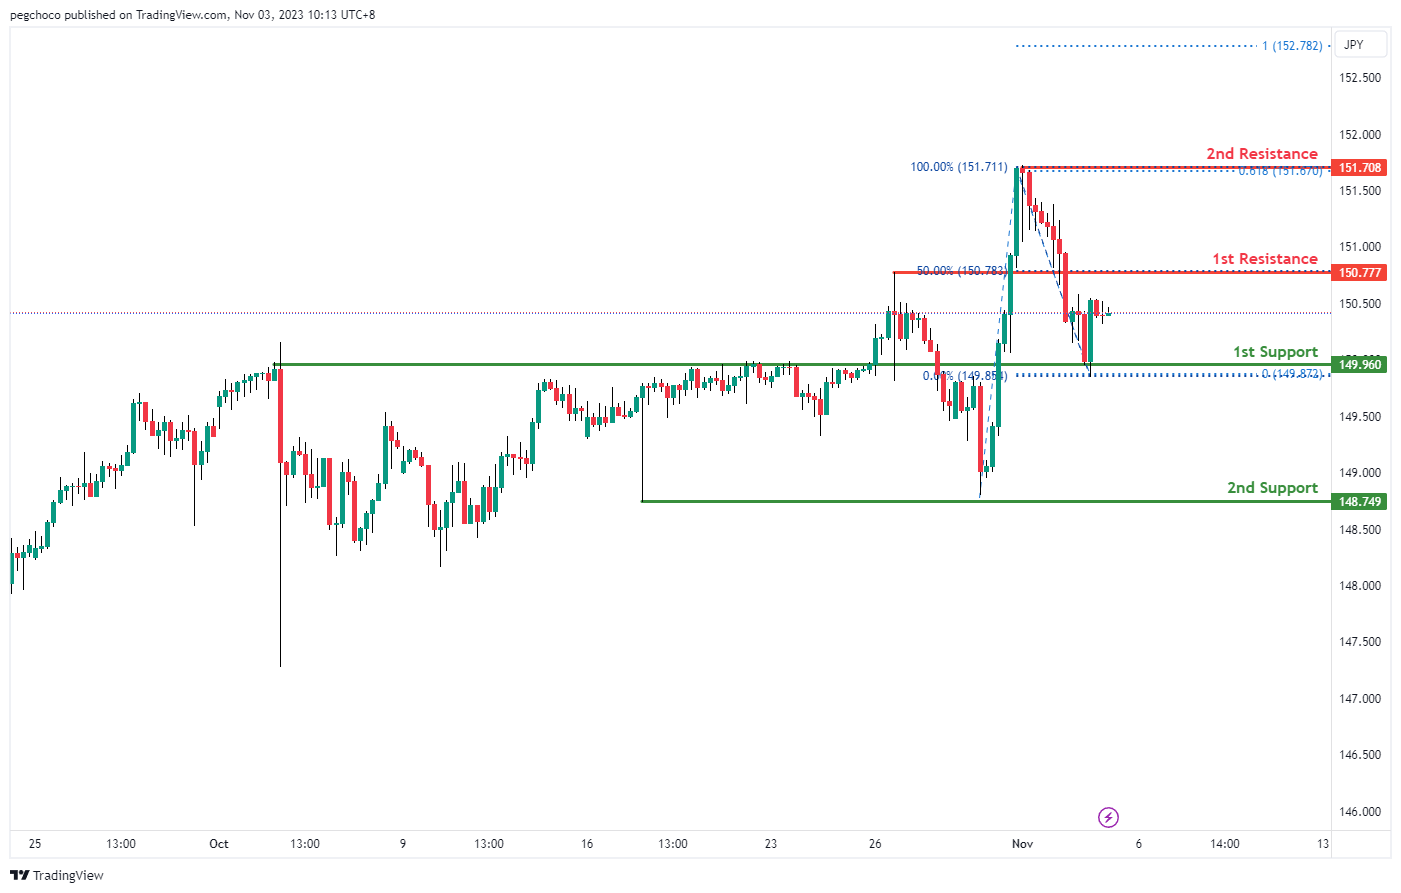
The USD/JPY chart currently has a bearish overall momentum, suggesting the potential for a bearish continuation towards the 1st support level at 149.96. This support level is identified as an overlap support, indicating its significance as a potential area where buyers may enter the market.
Additionally, the 2nd support at 148.74 is considered a swing low support, further reinforcing its potential as a support level.
On the resistance side, the 1st resistance at 150.77 is categorized as a pullback resistance, suggesting it could act as a level where the price may face selling pressure. This resistance level is also associated with the 50% Fibonacci Retracement, adding to its significance.
The 2nd resistance at 151.70 is defined as a swing high resistance, indicating another potential level where the price may encounter obstacles in its upward movement.
USD/CAD:
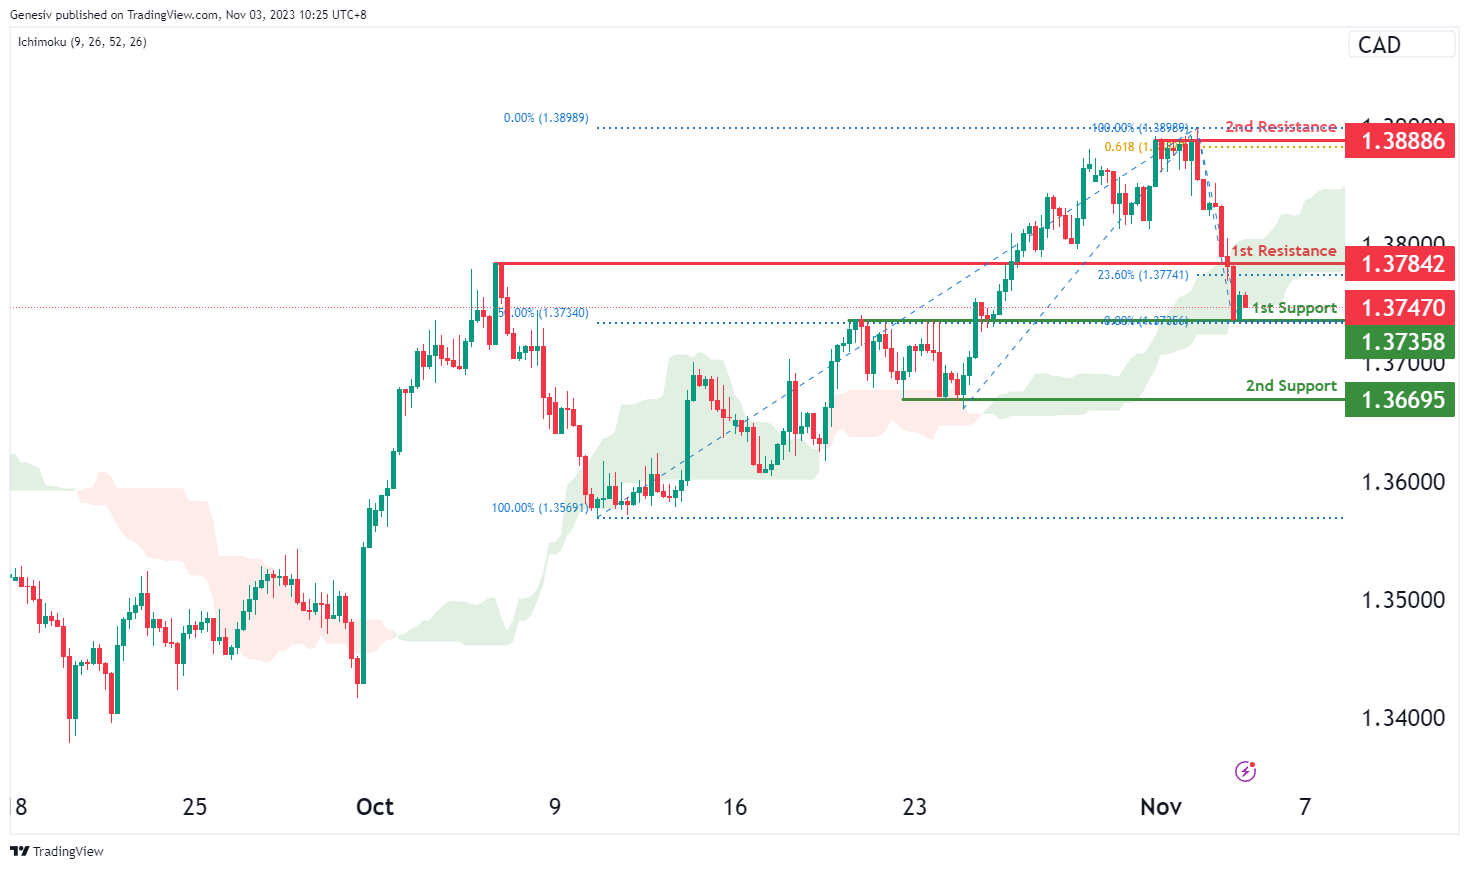
The USD/CAD chart currently demonstrates an overall bearish momentum. However, there is a potential scenario for price to make a bullish bounce off the 1st support. Price is also trading within the bullish Ichimoku cloud, potentially acting as a support zone.
The 1st support level at 1.3736 is identified as an overlap support that aligns with the 50.00% Fibonacci retracement level. Further below, the 2nd support level at 1.3669 is marked as a pullback support, indicating a potential area of price support.
To the upside, the 1st resistance level at 1.3784 is identified as a pullback resistance that aligns with the 23.60% Fibonacci retracement level. Beyond that, the 2nd resistance level at 1.3889 is also marked as a pullback resistance that aligns with the 61.80% Fibonacci projection level, further reinforcing the potential for resistance in that region.
AUD/USD:
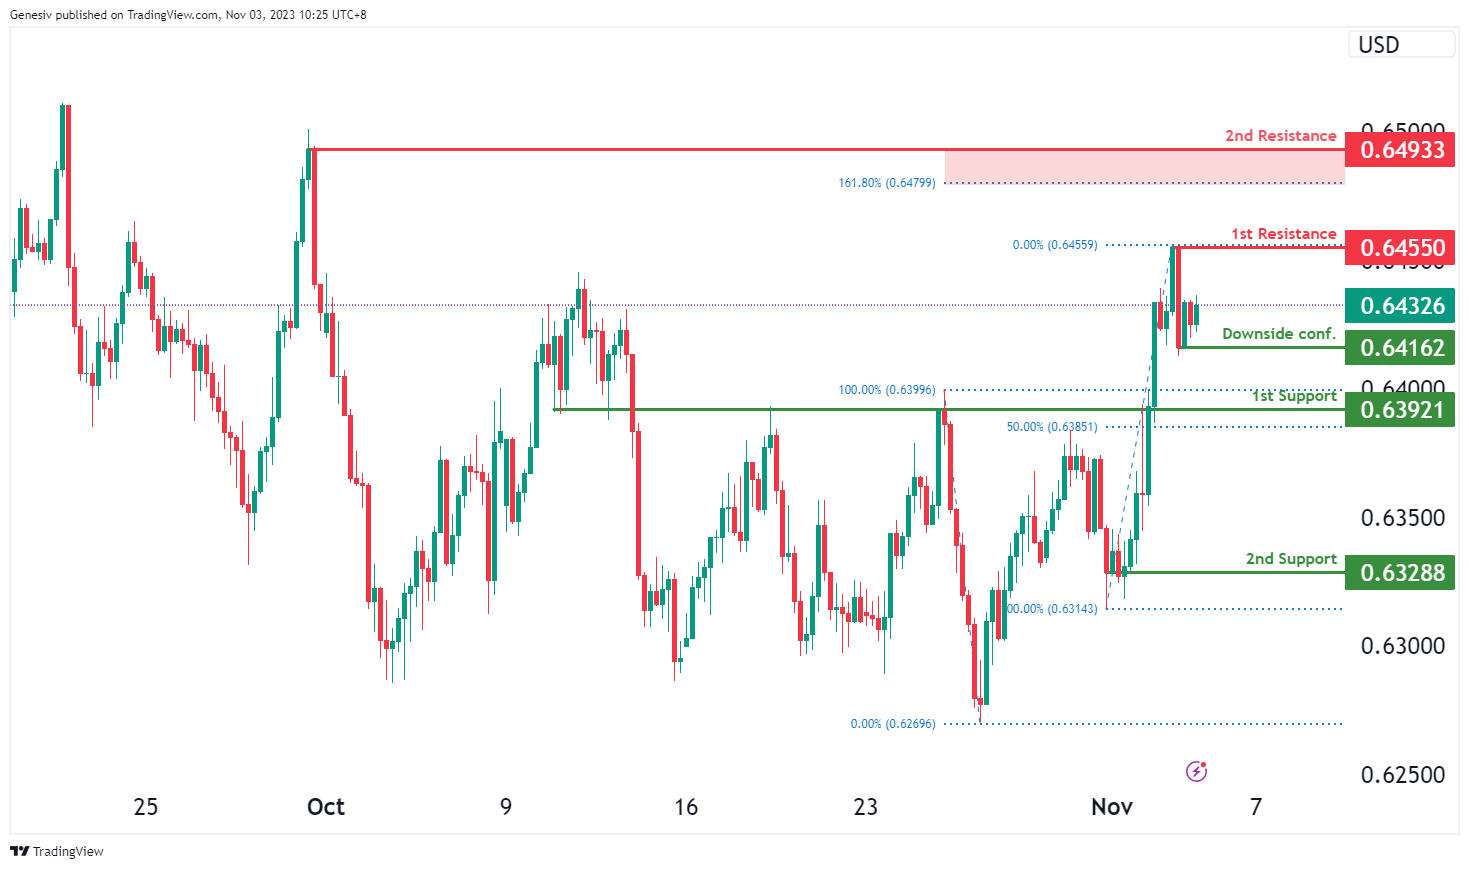
The AUD/USD chart currently exhibits an overall bullish momentum, suggesting a potential for a bullish continuation towards the 1st resistance.
The 1st resistance level at 0.6455 is identified as a pullback resistance. Higher up, the 2nd resistance level at 0.6493 is also noted as a swing-high resistance that aligns close to the 161.80% Fibonacci extension level.
On the support side, should price break below the downside confirmation at 0.6416, it could continue to fall towards the 1st support. The 1st support level at 0.6392 is identified as an overlap support that aligns close to the 50.00% Fibonacci retracement level. Further below, the 2nd support level at 0.6329 is marked as a pullback support, indicating a potential for a strong price support.
NZD/USD
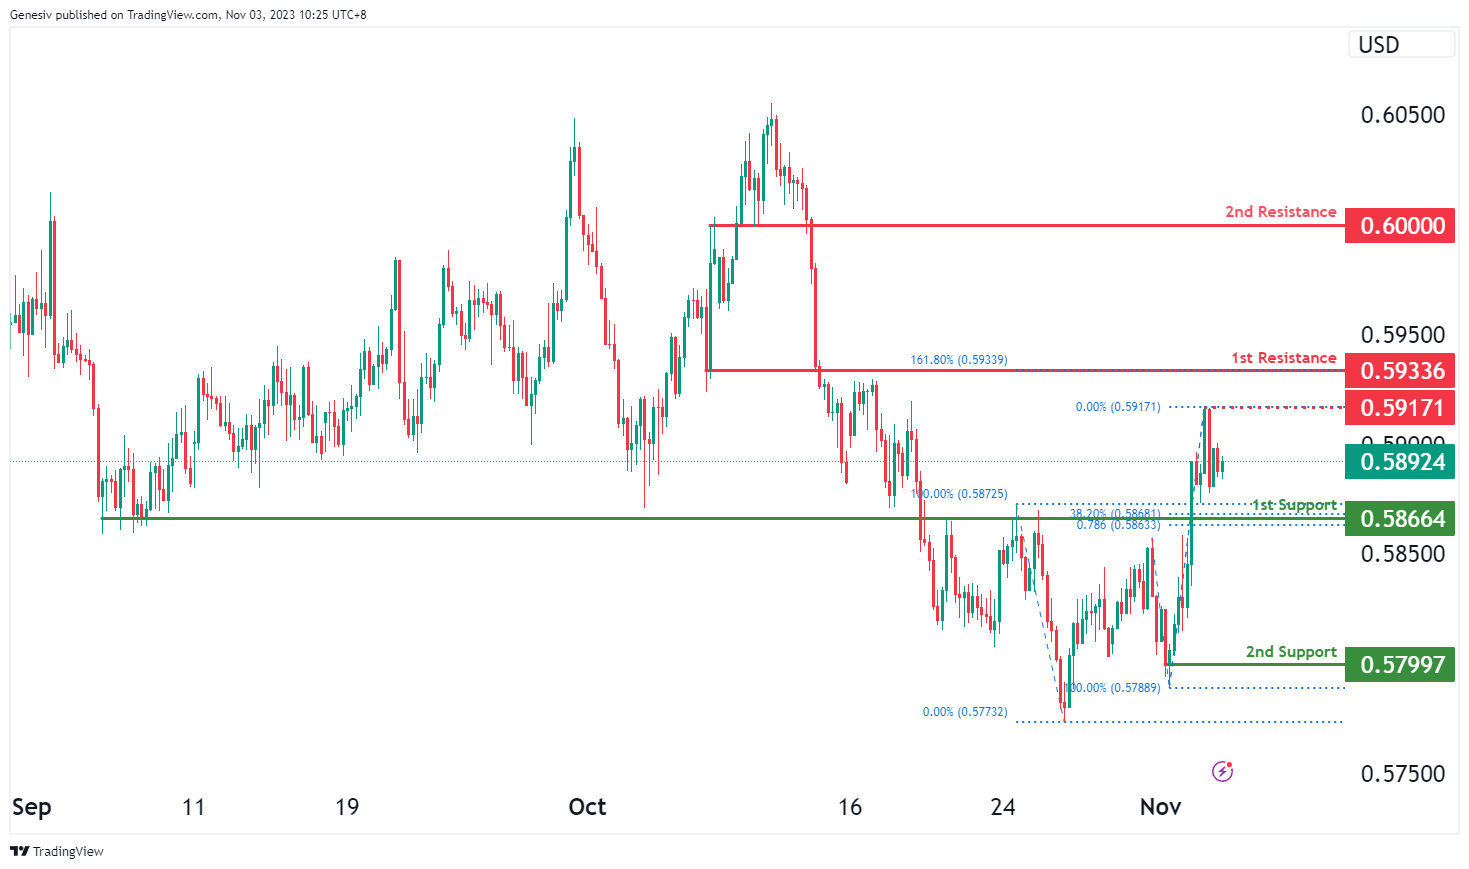
The NZD/USD chart currently demonstrates an overall bullish momentum, suggesting a potential for a bullish continuation towards the 1st resistance.
The intermediate resistance level at 0.5917 is identified as a pullback resistance while the 1st resistance level at 0.5934 is identified as an overlap resistance that aligns with the 161.80% Fibonacci extension level. Beyond this, the 2nd resistance level at 0.6000 is also noted as an overlap resistance, acting as a potential barrier to upward price movements.
To the downside, the 1st support level at 0.5866 is identified as an overlap support that aligns with a confluence of Fibonacci levels i.e. the 38.20% retracement and the 78.60% projection levels. Additionally, the 2nd support level at 0.5799 is marked as a pullback, potentially acting as a strong support zone.
DJ30:
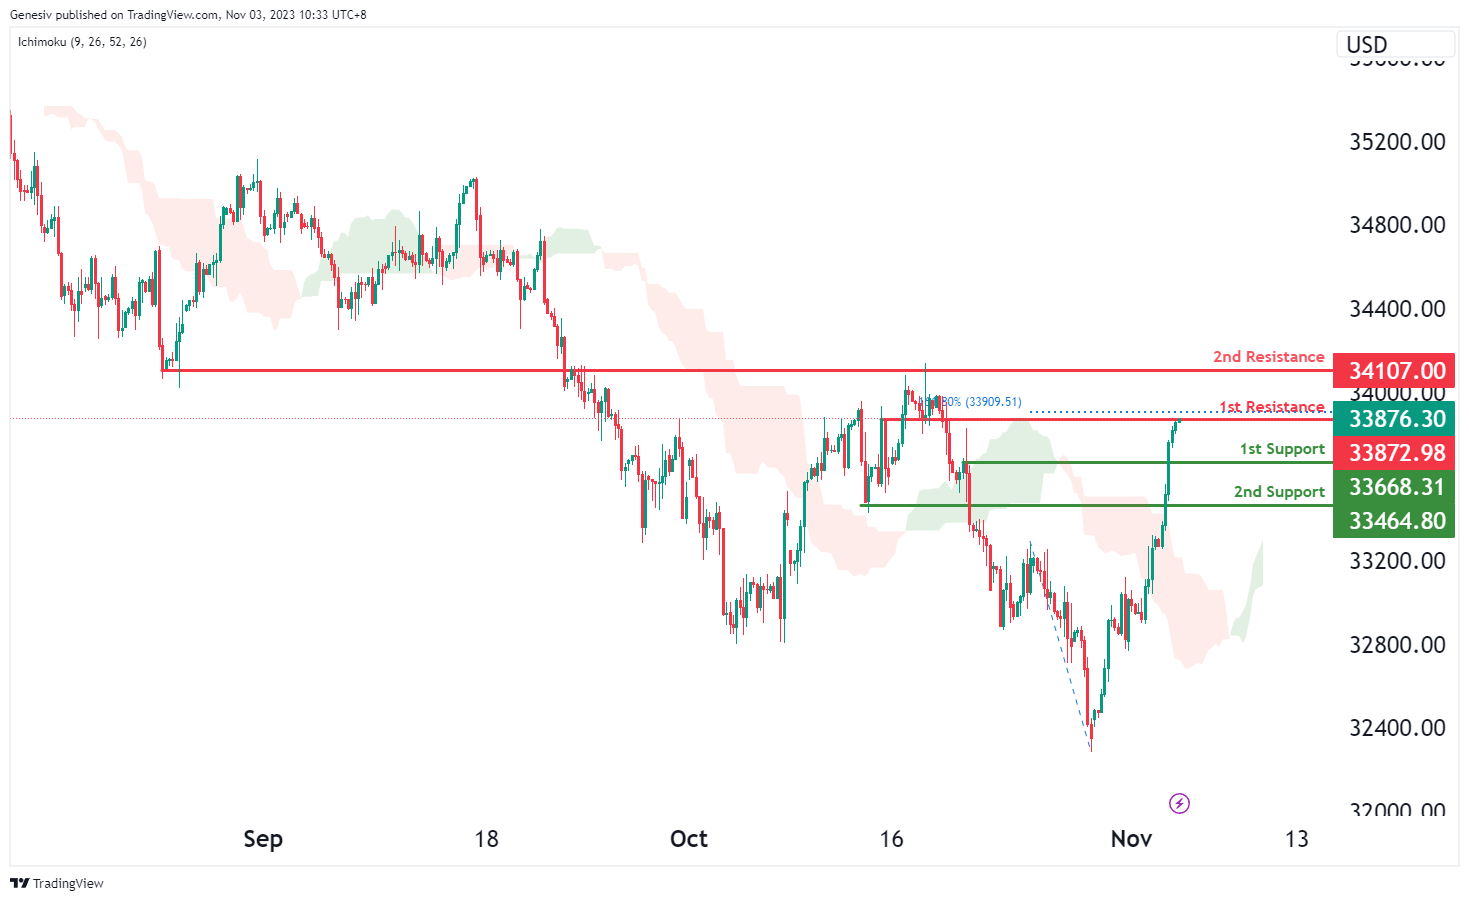
The DJ30 chart currently demonstrates a bearish momentum, suggesting a potential scenario for a bearish reaction off the first resistance at 33872.98, potentially leading to a drop to the first support.
The first support at 33668.31 is considered as a pullback support level, indicating a point where the price might find support during its downward movement.
The second support at 33464.80 is also identified as pullback support, providing an additional level that could offer support in case of a decline.
Regarding resistance levels, the first resistance at 33872.98 is characterized as pullback resistance and coincides with the 161.80% Fibonacci Extension, indicating a significant barrier to the price’s upward movement in the current bearish scenario.
The second resistance at 34107.00 is recognized as an overlap resistance, suggesting it could pose another substantial barrier to the price’s upward movement within the prevailing bearish trend.
GER40:
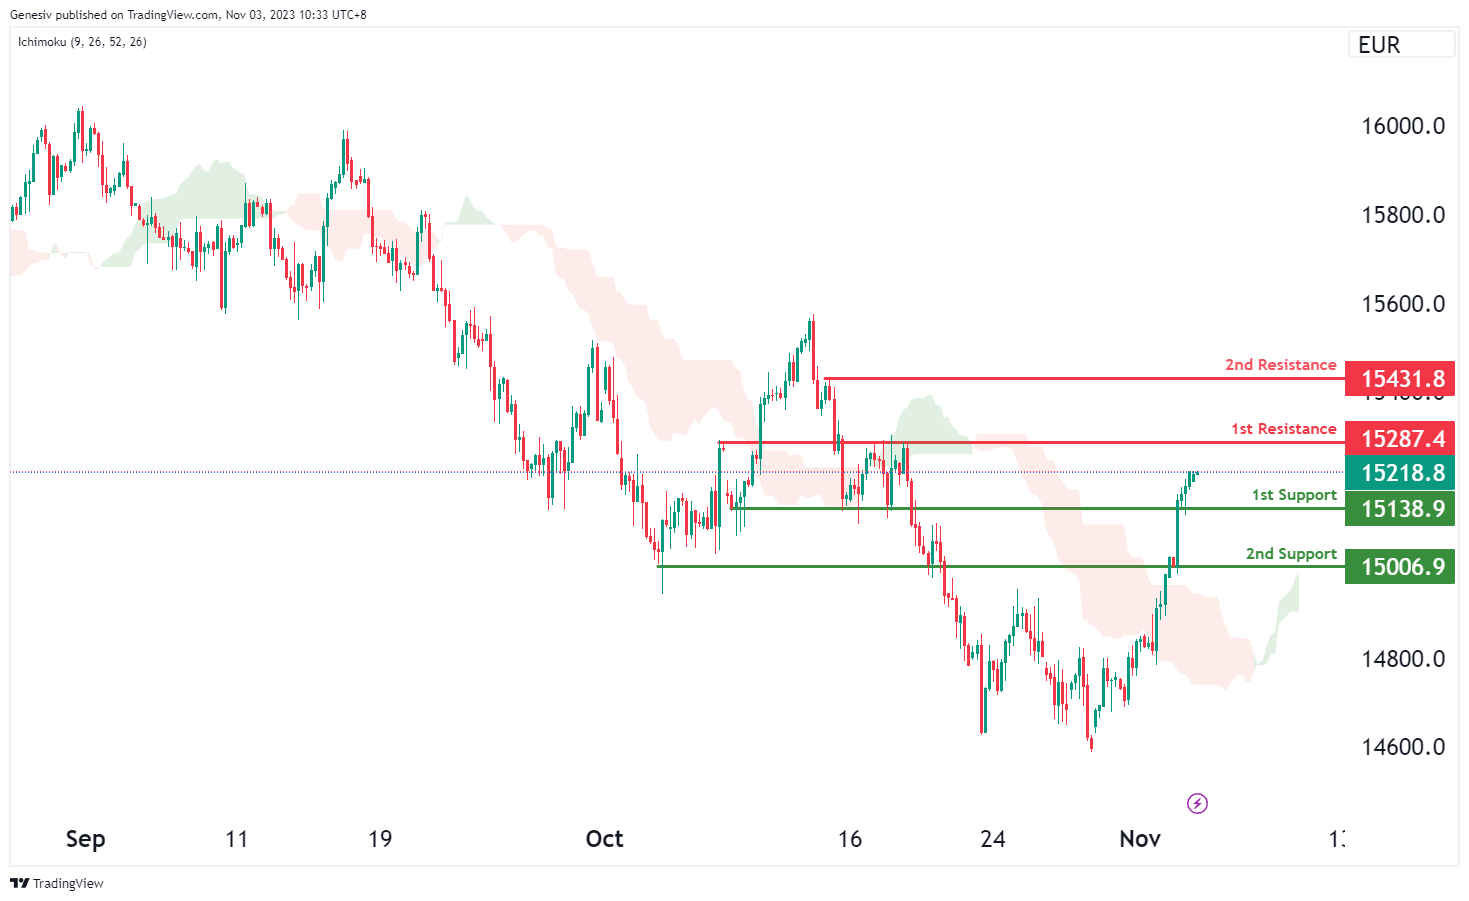
The GER40 chart is currently indicating a bullish momentum, suggesting a potential scenario for a bullish continuation towards the first resistance at 15287.40.
The first support at 15138.90 is identified as a pullback support, indicating a level where the price might find support during any potential retracement in its upward movement.
The second support at 15006.90 is recognized as an overlap support, indicating an additional level that might offer support during the bullish trend.
On the resistance side, the first resistance at 15287.40 is characterized as an overlap resistance, suggesting it could act as a significant barrier to the price’s upward movement within the current bullish scenario.
The second resistance at 15431.80 is identified as a swing high resistance, indicating it might pose a substantial obstacle for the price’s upward movement within the prevailing bullish trend.
US500
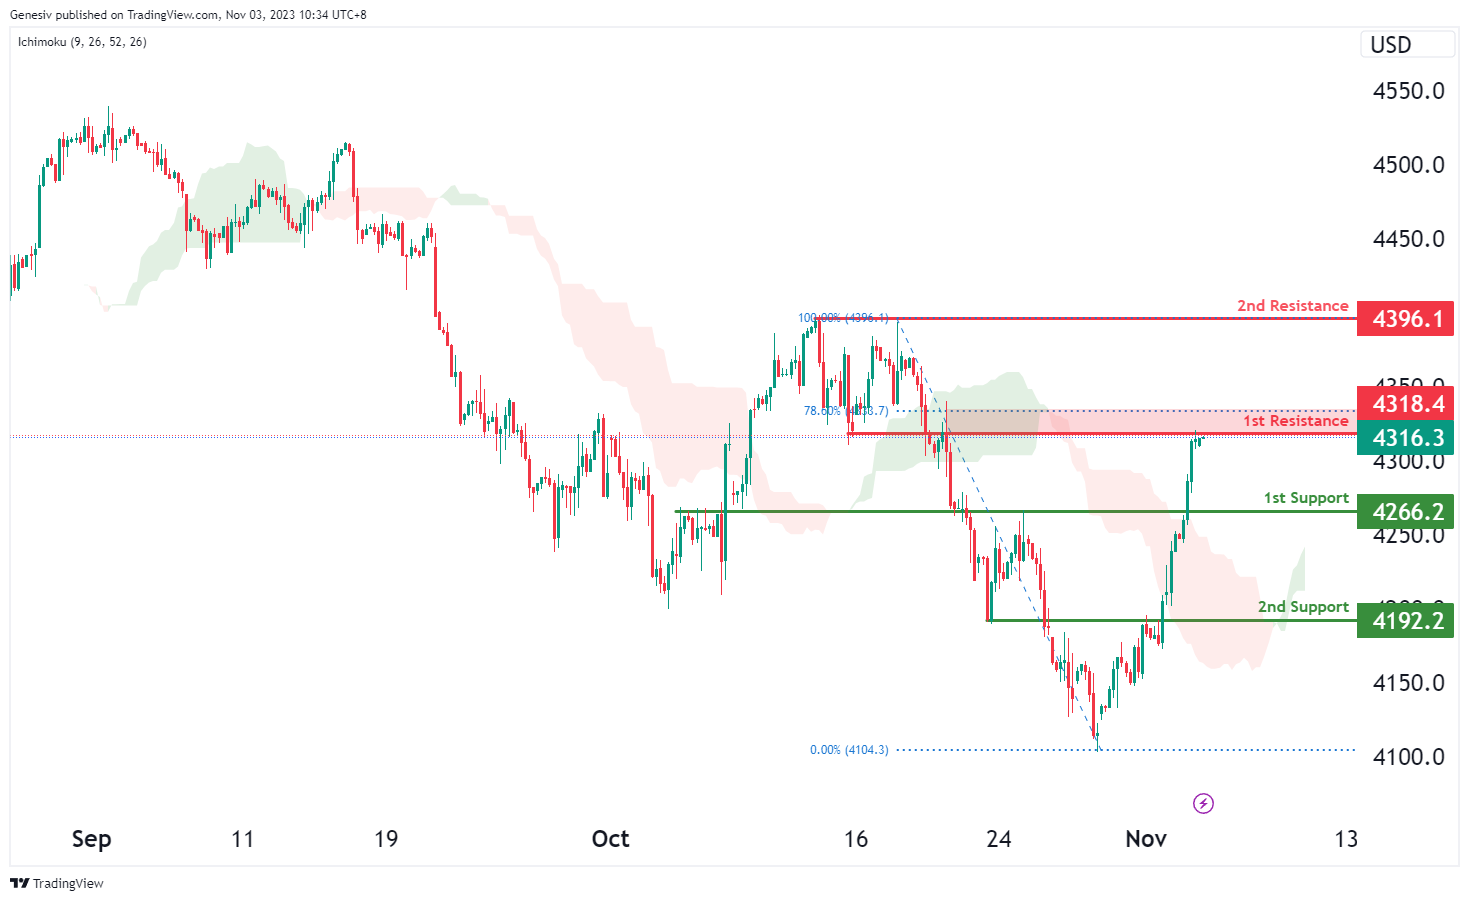
The US500 chart currently reflects a bearish momentum, suggesting a potential scenario for a bearish reaction off the first resistance at 4318.4, potentially resulting in a drop to the first support.
The first support at 4266.2 is identified as a pullback support, indicating a level where the price might find support during its downward movement.
The second support at 4192.2 is recognized as an additional pullback support, providing another level that might offer support if the price continues its decline.
On the resistance side, the first resistance at 4318.4 is characterized as an overlap resistance and coincides with the 78.60% Fibonacci Retracement, indicating a significant barrier to the price’s upward movement in the current bearish scenario.
The second resistance at 4396.1 is identified as a multi-swing high resistance, suggesting it could pose a substantial obstacle for the price’s upward movement within the prevailing bearish trend.
BTC/USD:
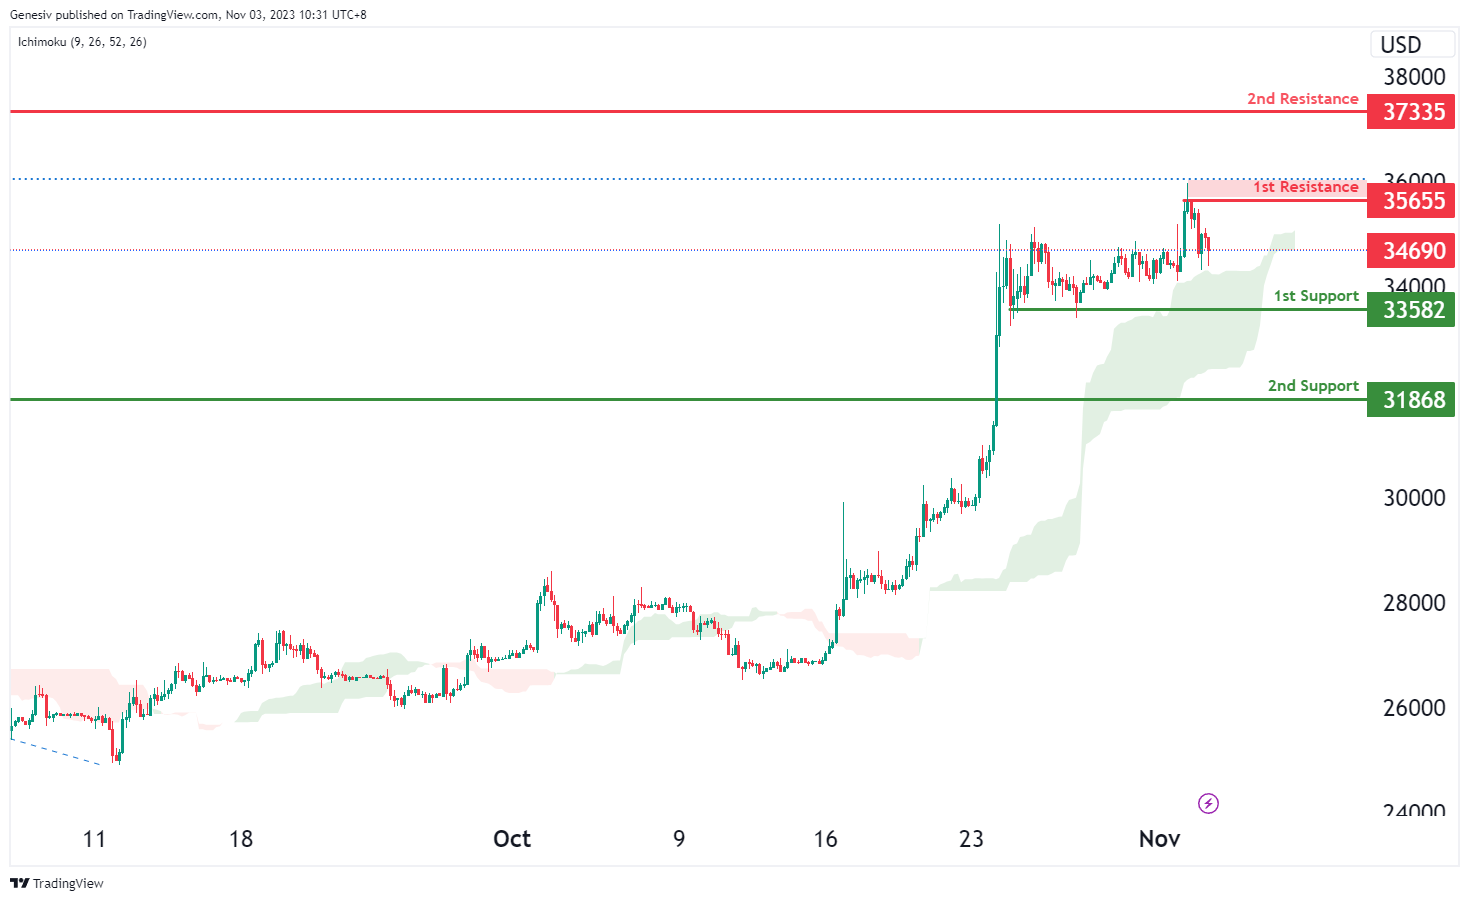
The BTC/USD chart currently reflects a neutral momentum, indicating the potential for price fluctuation between the first resistance at 35655 and the first support level at 33582.
The first support at 33582 is attributed to being a multi-swing low support, signifying a level where the price could find support in the event of a decline.
The second support at 31868 is considered a pullback support, indicating an additional level that might provide support if the price experiences a decline.
In terms of resistance, the first resistance at 35655 is recognized as swing high resistance, coinciding with the 161.80% Fibonacci Extension level. This level could pose a significant barrier to the price’s upward movement in the neutral scenario.
Furthermore, the second resistance at 37335 is identified as pullback resistance, suggesting it as another potential level that might impede further bullish movement within this neutral phase.
ETH/USD:
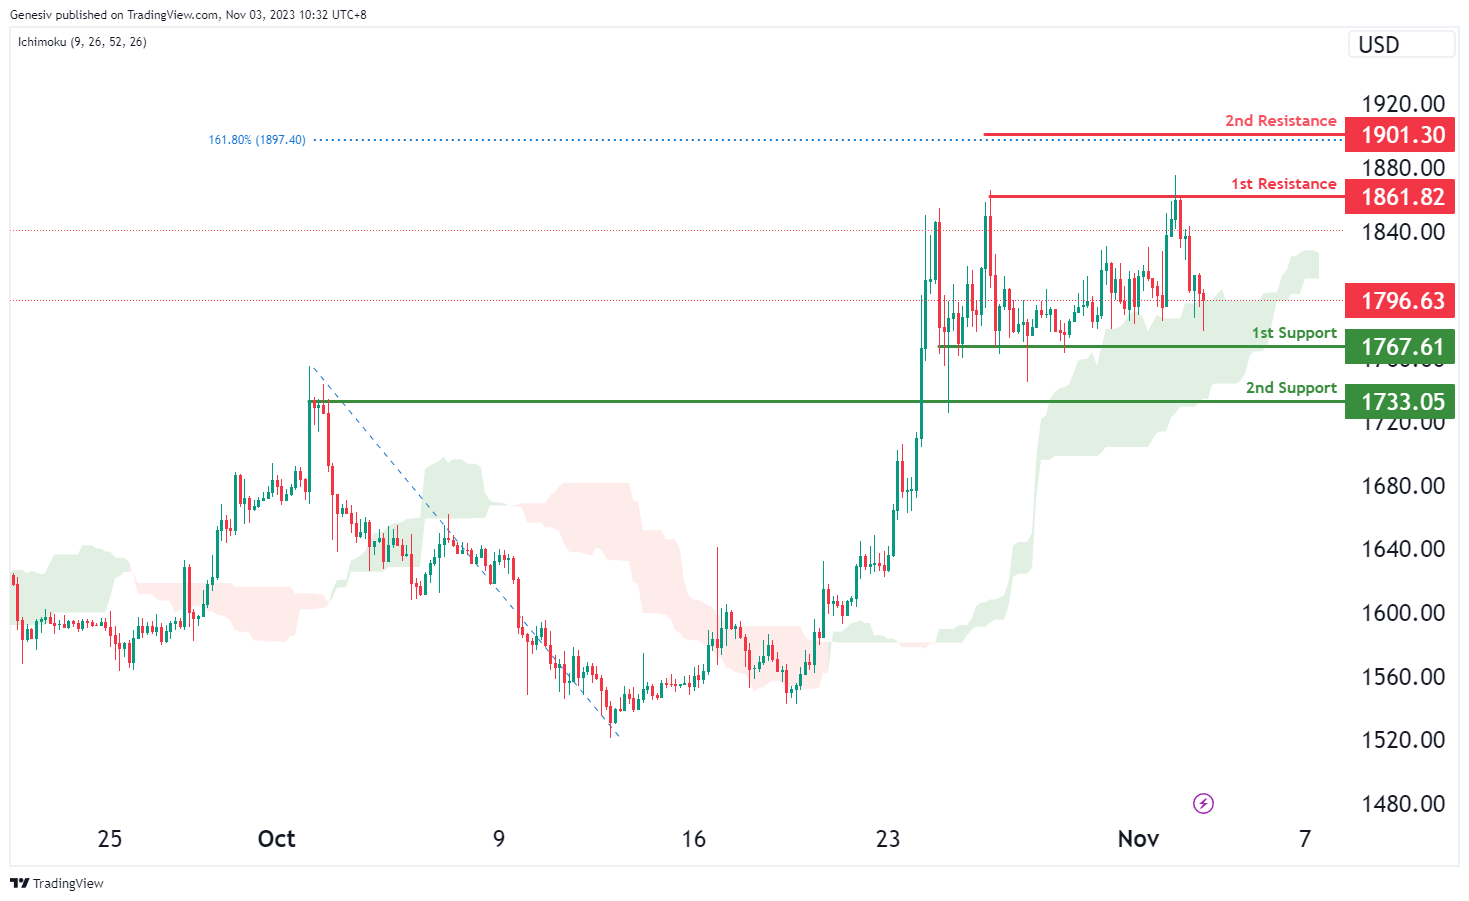
The ETH/USD chart currently shows a neutral momentum, suggesting a potential scenario for price fluctuation between the first resistance at 1861.82 and the first support level at 1767.61.
The first support at 1767.61 is considered a multi-swing low support, indicating a level where the price might find support in case of a decline.
The second support at 1733.05 is recognized as a pullback support, providing an additional level that might offer support if the price experiences a decline.
On the resistance side, the first resistance at 1861.82 is attributed to multi-swing high resistance, representing a significant barrier that the price might encounter during upward movements within this neutral phase.
The second resistance at 1901.30 aligns with the 161.80% Fibonacci Extension level, suggesting it as another potential level that could impede further bullish movement within this neutral phase.
WTI/USD:
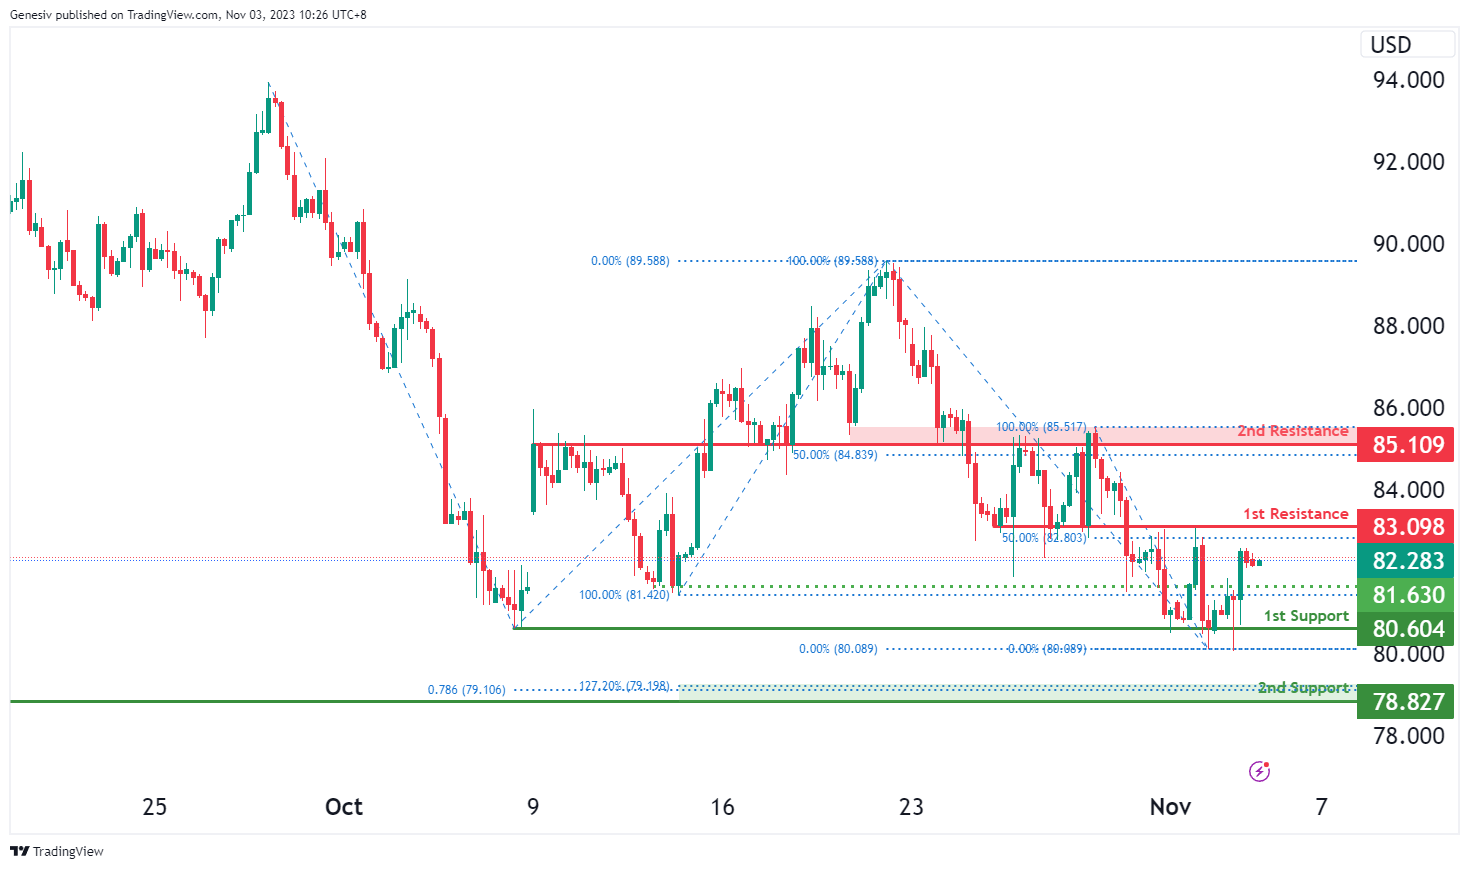
The WTI chart currently exhibits an overall bearish momentum. However, there is a potential for price to make a bullish continuation towards the 1st resistance.
The 1st resistance level at 83.09 is noted as an overlap resistance that aligns with the 50.00% Fibonacci retracement level. Higher up, the 2nd resistance level at 85.11 is also marked as an overlap resistance that aligns with the 50.00% Fibonacci retracement level, making it a strong potential barrier to upward price movement.
To the downside, the intermediate support level at 81.63 is identified as a pullback support while the 1st support level at 80.60 is identified as a swing-low support. Additionally, the 2nd support level at 78.83 is marked as a pullback support that aligns with a confluence of Fibonacci levels i.e. the 127.20% extension and the 78.60% projection levels, reinforcing a potential support zone.
XAU/USD (GOLD):
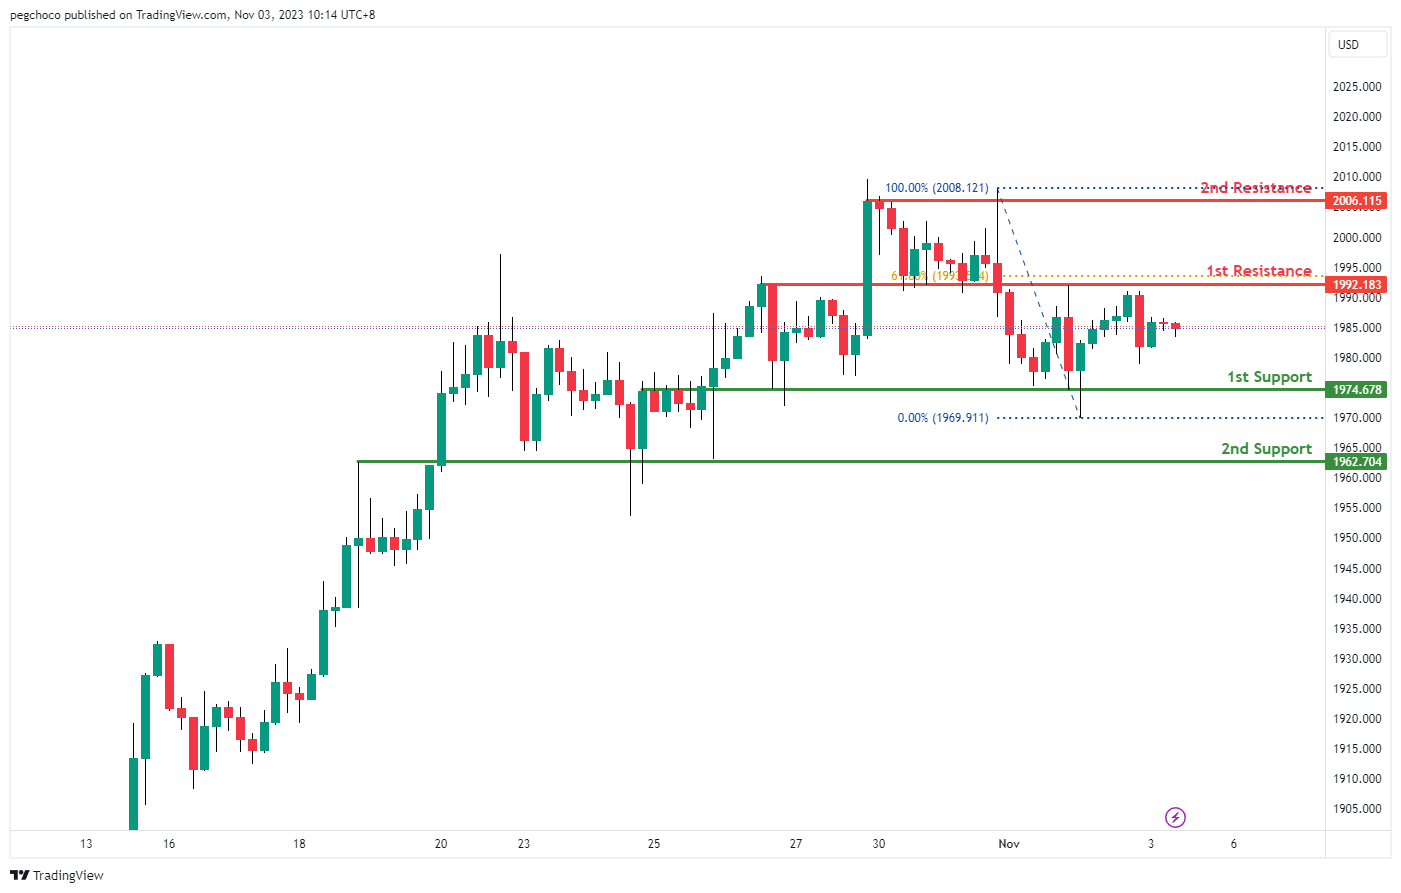
The XAUUSD (Gold/US Dollar) chart currently exhibits a neutral overall momentum, suggesting the potential for price to fluctuate between the 1st support and 1st resistance levels.
The 1st support level at 1974.67 is identified as an overlap support, indicating its significance as a potential area where buyers may enter the market.
Furthermore, the 2nd support at 1962.70 is also considered an overlap support, reinforcing its potential as a support level.
On the resistance side, the 1st resistance at 1992.18 is categorized as an overlap resistance and is associated with the 61.80% Fibonacci Retracement, adding to its significance as a potential area where selling pressure may emerge.
The 2nd resistance at 2006.11 is defined as a multi-swing high resistance, indicating another potential level where the price may encounter obstacles in its upward movement.
NFP to test stock market optimism
The upcoming US non-farm payroll report is set to capture the market's full attention today, with investors seeking signs that could affirm Fed's interest rate has already peaked. In light of Fed Chair Jerome Powell's comments this week emphasizing the need for "some slower growth and some softening in the labor market" to stabilize prices, the details of the job data, particularly wage growth, will be under intense scrutiny.
The market consensus pegs the headline growth of employment at 172k for October, a significant decrease from September's robust 336,000 figure. Unemployment rate is projected to hold steady at 3.8%, with average hourly earnings expected to notch up by 0.3% mom.
Preceding indicators present a mixed picture: ISM Manufacturing employment showed a notable decline 51.2 to 46.8, ADP reported a modest private employment increase of 113k that fell short of expectations, and initial unemployment claims hovered around the 210k mark on a four-week moving average, indicating stability.
Wage growth emerges as the unpredictable factor in the equation, with the potential to sway Fed's monetary policy direction. This data point has been particularly scrutinized for inflationary signals and the possibility of triggering another rate hike.
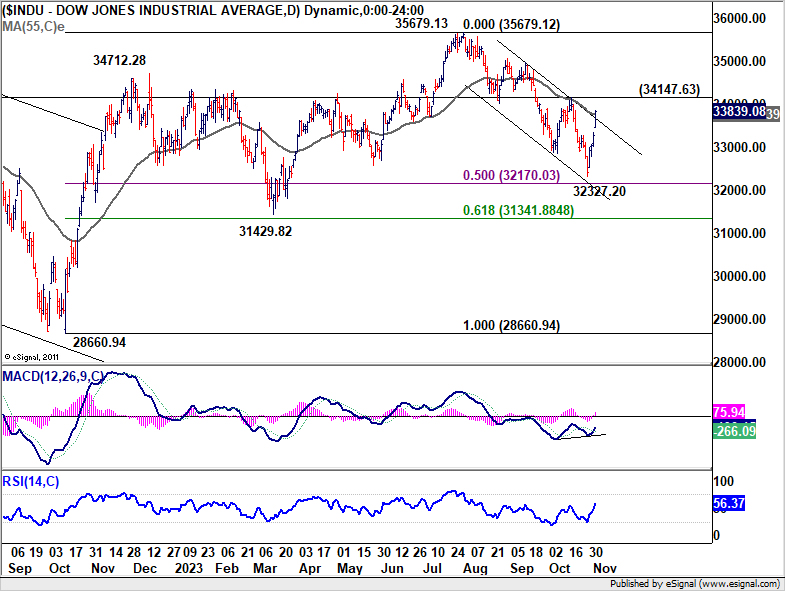
Equity markets have reflected a sense of optimism this week, with strong rebound in DOW and other major indexes. DOW's correction from August high at 35679.13 could have already concluded at 32327.20. To further strengthen the case, DOW will need to break through 34147.63 resistance decisively. However, rejection by 34147.63 will retain near term bearishness for another decline through 32327.20.
The impending non-farm payroll report could be a critical determinant of the market's direction in the closing months of the year.
China Caixin PMI services ticks to 50.4, composite fell to 50
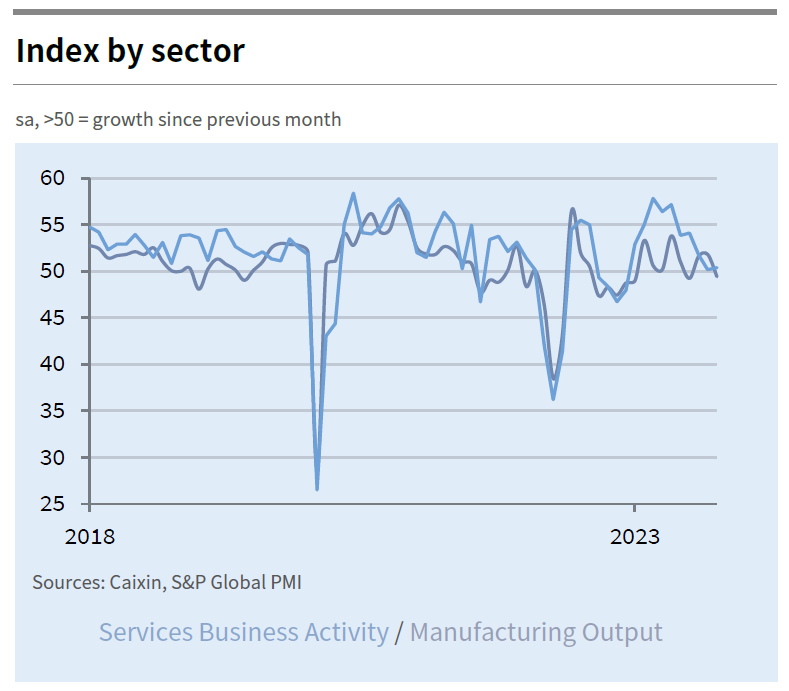
China's service sector showed a glimmer of resilience in October, with Caixin PMI Services edging up marginally from 50.2 to 50.4, meeting expectations. However, this slight uptick could not buoy the overall PMI Composite, which leveled at the neutral 50.0 threshold, down from 50.9 in the previous month.
The slight uptick in the services sector was overshadowed by a dip in manufacturing (which fell from 50.6 to 49.5). The details reveal a mixed scenario: composite new business inched forward at its weakest pace in ten months. Service providers and goods producers alike witnessed decelerated growth in sales.
Employment trends also painted a picture of caution. There was a small overall decline in jobs, with manufacturing bearing the brunt through more pronounced job losses, while employment in the service sector hit a plateau.
On the pricing front, inflationary pressures were somewhat contained. Input costs across the combined sectors rose modestly, maintaining a muted pattern of cost escalation. Despite this, firms nudged their selling prices upwards, continuing a trend that could suggest confidence in passing on costs, albeit the rate of charge inflation was just marginally lower than the 18-month peak seen in September.
USD/JPY Remains Supported For More Gains, US NFP Next
Key Highlights
- USD/JPY rallied toward 151.70 before there was a pullback.
- A connecting bearish trend line is forming with resistance near 150.60 on the 4-hour chart.
- EUR/USD and GBP/USD avoided more downsides with a minor recovery.
- The US nonfarm payrolls could increase by 180K in Oct 2023, down from 336K.
USD/JPY Technical Analysis
The US Dollar remained strong and rallied above 150.00 against the Japanese Yen. USD/JPY traded as high as 151.70 before there was a pullback.
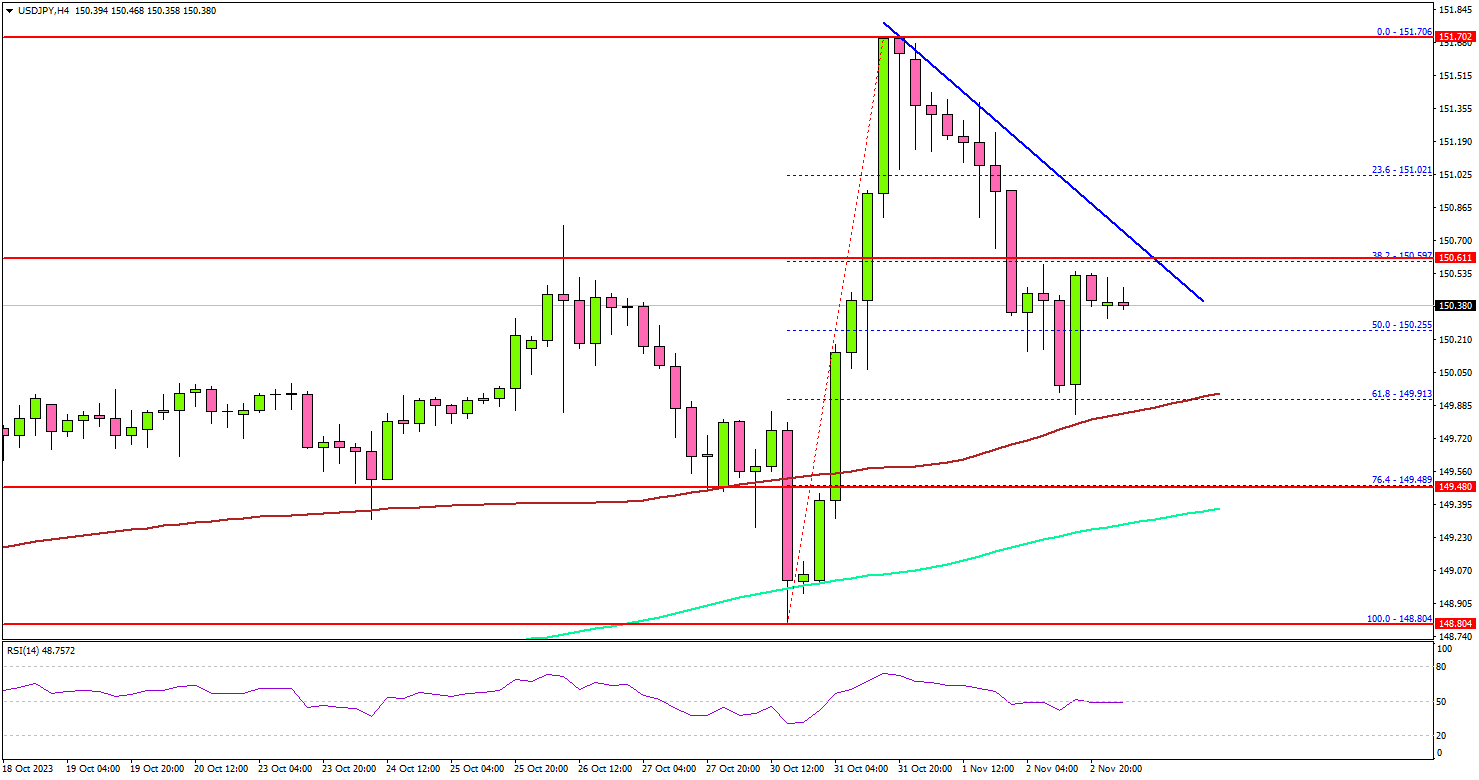
Looking at the 4-hour chart, the pair corrected lower below the 151.00 level. There was a move below the 50% Fib retracement level of the upward move from the 148.80 swing low to the 151.70 high.
The pair tested the 100 simple moving average (red, 4 hours) and remained stable above the 200 simple moving average (green, 4 hours). The main support sits near the 149.50 level or the 76.4% Fib retracement level of the upward move from the 148.80 swing low to the 151.70 high.
A downside break below the 149.50 support and the 200 simple moving average (green, 4 hours) might spark a sharp decline. The next key support sits at 148.40.
On the upside, the pair might face resistance near the 150.70 level. There is also a connecting bearish trend line forming with resistance near 150.60 on the same chart.
The next key resistance is near 151.00, above which the pair could rise toward the 151.70 level. If there is a clear move above 151.70, the pair could rise toward the 152.50 resistance.
Looking at EUR/USD, the pair found support near the 1.0520 level and recently started a recovery wave above the 1.0585 level.
Economic Releases
- US nonfarm payrolls for Oct 2023 – Forecast 180K, versus 336K previous.
- US Unemployment Rate for Oct 2023 - Forecast 3.8%, versus 3.8% previous.
- US ISM Services Index for Feb 2023 – Forecast 53.0, versus 53.6 previous.
ECB’s Schnabel: We cannot close the door to further rate hikes
ECB Executive Board member Isabel Schnabel warned in a speech that the "last mile" in disinflation process is the hardest, more uncertain, slower and bumpier. Inflation expectations are fragile, and ECB cannot close the door for further rate hikes.
In a candid analogy, Schnabel compared the disinflation process to a marathon, signifying the strenuous and prolonged effort required to bring inflation back to target levels.
"Disinflation really does seem like a long-distance race," Schnabel stated, "When the runner enters the last mile, the hardest work begins" which requires "perseverance and vigilance". She added, "The same is true for our fight against inflation."
Schnabel's words paint a picture of cautious optimism mixed with a stern warning against premature relaxation in monetary policy. "With our current monetary policy stance, we expect inflation to return to our target by 2025," she affirmed.
However, she was quick to temper optimism with a dose of reality about the road ahead. "The disinflation process during the last mile will be more uncertain, slower and bumpier".
"Continued vigilance is therefore needed," Schnabel cautioned. "After a long period of high inflation, inflation expectations are fragile and renewed supply-side shocks can destabilise them, threatening medium-term price stability."
"This also means that we cannot close the door to further rate hikes," she added.
USDCAD Wave Analysis
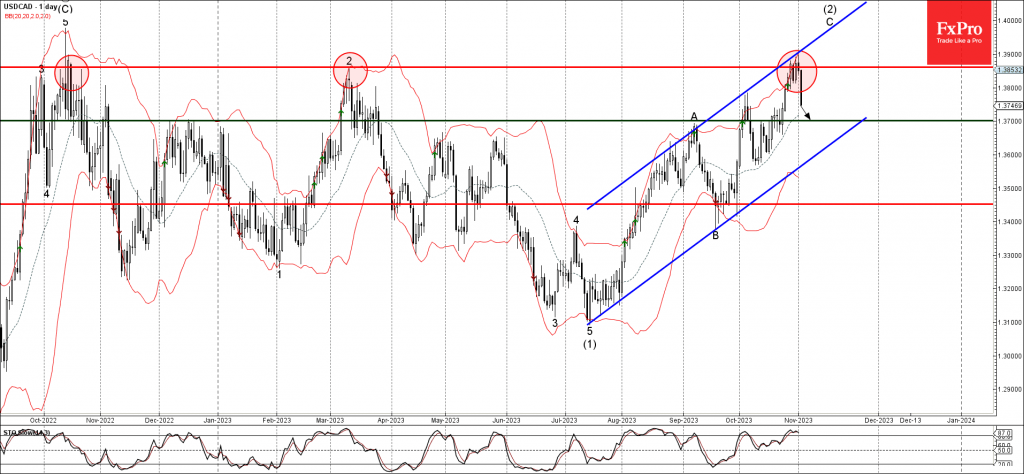
- USDCAD reversed from major resistance level 1.3860
- Likely to fall to support level 1.3700
USDCAD currency pair recently reversed down from the major resistance level 1.3860 (which has been reversing the pair from October of 2022, as can be seen below).
The resistance level 1.3860 was strengthened by the upper daily Bollinger Band and by the resistance trendline of the daily up channel from July.
Given the strength of the resistance level 1.3860 and the still overbought daily Stochastic, USDCAD can be expected to fall further toward the next support level 1.3700.
CADCHF Wave Analysis
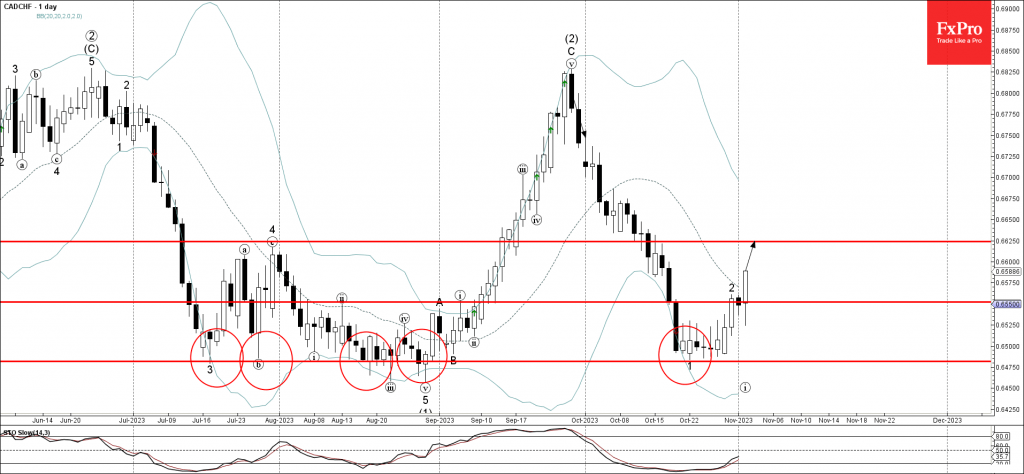
- CADCHF broke resistance level 0.6550
- Likely to rise to resistance level 0,6625
CADCHF recently broke through the resistance level 0.6550 (which stopped the pervious minor correction 2 at the end of October, as can be seen below).
The breakout of the resistance level 0.6550 accelerated the active short-term correction 2 from the end of last month.
Given the strong Swiss franc sales and the proximity of the powerful support level 0.6480, CADCHF can be expected to rise further toward the next resistance level 0.6625.
Sunset Market Commentary
Markets
Unchanged. The Bank of England followed the European and US example and kept rates steady at 5.25%. The vote was not unanimous though, with 3 of the 9 members in favour of lifting rates 25 bps. At the heart of the decision lies a weak economy. GDP is projected to be flat in Q3 this year and to grow a negligible 0.1% in the running quarter. Both are softer than expected back in August. The BoE then expects zero growth for 2024 (with a 50% chance of a recession from Q2 on) and just 0.25% in 2025. The economy is seen in excess supply from 2024 through the end of the policy horizon (2026). Employment growth probably softened over the second half of this year and to a greater extent than thought in the summer. Based on market expectations for the policy rate to remain at the current level until Q3 2024 and then declining to 4.25% by end 2026, inflation (6.7% in September) should hit the 2% target by mid-2025 before dropping below as an increasing degree of economic slack reduces domestic inflationary pressures. Risks to the outlook remain skewed to the upside. The BoE retains the possibility of hiking further “if there were evidence of more persistent inflationary pressures”. Between the lines, however, we read a preference for keeping rates at the current level for longer over raising them once more. UK gilts hugely outperform global peers today, losing between 10.3 and 15.4 bps with money markets now convinced more than ever that tightening is over. While the BoE did have some impact, much of the losses already occurred before that in a catch-up move the US late yesterday. Sterling losses are contained. EUR/GBP bounces higher to 0.873.
Core bond yields extend yesterday’s decline. US rates ease another 0.1 (2-y)-11.4 (30-y) bps. An unexpected drop in Q3 unit labor costs (-0.8% q/q, the first decline since late 2022) amid a surge in productivity added to the move. Weekly jobless claims (217k) later topped the 210k estimate. German yields drop 2.4-8.1 bps with the long end outperforming. The 10-y yield touching 2.68% intraday effectively created the neckline of a double top technical pattern. For a second day straight, markets frontrunning the end of the tightening cycle in the advanced economies pushes equities comfortably higher. The EuroStoxx adds 1.9%, Wall Street opens about 1%+ higher. Risk on is hurting the USD. EUR/USD is testing resistance around 1.0635. DXY drops towards the 106 barrier. Even JPY is able to strengthen. USD/JPY 150 survives though.
News & Views
The Norwegian central bank unanimously decided to keep its policy rate unchanged at 4.25%. Based on the monetary policy committee’s assessment of the outlook, the policy rate will likely be raised in December even as inflation has fallen more than expected and economic activity has been somewhat lower than projected in the September Monetary Policy Report. The weaker currency poses upward inflation risks while underlying inflation needs to drop faster for the Norges Bank to hold its fire in December. If they hike, it will likely be the last move as the Committee assesses the policy rate close to the level needed to tackle inflation and with monetary policy having a tightening effect on the economy. There will likely be a need to maintain a tight stance for some time ahead to bring inflation down to the target, governor Wolden Bache admitted. NOK swap rates drop more than global peers today, losing 13 to 15 bps across the curve. The Norwegian krone suffers from the loss of rate support with EUR/NOK changing hands at 11.87, the highest level since June and compared to a YTD high of 12.11.
Swiss headline inflation rose by 0.1% M/M in October, with the Y/Y-figure stabilizing at 1.7%. Both were expected. Underlying core inflation however beat consensus rising by 0.2% M/M and 1.5% Y/Y (from 1.3% in September vs 1.4% forecast). The pick-up in core inflation was the first since February. Core CPI in between slowed from a 2.4% Y/Y-peak to a 1.3% low. The SNB meets only on a quarterly basis and kept its policy rate unchanged at 1.75% in September. More recently, SNB governor Jordan stressed that the central bank won’t hesitate to hike again if the outlook changes. Swiss money markets don’t believe that this will happen, discounting a 25 bps rate cut by March 2024 as the next move. The Swiss franc loses out against a strong euro today with EUR/CHF testing the recent highs around 0.9630.