

Sample Category Title
GBPJPY Looking For Acceleration As Elliott Wave Nest
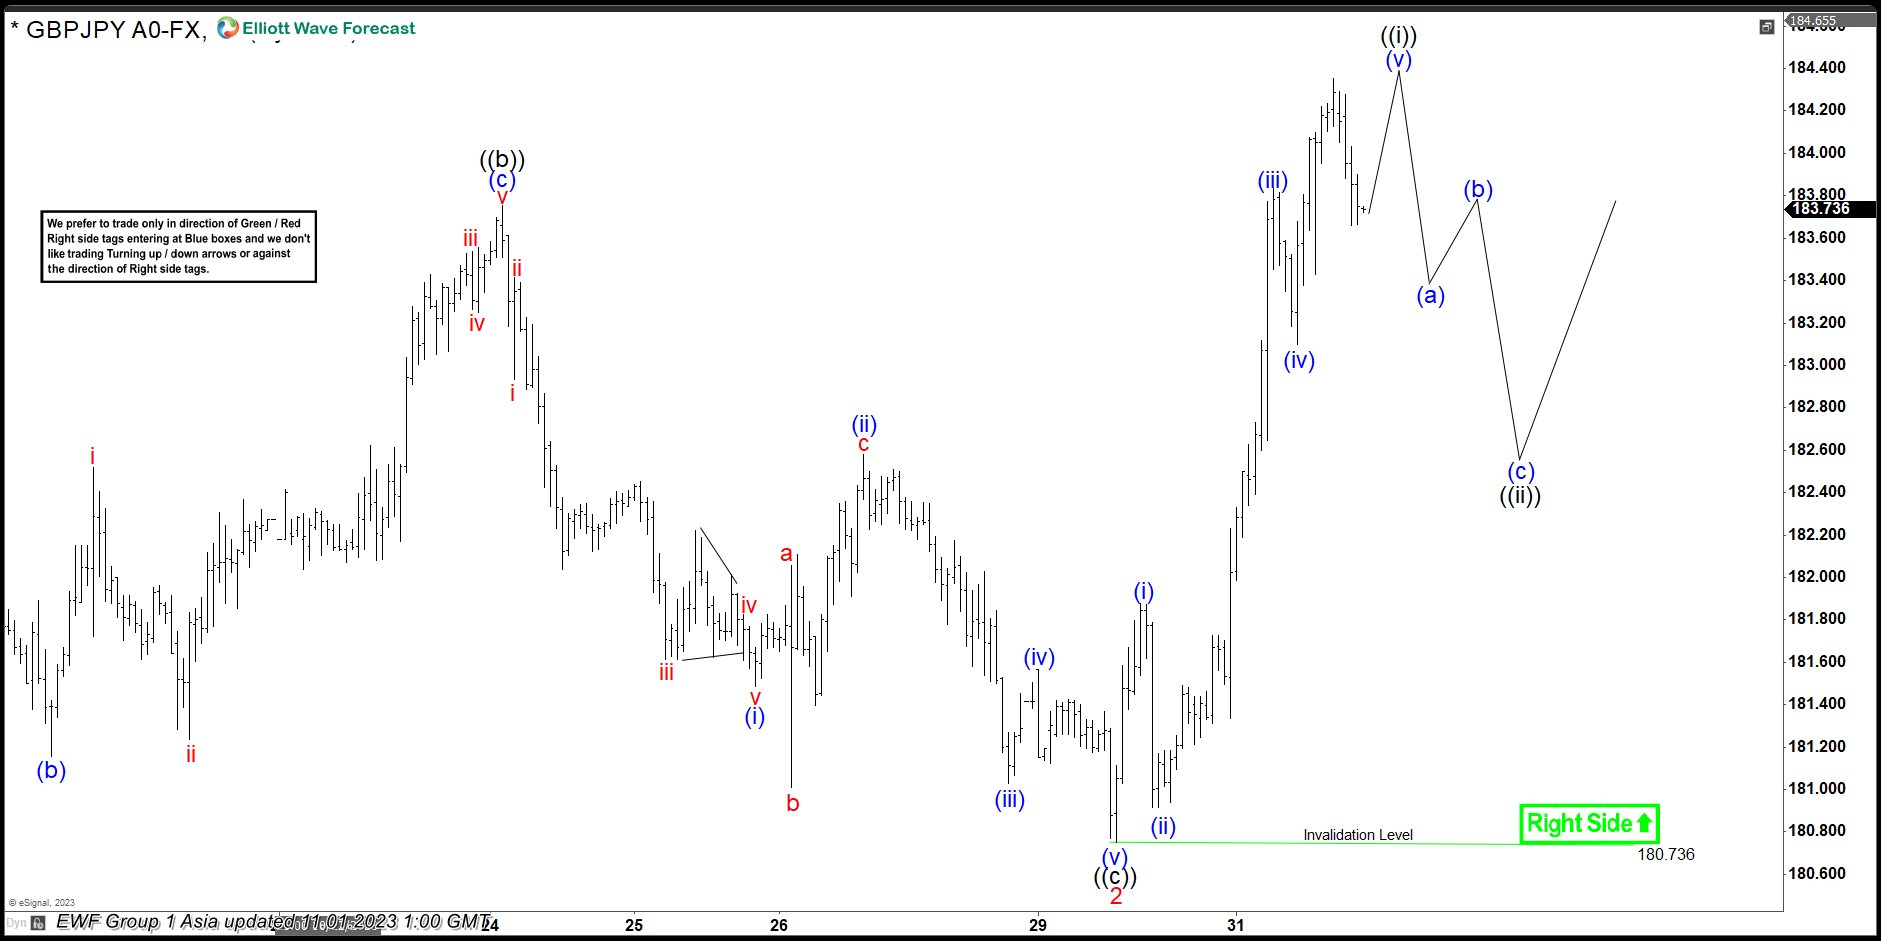
The short-term Elliott wave view in the GBPJPY suggests that the cycle from 03 October 2023 low is nesting higher & expected to accelerate higher. Up from there, the rally to 183.81 high ended wave 1 & then made a pullback in wave 2. The internals of that pullback unfolded as Elliott wave flat correction. Whereas the first leg of the flat ended in wave ((a)) at 180.93 low. Wave ((b)) bounce ended at 183.75 high and wave ((c)) completed at 180.73 low thus completed the wave 2 pullback.
From there, the pair made a rally higher in an impulse sequence & showed a higher high sequence supporting the nest in wave 3 higher. The first leg of the rally to 181.87 high ended wave (i). Wave (ii) ended at 180.91 low, wave (iii) ended at 183.83 high, wave (iv) ended at 183.09 low. Then a rally to 184.35 high ended wave (v) & completed wave ((i)). Below from there, the pair is doing a short-term pullback in wave ((ii)), which is expected to hold in 3, 7, or 11 swings. Looking for more upside extension towards 186.55- 190.13 area next as far as dips remain above 180.73 low. Don’t recommend selling the pair.
GBPJPY 1-Hour Elliott Wave Chart From 11.01.2023
GBPJPY Elliott Wave Video
https://www.youtube.com/watch?v=7QBTG0jrDH8
Nasdaq 100 Technical: Counter Trend Rebound at Risk of Exhaustion as Key Risk Events Loom
- The ongoing rally from last Friday, 27 October low has taken on the form of an impending “bearish flag” formation.
- Coupled with a weak market breadth condition (less than 50% of Nasdaq 100 component stocks are trading above 200-day MA), the rally is likely to be a counter trend rebound within its short and medium-term downtrend phases.
- Watch the 14,590 key short-term resistance ahead of today’s FOMC decision and Apple’s earnings announcement on Thursday, 2 November.
The price actions of the US Nas 100 Index (a proxy for the Nasdaq 100 futures) have shaped the expected slide and traded close to the key 200-day moving average that was acting as a support at 13,960 as highlighted in our report.
It printed an intraday low of 14,060 last Friday, 27 October, and staged a rebound of +2.6% to hit a high of 14,430 in yesterday’s (31 October) US session ahead of key risk events; the FOMC’s monetary policy decision and Fed Chair Powell’s press conference later today followed by Apple (biggest weightage component stock in Nasdaq 100) earnings announcement on Thursday, 2 November after the close of the US session.
There are several key technical elements that suggest the current rebound seen in the Nasdaq 100 from its 27 October 2023 low is likely a counter trend rally within a medium-term downtrend phase in place since the 19 July 2023 high of 15,349.
Weak market breadth condition
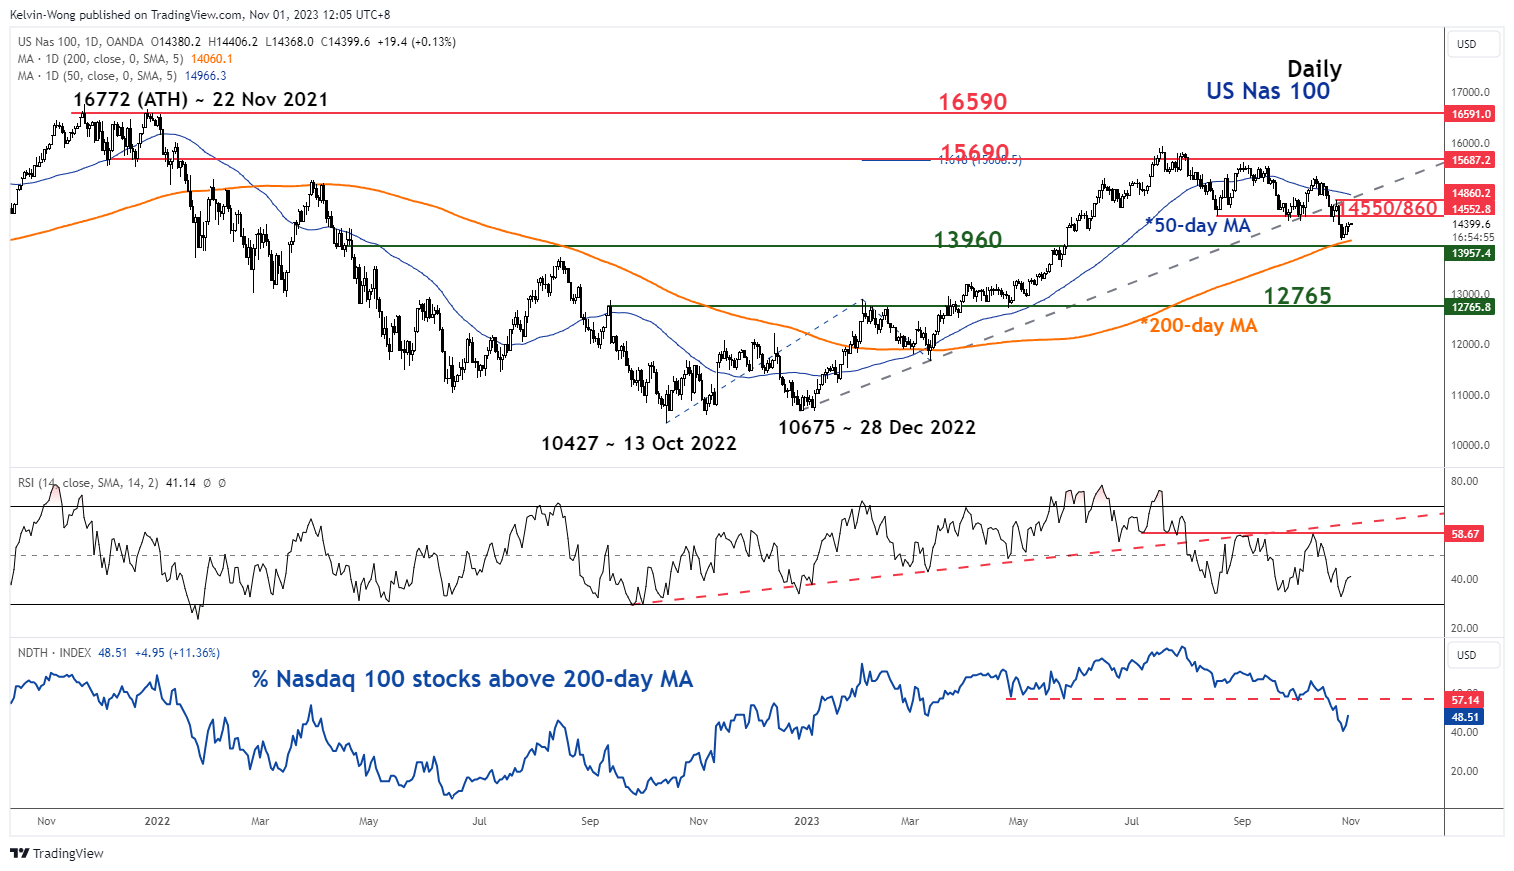
Fig 1: US Nas 100 medium-term trend as of 1 Nov 2023 (Source: TradingView, click to enlarge chart)
Even though the US Nas 100 Index is still holding above the key 200-day moving average, the number of component stocks of the Nasdaq 100 that are still above their respective 200-day moving averages has remained below 50% as of yesterday, 31 October.
A sign of a deteriorating market breadth condition. Also, the daily RSI momentum indicator is still hovering above the oversold region without any bullish divergence signal that indicates a likelihood that medium-term momentum is still bearish.
Formation of a minor “bearish flag”
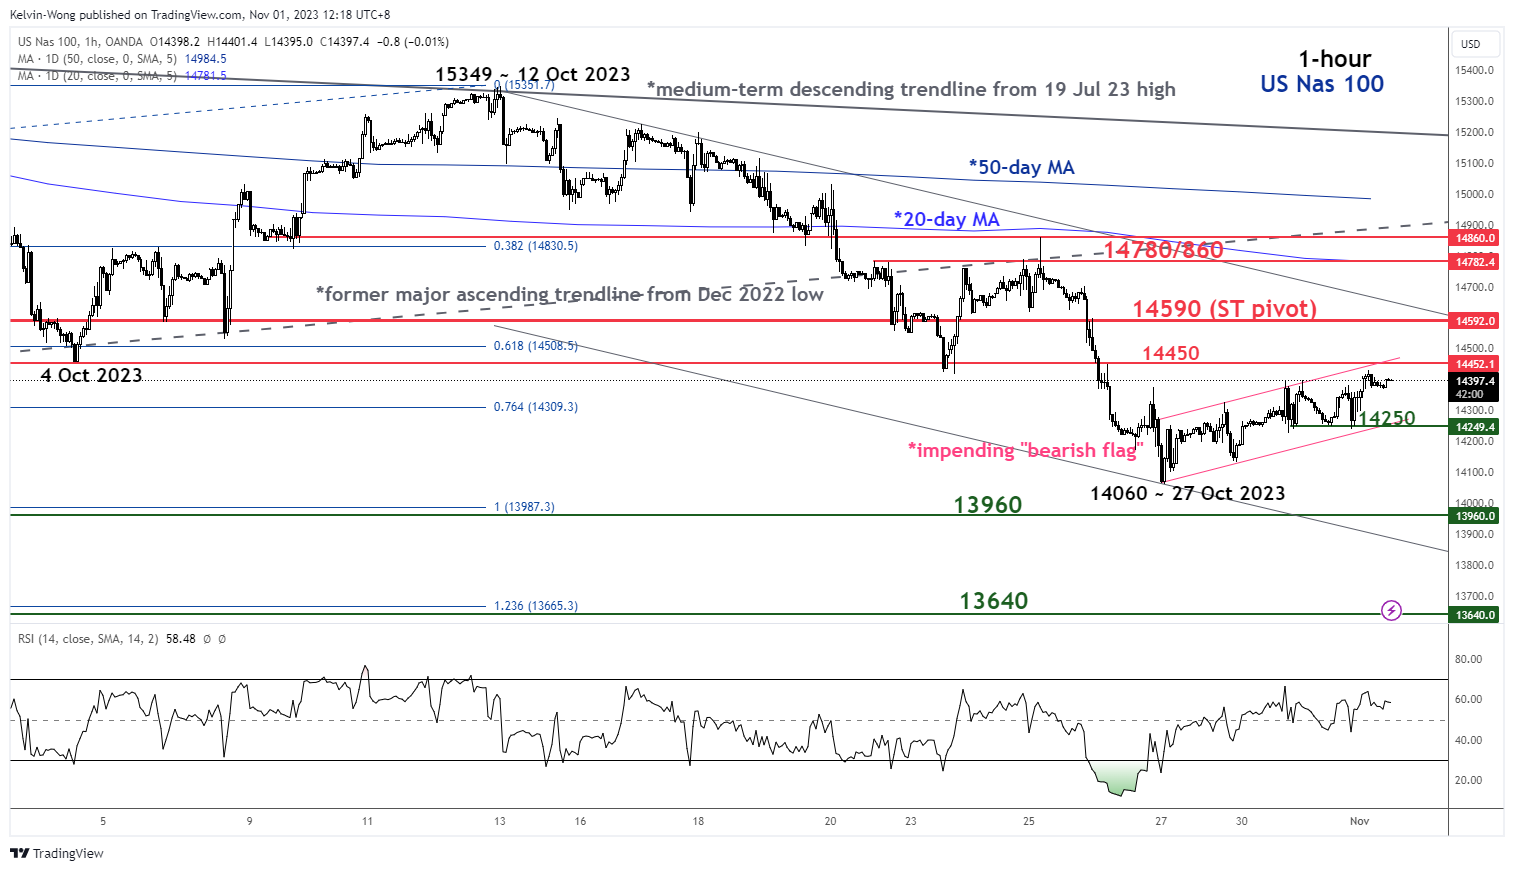
Fig 2: US Nas 100 minor short-term trend as of 1 Nov 2023 (Source: TradingView, click to enlarge chart)
In the short term as seen on the 1-hour chart, the price actions of the Index have formed an impending minor “bearish flag” configuration with its upper limit acting as a near-term resistance at 14,450.
The potential minor “bearish flag” configuration in place since the 27 October 2023 low of 14,060 suggests that it is likely that the ongoing rebound is skewed towards a corrective counter trend rebound within its short-term downtrend phase from the 12 October 2023 high.
Hence, from the lens of technical analysis, the next probable move is likely to be a potential continuation of its bearish impulsive down move sequence.
Watch the 14,590 key short-term pivotal resistance (upper boundary of the short-term descending channel from 12 October 2023 high & close to 38.2% Fibonacci retracement of the recent decline from 12 October high to 27 October 2023 low) and a break below 14,250 (lower limit of the “bearish flag) may ignite another round of decline towards the 13,960 intermediate support (around the 200-day moving average) follow by 13,640 (16/17 August 2022 swing high area & Fibonacci extension) in the first step.
On the flip side, a clearance above 14,590 invalidates the bearish scenario for an extension of the counter trend rebound towards the next intermediate resistance at 14,780/14,860 (former major ascending trendline from the December 2022 low & 20-day moving average).
Market eyes treasury refunding ahead of FOMC hold
Fed is widely anticipated to keep interest rates steady at 5.25-5.50%, marking a second consecutive pause. While the accompanying statement and Chair Jerome Powell's press conference are expected to keep options open for future rate hikes, the focus will be on how firmly Powell adheres to his hawkish stance, hinting at the likelihood of an additional hike in December.
Recent comments from Fed policymakers have pointed to the rise in longer-term borrowing costs and the subsequent tightening of financial conditions as factors reducing the urgency for further tightening. Powell's insights on this matter will be of particular interest to market participants.
However, substantial comments from Powell may be scarce at this juncture, given that the next set of economic projections, crucial for determining future policy, are set to be prepared and released in December. As a result, today's FOMC decision might not deliver significant revelations.
In fact, a potentially more market-moving event could be the quarterly treasury refunding announcement preceding the FOMC decision. Investors already received a glimpse into the Treasury's plans on Monday, with the announcement of a USD 776B debt auction for the last quarter of 2023. Key aspects that markets will scrutinize include the actual sizes of the auction and the mix of maturities.
The treasury market is currently grappling with a supply-demand mismatch, a significant factor contributing to the sharp rise in bond yields this year. Understanding how the Treasury plans to address this imbalance will be critical for investors, potentially overshadowing the FOMC decision in terms of immediate market impact.
China’s Caixin PMI manufacturing slips to 49.5, business optimism continues to wane
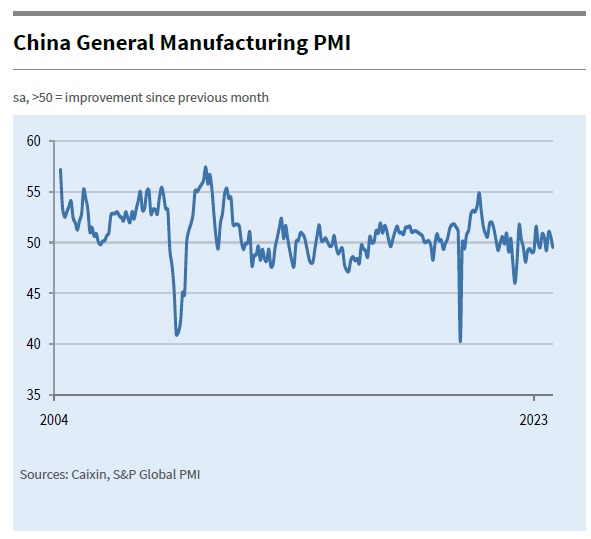
China's Caixin PMI Manufacturing index slipped from 50.6 in September to 49.5 in October, falling below market expectations set at 50.8. This marks a renewed contraction in the nation's manufacturing sector.
Wang Zhe, Senior Economist at Caixin Insight Group, highlighted several challenges facing the manufacturing industry. "Overall, manufacturers were not in high spirits in October," he said. The decline in the sector was multifaceted - supply, employment, and external demand all experienced reductions, while domestic demand saw a slower pace of expansion.
The manufacturing environment was further complicated by rising costs and output prices. This was coupled with decrease in purchases and accumulation of inventories of finished goods. Reflecting the various pressures, "business optimism continued to wane".
Crude Oil Price At Risk of Major Decline, Fed Decision Next
Key Highlights
- Crude oil prices saw swing moves in tense times and the Israel-Hamas war.
- A key bearish trend line is forming with resistance near $84.70 on the 4-hour chart.
- Gold prices could extend gains toward the $2,050 level.
- The Fed interest rate decision is scheduled today (forecast 5.5%, versus 5.5% previous).
Crude Oil Price Technical Analysis
In the past few days, Crude oil prices saw bearish moves amid the Israel-Hamas war. There was a steady decline below the $86.50 and $85.00 support levels. On the war front, Netanyahu ruled out ceasefire on day 25. Besides, Israel escalated attacks on Hamas terrorists within the Islamists’ extensive network of tunnels beneath Gaza.
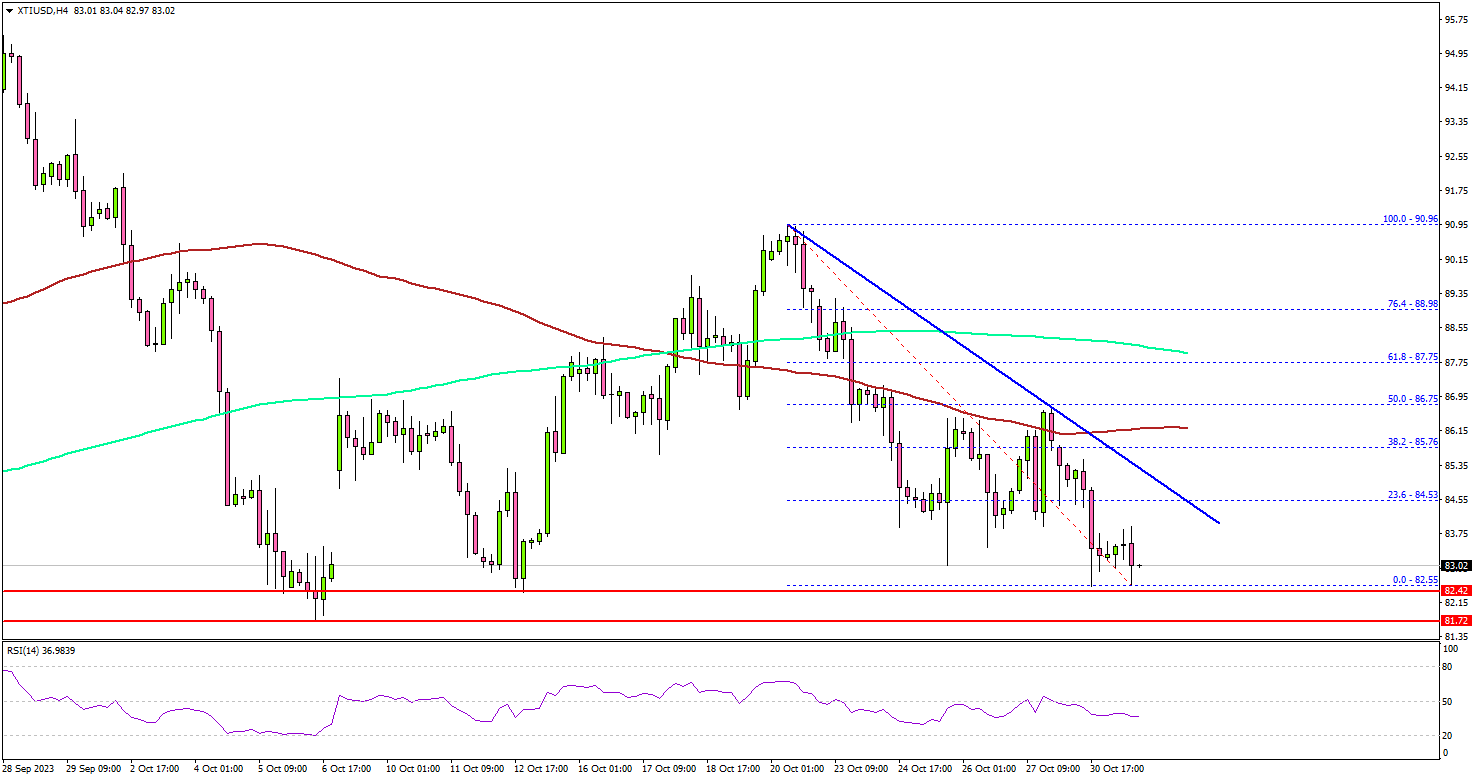
Looking at the 4-hour chart of XTI/USD, the price settled below the $85.00 pivot level, the 200 simple moving average (green, 4-hour), and the 100 simple moving average (red, 4-hour).
It seems like the bulls are struggling to protect the key support at $82.50. The next support is at $81.70, below which there is a risk of a sharp decline. In the stated case, the price could dive toward the $78.50 support. Any more losses might call for a test of the $76.50 support zone.
On the upside, the price might face resistance near the $84.50 level. There is also a key bearish trend line forming with resistance near $84.70 on the same chart.
The next major resistance is near the $85.00 zone, above which the price may perhaps accelerate higher. In the stated case, it could even visit the $87.75 resistance.
Looking at gold prices, there was a consolidation phase near the $2,000 level and the bulls might now aim for more upside.
Economic Releases to Watch Today
- US ISM Manufacturing Index for Oct 2023 – Forecast 49.0, versus 49.0 previous.
- Fed Interest Rate Decision - Forecast 5.5%, versus 5.5% previous.
Kanda announces Japan is on “standby” as Yen plunges past 151 to Dollar
Amid the resumed selloff of Yen, which broke 151 level against Dollar overnight, Japan's top currency official, Masato Kanda, has issued a stern verbal warning. The Vice Finance Minister for International Affairs emphasized that Japan remains vigilant and "on standby" to mitigate the excessive volatility observed in the currency markets.
However, Kanda refrained from divulging specific details on potential interventions. "But I can't say what we'll do, and when — we'll make judgments overall, and we're making judgments in a state of urgency," he added.
Kanda voiced significant concern over the rapid and one-sided shifts in currency values, stressing the importance of calibrated responses against overblown foreign exchange movements. He emphasized that fundamental economic indicators don't justify such abrupt currency shifts, hinting at other factors at play. "Speculative trading seems to be the biggest factor behind recent currency moves," Kanda observed.
"The yen has weakened close to 25 yen against the dollar from the start of the year, and it's also moved a few yen in a short amount of time," he noted, highlighting the dramatic shift in the currency's value.
Japan PMI manufacturing: Slump continues, yet optimism shines for 2024
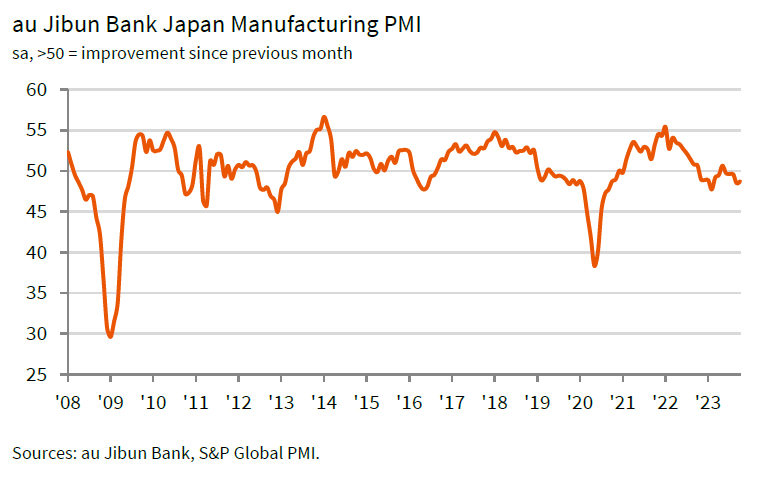
Japan's PMI Manufacturing for October was finalized at 48.7, a slight uptick from 48.5 in September. Despite the improvement, the index languished below the critical 50 threshold for the fifth consecutive month.
S&P Global's analysis revealed that a significant decline in output occurred due to persisting sales reductions. This challenging environment also led to the first drop in employment figures since the beginning of 2021. On the brighter side, confidence remains robust regarding a potential return to growth in 2024.
Usamah Bhatti, representing S&P Global Market Intelligence, commented on the situation, emphasizing the continued hardships faced by the manufacturing sector. He mentioned the strategic measures companies are adopting to counter these challenges, including curtailed purchasing, optimal inventory management, and not filling vacancies created by departing employees.
However, the silver lining seems to be the positive outlook for the future. Bhatti noted that there's optimism about finding a turning point soon, with many companies expecting a shift in the inventory cycle after extended destocking periods. Moreover, demand from Japan's primary industrial sectors is projected to pick up in the coming year, potentially heralding better days for the nation's manufacturing realm.
IMF to RBA: More tightening needed to curb inflation
In a report on Australia's economy, IMF highlighted concerns about persistent inflation levels in the country. Even though inflation is "gradually declining", it continues to hover "significantly above" RBA's target, with the country's output "remains above potential."
The IMF staff "recommend further monetary policy tightening". They believe this approach will realign inflation with RBA's target range by 2025 and "minimize the risk of de-anchoring inflation expectations."
In terms of economic momentum, the IMF predicts a further slowdown in the near future, coinciding with a steady decrease in inflation. While risks to growth appears "broadly balanced", the potential for inflation to surpass expectations remains a cause for concern.
NZ employment down -0.2% in Q3, unemployment rate jumps to 3.9%
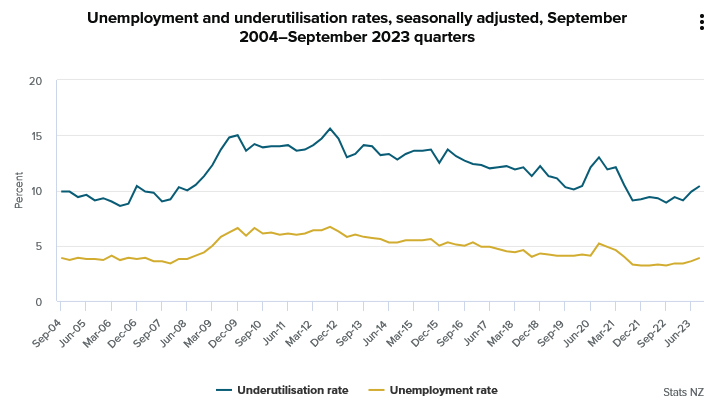
New Zealand's employment figures for Q3 came in weaker than anticipated. Employment contracted by -0.2%, sharply diverging from the forecasted growth of 0.40%.
Unemployment rate made a noticeable leap, rising from 3.6% to 3.9%, a figure that met market expectations. Additionally, both employment rate and labor force participation rate registered declines, moving from 69.8% to 69.1% and from 72.5% to 72.0% respectively.
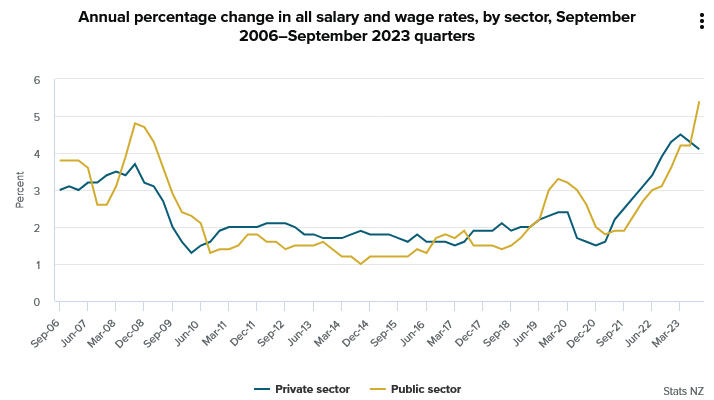
Wage data presented a mixed picture. The all-sector wage inflation stood firm at 4.3% yoy.
The public sector experienced a particularly sharp uptick in salaries and wages, registering a 5.4% yoy increase. This significant rise is notable for being the steepest since the data series commenced in 1992, surpassing 4.2% yoy growth observed in Q2.
In contrast, the private sector saw wage cost inflation moderating to 4.1% yoy in Q3, slightly down from the 4.3% recorded in the previous quarter.
NZ First Impressions: Labour Market Statistics
Unemployment rose 0.3ppts to 3.9% in the September quarter, in line with our expectations. Private sector wage growth remained high by historical norms, but shows clear signs of easing.
- Unemployment rate: 3.9% (prev: 3.6%, Westpac f/c: 3.9%, RBNZ f/c 3.8%)
- Employment change: -0.2% (prev: +1.0%, Westpac f/c: +0.4%, RBNZ f/c +0.3%)
- Labour costs (private sector): +0.9% (prev: 1.1%, Westpac f/c: 1.0%, RBNZ f/c 1.0% )
- Average hourly earnings (private sector, ordinary time): +2.0% (prev: 1.9%)
Employment fell 0.2% in the September quarter, causing annual growth to slow to 2.4 from 4.1% previously. This was a weaker outcome than suggested by the tax-based Monthly Employment Indicator (this rose 0.4% during the quarter). This might reflect genuine differences in coverage and definition between the two indicators – the MEI counts filled jobs rather than people employed and does not cover the self-employed. However, it is also possible that the unexpected weakness reflects variability in the survey sample (new respondents are rotated into the survey each quarter). On that note, also surprising was a 0.4ppts decline in the labour force participation rate to 74.0%. As a result of that decline, the estimated labour force barely grew in the September quarter despite continued strong migrant inflows and a 0.6% increase in the working age population.
But as is usually the case, differences in survey sample tend to wash out in the unemployment rate, which increased 0.3ppts to 3.9 in the September quarter – the highest reading since June quarter 2021 and an outcome that was in line with our expectations and those of the market. Also of note, a broader measure of unemployment known as the underutilisation rate – which amongst other things also captures those people that would like more work – increased by a 0.5ppts to 10.4%. So whether or not employment growth was really as soft as suggested by today’s report, it remains the case that there has been an unambiguous easing of conditions in the labour market – an outcome that was clearly foreshadowed by business survey indicators of skill shortages and labour constraints.
With the unemployment rate now well above the historic lows seen last year, wage growth is showing clear signs that it has peaked. The overall Labour Cost Index (LCI) rose 1.1% for the quarter, leaving the annual growth rate at 4.3%. However, as we expected, that result reflecting large settlements in parts of the public sector (such as healthcare), with the public sector LCI increasing 2.2% during the September quarter, lifting annual growth to 5.4%. We do not expect these settlements to continue in the future.
More importantly for the RBNZ, the LCI for the private sector increased just 0.9% in the September quarter, lowering annual growth by 0.2ppts to 4.1% (and a peak of 4.5% in the March quarter). This outcome was 0.1ppts weaker than we had expected. The unadjusted LCI – which better represents developments in take-home pay – increased 1.1%. This was the smallest increase since the December 2021 quarter, and lowered annual growth by 0.4ppts to 5.7% (thus tracking broadly in line with CPI inflation of 5.6%). Annual growth in private sector average hourly earnings, as measured by the more volatile Quarterly Employment Survey, dropped back to 7.1% from 7.7% previously.
Today’s news should leave the RBNZ comfortable with the labour market projections made in the August Monetary Policy Statement, and thus a hike in the OCR at the 29 November meeting remains very unlikely (as reflected in market pricing). Employment growth was weaker than the RBNZ had forecast – at least at face value – and the unemployment rate rose by slightly above the 3.8% figure that the RBNZ had forecast. In addition, growth in the private sector LCI was also 0.1ppts less than the RBNZ had forecast.
Looking ahead, the RBNZ is forecasting the unemployment rate to rise significantly further to 4.4% by the end of this year (data to be released in early February). Together with the outcome of the December quarter CPI (released mid-January), ongoing developments in the labour market will have a significant bearing on whether the RBNZ continues to take the view that its inflation projections remain broadly on track. More robust than expected inflation and/or labour market data would increase the likelihood that the RBNZ opts to lift the OCR at the February 2024 MPS meeting (as is Westpac’s forecast).