Sample Category Title
EUR/AUD Daily Outlook
Daily Pivots: (S1) 1.6602; (P) 1.6643; (R1) 1.6694; More...
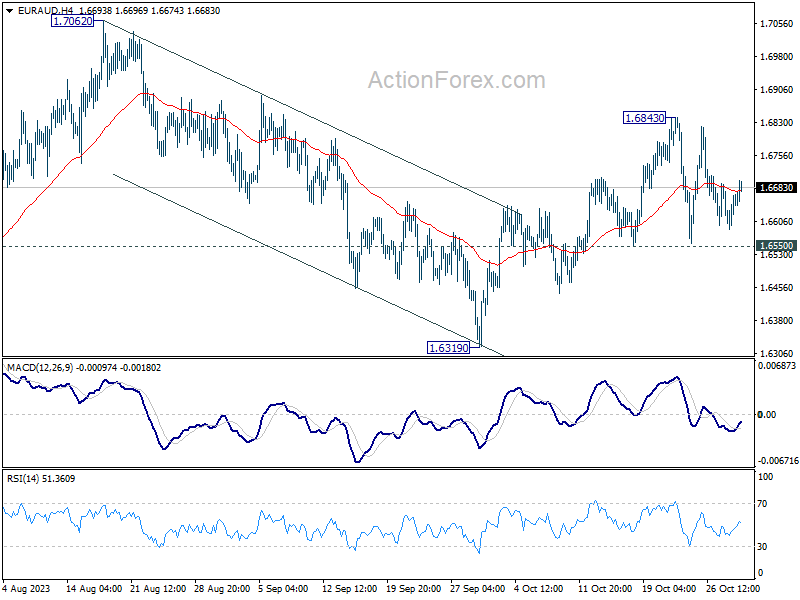
Range trading continues in EUR/AUD and intraday bias stays neutral at this point. Further rally is expected as long as 1.6550 support holds. Above 1.6843 will target a test on 1.7062 high. Firm break there will resume larger up trend. However, break of 1.6550 support will bring deeper fall back to 1.6319 support instead.
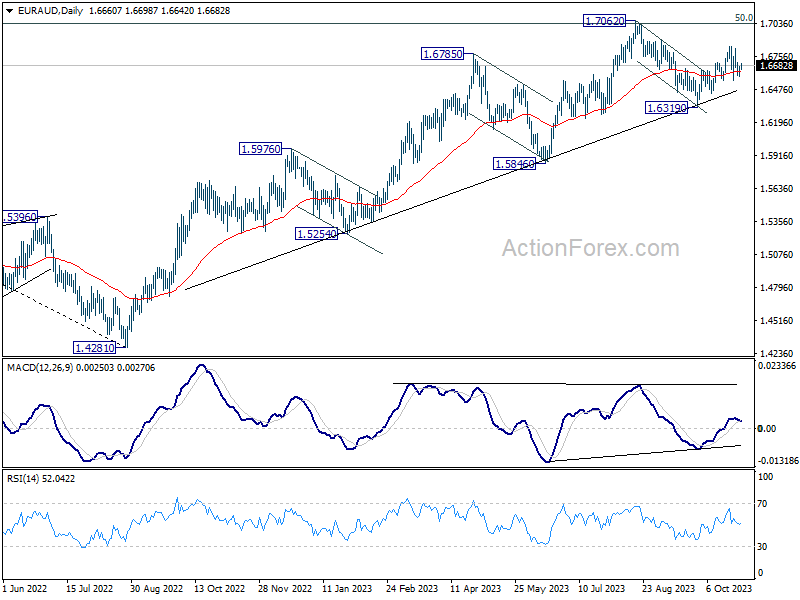
In the bigger picture, the strong support from medium term rising trend line indicates that rise from 1.4281 (2022 low) is still in progress. Sustained break of 1.7062 will pave the way to 61.8% retracement of 1.9799 (2020 high) to 1.4281 at 1.7691. In any case, outlook will stay bullish as long as 1.6319 support holds.
EUR/CHF Daily Outlook
Daily Pivots: (S1) 0.9536; (P) 0.9560; (R1) 0.9599; More...
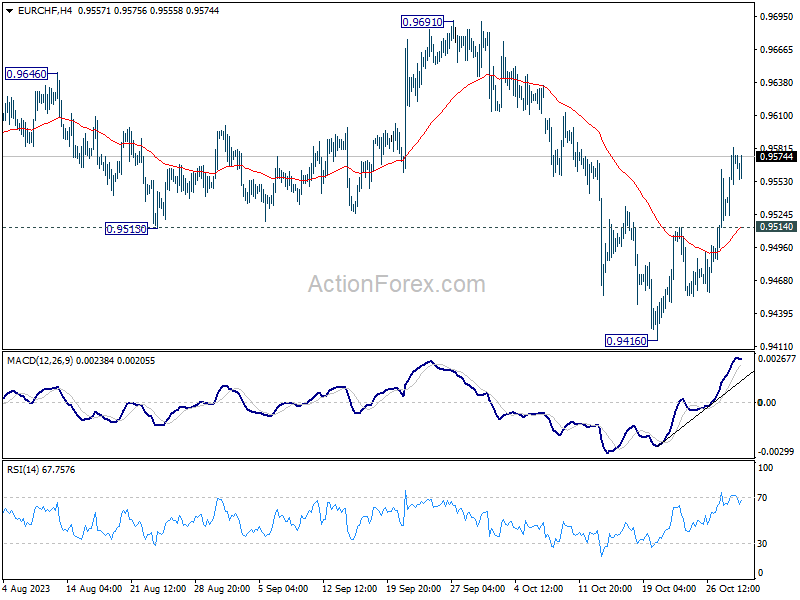
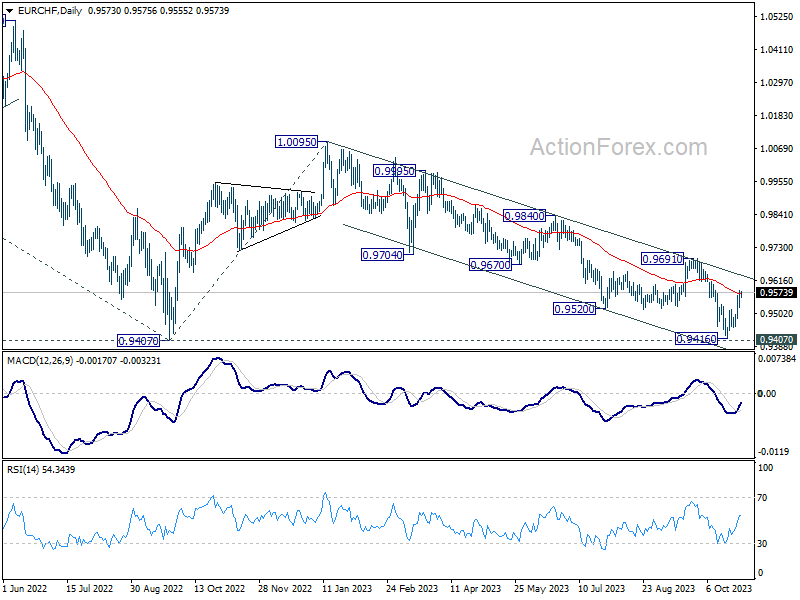
Intraday bias in EUR/CHF remains on the upside as rebound from 0.9416 is in progress. Sustained break of 55 D EMA (now at 0.9570) will bring further rise to 0.9691 key structural resistance. On the downside, though, below 0.9514 minor support will turn bias back to the downside for retesting 0.9407/16 zone.
In the bigger picture, down trend from 1.2004 (2018 high) is still in progress. Decisive break of 0.9407 will confirm resumption, and target 61.8% projection of 1.1149 to 0.9407 from 1.0095 at 0.9018. On the upside, break of 0.9691 resistance is needed to be the first sign of medium term bottoming. Otherwise, outlook will stay bearish.
Yen Falls after BoJ Decision, US Bond Investors Hopeful on Treasury’s Plan to Spend ‘Less’
The Bank of Japan (BoJ) kept interest rates unchanged, redefined the 1% limit on the 10-year JGBP yield as a loose ‘upper bound’ and scrapped its promise to keep that level intact. Alas, the move was less aggressive than expected by the market and sent the yen tumbling. Japanese policymakers’ insistence that they won’t hesitate to take additional easing measures ‘if needed’ also spoiled sentiment. The USDJPY trades just above the 150 mark this morning after the BoJ decision, although the spike in the 10-year JGB yield to almost 1% should’ve pulled the pair lower – especially after the news that the US Treasury will be borrowing less money in the last three months of this year.
The US Treasury will borrow less; the Fed is expected to announce no change – Yet
The US Treasury Department said yesterday that they are planning to borrow around $776 billion in the final quarter of the year. That’s still a historically high borrowing, but it has the merit to be below the expectation of around $800bn and it’s well below the $1 trillion that they borrowed in the July-to-September period, and which wreaked havoc in the US bond market, sending – especially the long-end of the US yield curve rallying.
Today, the Federal Reserve (Fed) starts its two-day policy meeting. Yes, the FOMC announcement on interest rates is often a big event for investors, but this time around, it won’t be the only shining star of the week. First, because we know that there won't be any rate hikes this week. The probability of no change is priced as being almost 100% sure. The Fed members will still be raising their eyebrows given the strength of the recent economic data, the uptick in inflation and global uncertainty. But they won’t necessarily be raising the rates. Therefore, what they will say they will do will matter more for the market pricing than what they will do. And the rate expectations will be played for the December and January meetings – which both hint at no rate hike either, by the way. That could change, but for now, no more rate hike is what investors are betting on.
So, in the absence of a surprise rate decision, or a surprise forward guidance about a rate decision, what will really, really matter this week for the US sovereign space and the faith of the US yields, is the US debt situation, and the Treasury Department’s quarterly announcement on details regarding the size and the maturity of the bonds that they will issue to borrow that extra $776 bn this quarter.
The composition of the US Treasury’s bond issuances will be crucial. Shifting toward shorter maturity debt could relieve the pressure on the US long-term papers but the problem with the short-term bills is that the US Treasury already sold plenty of them - they came close to their self-imposed limit of 20% last quarter- and that’s why they decided to sell more longer maturity bonds since September. The latter shift towards longer-term maturity debt explained why the long-term yields took a lift since September. Therefore, it’s not a given that the Treasury’s issuance calendar will fully calm down the bond investors’ nerves on Wednesday.
Bank of Japan Tweaks Yield Policy Again
Market movers today
Today markets will zoom in on HICP inflation data for the euro area. Country releases from yesterday were somewhat lower than expected indicating the euro area total will end up around 3% from 4.3% in September. The Spanish and German data did give some promising signs with regards to core inflation pressures in the euro area.
At the same time, we get the first GDP estimate for Q3 from Eurostat, which will likely show close to a standstill in economic activity in Q3.
In the US, the employment cost index for Q3 will hold valuable information to policy makers on price pressures. We also get Conference Board consumer confidence.
Overnight, we will look out for Chinese Caixin manufacturing PMIs. The similar official measure came in lower than expected this morning at 49.5 in October (consensus 50.2).
The 60 second overview
Bank of Japan. The Bank of Japan (BoJ) tweaked its yield curve control policy (YCC) at a meeting ending this morning by redefining the 10-year rate cap as a reference rather than a rigid bound and thus also removed a pledge to defend this level with offers to buy an unlimited amount of bonds at the 1% level. A story indicating a tweak of the YCC moved USD/JPY from 149.7 to 149.0 levels already yesterday. This morning, markets sold the fact again on announcement and traded the cross back to 150. JGB yields have sold off and 10-year yields now trade 5bps closer to the rate cap at 95 bps. As we see it, this was another, likely the last, step ahead of dismantling the YCC altogether. However, the BoJ still needs confirmation that inflation has sustainably moved above the 2% target before they are ready to take bigger steps to normalisation. They are slowly recognising higher inflation is not temporary and moved their inflation forecast significantly higher, particularly for the fiscal year 2024 (starting in April) to 2.8% from 1.9% back in July.
European data softens. Inflation figures from Spain and Germany released yesterday, came in below expectations, pointing to softening inflation across the Eurozone. Seasonally adjusted German HICP fell 0.2% m/m in October, while the Spanish HICP pace halved to 0.3% from 0.6% in September. Core CPI details were also weaker in general. Meanwhile, the first release of Q3 GDP data showed Germany contracting by 0.1% q/q, highlighting the weakness of economic growth in the region. Private consumption was the main drag on growth, according to the Federal Statistics Bureau, while investments in equipment and machinery showed some improvement.
UAW strike ends. Yesterday, GM and the United Auto Workers Union (UAW) was said to have reached a tentative deal to end the six-week strike. GM has agreed to raise the hourly pay by 25% over the course of a four-year deal, which is very similar to the terms in deals struck by Ford and Stellantis last week. If ratified by the UAW, this will mark the end of the first co-ordinated strike at the three largest US car-makers.
Equities: What is a better start to the week than a Monday rebound. There were no clear drivers behind the sudden optimism, aside from S&P500 hitting correction territory on Friday. In fact, US yields even rose during the session. While the Nordic and European session was a modest one (Stoxx 600 only up 0.4%) the US bounce was forceful. Dow closed up 1.6% and S&P 500 1.2%. Cyclicals led this, with banks and communication among the better groups. The sentiment is weakening in Asia this morning after weak China PMIs and Bank of Japan abandoning yield curve control. Chinese equities almost -2% lower but Japan 0.5% higher.
FI: EGB yields fell slightly yesterday as weaker-than-expected inflation figures from Spain and Germany provided some support to the segment. However, the rally was mostly reversed in the afternoon. 10Y Bund yields ended the day down by 1bp, while 10Y BTP yields fell by 7bp. Markets are now pricing in 82bp worth of ECB cuts next year, up from 66bp before the ECB meeting last week. The long end of the UST curve was to some degree supported by the downward revision of the US Treasury's expected net borrowing until the end of the year (see FI section). The BoJs decision to soften the YCC policy has added upward pressure on long JGB yields this morning, with the 10Y tenor up by 5bp to 0.95%.
FX: EUR/USD zig-saws around 1.06 whilst USD/JPY moved back above 150 on the BoJ YCC tweak. Scandies continues to trade weaker in tandem with NOK/SEK at 1.00. Brent oil is back below USD 90/barrel after a 3% drop yesterday.
Credit: Credit spreads tightened modestly yesterday where iTraxx Xover tightened 4.8bp and Main 0.9bp. There was barely any activity in the primary market, but SEB saw solid demand for its EUR500m 5y green SNP offering, which attracted orders of more than EUR2bn.
Nordic macro
Riksbank Governor Thedeén spoke in New York last night and repeated the message that whatever the Riksbank decides at the November meeting the repo rate will remain "high for long". He expressed worries about the weak SEK and services prices making inflation "sticky". This is nothing new though. We note that the current SEK weakening in KIX terms is just about average for the 15 years during which the SEK has been depreciating between 1993 and 2022, hence 2023 is nothing special. Neither did he mention Riksbank's semi-annual business survey which suggests household-near companies are planning to slash prices. We stick to our guns of a no hike in November, for now.
USD/CAD Daily Outlook
Daily Pivots: (S1) 1.3802; (P) 1.3838; (R1) 1.3862; More...
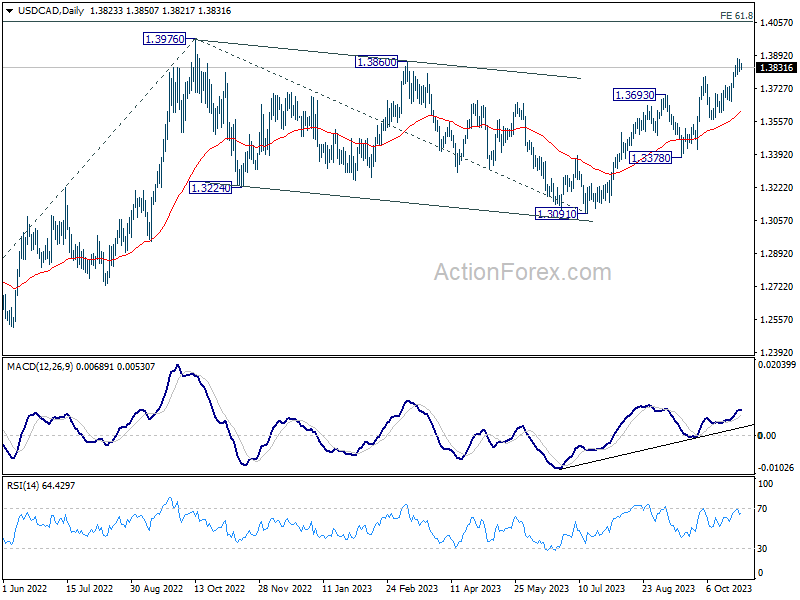
Intraday bias in USD/CAD is turned neutral with current retreat and some consolidations could be seen. Downside of retreat should be contained above 1.3659 support to bring another rally. On the upside, above 1.3879 will resume recent rally to retest 1.3976. Decisive break there will resume larger up trend to 1.4064 projection level.
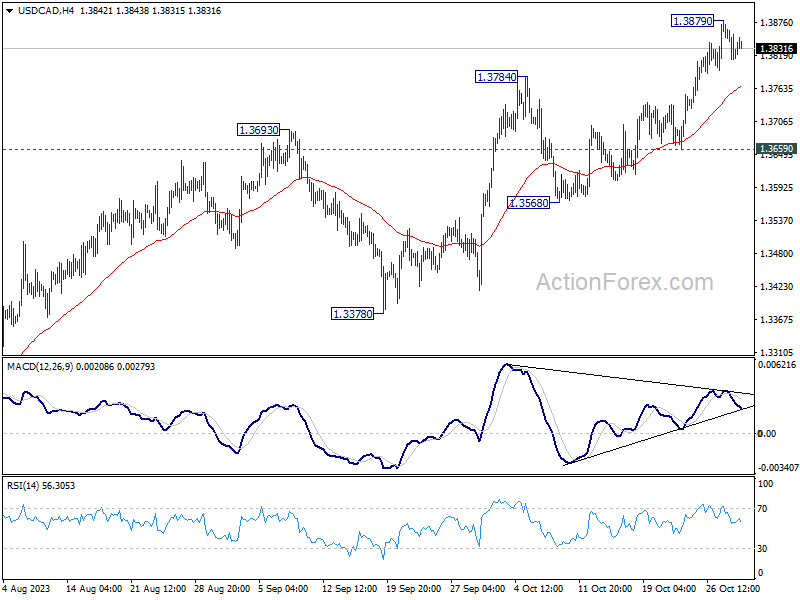
In the bigger picture, corrective pattern from 1.3976 (2022 high) should have completed with three waves down to 1.3091. Decisive break of 1.3976 high will confirm resumption of up trend from 1.2005 (2021 low). Next target will be 61.8% projection of 1.2401 to 1.3976 from 1.3091 at 1.4064. This will now remain the favored case as long as 1.3568 support holds.
AUD/USD Daily Report
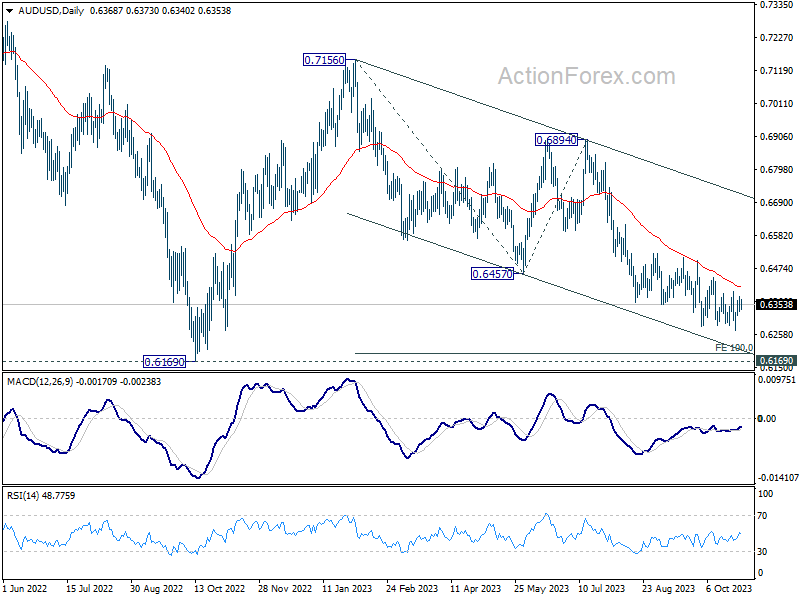
Daily Pivots: (S1) 0.6344; (P) 0.6364; (R1) 0.6395; More...
Intraday bias in AUD/USD stays neutral and outlook remains bearish with 0.6398 resistance intact. On the downside, break of 0.6269 will resume larger fall from 0.7156 to 100% projection of 0.7156 to 0.6457 from 0.6894 at 0.6195, which is close to 0.6169 medium term support.
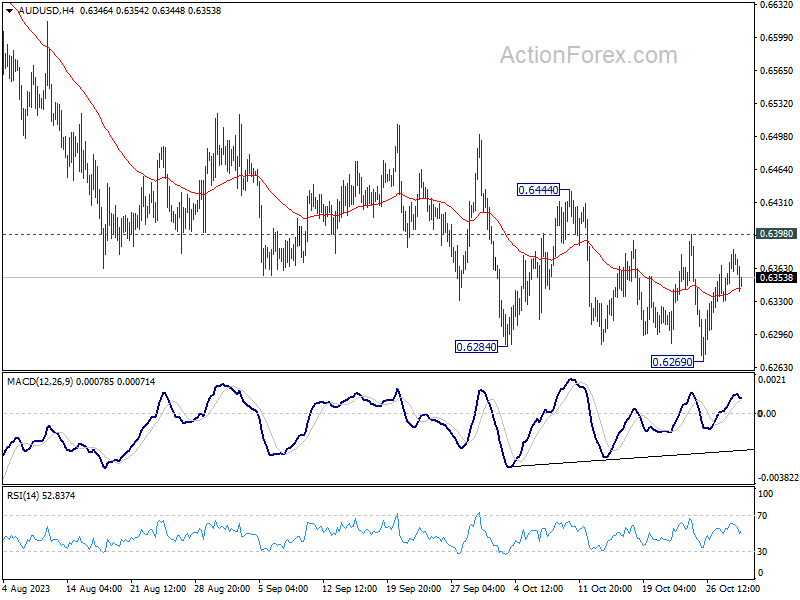
In the bigger picture, down trend from 0.8006 (2021 high) is possibly still in progress. Decisive break of 0.6169 will target 61.8% projection of 0.8006 to 0.6169 to 0.7156 at 0.6021. This will now remain the favored case as long as 0.6894, in case of strong rebound.
EUR/USD Daily Outlook
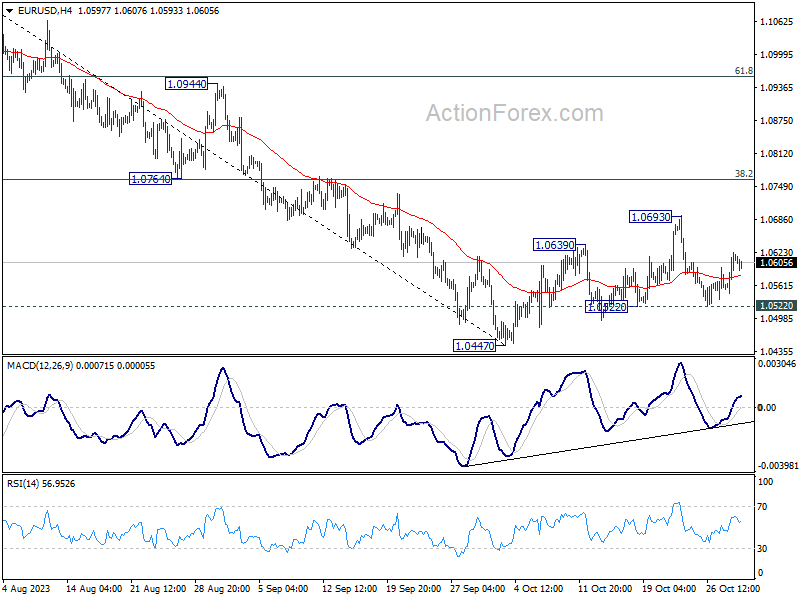
Daily Pivots: (S1) 1.0566; (P) 1.0596; (R1) 1.0644; More...
Intraday bias in EUR/USD remains neutral for the moment. On the downside, break of 1.0522 support will turn bias back to the downside for retesting 1.0447 low. Break there will resume larger fall from 1.1274. On the other hand, strong bounce from current level, followed by break above 1.0693, rebound from 1.0447 to 1.0764 cluster resistance (38.2% retracement of 1.1274 to 1.0447 at 1.0763).
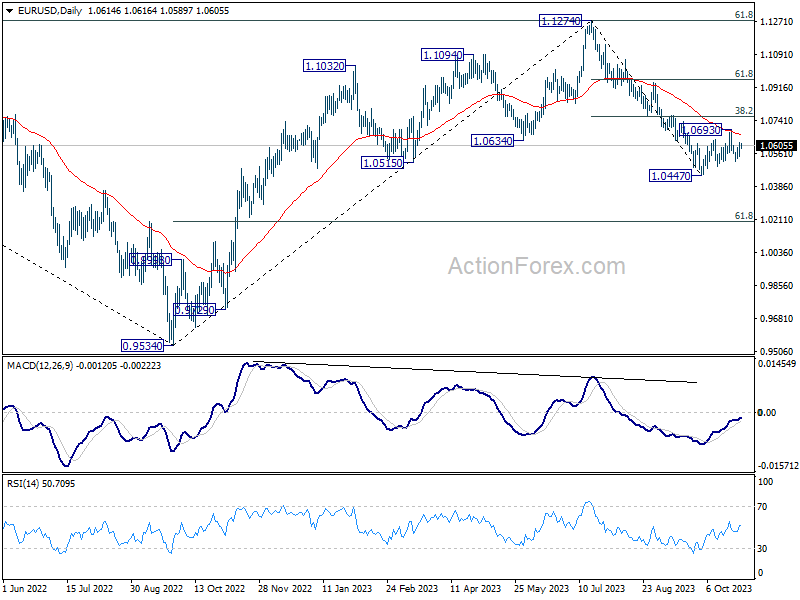
In the bigger picture, fall from 1.1274 medium term top could still be a correction to rise from 0.9534 (2022 low). But chance of a complete trend reversal is rising. In either case, current fall should target 61.8% retracement of 0.9534 to 1.1274 at 1.0199 next. For now, risk will stay on the downside as long as 55 D EMA (now at 1.0665) holds, in case of rebound.
GBP/USD Daily Outlook
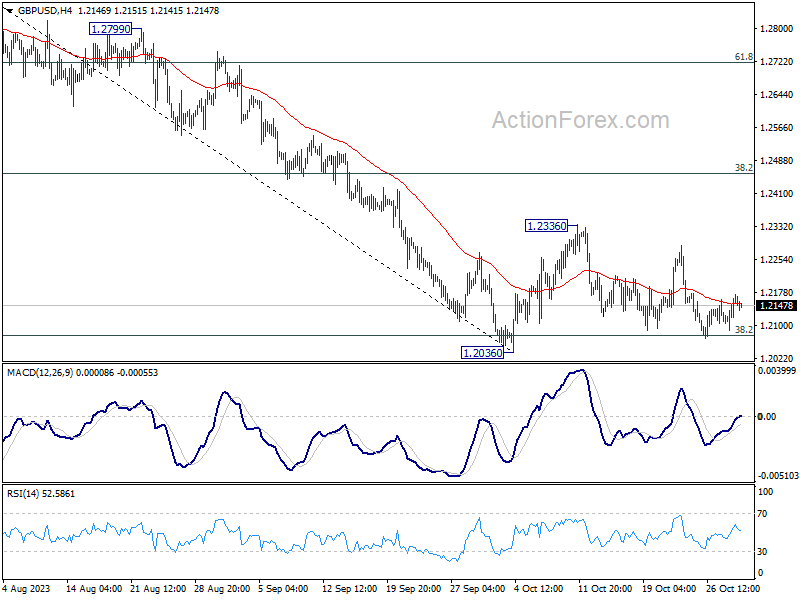
Daily Pivots: (S1) 1.2098; (P) 1.2130; (R1) 1.2155; More
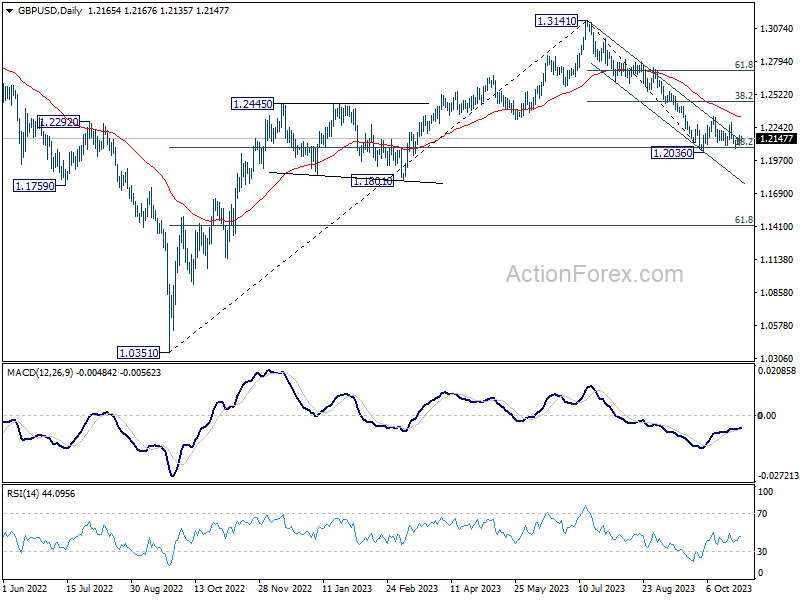
Intraday bias in GBP/USD remains neutral at this point, as sideway trading continues. With 1.2336 resistance intact, outlook stays bearish. On the downside, firm break of 1.2036 will resume whole decline from 1.3141 for 1.1801 support next. However, break of 1.2336 will turn bias back to the upside for 38.2% retracement of 1.3141 to 1.2036 at 1.2458.
In the bigger picture, fall from 1.3141 medium term top could still be a correction to up trend from 1.0351 (2022 low) only. But risk of complete trend reversal is rising. Sustained break of 38.2% retracement of 1.0351 to 1.3141 at 1.2075 will pave the way to 61.8% retracement at 1.1417. For now, risk will stay on the downside as long as 55 D EMA (now at 1.2346) holds, in case of rebound.
USD/CHF Daily Outlook
Daily Pivots: (S1) 0.8991; (P) 0.9014; (R1) 0.9048; More....
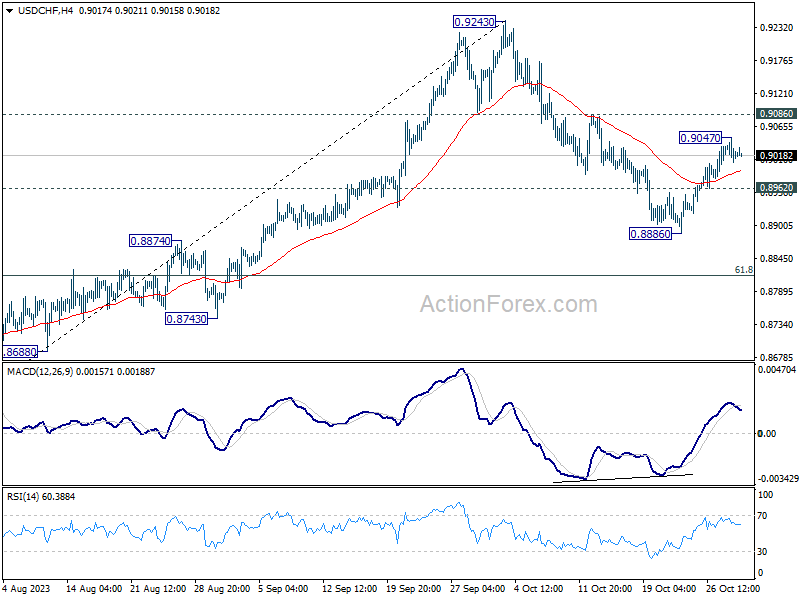
Intraday bias in USD/CHF is turned neutral with 4H MACD crossed below signal line. On the upside, above 0.9047 will resume the rebound from 0.8886 to 0.9086 resistance. Sustained break there will pave the way back to 0.9342 resistance next. On the downside, however, below 0.8962 minor support will turn bias back to the downside for 0.8886 and possibly below.
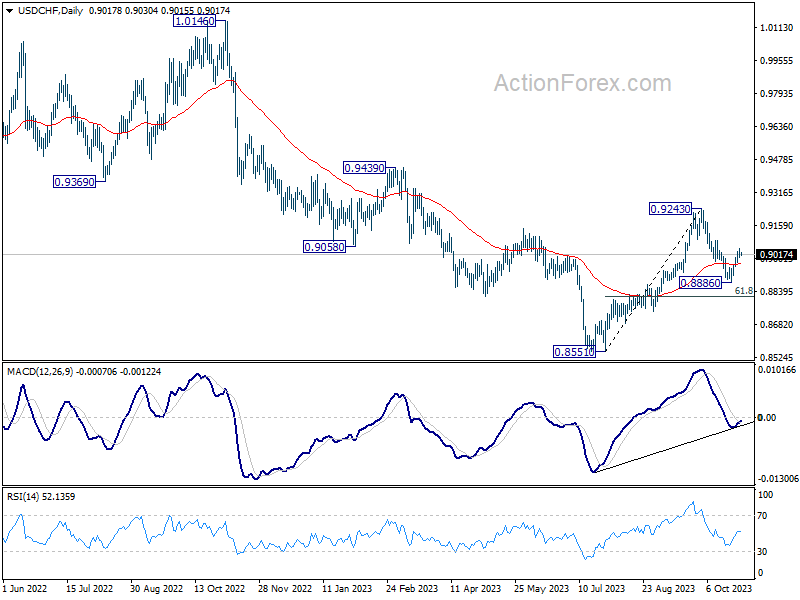
In the bigger picture, outlook is mixed up by the deeper than expected pull back from 0.9243. Yet there was no follow through selling after hitting 0.8886. On the upside, break of 0.9243 resistance will revive the case of medium term bottoming at 0.8851, and turn outlook bullish. However, sustained break of 61.8% retracement of 0.8551 to 0.9243 at 0.8815 will argue that larger decline from 1.0146 is ready to resume through 0.8551 low.
Technical Outlook and Review
DXY:
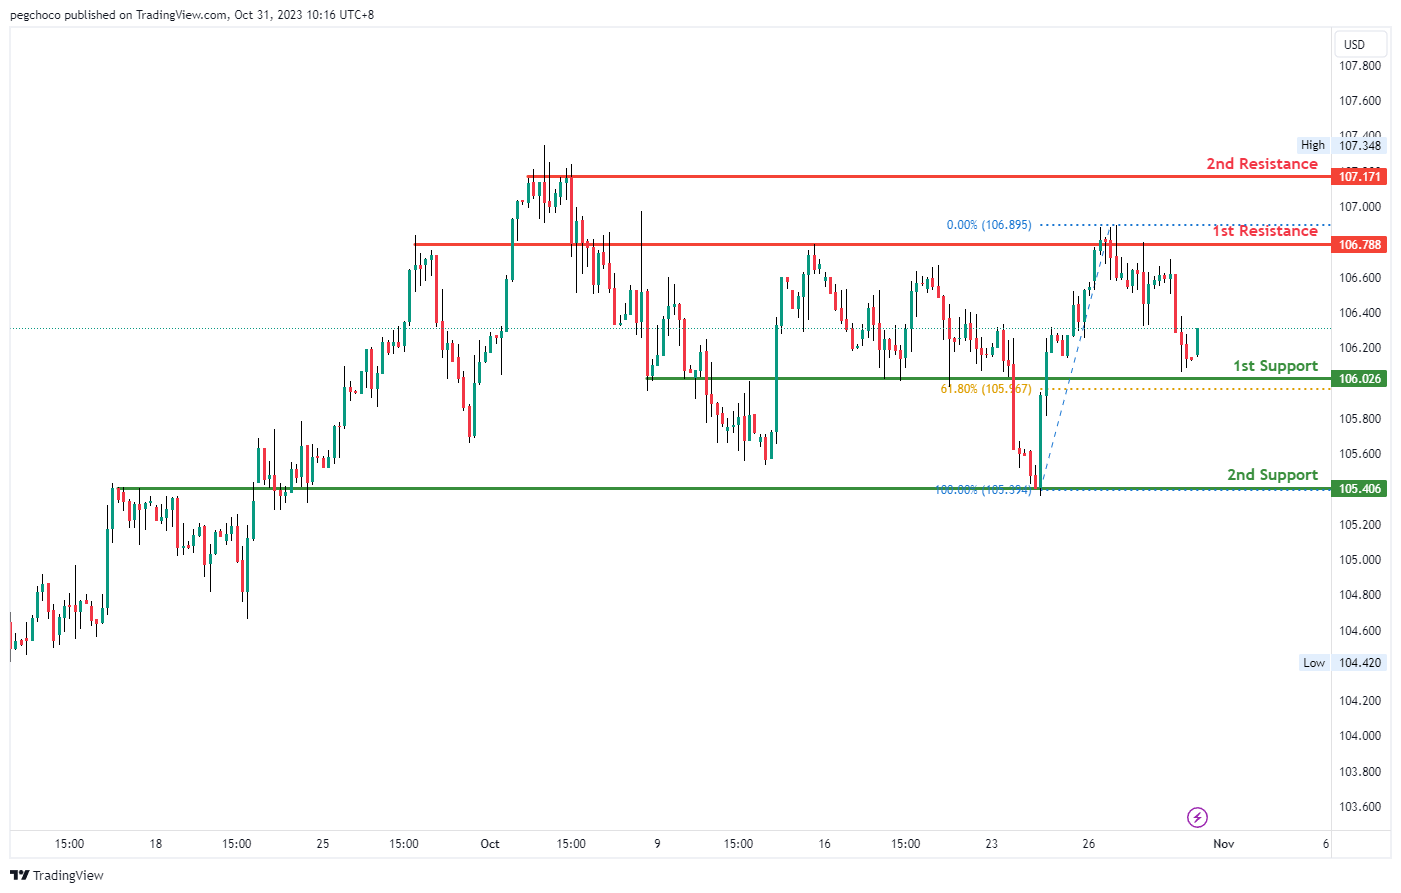
The DXY chart currently indicates a bullish momentum, suggesting the potential for a bullish continuation towards the 1st resistance.
The 1st support at 106.02 is considered significant as it aligns with an overlap support and coincides with the 61.80% Fibonacci Retracement level, indicating its potential to act as a strong support level. Additionally, the 2nd support at 105.40 is identified as another overlap support, reinforcing the potential support zone.
On the resistance side, the 1st resistance at 106.78 is characterized as an overlap resistance, making it a potential barrier to further upward price movements. The 2nd resistance at 107.17 is noted as a multi-swing high resistance, further adding to its significance as a potential area of resistance.
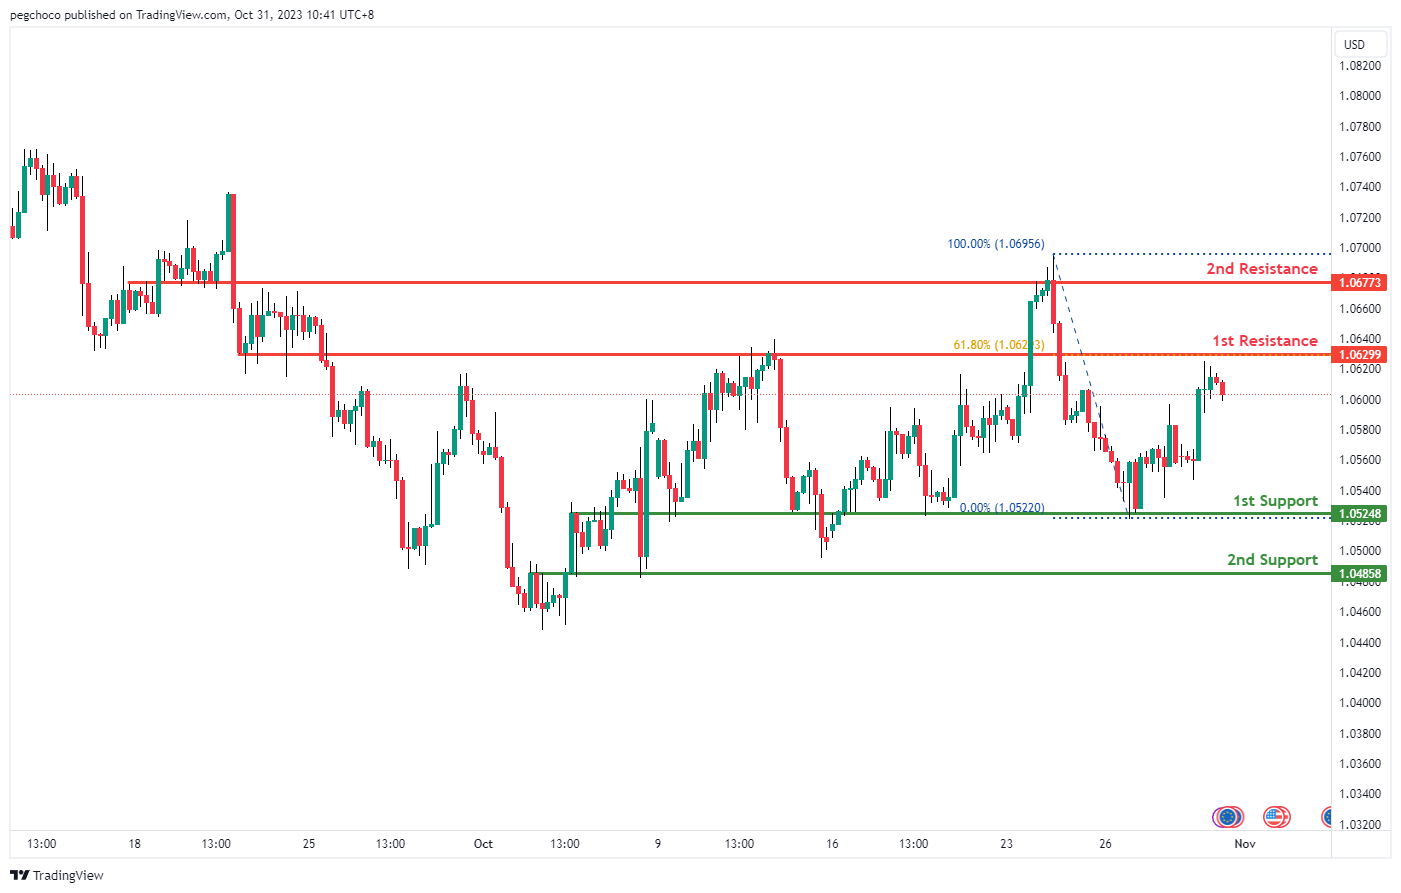
EUR/USD:
The EUR/USD chart currently demonstrates a bearish momentum, suggesting the potential for a bearish continuation towards the 1st support.
The 1st support at 1.0524 is considered significant as it aligns with an overlap support, indicating its potential to act as a strong support level. Additionally, the 2nd support at 1.0485 is identified as another overlap support, reinforcing the potential support zone.
On the resistance side, the 1st resistance at 1.0629 is characterized as an overlap resistance and coincides with the 61.8% Fibonacci Retracement level, making it a strong potential barrier to any notable upward price movement. The 2nd resistance at 1.0677 is also noted as an overlap resistance, adding to its significance as a potential area where selling pressure may emerge.
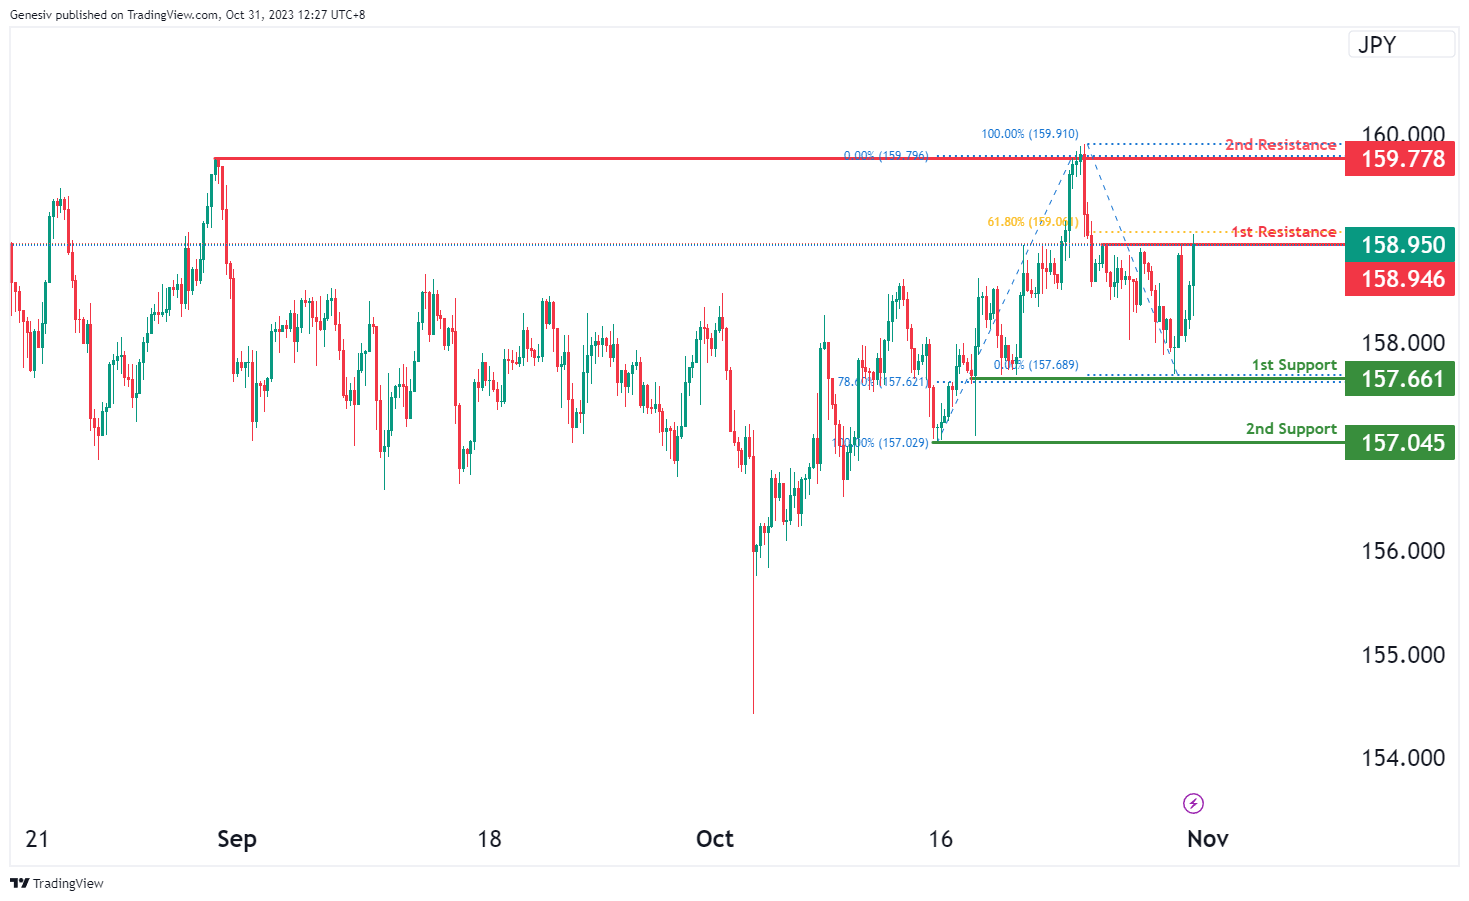
EUR/JPY:
For EUR/JPY, the current chart reflects a bearish overall momentum, indicating the potential for a bearish reaction off the first resistance at 158.94, possibly leading to a drop towards the first support at 157.66.
The first support at 157.66 is considered a robust level due to its multi-swing low support characteristics and the presence of the 78.60% Fibonacci Retracement, establishing a notable level of potential support.
The second support at 157.04 is also significant, featuring swing low support, potentially providing an additional layer of support.
On the resistance side, the first resistance at 158.94 is marked by its multi-swing high resistance characteristics and is associated with the 61.80% Fibonacci Retracement, indicating a significant level of resistance. The second resistance at 159.77 is noteworthy for its multi-swing high resistance attributes, presenting another important level of resistance.
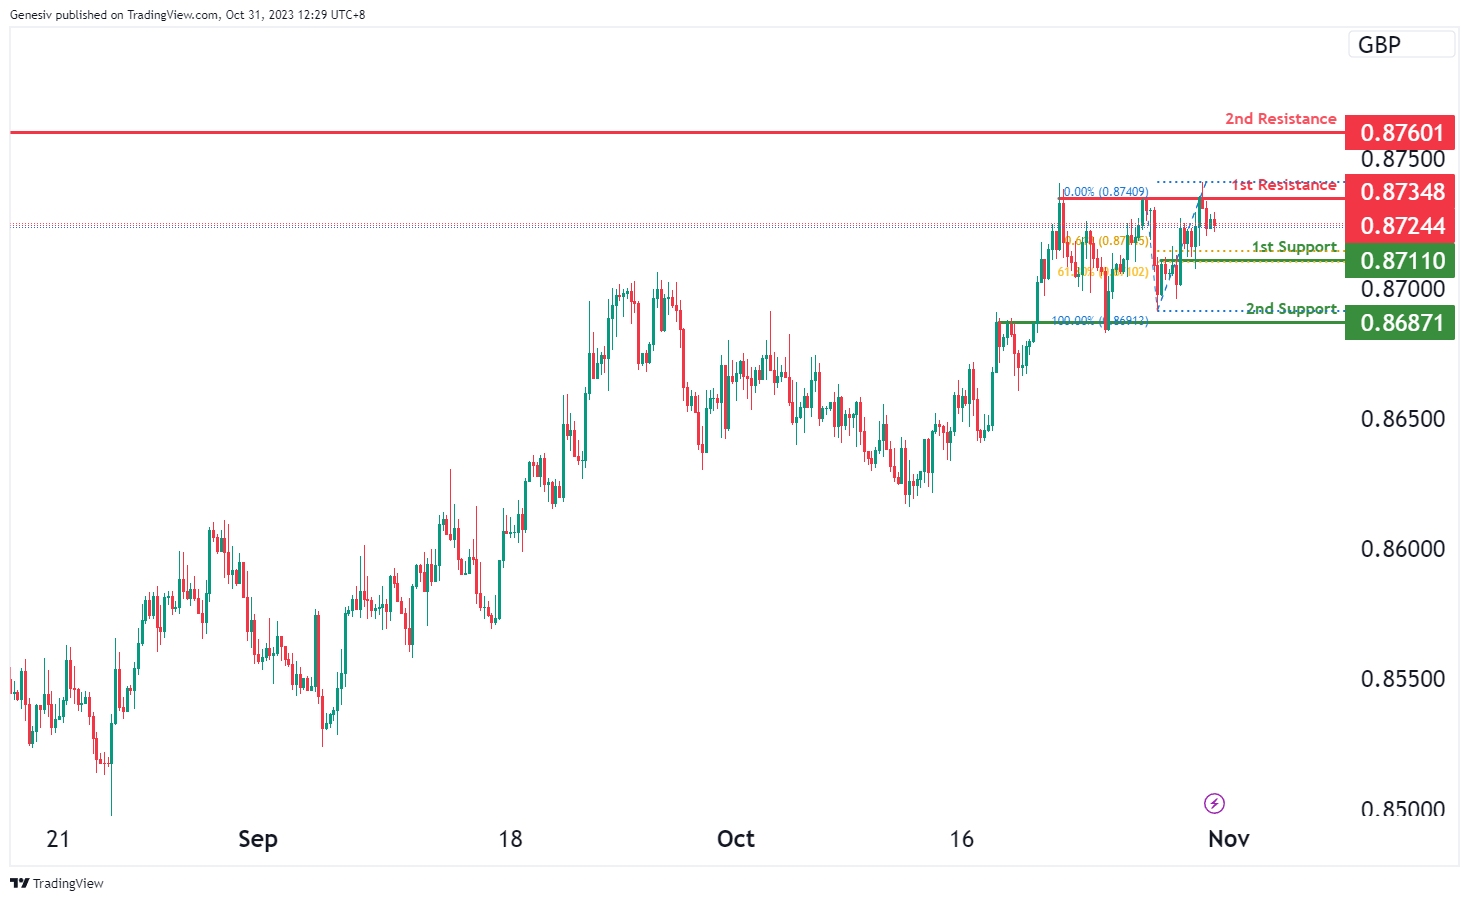
EUR/GBP:
For EUR/GBP, the chart indicates a bearish overall momentum, suggesting a potential bearish continuation towards the first support at 0.8711.
The first support at 0.8711 is deemed strong due to its overlap support characteristics and the presence of the 61.80% Fibonacci Retracement, combined with the 61.80% Fibonacci Projection, indicating Fibonacci confluence. This convergence reinforces its significance as a level of potential support.
The second support at 0.8687 is also an overlap support, providing an additional layer of potential support for the price.
On the resistance side, the first resistance at 0.8734 is marked by multi-swing high resistance characteristics, representing a notable level of resistance.
The second resistance at 0.8760 is noteworthy for its overlap resistance attributes, presenting another important level of resistance for price movements.
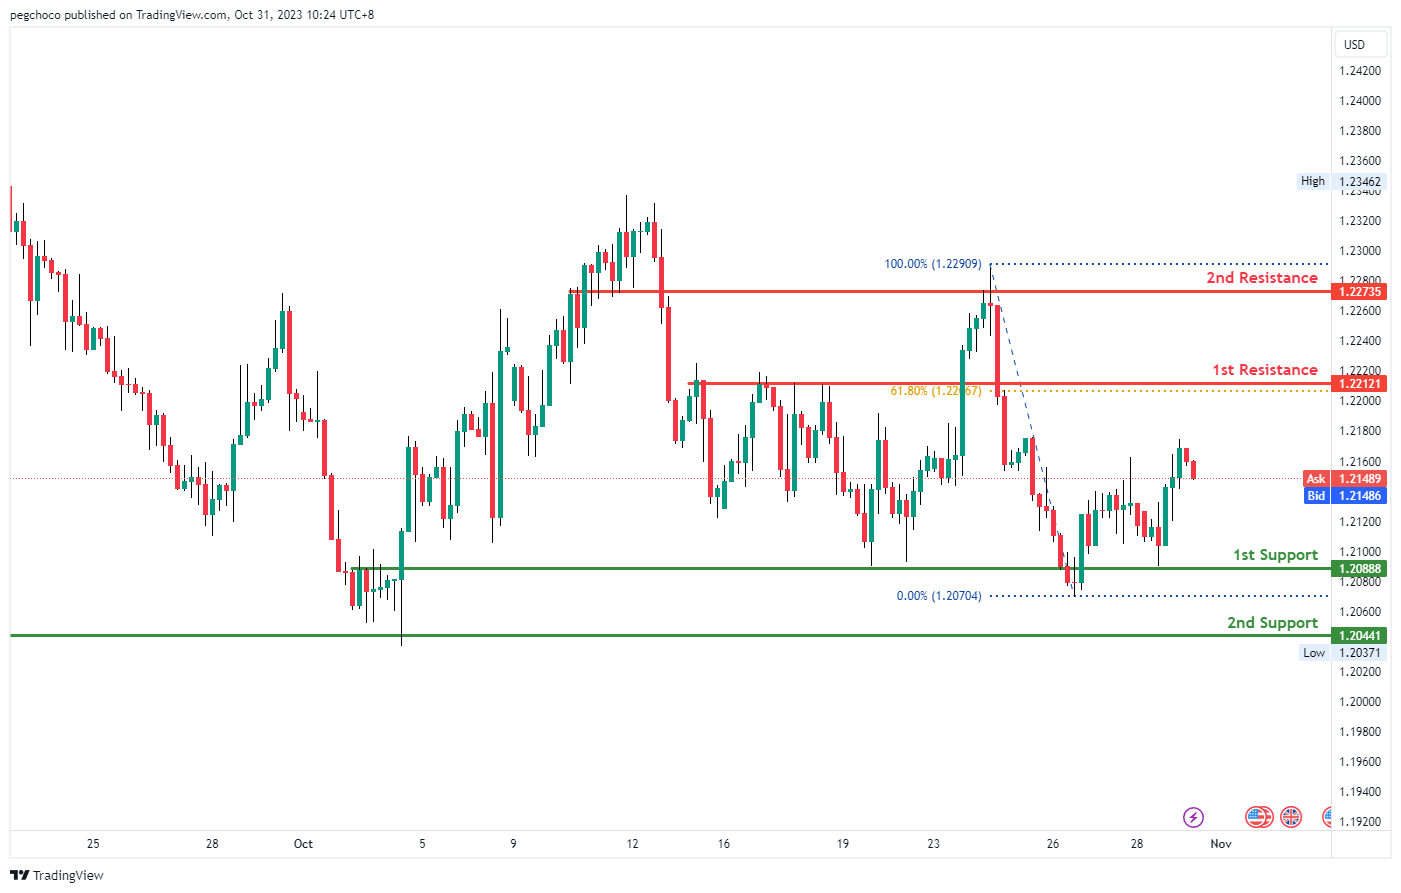
GBP/USD:
The GBP/USD chart currently exhibits a bullish momentum, indicating the potential for a bullish continuation towards the 1st resistance level at 1.2212.
The 1st support at 1.2088 is considered significant as it aligns with an overlap support, indicating its potential to act as a strong support level. Additionally, the 2nd support at 1.2044 is also identified as an overlap support, reinforcing the potential support zone.
On the resistance side, the 1st resistance at 1.2212 is characterized as a pullback resistance and coincides with the 61.80% Fibonacci Retracement level, making it a strong potential barrier to upward price movement. The 2nd resistance at 1.2273 is also noted as an overlap resistance, adding to its significance as a potential area where selling pressure may emerge. Given the overall bullish momentum, there’s a likelihood of price continuing its upward trajectory towards these resistance levels.
GBP/JPY:
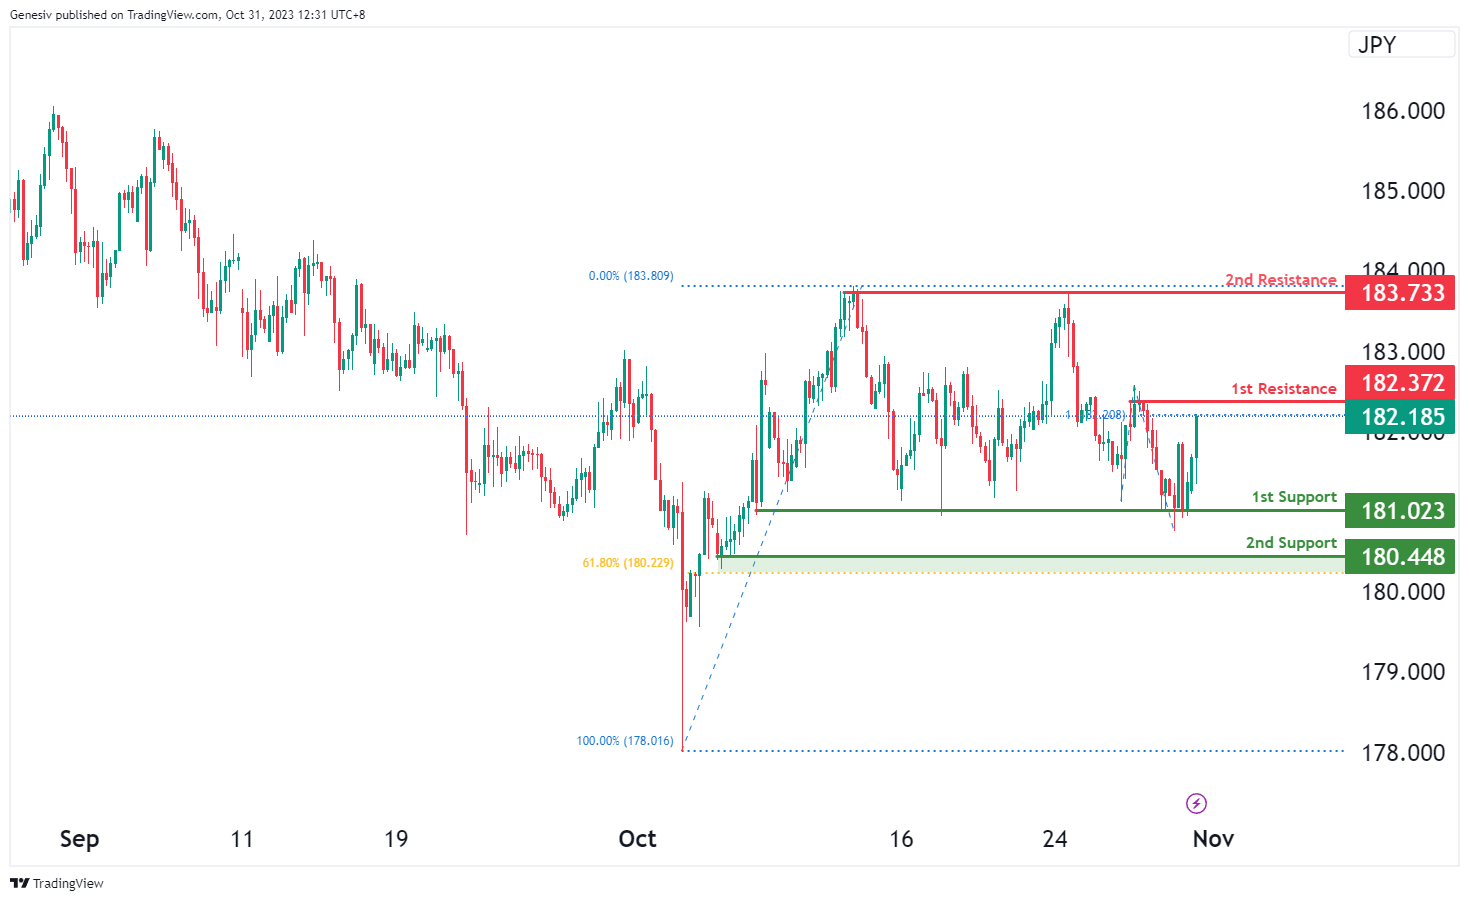
For GBP/JPY, the chart reflects a bearish overall momentum, indicating the potential for a rise towards the first resistance at 182.37 in the short term before reversing off it and dropping towards the first support at 181.02.
The first support at 181.02 is considered a significant level due to its multi-swing low support characteristics, potentially offering strong support for the price.
The second support at 180.44 is also notable as it represents swing low support and is associated with the 61.80% Fibonacci Retracement, adding further strength to its support level.
On the resistance side, the first resistance at 182.37 is marked by swing high resistance and is linked with the 61.80% Fibonacci Retracement, indicating a notable level of resistance.
The second resistance at 186.47 represents swing high resistance and is associated with the 100% Fibonacci Projection, indicating another critical level of resistance in the chart.
USD/CHF:
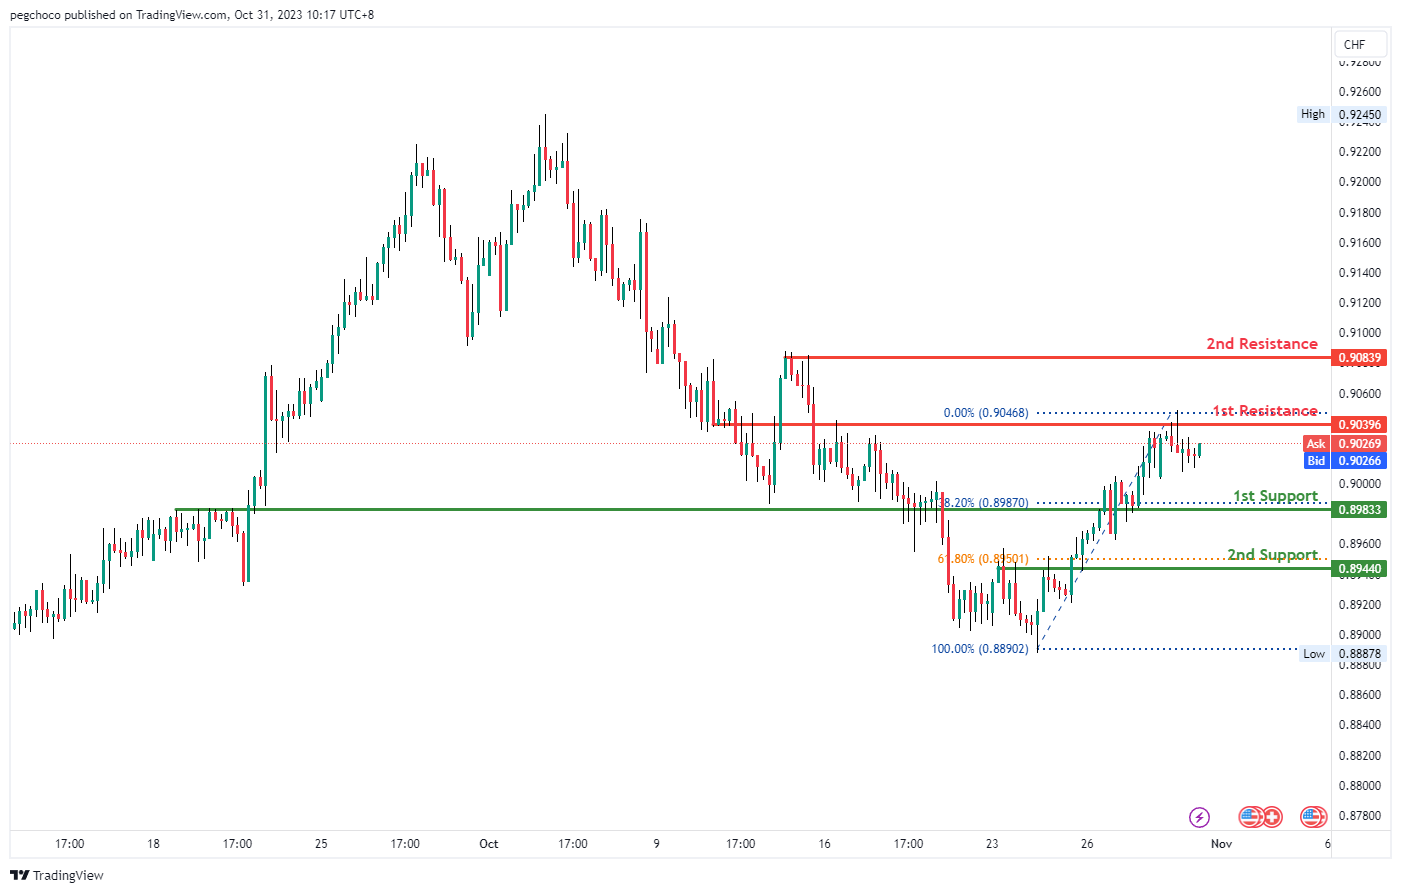
The USD/CHF chart currently shows a bearish momentum, suggesting the potential for a bearish reaction off the 1st resistance level at 0.9039, followed by a drop towards the 1st support level at 0.8983.
The 1st support at 0.8983 is considered significant as it aligns with a pullback support and coincides with the 38.20% Fibonacci Retracement level, indicating its potential to act as a strong support level. Additionally, the 2nd support at 0.8944 is identified as an overlap support and aligns with the 61.80% Fibonacci Retracement, further reinforcing the potential support zone.
On the resistance side, the 1st resistance at 0.9039 is characterized as an overlap resistance, making it a strong potential barrier to upward price movement. The 2nd resistance at 0.9083 is also noted as a multi-swing high resistance, adding to its significance as a potential level where selling pressure may emerge. Given the overall bearish momentum, there’s a likelihood of price reacting to these resistance levels and heading towards the support levels mentioned.
USD/JPY:
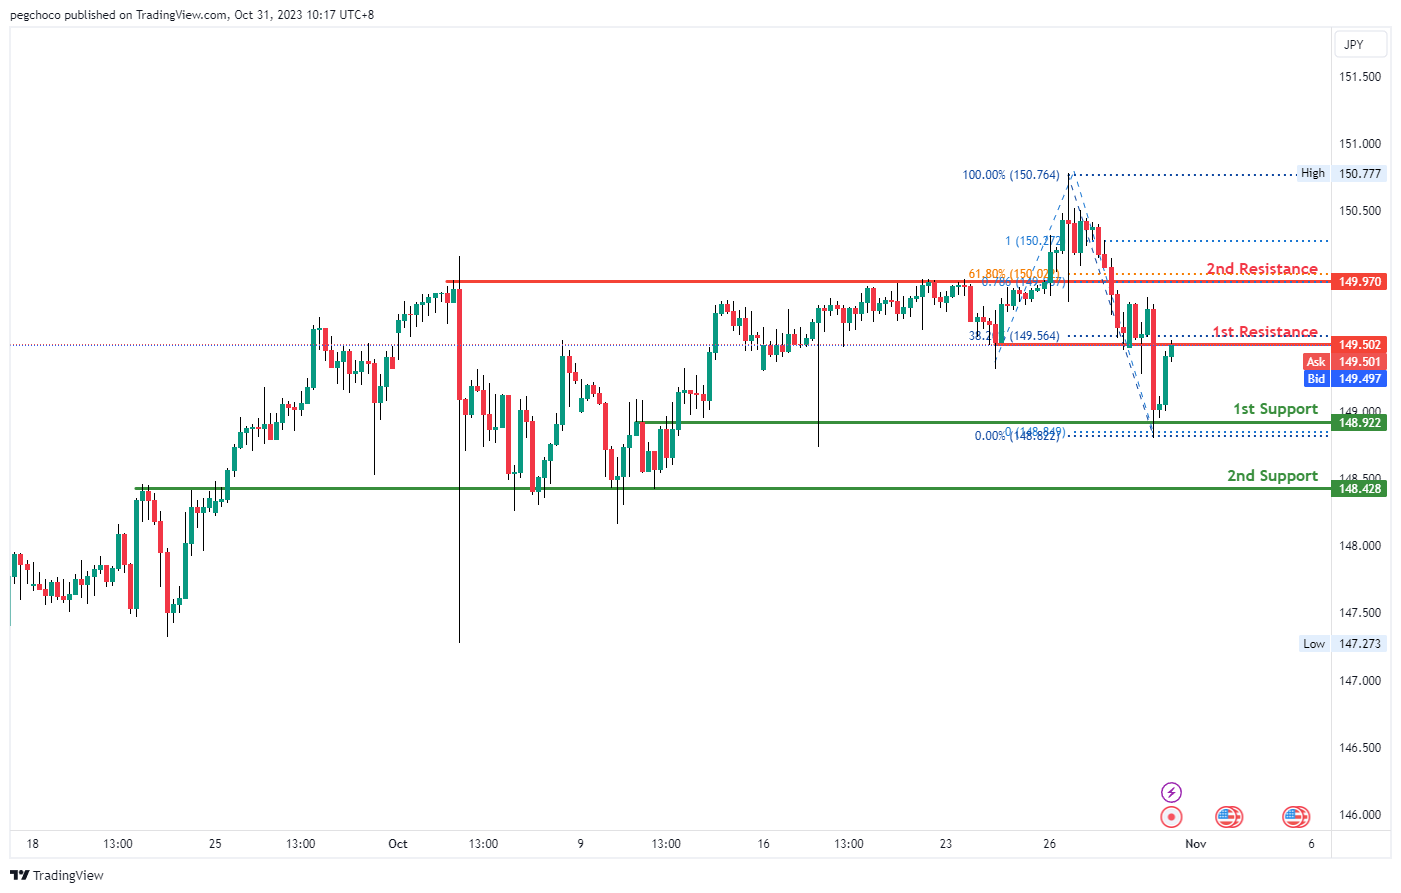
The USD/JPY chart currently exhibits a bearish momentum, suggesting the potential for a bearish reaction off the 1st resistance level at 149.50, followed by a drop towards the 1st support level at 148.92.
The 1st support at 148.92 is considered significant as it aligns with an overlap support, indicating its potential to act as a strong support level. Additionally, the 2nd support at 148.42 is also identified as an overlap support, reinforcing the potential support zone.
On the resistance side, the 1st resistance at 149.50 is characterized as an overlap resistance and coincides with the 38.20% Fibonacci Retracement level, making it a strong potential barrier to upward price movement. The 2nd resistance at 149.97 is noteworthy as it aligns with an overlap resistance, the 78.60% Fibonacci Projection, and the 61.80% Fibonacci Retracement, indicating a significant level of Fibonacci confluence
USD/CAD:
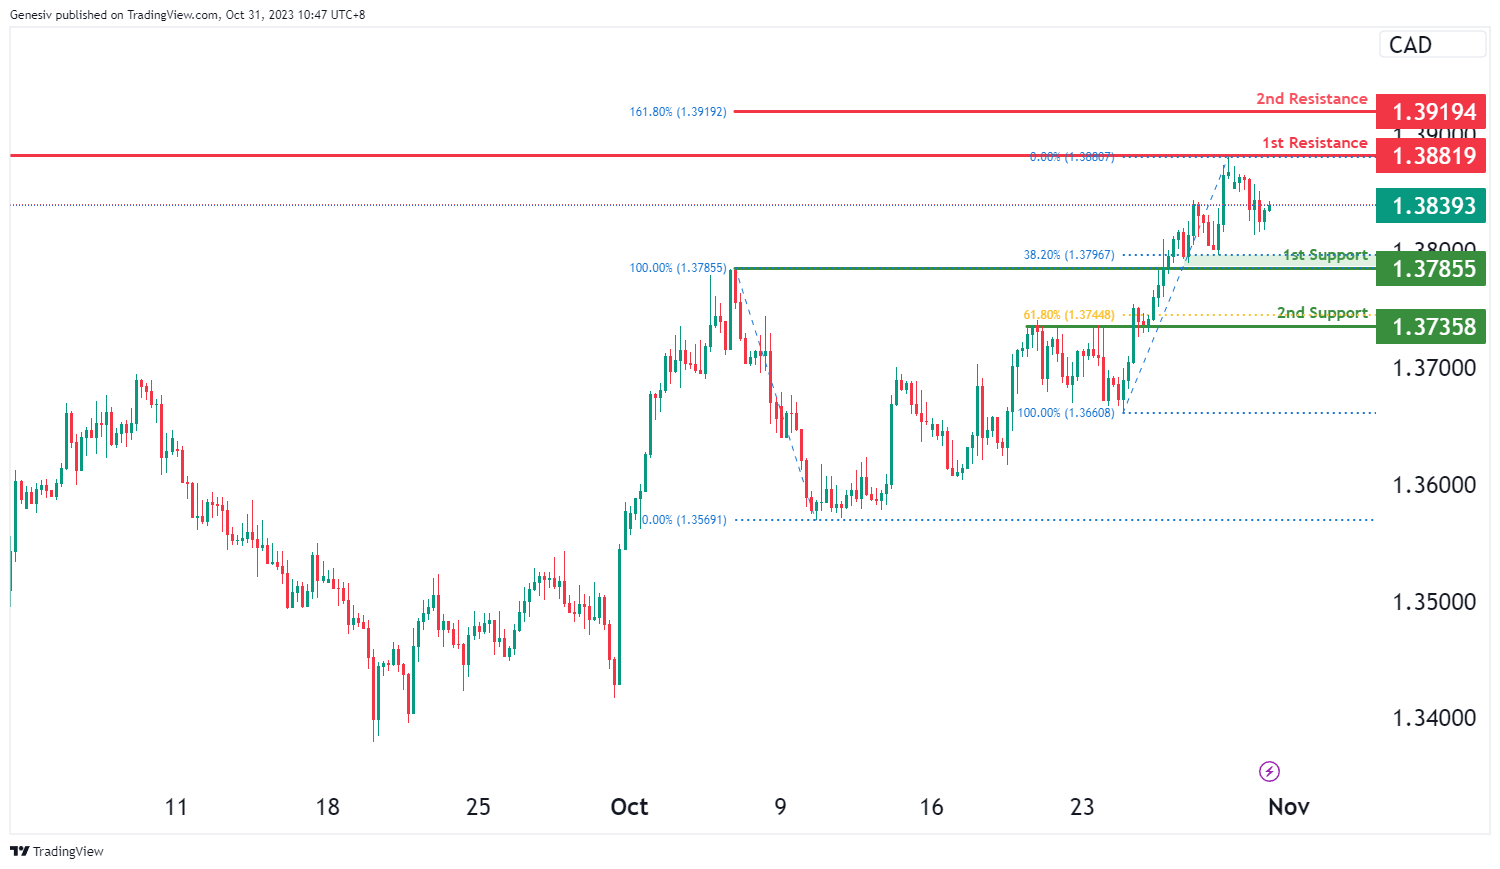
The USD/CAD chart currently demonstrates an overall bullish momentum. There is a potential scenario for price to make a bullish continuation towards the 1st resistance.
The 1st resistance level at 1.3882 is identified as a pullback resistance. Beyond that, the 2nd resistance level at 1.3919 is marked as a resistance that aligns with the 161.80% Fibonacci extension level, further reinforcing the potential for resistance in that region.
To the downside, the 1st support level at 1.3786 is identified as an overlap support that aligns with the 38.20% Fibonacci retracement level. Further below, the 2nd support level at 1.3736 is also noted as an overlap support that aligns with the 61.80% Fibonacci retracement level, indicating a potential area of price support.
AUD/USD:
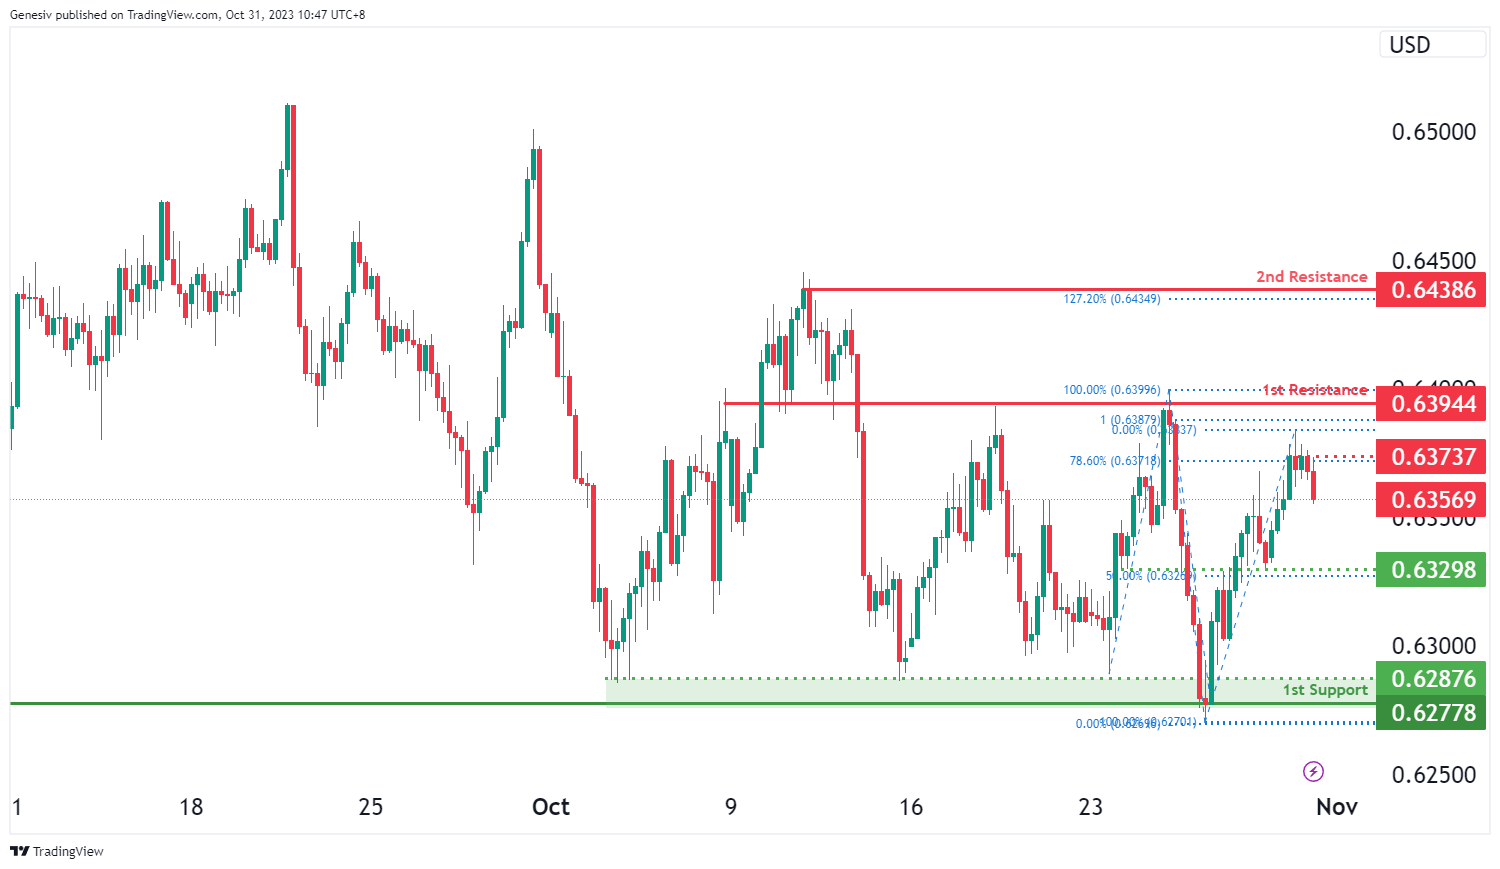
The AUD/USD chart currently exhibits an overall bearish momentum. There is a potential scenario for price to break below the intermediate support and make a bearish continuation towards the 1st support.
The intermediate support level at 0.6329 is identified as an overlap support that aligns with the 50.00% Fibonacci retracement level. The 1st support level at 0.6278 is marked as a multi-swing-low support, indicating its potential as a strong level of price support.
On the resistance side, the intermediate resistance level at 0.6374 is identified as an pullback resistance that aligns with the 78.60% Fibonacci retracement level while the 1st resistance level at 0.6394 is noted as an overlap resistance that aligns close to the 100.00% Fibonacci projection level. Higher up, the 2nd resistance level at 0.6439 is identified as a swing-high resistance that aligns with the 127.20% Fibonacci extension level.
NZD/USD
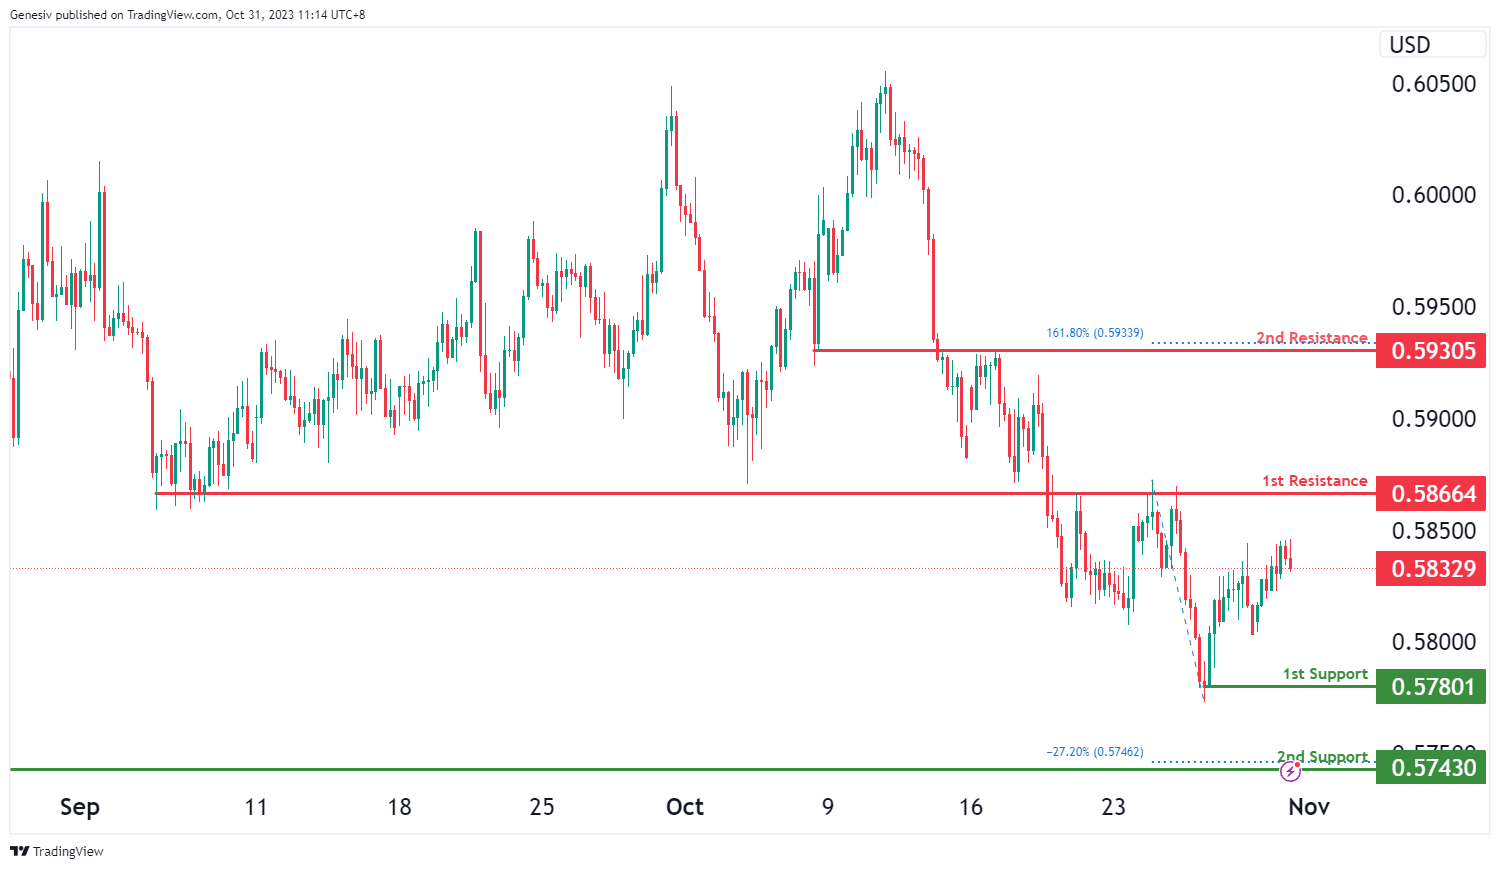
The NZD/USD chart currently demonstrates an overall bearish momentum, suggesting a potential for a bearish continuation towards the 1st support. Price is also trading under the bearish Ichimoku cloud, which acts as an additional bearish factor.
The 1st support level at 0.5780 is identified as a pullback support. Additionally, the 2nd support level at 0.5743 is marked as a swing-low support that aligns with the -27.20% Fibonacci expansion level, which further reinforces the potential for a strong support zone.
On the resistance side, the 1st resistance level at 0.5866 is identified as an overlap resistance. Beyond this, the 2nd resistance level at 0.5931 is also noted as an overlap resistance that aligns with the 161.80% Fibonacci extension level, acting as a potential barrier to upward price movements.
DJ30:
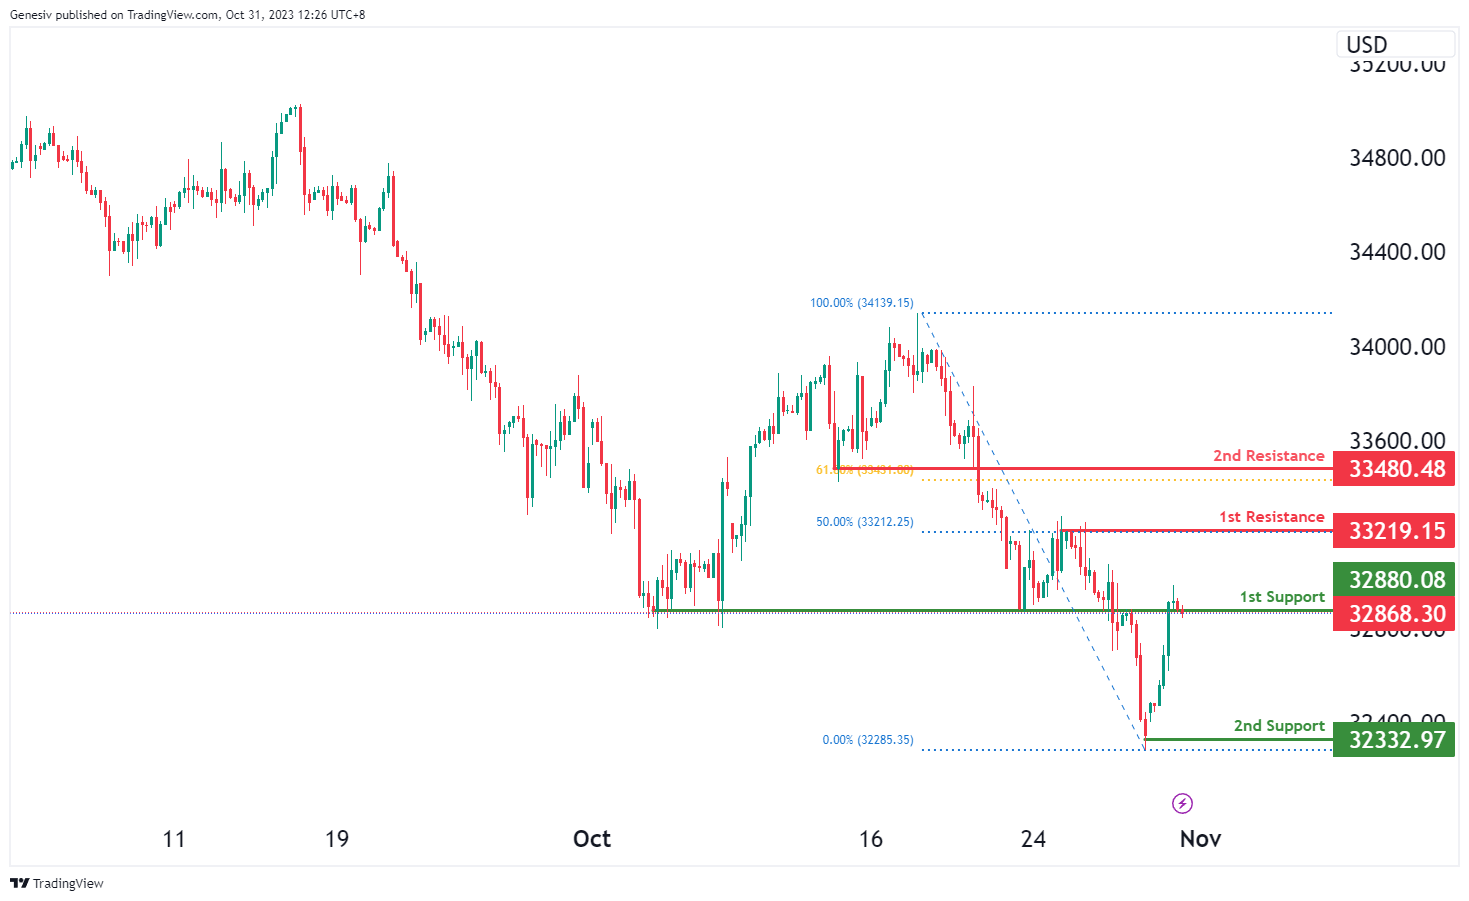
For DJ30, the chart currently indicates a bearish overall momentum, suggesting that the price could potentially witness a bearish break off the first support at 32874.86 and drop towards the second support at 32332.97.
The first support at 32874.86 is considered a strong level due to its overlap support characteristics, providing a notable potential support level.
The second support at 32332.97 is also significant as it features swing low support, marking another level of support for potential price movements.
On the resistance side, the first resistance at 33219.15 is marked by its multi-swing high resistance characteristics and is associated with the 50% Fibonacci Retracement, indicating a significant level of resistance. The second resistance at 33480.48 is noteworthy for its pullback resistance and is linked with the 61.80% Fibonacci Retracement, representing another important level of resistance.
GER40:
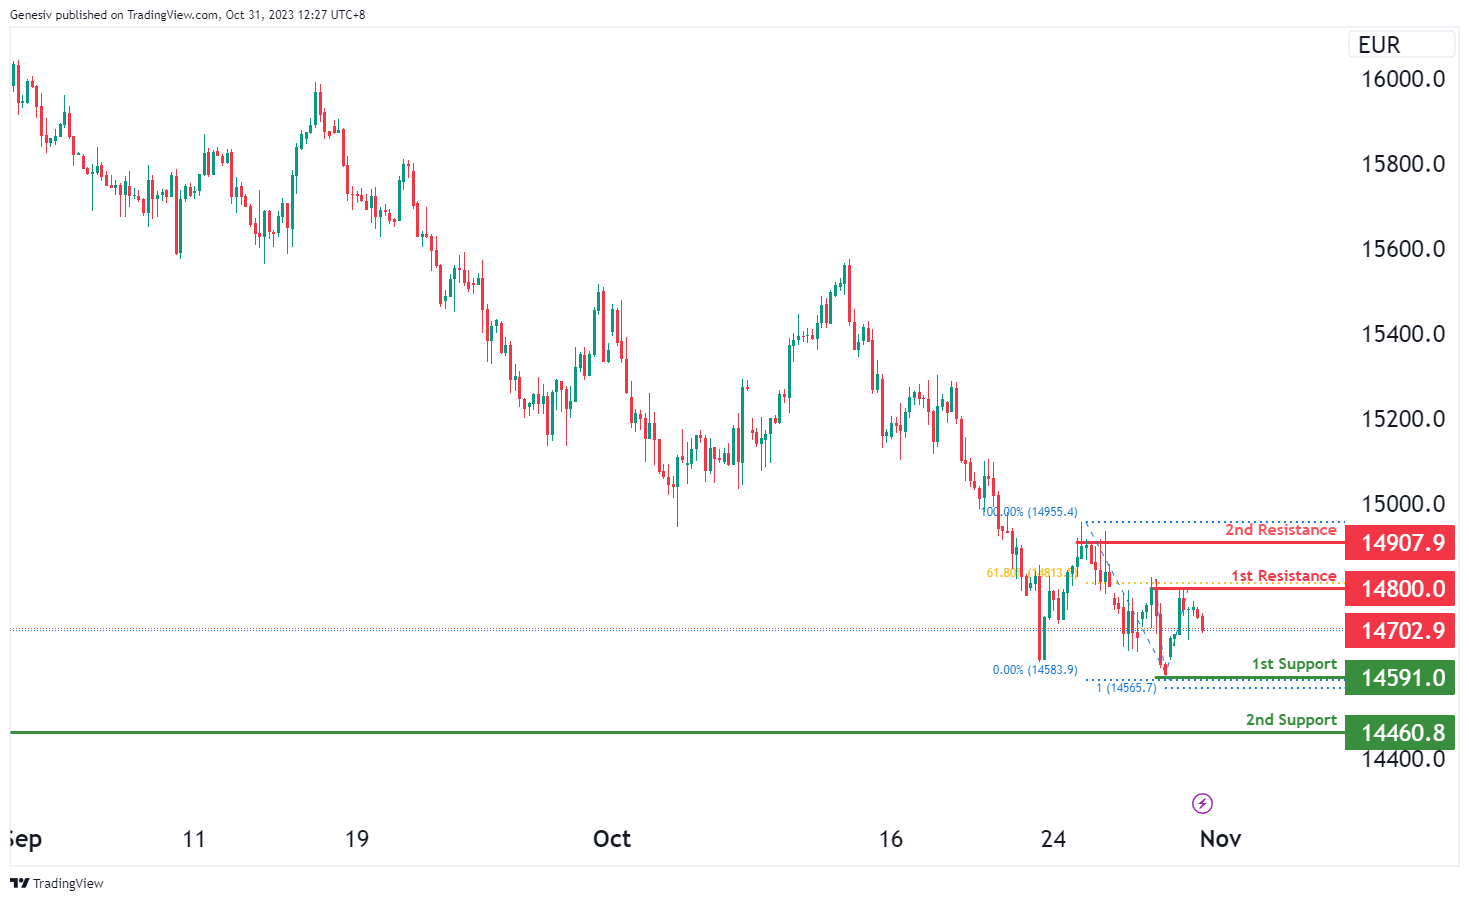
For GER40, the chart currently indicates a bearish overall momentum, suggesting that the price could potentially continue in a bearish direction towards the first support at 14591.00.
The first support at 14591.00 is considered a strong level due to its swing low support characteristics and the presence of the 100% Fibonacci Projection, making it a notable potential support level.
The second support at 14460.80 is also significant as it features swing low support, providing another level of potential support for the price.
On the resistance side, the first resistance at 14800.00 is marked by multi-swing high resistance characteristics and is associated with the 61.80% Fibonacci Retracement, indicating a substantial level of resistance. The second resistance at 14907.90 is noteworthy for its multi-swing high resistance, presenting another important level of resistance.
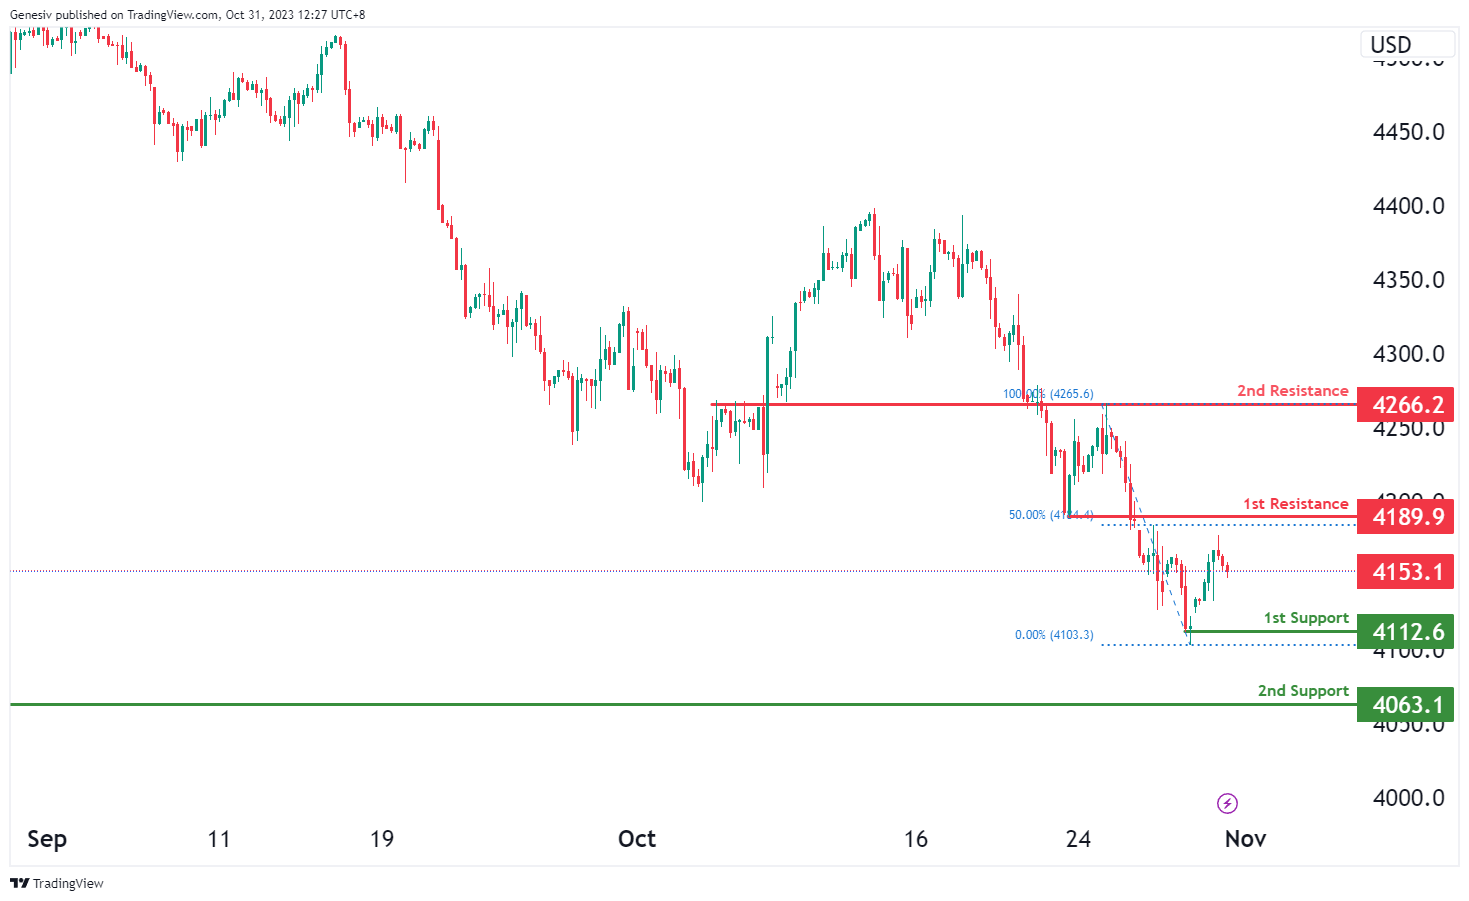
US500
For US500, the chart currently displays a bearish overall momentum, suggesting a potential bearish continuation towards the first support at 4112.6.
The first support at 4112.6 is considered strong due to its swing low support characteristics, marking a significant level of potential support for the price.
The second support at 4063.1 is also notable, as it features overlap support, presenting an additional layer of potential support.
On the resistance side, the first resistance at 4189.9 is marked by pullback resistance, associated with the 50% Fibonacci Retracement, indicating a notable level of resistance. The second resistance at 4266.2 is significant due to its overlap resistance characteristics, presenting another important level of resistance.
BTC/USD:
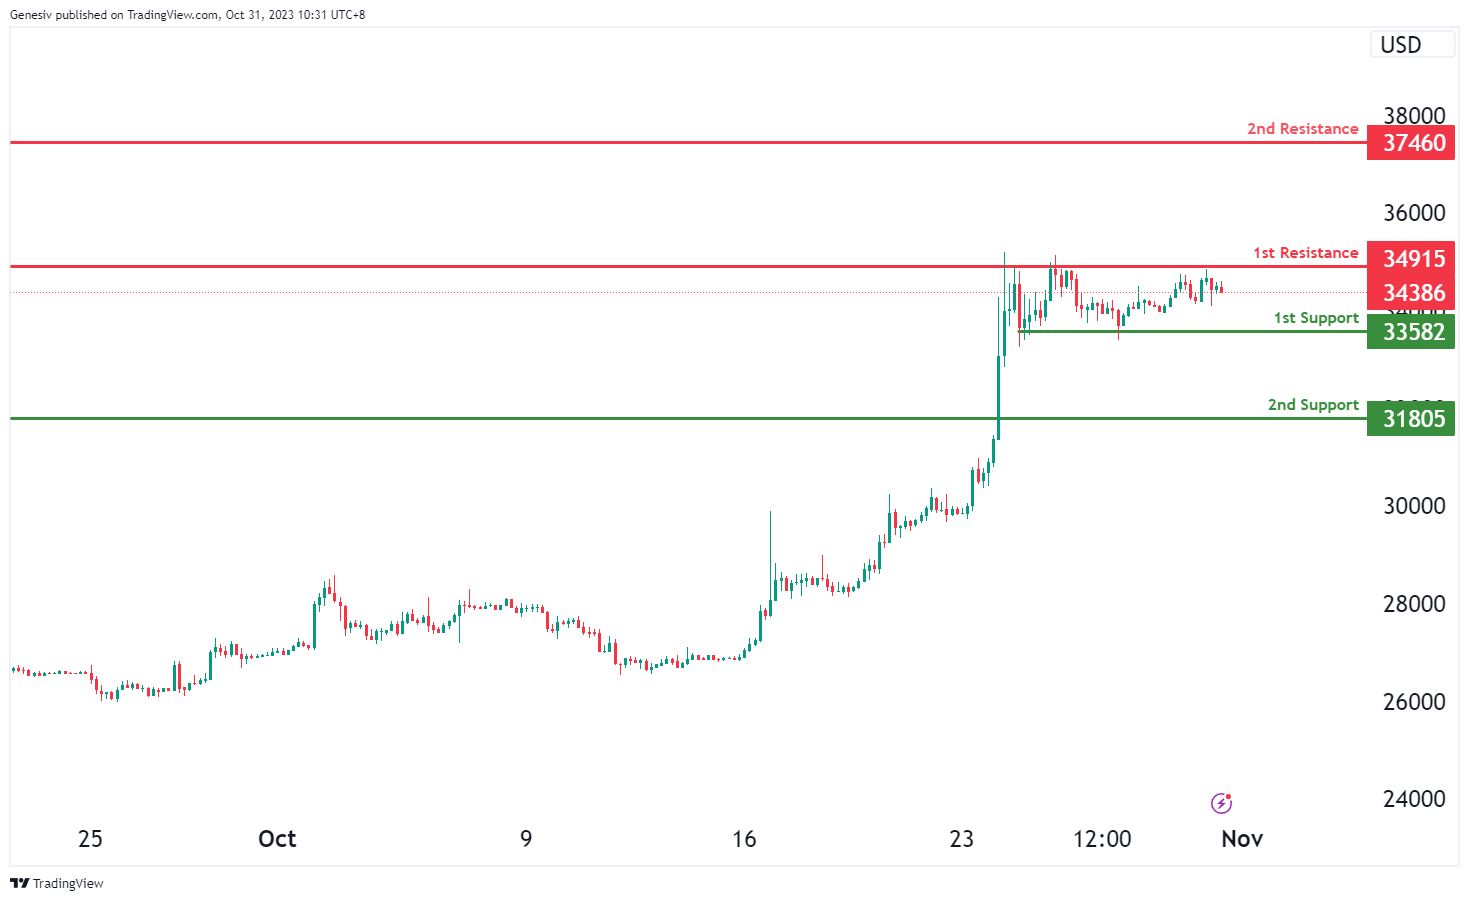
For BTC/USD, the chart currently suggests a neutral overall momentum, implying that the price could potentially fluctuate between the first resistance at 34915 and the first support at 33582.
The first support at 33582 is considered strong due to its multi-swing low support characteristics, offering a notable level of potential support.
The second support at 31805 is also significant as it provides pullback support, potentially adding another layer of support.
On the resistance side, the first resistance at 34915 is marked by its overlap resistance characteristics, indicating a substantial level of resistance. The second resistance at 37460 is noteworthy for its pullback resistance attributes, serving as another important level of resistance.
ETH/USD:
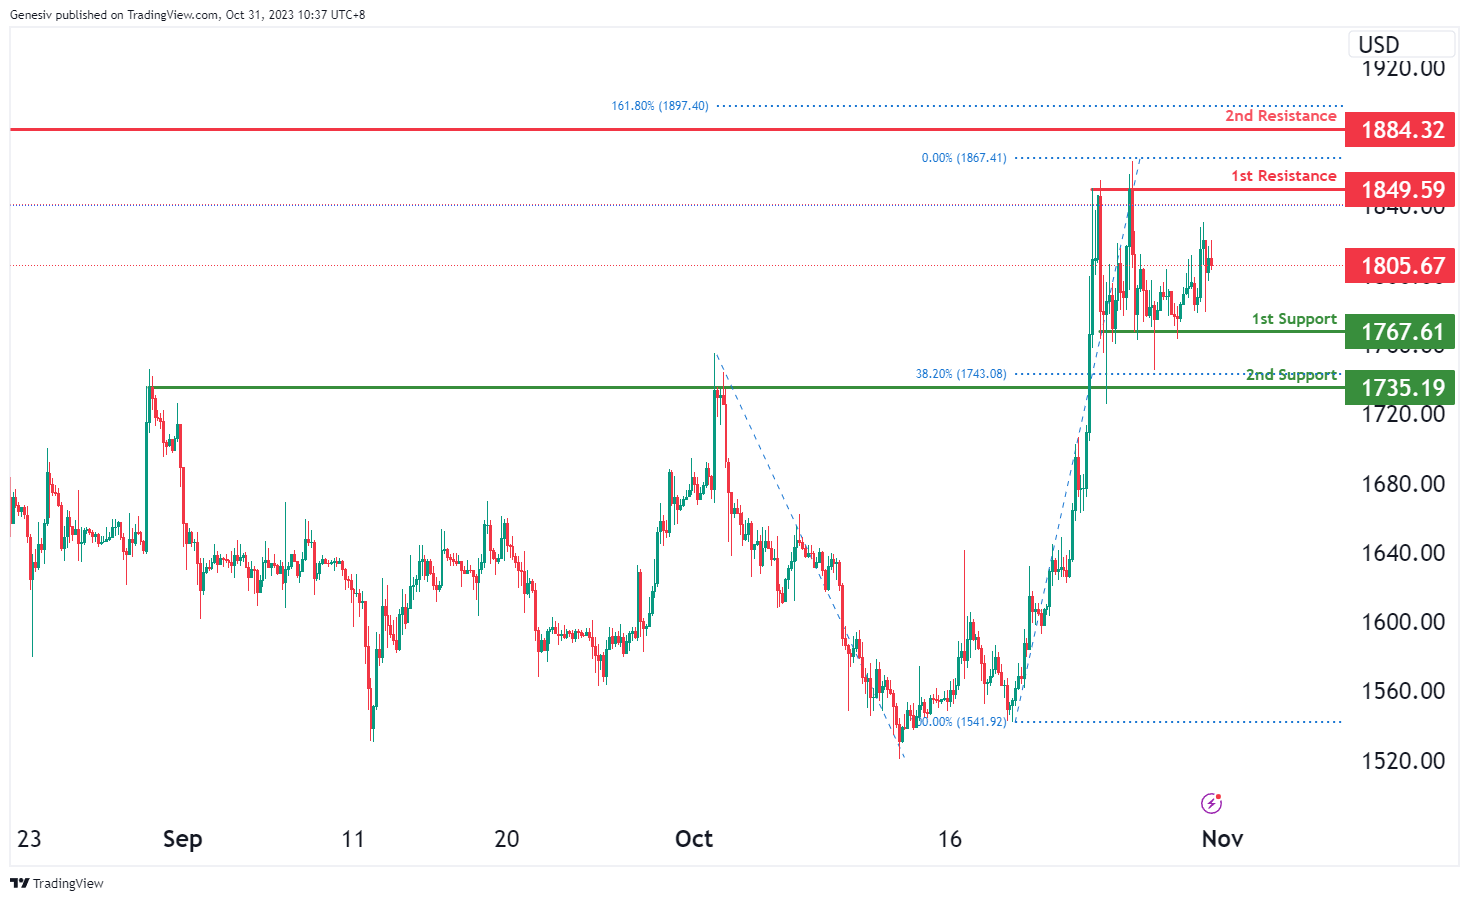
For ETH/USD, the chart currently indicates a neutral overall momentum, suggesting that the price could potentially fluctuate between the first resistance at 1849.59 and the first support at 1767.61.
The first support at 1767.61 is considered strong due to its multi-swing low support characteristics, presenting a significant potential support level.
The second support at 1735.19 is also notable as it offers pullback support and is associated with the 38.20% Fibonacci Retracement, adding further support characteristics.
On the resistance side, the first resistance at 1849.59 is marked by its multi-swing high resistance characteristics, suggesting a substantial level of resistance. The second resistance at 1884.32 is noteworthy for its multi-swing high resistance and is linked with the 161.80% Fibonacci Extension, representing another important level of resistance.
WTI/USD:
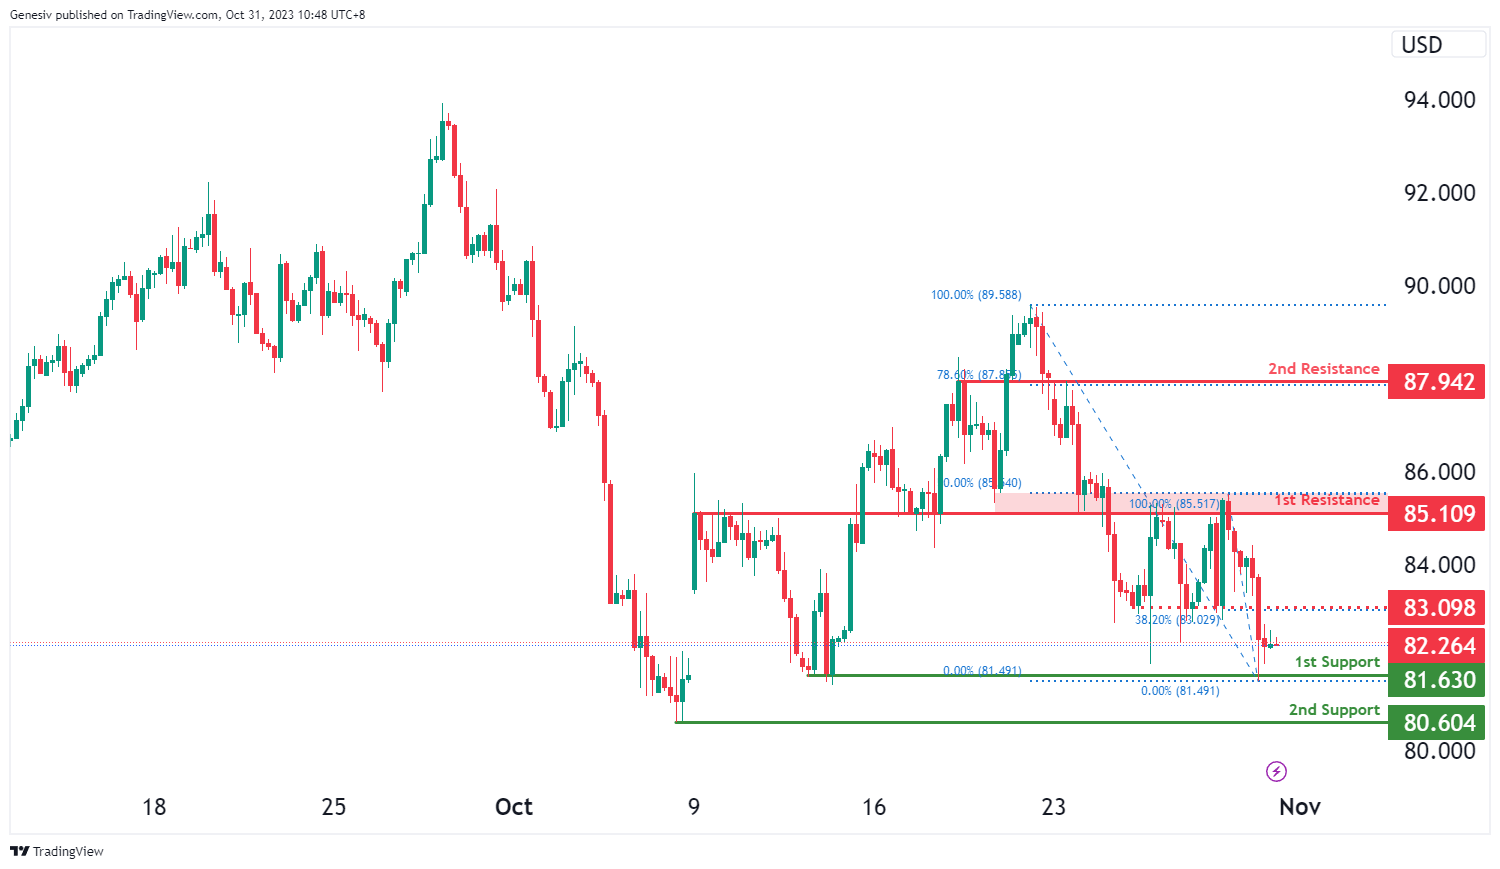
The WTI chart currently exhibits an overall bearish momentum, indicating the potential for price to make a bearish continuation towards the 1st support.
The 1st support level at 81.63 is identified as a pullback support. Additionally, the 2nd support level at 80.60 is marked as a swing-low support, reinforcing a potential support zone.
On the resistance side, the intermediate resistance level at 83.09 is identified as a pullback resistance that aligns with the 38.20% Fibonacci retracement level while the 1st resistance level at 85.11 is noted as an overlap resistance that aligns close to the 50.00% Fibonacci retracement level. Higher up, the 2nd resistance level at 87.94 is marked as a pullback resistance that aligns with the 78.60% Fibonacci retracement level, making it a strong potential barrier to upward price movement.
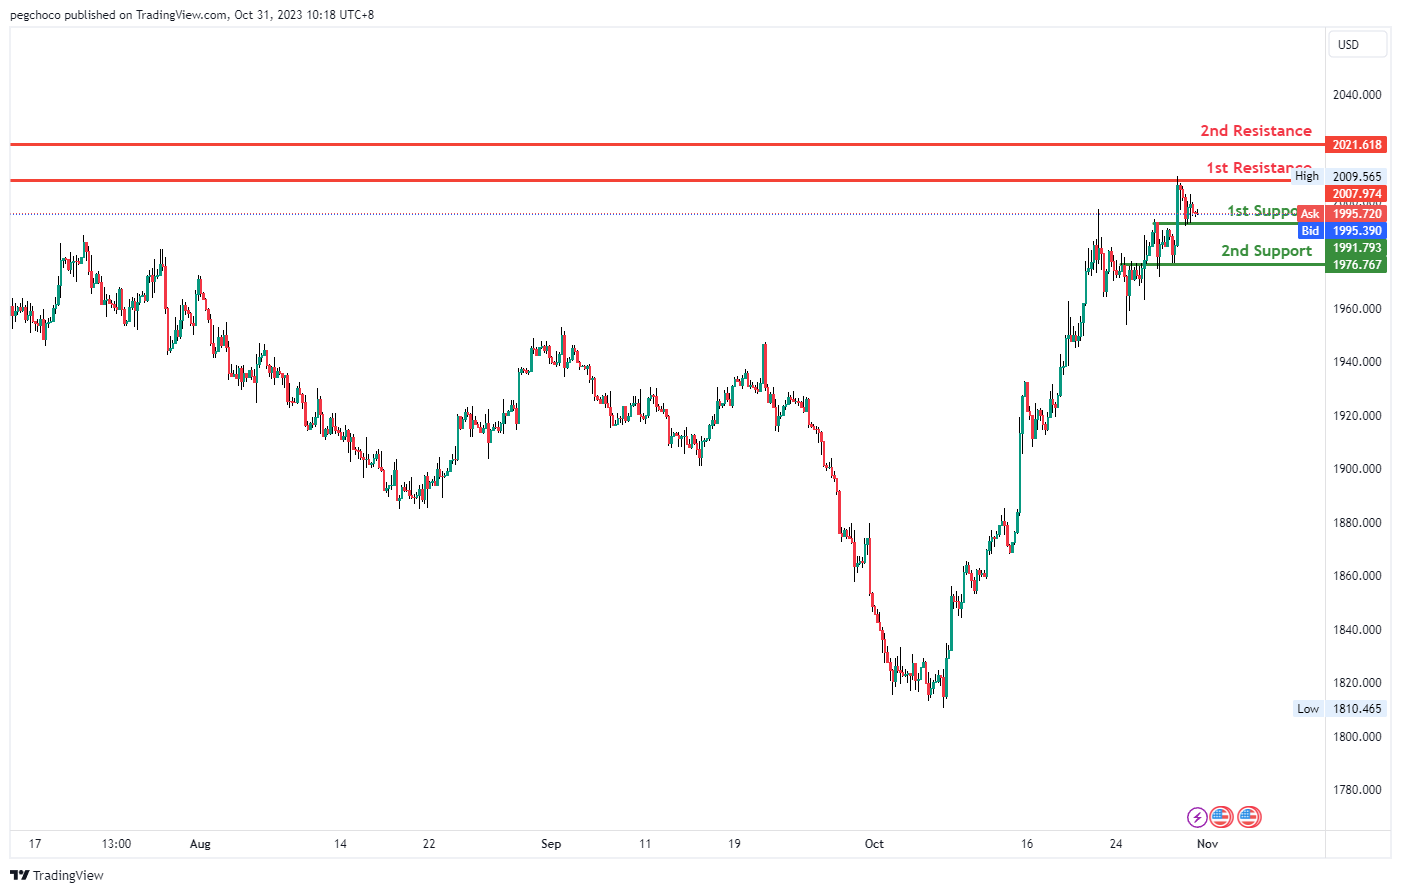
XAU/USD (GOLD):
The XAU/USD (Gold/US Dollar) chart currently displays bullish momentum, suggesting the potential for a bullish bounce off the 1st support level at 1991.79 and a subsequent move towards the 1st resistance level at 2009.97.
The 1st support at 1991.79 is considered significant as it aligns with an overlap support, indicating its potential to act as a strong support level. Similarly, the 2nd support level at 1976.76 is also identified as an overlap support, reinforcing the potential support zone.
On the resistance side, the 1st resistance at 2009.97 is characterized as an overlap resistance, implying that it could serve as a substantial barrier to any notable upward price movement in the bullish direction. Additionally, the 2nd resistance at 2021.61 is also noted as an overlap resistance, further reinforcing the significance of this potential area where price may face resistance.