

Sample Category Title
EURJPY Jumps to Fresh 15-year High
- EURJPY posts a new 2023 peak in today’s session
- Quickly erases gains, seems unable to extend its advance
- Momentum indicators suggest that bulls have lifted foot off the gas
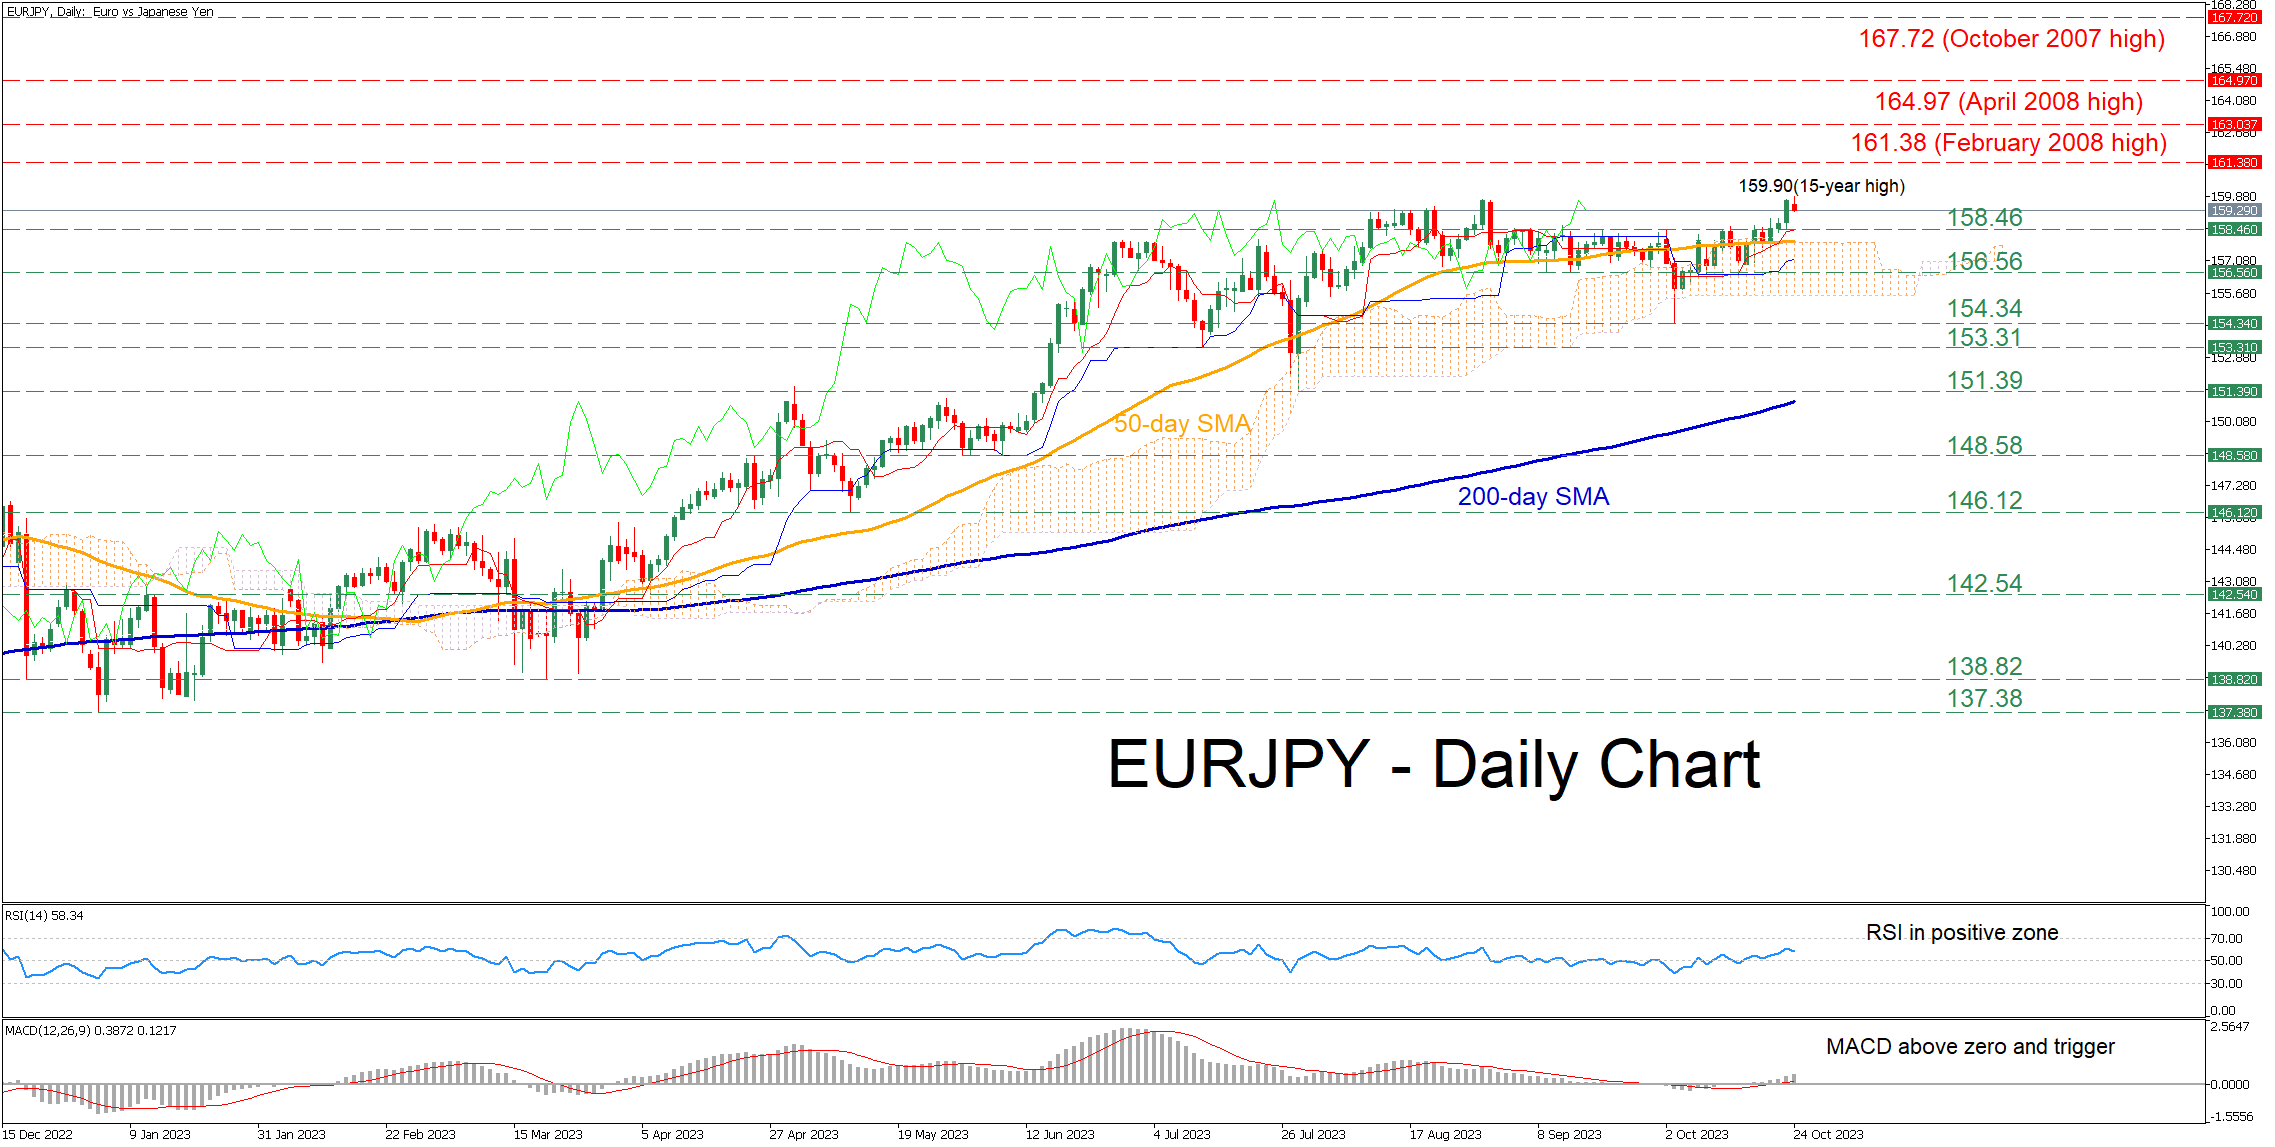
EURJPY had been stuck in a rangebound pattern for the last couple of months, repeatedly failing to extend its bullish medium-term technical structure. Even though the price managed to record a fresh 15-year peak of 159.90 in today's session, it seems to be lacking the necessary momentum to push even higher.
Should buying pressures intensify, the price could storm towards fresh multi-year highs, where the February 2008 peak of 161.38 might curb the pair’s upside. Surpassing that zone, the price may ascend towards the April 2008 high of 164.97. Conquering this barricade, the bulls could then aim for 167.72, the highest level observed in October 2007.
If the price reverses lower, the previous resistance region of 158.46 could now serve as strong support. A break below that territory could trigger a retreat towards the September-October support of 156.56. Failing to halt there, the price could then test the October low of 154.34.
In brief, EURJPY posted a fresh 15-year high on Tuesday but still failed to stage a broader rally to the upside. Is the price heading back to its tight range?
GBPUSD Receives Positive Vibes
- GBPUSD has its best day since July
- Bulls await a close above 1.2300
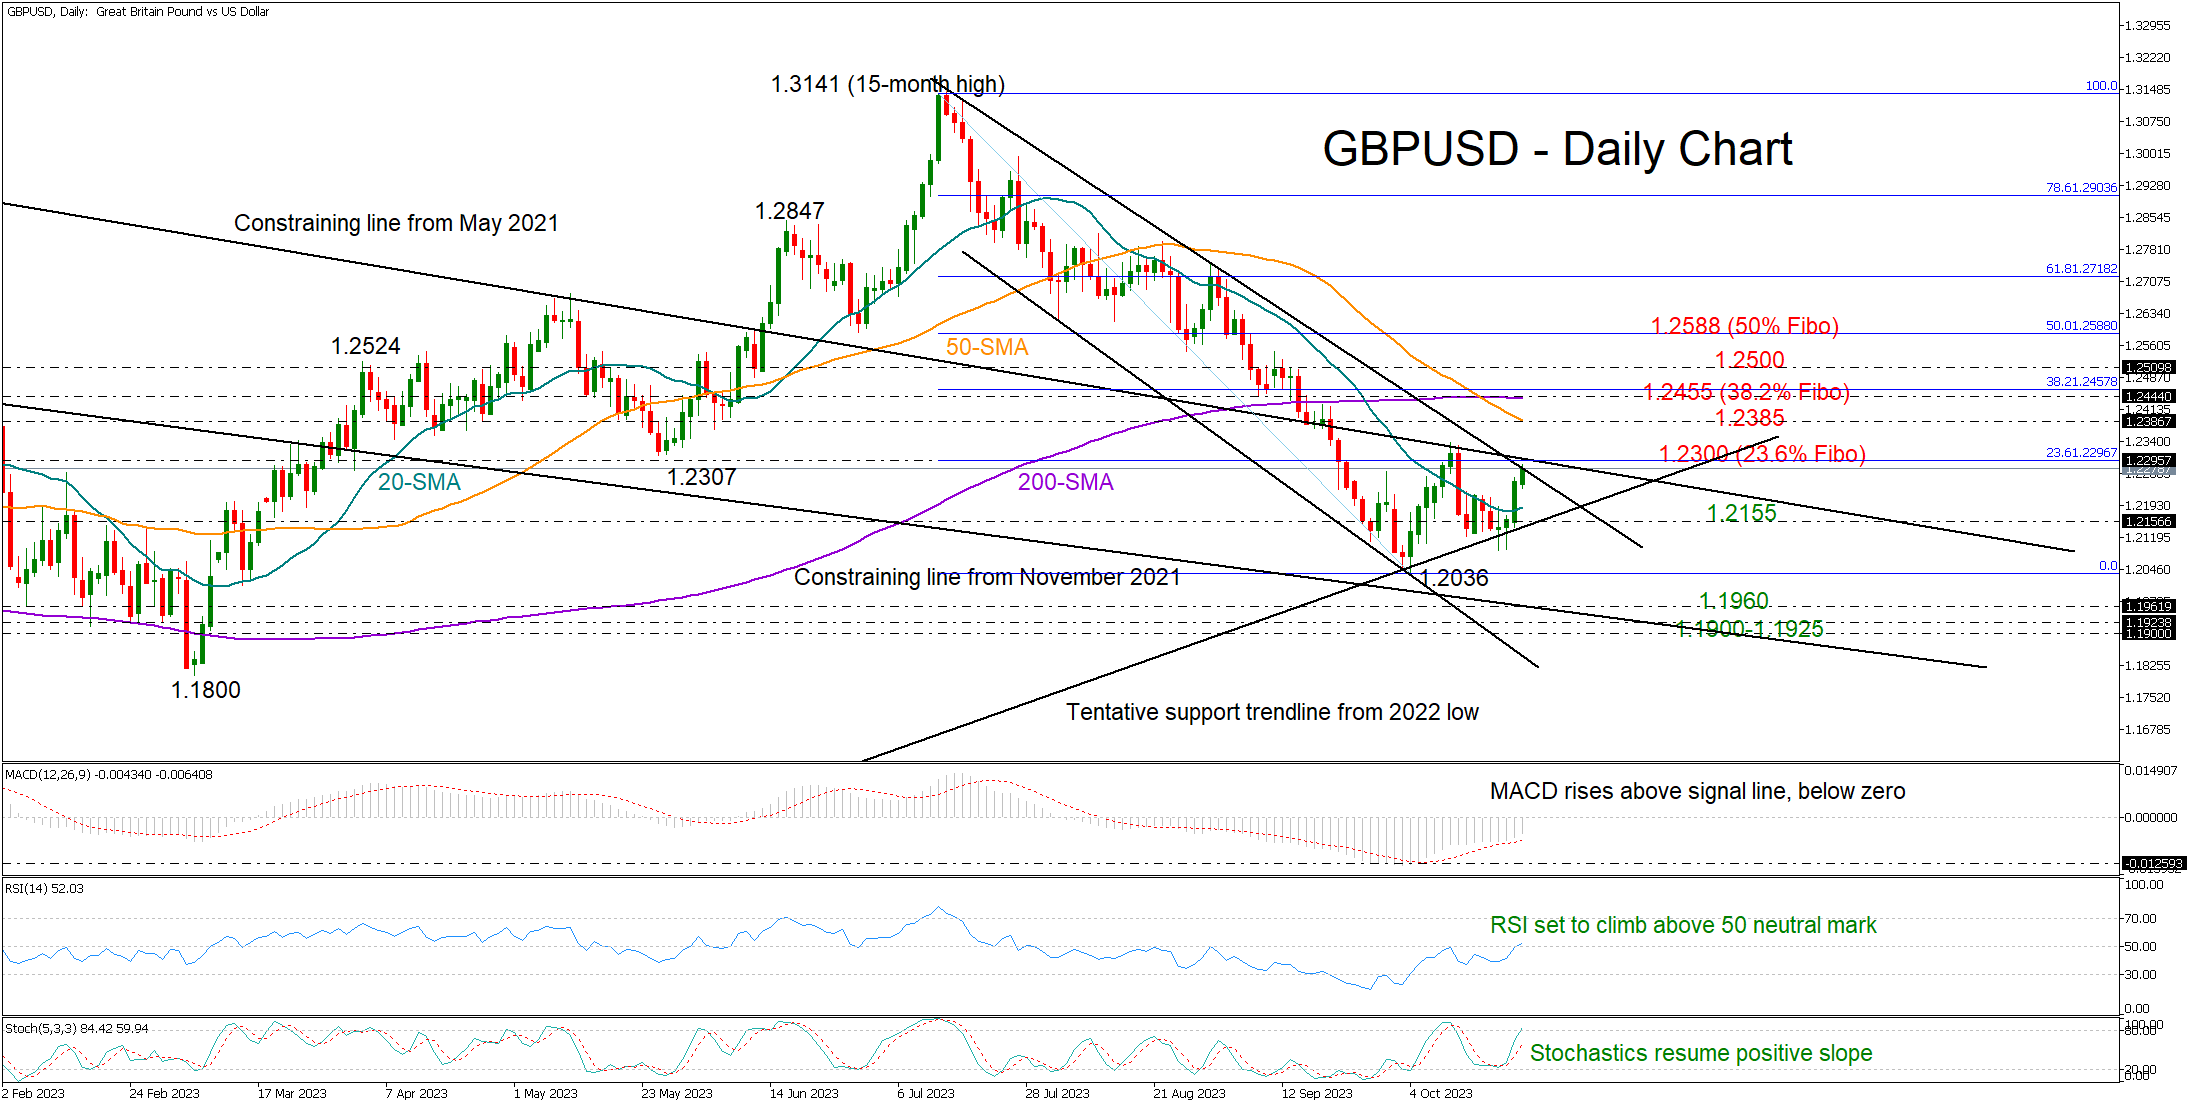
GBPUSD enjoyed a whopping start to the week, marking one of its strongest days since mid-July to rise as high as 1.2257 on Monday.
The technical outlook is looking promising at the moment. The pair confirmed a bullish doji candlestick pattern near last week’s low of 1.2089 and around the support trendline drawn from the 2022 low, suggesting more positive sessions ahead. The technical indicators align with this scenario too, with the RSI entering the bullish area above 50 and the MACD recovering above its red signal line. Likewise, the stochastic oscillator has resumed its positive slope.
The upper band of the bearish channel is being examined at 1.2278, while the 23.6% Fibonacci retracement is within a breathing distance at 1.2300. The long-term falling constraining line from May 2021 could also keep the bulls busy in the same neighborhood.
Another extension higher could take a halt within the 1.2385-1.2455 area, where the 50- and 200-day simple moving averages (SMAs), and the 38.2% Fibonacci level are all located. A break above that border could brighten the short-term outlook, especially if the 1.2500 round level proves easy to pierce through. Then, the spotlight would immediately turn to the 61.8% Fibonacci of 1.2588.
In the event of a bearish correction, the 2022 ascending trendline could again come to the rescue at 1.2155. If not, the bears will attempt to reach October’s low of 1.2036, a break of which could direct the pair towards the descending line from November 2021 at 1.1960. The 1.1900-1.1925 region could be the next target.
All in all, there are encouraging signals in the GBPUSD market, with the focus turning now to the 1.2278-1.2300 zone. A step above that border could add extra fuel to the bullish wave.
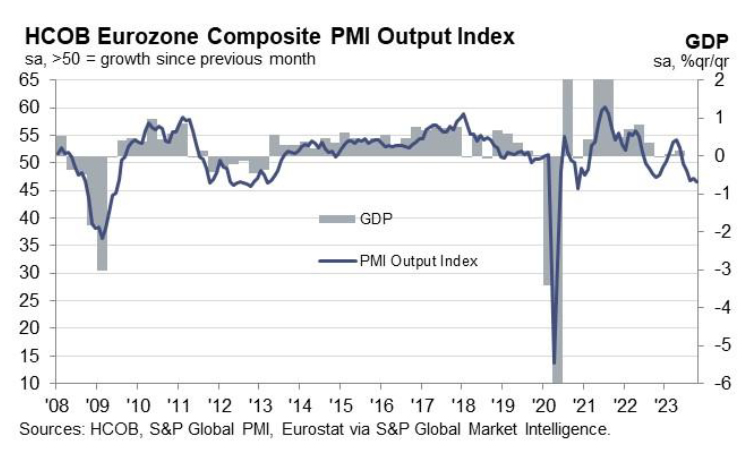
Eurozone PMI composite fell to 35-month low, moving from bad to worse
Eurozone economy appears to be on shaky ground, with the latest PMI figures showing continued deterioration. October saw Manufacturing PMI slide to 43.0 from 43.4, while Services PMI dropped to a concerning 32-month low of 47.8, down from 48.7. Composite PMI wasn't left behind, recording a 35-month low at 46.5, down from 47.2.
Cyrus de la Rubia, Chief Economist at Hamburg Commercial Bank, stated, "In the Eurozone, things are moving from bad to worse." He highlighted that manufacturing has been grappling with a slump for over a year now. When examining the top Eurozone players, France and Germany, de la Rubia noted that their manufacturing downturns are almost on par.
However, it's not all gloom for France in the services sector. Despite a lower activity index compared to Germany, France showcases some resilience with new businesses not declining as rapidly. Moreover, companies in France are steadily adding jobs rather than eliminating them.
Another noteworthy aspect is the persistent price increases within the services sector. Comparing it to prior economic downturns, inflation for both input prices and prices charged has only marginally slowed down. This trend might be challenging for ECB. As de la Rubia points out, "these figures reinforce the case of a pause in the interest rate cycle instead of thinking aloud about loosening monetary policy."
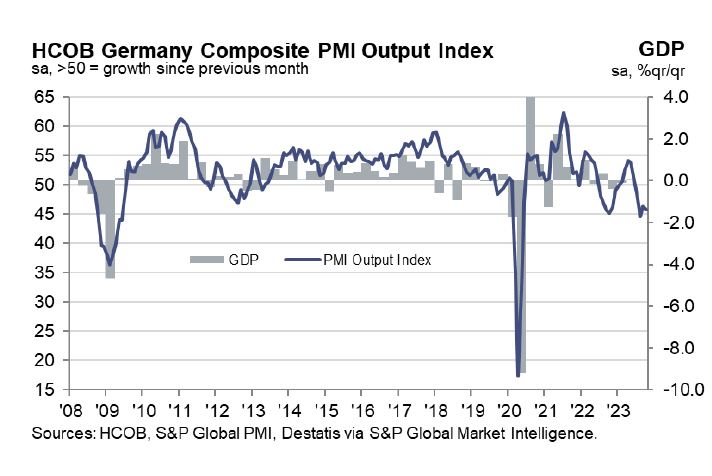
Germany’s PMI composite fell to 45.8, suggests -0.4% GDP contraction in Q4
Germany PMI Manufacturing rose from 39.6 to 40.7 in October, a 5-month high. PMI Services fell from 50.3 to 48.0. PMI Composite fell from 46.4 to 45.8.
Cyrus de la Rubia, Chief Economist at Hamburg Commercial Bank, said:
"With the HCOB PMI indices baked into our GDP nowcast, we are calculating a -0.4 percent slip in GDP this quarter, after an estimated -0.8 percent slide the quarter before. If these nowcasts hit the mark, this would result in a -0.8 percent overall growth rate for 2023. This would make the German government's -0.4 percent shrinkage call seem pretty rosy.
"The PMI results show that the downturn is broad based. Manufacturing output continues to fall at a steep rate and activity in the services sector, which grew last month, swung into the red again.
"Input prices in the German services sector are continuing to rise at an unusual high rate. Increased energy prices and high wage pressures are most likely at the core of this development. Firms are still managing to roll some of those inflated costs onto the customer's tab, and October did not see much change in that. Thus, there is no reason to pull the plug on inflation concerns."
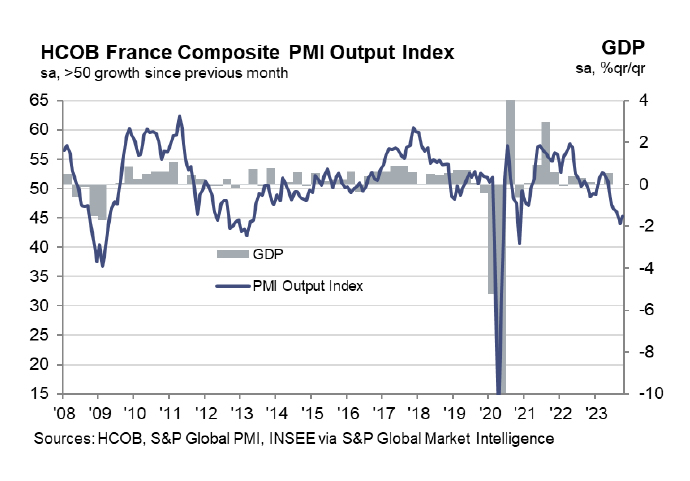
France PMI manufacturing fell to 41-mth low, services stay in contraction
France PMI Manufacturing fell from 44.2 to 42.6 in October, hitting a 41-month low. PMI Services improved from 44.4 to 46.1, a 3-month high. PMI Composite rose from 44.1 to 45.3, a 2-month high.
Norman Liebke, Economist at Hamburg Commercial Bank, said: "The French economy is still feeling the heat at the start of the fourth quarter... Our GDP nowcast model, with PMI figures in the mix along with a bunch of other indicators, is pointing to fractional growth in the fourth quarter.
"The services sector is hitting roadblocks... Things are going south in the manufacturing sector, and there is no relief in sight... Price indices are in perilous territory.... Higher inflation rates would put the European Central Bank into a difficult position as it more or less signalled at its last meeting that no further rate hikes will be carried out."
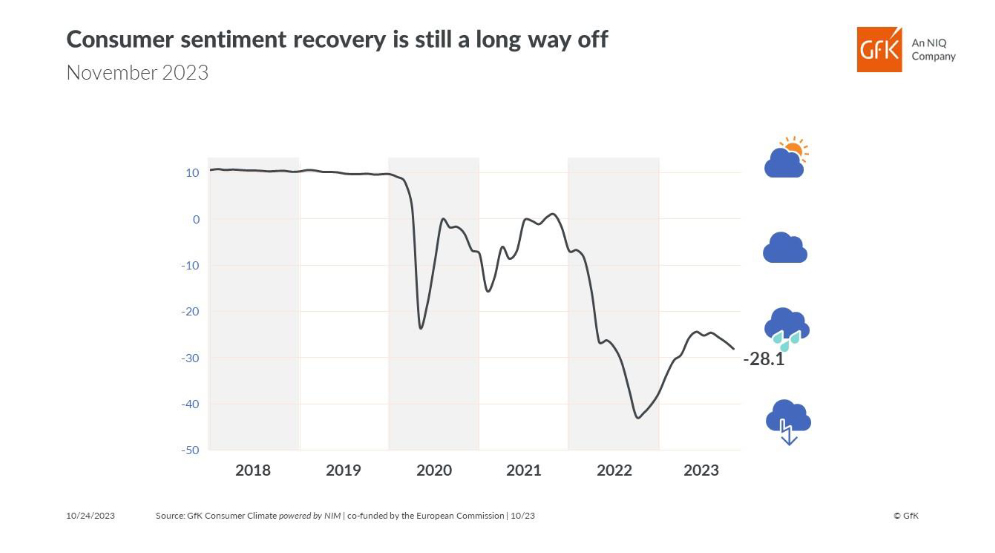
Germany’s Gfk consumer sentiment fell to -28.1, hope of recovery this year laid to rest
Germany's Gfk consumer sentiment for November fell from -26.7 to -28.1. In October, economic expectations improved slightly from -3.4 to -2.4. Income expectations fell form -11.3 to -15.3. Propensity to buy ticked up from -16.4 to -16.3. Propensity to save rose from 8.0 to 8.5.
"With the third decline in a row, hopes of a recovery in consumer sentiment this year must finally be laid to rest," explains Rolf Bürkl, consumer expert at NIM.
"Above all, high prices for food are weakening the purchasing power of private households in Germany, so private consumption will not be able to support the economy this year."
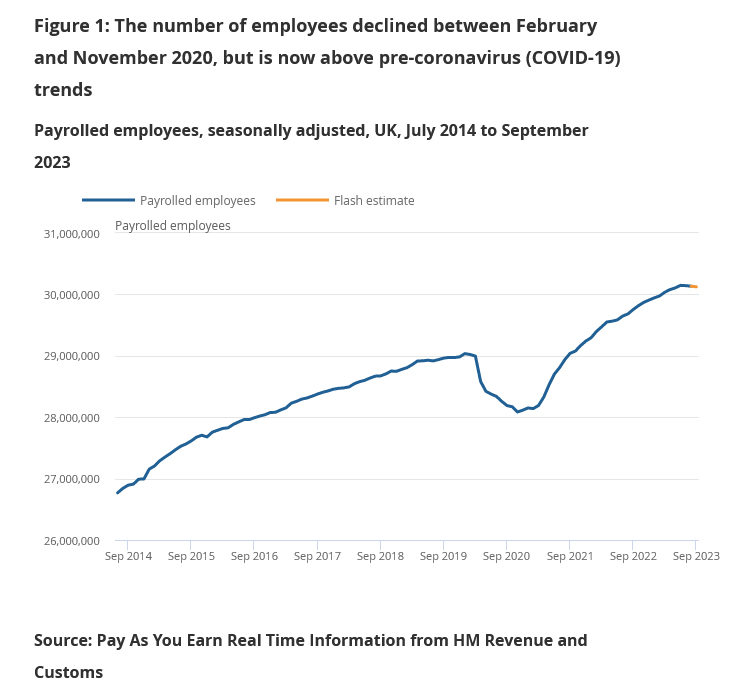
UK payrolled employment fell -11k in Sep, pay growth slowed to 5.7% yoy
In September, UK payrolled employment fell -11k. Median monthly pay rose 5.7% yoy, slowed notably from August's 7.7% yoy. Annual growth in median pay was highest in the transportation and storage sector, with an increase of 13.5%, and lowest in the health and social work sector, with a decrease of -0.3%.
In the three months to August, unemployment rate fell from 4.3% to 4.2%, below expectation of 4.3%.
Cryptocurrency Market Capitalization Sets Year’s High
Amid the frenzy over expectations that the SEC will approve applications for spot bitcoin ETFs, the cryptocurrency market capitalization reached USD 1.25 trillion this morning, for the first time in 2023. Expectations have increased following reports that the US Securities and Exchange Commission will not appeal a court ruling that the rejection of Grayscale Investments' ETF application was improper.
It is important to understand that an ETF is a financial instrument that will allow a wide range of people to easily officially invest in bitcoin without opening an account on a crypto exchange, which can be associated with difficulties and dangers.
Although there has been no official announcement yet, the news background is extremely positive:
→ Blackrock is rumoured to have informed the SEC that it will begin buying BTC for its BTC ETF;
→ Blackrock spot BTC ETF has appeared on the lists of clearing house DTCC with the ticker IBTC.
The growth leader, of course, is bitcoin. Its price reached USD 35k this morning — for the first time since May 2022. Following this, other assets also perked up – in particular, Ethereum, the second most important cryptocurrency, rose above USD 1,800.
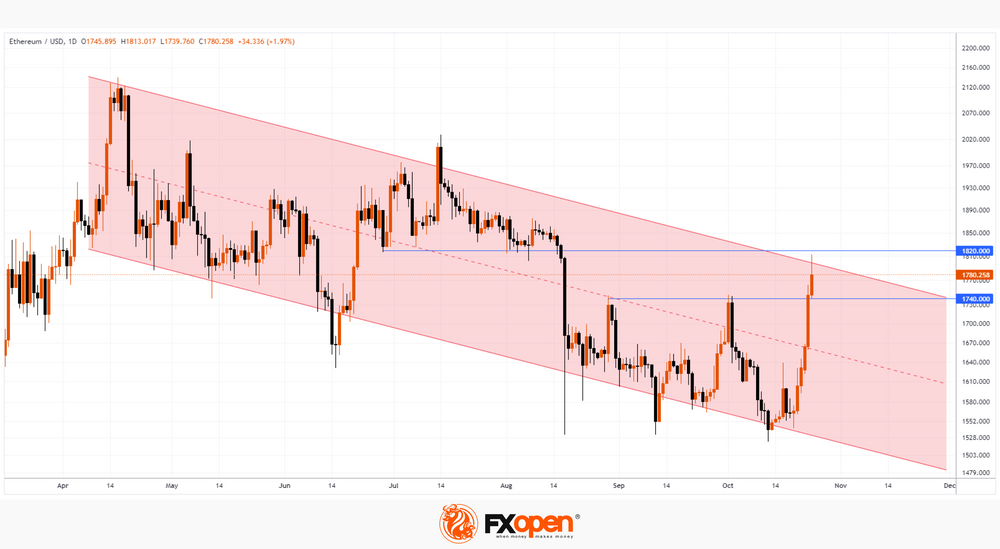
The chart shows that ETH/USD:
→ the ETH price is near the upper limit of the downward channel that has been in effect since May of this year;
→ level 1,820 may provide resistance;
→ the price of ETH has exceeded the level of 1,740, which can now provide support.
It is worth noting that when (and if) the application for a bitcoin ETF is officially approved, the price of the coin may even weaken, since the market looks overbought and is already taking into account the effect of what will happen. However, BTC could be followed by a rush for Ethereum ETFs.
This article represents the opinion of the Companies operating under the FXOpen brand only. It is not to be construed as an offer, solicitation, or recommendation with respect to products and services provided by the Companies operating under the FXOpen brand, nor is it to be considered financial advice.
USD/JPY Bullish Momentum Seems to be Fading
- USD/JPY’s current year-to-date outperformance has started to dissipate based on a shorter-term one-month rolling basis.
- A disappointing Japan Services PMI (flash) for October has failed to ignite an intraday bullish movement in USD/JPY.
- Three main factors that are likely to be the cause; intervention risk, inter-market expectations, and momentum.
- Watch the key 20-day moving average on the USD/JPY, now acting as support at 149.30.
The major uptrend phase of the USD/JPY in place since mid-January 2023 seems to be losing its bullish inertia even though it has recorded a year-to-date gain of +14.16% as of 24 October at this time of the writing, the best US dollar major pair ahead of the USD/CAD (+0.72%), USD/EUR (-0.15%), USDGBP (-1.78%), and USD/CHF (-3.78%).
On a shorter horizon based on the one-month rolling performances of the major US dollar pairs as of 24 October 2023, the bullish momentum of the USD/JPY has started to dissipate from a peak of +1.16% to a current gain of +0.90% (see figure 1).
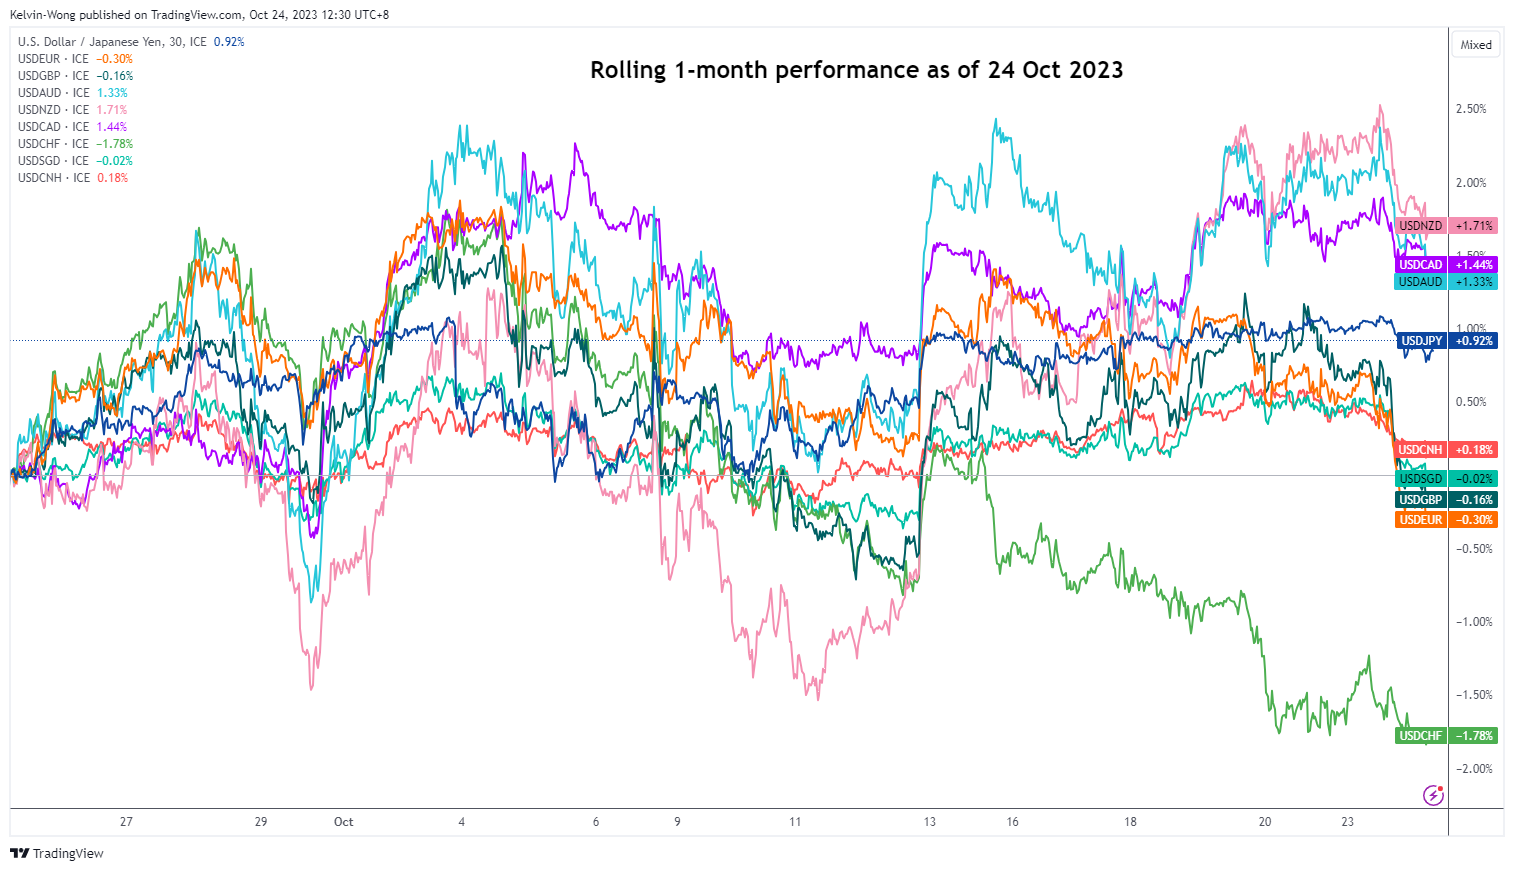
Fig 1: US dollar major pairs rolling 1-month performances as of 24 Oct 2023 (Source: TradingView, click to enlarge chart)
A disappointing Services PMI has failed to ignite a rally in USD/JPY
Also, today’s weak Japan’s flash Services PMI print for October came in below expectations (51.1 versus 52.9 forecasted & 53.8 in September) where the growth in the services sector slowed to a ten-month low has failed to ignite a short-term intraday bullish movement in the USD/JPY.
In the past, disappointing key economic data in Japan tended to lead to a bid in USD/JPY as market participants upped the expectations of the Bank of Japan (BoJ) to delay monetary policy normalization away from short-term negative interest rates which in turn maintained the policy divergence status quo between the BoJ and US Federal Reserve as well as the rest of the world’s central banks that have pivoted away from either zero or negative interest rates since 2022.
What is causing the lack of bullish enthusiasm in USD/JPY?
There are three possible factors; intervention risk from policymakers, inter-market expectations, and momentum.
Firstly, verbal interventions in the past two months by Japan’s Ministry of Finance (MoF) officials have been drummed up as the JPY weakened considerably against the US dollar due to robust key US economic data that increased the odds of the Fed’s current stance of keeping US interest rates at a higher level for a longer period.
Also, MoF’s verbal intervention is likely to have morphed into a recent real intervention in the foreign exchange market to halt the pace of JPY weakness on 3 October where the USD/JPY printed an intraday high of 150.16 during the start of the US session before it tumbled significantly by -282 pips to hit an intraday low of 147.34 within a short span of just five minutes even though there was no official intervention confirmation by MoF officials.
Therefore, in the minds of market participants, the USD/JPY’s psychological level of 150 has subconsciously become the “line in the sand” that increases the risk of FX intervention when the movement of the USD/JPY probed close to around 150.
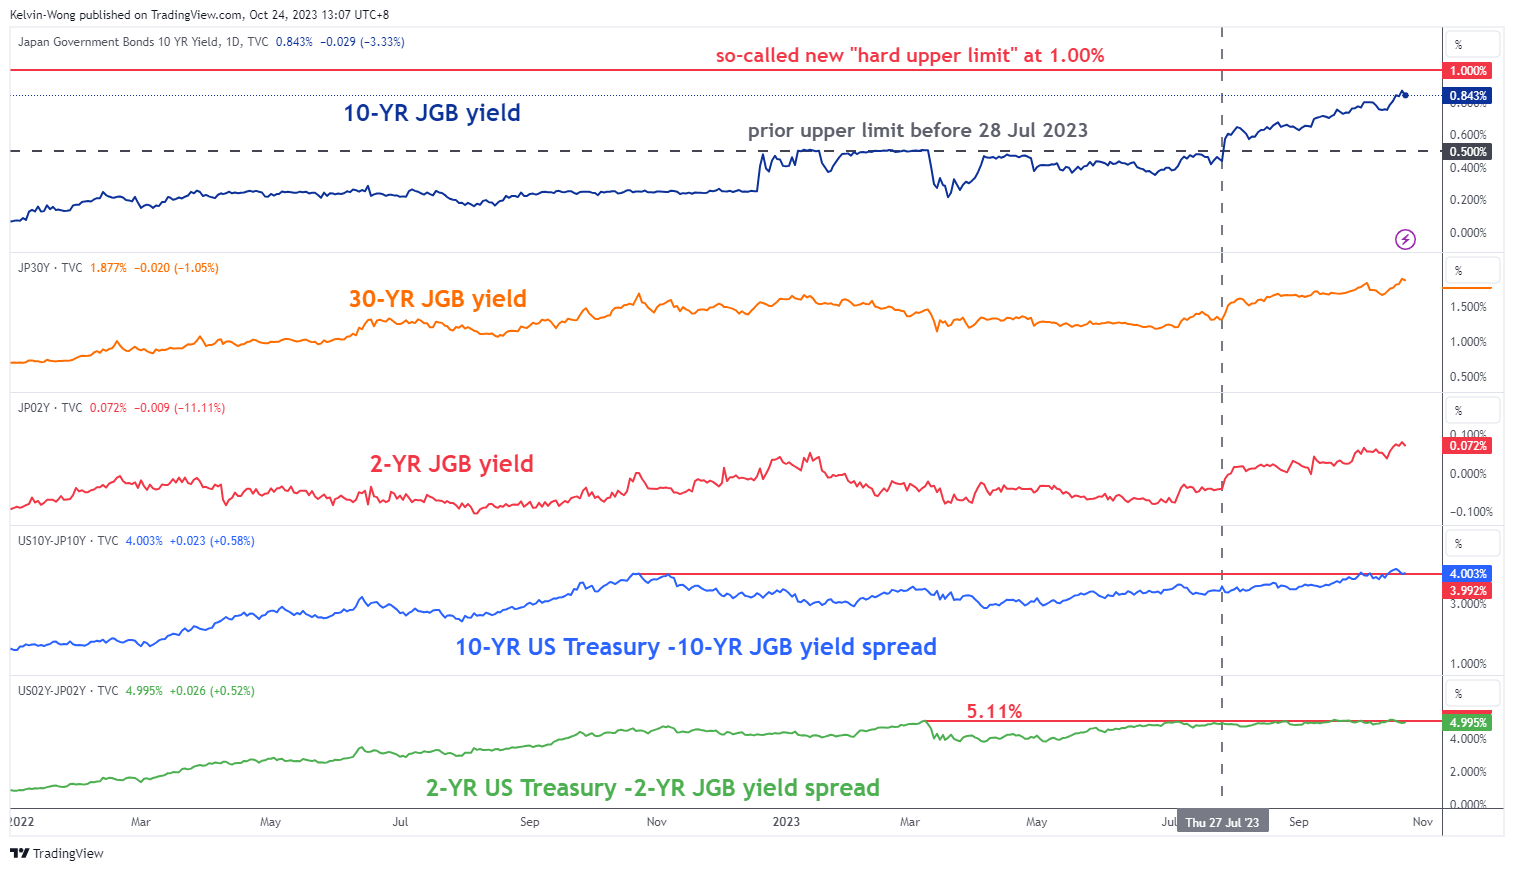
Fig 2: JGB yields & yield spread with US Treasuries as of 24 Oct 2023 (Source: TradingView, click to enlarge chart)
Secondly, the shorter-term 2-year yield spread premium of the US Treasury not over the Japanese government bonds (JGB) has started to narrow since 28 July after the implementation of “flexible yield curve control” on the 10-year JGB yield by BoJ. Also, it has failed to break above its current year-to-date peak of 5.11% printed in March 2023 (see figure 2).
The 2-year sovereign yield tends to be more sensitive to a central bank’s monetary policy and the 2-year JGB yield has jumped significantly from -0.04% to 0.07% at this time of the writing due to increasing expectations that BoJ is likely to scrap its short-term negative interest rates policy by the first half of 2024.
In addition, recent data from Japan’s overnight index swap curve has indicated a 20% chance that BoJ will end negative interest rates in December 2023, and the probability rises to 100% by April 2024.
Thirdly, the medium-term bullish momentum of the USD/JPY as indicated by the daily RSI indicator has flashed a bearish divergence condition just below a medium-term resistance of 150.30 (see figure 3).
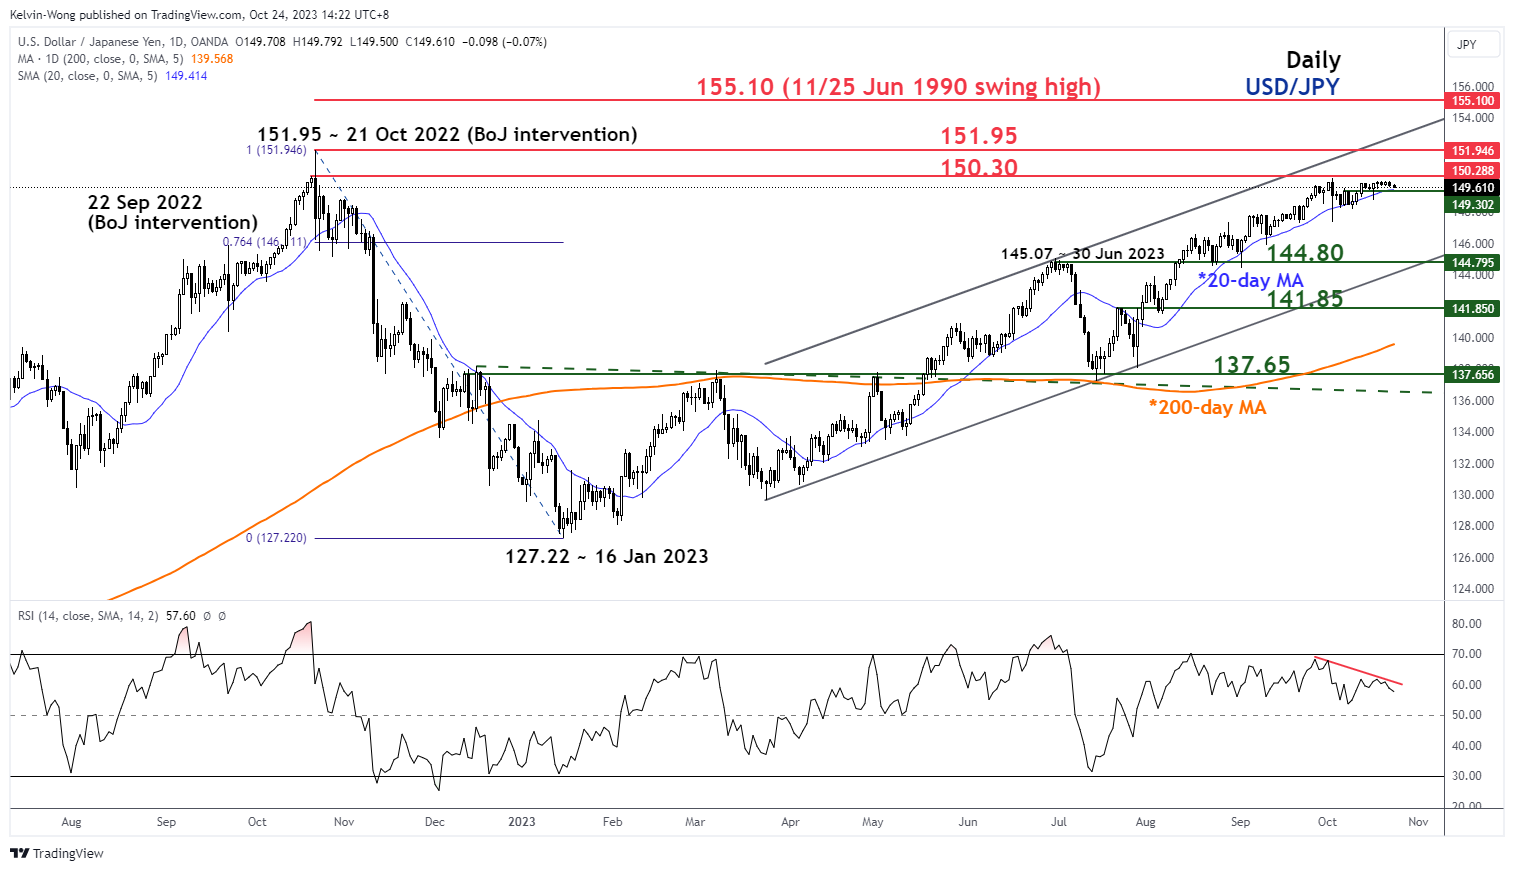
Fig 3: US/JPY medium-term & major trends as of 24 Oct 2023 (Source: TradingView, click to enlarge chart)
This technical observation suggests an easing of bullish momentum. A clear break with a daily close below the key 20-day moving average (price actions have traded above it since 31 July 2023) now acting as support at 149.30 increases the odds of a potential multi-week bearish reversal towards the medium-term support at 144.80.
Short Term Consolidation Might be in the Cards
Markets
“We covered our bond short”. A tweet by the founder of Pershing Square Capital Management on X succeeded in doing what geopolitics, economic data, Fed speak and technical factors recently failed to do: trigger a correction higher in US Treasuries/core bond markets. It’s telling about markets in general that Bill Ackman squaring his position in 30-yr Bonds can trigger such an (algo-driven?) response. An empty eco calendar and thin trading made way for the (outsized) reaction. A late swoon in oil prices (Brent crude from $92/b to $89.5/b) added to the momentum. Still, it remains to be seen how lasting such market reactions are though. Daily yield changes on the US yield curve ranged between 2.5 bps (2-yr) and 8.5 bps (20-yr). German Bunds followed the move to a lesser extent with intraday differences between +1 bp and -2.6 bps (30-yr). Greek GGB’s and Italian BTP’s outperformed following weekend decisions by rating agency S&P. Greek bonds were granted back their first investment grade rating amongst big three rating agencies while Italy avoided a rating and even an outlook downgrade (BBB; stable outlook). 10-yr yield spreads vs Germany narrowed by 7 bps for the both of them.
US stock markets opened around 1% lower, erasing these losses within the first half hour as long term bond yields plunged. Weakness into the close suggest little potential in the equity rebound with only Nasdaq ending with small gains. From a technical point of view, the S&P 500 set a new sell-off low and closed below the 200d mavg. In FX space, the dollar fainted. EUR/USD had already regained the 1.06 big figure with the upleg accelerating after taking out first minor resistance (October high at 1.0640). The pair eventually closed at 1.0670, leaving the downward trend channel in place since mid-July and turning the technical picture more neutral short term. 38% retracement on the downmove since mid-July stands at 1.0766.
Today’s eco calendar contains global PMI’s. After yesterday’s correction, it will be interesting to see whether markets take weaker or close to consensus data as a reason to do some more short covering ahead of ECB (Thursday) and Fed (next week) policy meetings. We hold our view that short term consolidation might be in the cards, but that medium-to-long term underlying market sentiment remains bearish for bonds. For the US 10-yr yield, the October correction low around 4.5% in the reference.
News and views
Czech National Bank board member Prochazka said investors are overestimating the pace and amount of potential monetary easing to come. In the interview published yesterday, he added that the central bank would proceed cautiously when lowering rates because underlying price pressures are still strong. At the time of his comments Prochazka said markets were anticipating the CNB to cut twice this year and a policy rate of 3.5% by end next year compared to the 7% today. CNB governor Michl did say several times they have a strategy for monetary easing in place. KBC Economics expects the policy rate to be cut by 50 bps in total by end this year with a bias towards going in two 25 bps steps (November & December).
Japanese PMIs declined further in October. The composite reading fell from 52.1 to 49.9, the first sub 50 reading since December last year. Manufacturing stabilized at 48.5 where a smaller decline in new orders compensated for a stronger drop in actual output while lower capacity pressures led to employment falling for the first time since February 2021. The drag on the composite figure thus came exclusively on the account of the services sector. Activity there is still growing but at the slowest pace YtD (51.1 from 53.8). New business rose at a weaker rate while foreign demand declined for the first time in 14 months. But optimism about the future as well as indications of staff shortages led to a solid increase in employment. The latter should be welcomed by the Bank of Japan, who is looking for sustained wage increases to support inflation durably. Price pressures in the sector remain elevated, the survey noted, but both input costs and charges rose at slower rates in October. The Japanese yen reacted stoic to the release. USD/JPY trades slightly lower at 149.69 though this follows general dollar weakness.