

Sample Category Title
British Pounds Shrugs as CPI Remains Steady
- UK CPI unchanged, core CPI ticks lower
- US retail sales hotter than expected
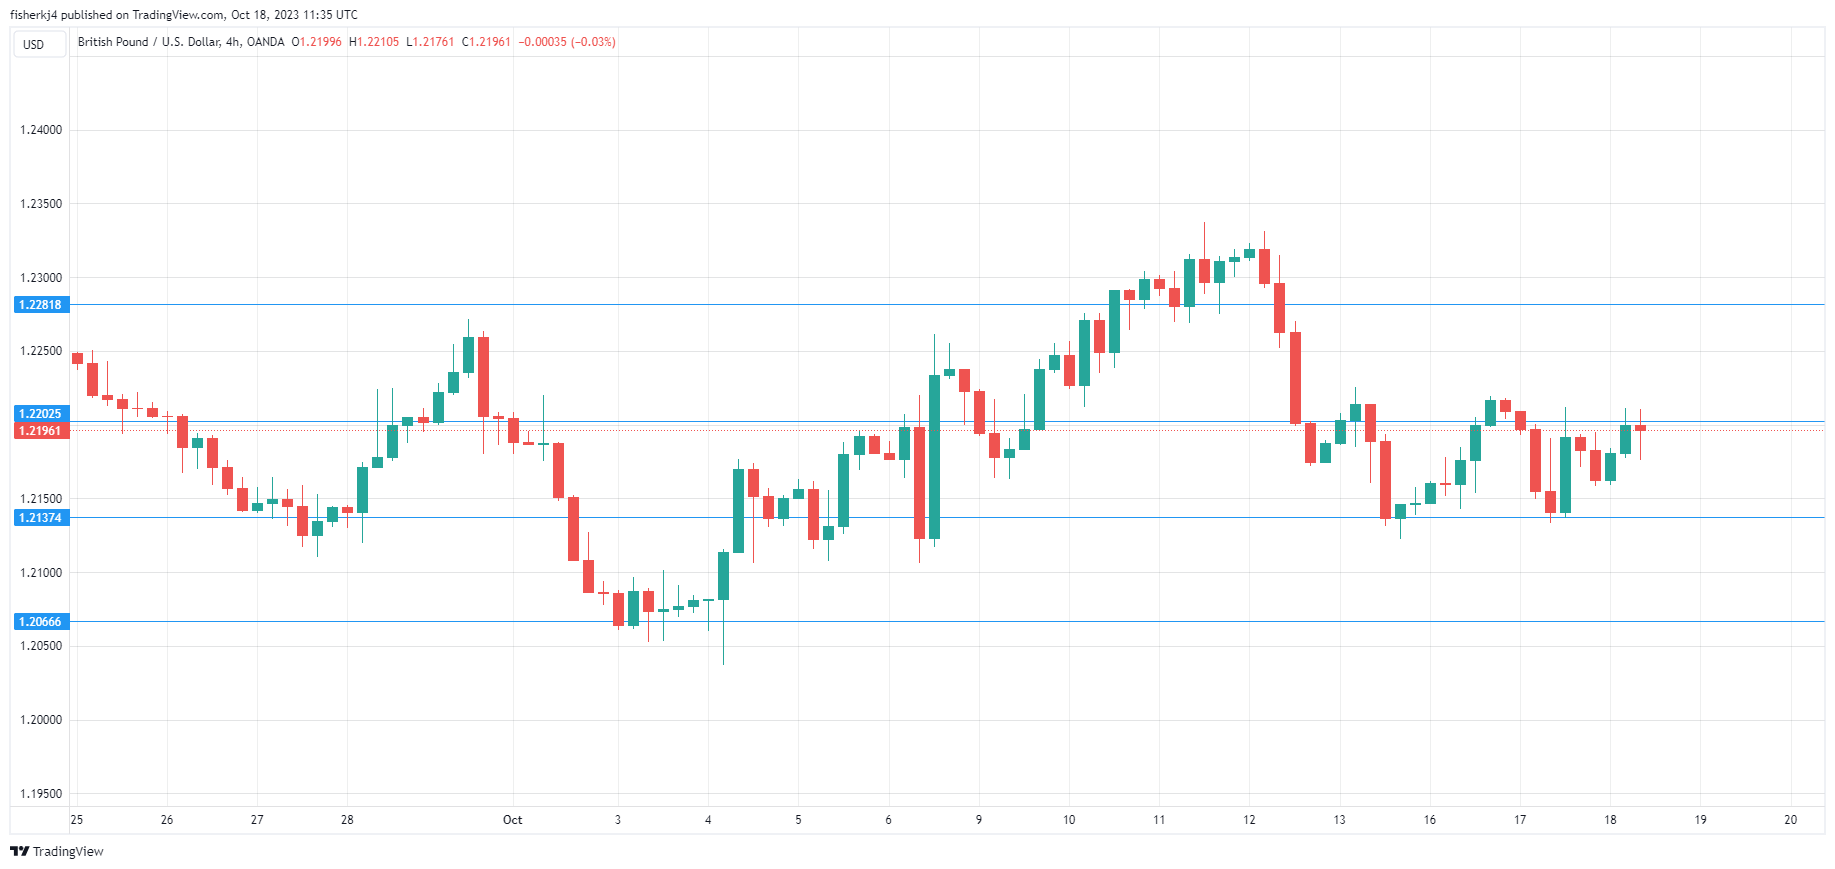
The British pound is showing limited movement on Wednesday. In the European session, GBP/USD is trading at 1.2194, down 0.09%.
UK CPI unchanged, core CPI ticks lower
Today’s UK inflation report showed little change from a month ago, a reminder that the battle to curb inflation will be a long one. Headline CPI was unchanged in September at 6.7%, remaining at its lowest level in 18 months, but above the market estimate of 6.6%. Month-to-month, headline CPI rose 0.5%, up from 0.3% in August. A sharp rise in gasoline prices was the main driver of September inflation, which was partially offset by a decline in food prices.
Core CPI, which is closely watched by the Bank of England, dropped in September from 6.2% y/y to 6.1%. However, the core rate jumped to 0.5% m/m, up sharply from 0.1% in August, matching the market estimate. The upswing points to core inflation remaining sticky, but the future markets are widely expecting the BoE to pause for a second straight month, after 14 consecutive rate hikes. Today’s inflation report is unlikely to shed much light on what the BoE will do at the November 2nd meeting, and Governor Bailey said on Monday that like the September meeting, upcoming rate decisions would be close calls.
US retail sales jump in September
US retail sales in September were hotter than expected, a sign that consumer spending remains robust despite the challenging economic picture. Retail sales are not adjusted for inflation, which means that consumers have managed to keep up with price increases. Consumer spending has been strong in the third quarter, which should translate into a solid GDP reading next week. It also provides support for the Fed to keep interest rates at elevated levels – Fed rate odds for a December hike have risen to 34%, up from 30% prior to the release.
GBP/USD Technical
- GBP/USD is testing resistance at 1.2202. Next, there is resistance at 1.2281
- There is support at 1.2137 and 1.2066
EURJPY Attempts Breakout Above Cloud But Tough Resistance at 158.60
- EURJPY turns more bullish after rising above 50-day SMA and cloud
- But 158.60 level proving to be a more difficult obstacle
- Bigger picture remains neutral
EURJPY has gained some positive traction in recent days after clearing both the 50-day simple moving average (SMA) as well as the top of the Ichimoku cloud. However, the bulls can only claim partial victory because there is a high risk of a pullback if the pair is unable to break above the 158.60 hurdle, which is hindering a more convincing breakout above the cloud.
The momentum indicators are pointing to a continuation of the bullish bias in the near term. But whereas the fast and slow stochastics are positively aligned and rising, the RSI appears to have flatlined slightly above 50, questioning whether the current upside momentum will be strong enough to drive further gains.
Should the bulls manage to push the price above the 158.60 barrier, the next target will be the August top of 159.75, which was a 15-year high. A successful climb above the 160.00 zone would likely turn attention to the 165.00 area, which last acted as resistance all the way back in 2008. This was also when the pair came just shy of the next crucial level of 170.00.
On the other hand, if EURJPY fails to overcome the immediate resistance of 158.60, a downside reversal would probably follow, with initial support coming from the 50-day SMA at 157.90. A steeper slide would bring into scope the 100-day SMA, which is about to intersect the Kijun-sen line at 156.49, while lower down, the bottom of the cloud could halt the decline at 155.57.
In the medium term, however, the outlook remains neutral and only a sustained advance above the August peak of 159.75 would shift it to bullish. Otherwise, a drop below the cloud would not only turn the short-term picture to bearish, but it would undermine the neutral structure in the medium term as well as question the longer-term uptrend.

Bitcoin and Ethereum Go Their Separate Ways for Now
Market Picture
The crypto market has gained 0.4% over the past 24 hours. There was a fresh attempt to warm up the market with buying early Wednesday morning, but the market is avoiding acceleration in favour of a steadier rise. This is perhaps the most natural start to an uptrend, as many investors still see an opportunity to sell on the rise.
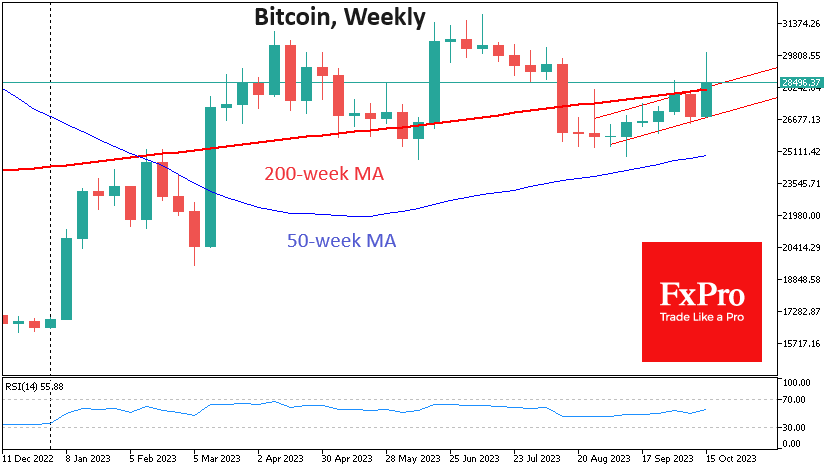
Bitcoin approached $29K again on Wednesday morning, enjoying increased demand after breaking above the 200-day moving average and the former resistance line of the ascending channel. There is now an active battle for the 200-week level, with consolidation above it at the end of the week likely to encourage further buying.
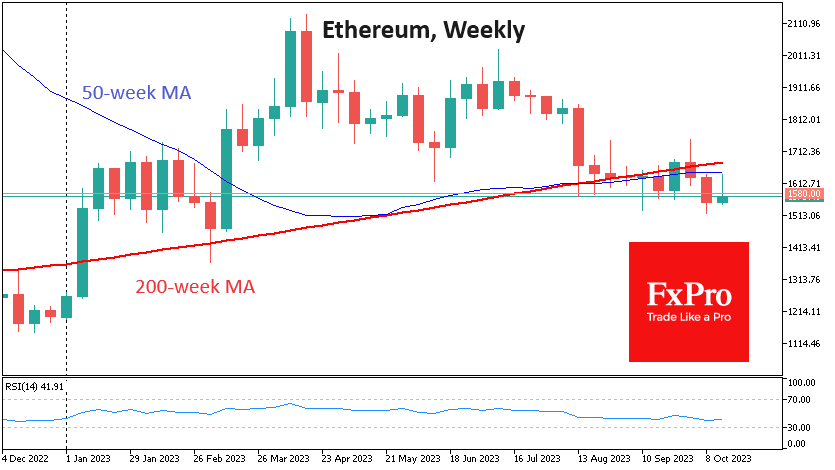
The picture in the altcoins is less optimistic. Ethereum has been making lower and lower local highs and lows for the past two weeks after coming under increased pressure following a consolidation below the 200-week average, with the 50-week average acting as local resistance. Should the pressure on the cryptocurrency intensify, the $1200 area appears to be the downside target for Ethereum.
News Background
As a result of another recalculation, the difficulty of mining the first cryptocurrency increased by 6.47%. The indicator hit a record high of 61.03 T. According to Glassnode, the smoothed 7-day moving average of the index peaked at 469.9 EH/s on 12 October.
Larry Fink, CEO of investment firm BlackRock, said that the recent rise in Bitcoin price was not related to rumours of approving a spot ETF. According to him, people tend to invest in safe assets in times of instability and geopolitical crises: government bonds and gold, to which he added the first cryptocurrency.
Ethereum’s validator queue has emptied for the first time since the Shanghai hardfork in April. This signals a stabilisation in demand for ETH stakes, according to a Coinbase report. “Validators reaching peak capacity” in recent months has reduced staking returns from over 5% to 3.5%.
FTX customers could receive $9.2 billion in claims payments by mid-2024 from the exchange undergoing bankruptcy proceedings, according to a plan approved by creditor representatives and the platform’s new management.
Online gaming platform Roblox, which has more than 200 million monthly active users, has partnered with cryptocurrency payment provider BitPay to integrate XRP as a payment method.
Binance.US no longer offers Federal Deposit Insurance Corporation (FDIC) insurance on deposits. This is according to a notice to customers seen by Decrypt.
WTI Oil: Oil Price Rises on Growing Supply Fears
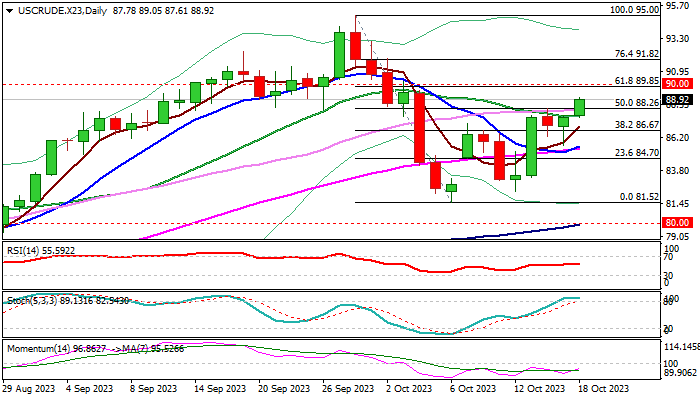
WTI oil price jumped almost 1.5% in Asian/early European session on Wednesday on renewed oil supply fears after a deadly blast at a Gaza hospital further raised tensions in the region.
Fresh advance resumes the rally from Oct 6 low ($81.52) after a two-day consolidation and generating bullish signal on break of pivotal barrier at$88.26 (daily Kijun-sen / 50% retracement of $95.00/$81.52 bear-leg).
Close above this barrier to reinforce near-term structure for acceleration towards next key resistances at $89.85/$90.00 (Fibo 61.8% / psychological).
However, mixed technical studies on daily chart continue to warn as 14-d momentum is in negative territory and stochastic is overbought, though rising daily Ichimoku cloud continues to underpin the action and MA’s turning to bullish configuration and partially offset negative signals.
Immediate bullish bias is expected to remain intact while supports at $88.26/$87.72 (Fibo 50%/20DMA) hold, but increased downside risk seen on potential break and close below broken Fibo 38.2% ($86.67).
Res: 89.05; 89.85; 90.00; 91.00.
Sup: 88.26; 87.72; 86.67; 85.59.
USDCHF Has Another Chance for Rebound
- USDCHF snaps key floor; short-term bias bearish
- Downside pressure could stay limited above 50-day SMA
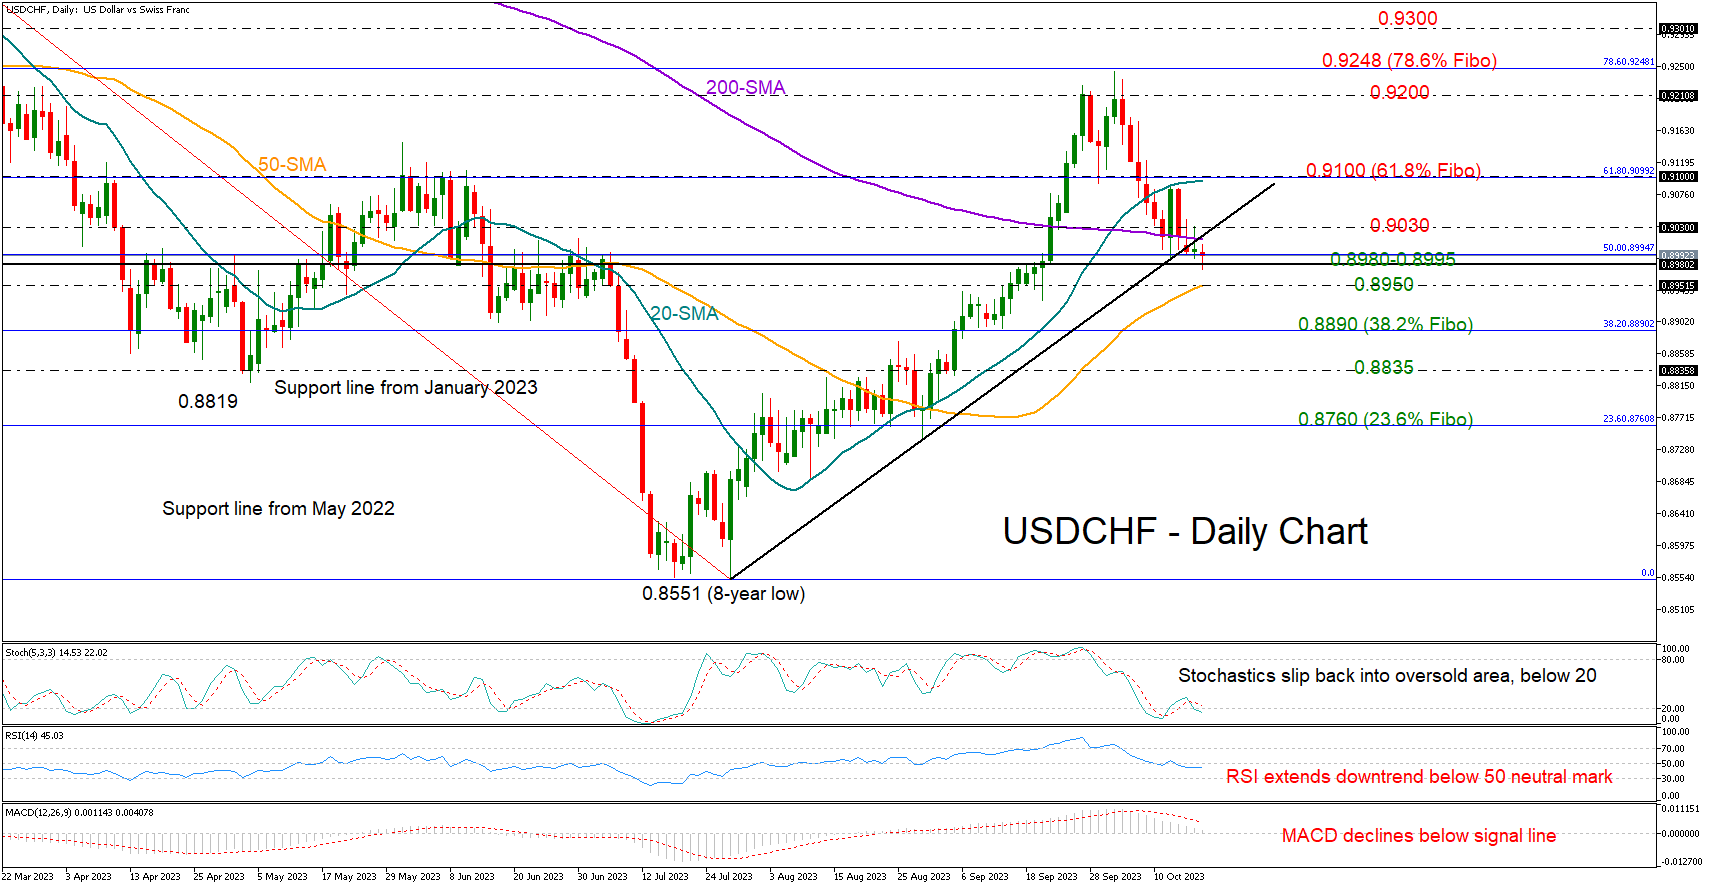
USDCHF is marking its third consecutive bearish week, having recently enhanced negative risks below the protective 200-day simple moving average (SMA) and the support trendline from July’s lows.
The 0.8980-.8995 restricted zone, which had been capping upside movements during April-July 2023, could switch into a support area, while the 50-day SMA at 0.8950 could provide the last opportunity for a rebound before a freefall towards the 0.8890 mark takes place. The 38.2% Fibonacci retracement of the 0.9437-0.8551 downtrend is also located there. Hence, a step lower could further dampen sentiment, likely pressing the price towards the 0.8835 barrier and then down to the 23.6% Fibonacci of 0.8760.
According to the technical indicators, the short-term bias is still on the bearish side, with the RSI extending its downtrend below its 50 neutral mark and the MACD losing ground below its red signal line. On the other hand, the stochastic oscillator has already entered the oversold area below 20, increasing speculation that selling interest could be short-lived.
Nevertheless, the pair may struggle to gain significant positive impetus until it returns above its 200-day SMA and more importantly above its 20-day SMA at 0.9100 (61.8% Fibonacci). If that scenario unveils, the pair could advance straight into the 0.9200-0.9248 ceiling. A successful penetration higher may stall near the 0.9300 round level, while higher, the focus will turn to the 2023 top of 0.9437.
All in all, USDCHF remains exposed to downside risks, likely facing its next bearish wave below the 50-day SMA at 0.8950.
XAU/USD: Deepening Crisis in Middle East Lifts Gold Price to One-Month High
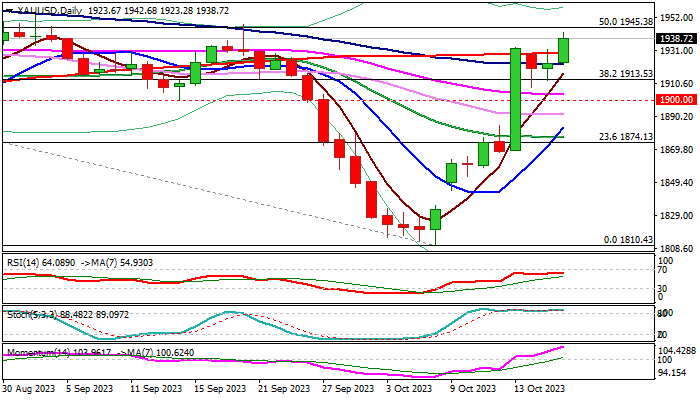
Gold rose to the highest in almost one month on Wednesday morning, signaling bullish continuation after larger rally paused for consolidation in past two days.
Overall environment remains favorable for safe haven bullion which advanced around $100 since the conflict in the Middle East started and shows signs for further gains as the situation is deteriorating.
The latest tragedy on deadly blast in Gaza hospital which took a hundreds of lives, adds to already overheated situation and threatening of further escalation of conflict, which continues to prompt traders into safety.
Steep uptrend from $1810 (Oct 6 low) is on track to fully retrace $1947/$1810 bear-leg and also retraced nearly 50% of larger downtrend from new record high at $2080 (May 4).
Daily close above broken 200DMA ($1929) is seen as minimum requirement to keep bulls intact for attack at pivotal $1945/52 zone (50% of $2080/$1810/Sep 1 spike high), break of which to unmask next targets at $1977/87 (Fibo 61.8%/July 20 top).
Overbought daily studies require caution, though near-term bias is expected to remain with bulls while the action holds above broken Fibo barrier at $1913 (38.2% of $2080/$1810).
Res: 1945; 1952; 1972; 1977.
Sup: 1929; 1922; 1913; 1908.
Eurozone CPI finalized at 4.3% yoy in Sep, core CPI at 4.5% yoy
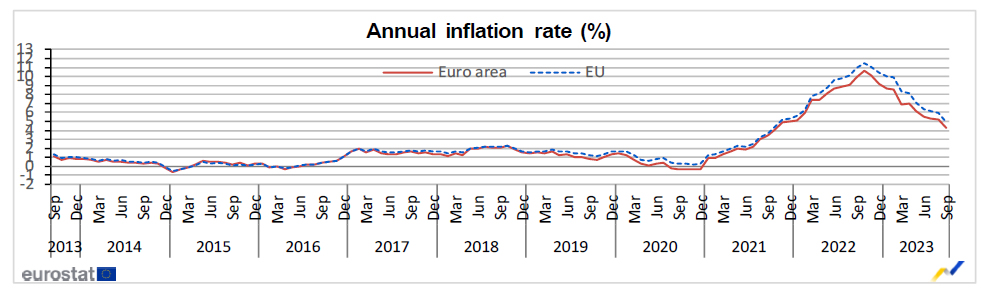
Eurozone CPI was finalized at 4.3% yoy in September, down from 5.2% yoy in August. Core CPI was finalized at 4.5% yoy, down from prior month's 5.3% yoy.
The highest contribution to the annual Eurozone inflation rate came from services (+2.05 percentage points, pp), followed by food, alcohol & tobacco (+1.78 pp), non-energy industrial goods (+1.06 pp) and energy (-0.55 pp).
EU CPI was finalized 4.9% yoy, down from August's 5.9% yoy. The lowest annual rates were registered in the Netherlands (-0.3%), Denmark (0.6%) and Belgium (0.7%). The highest annual rates were recorded in Hungary (12.2%), Romania (9.2%) and Slovakia (9.0%). Compared with August, annual inflation fell in twenty-one Member States, remained stable in one and rose in five.
USDJPY Bears Could Be Preparing for a Downleg
- USDJPY edges lower as market focuses on geopolitical events
- Quieter sessions lately but risk of intervention remains at large
- Momentum indicators continue to send mixed signals
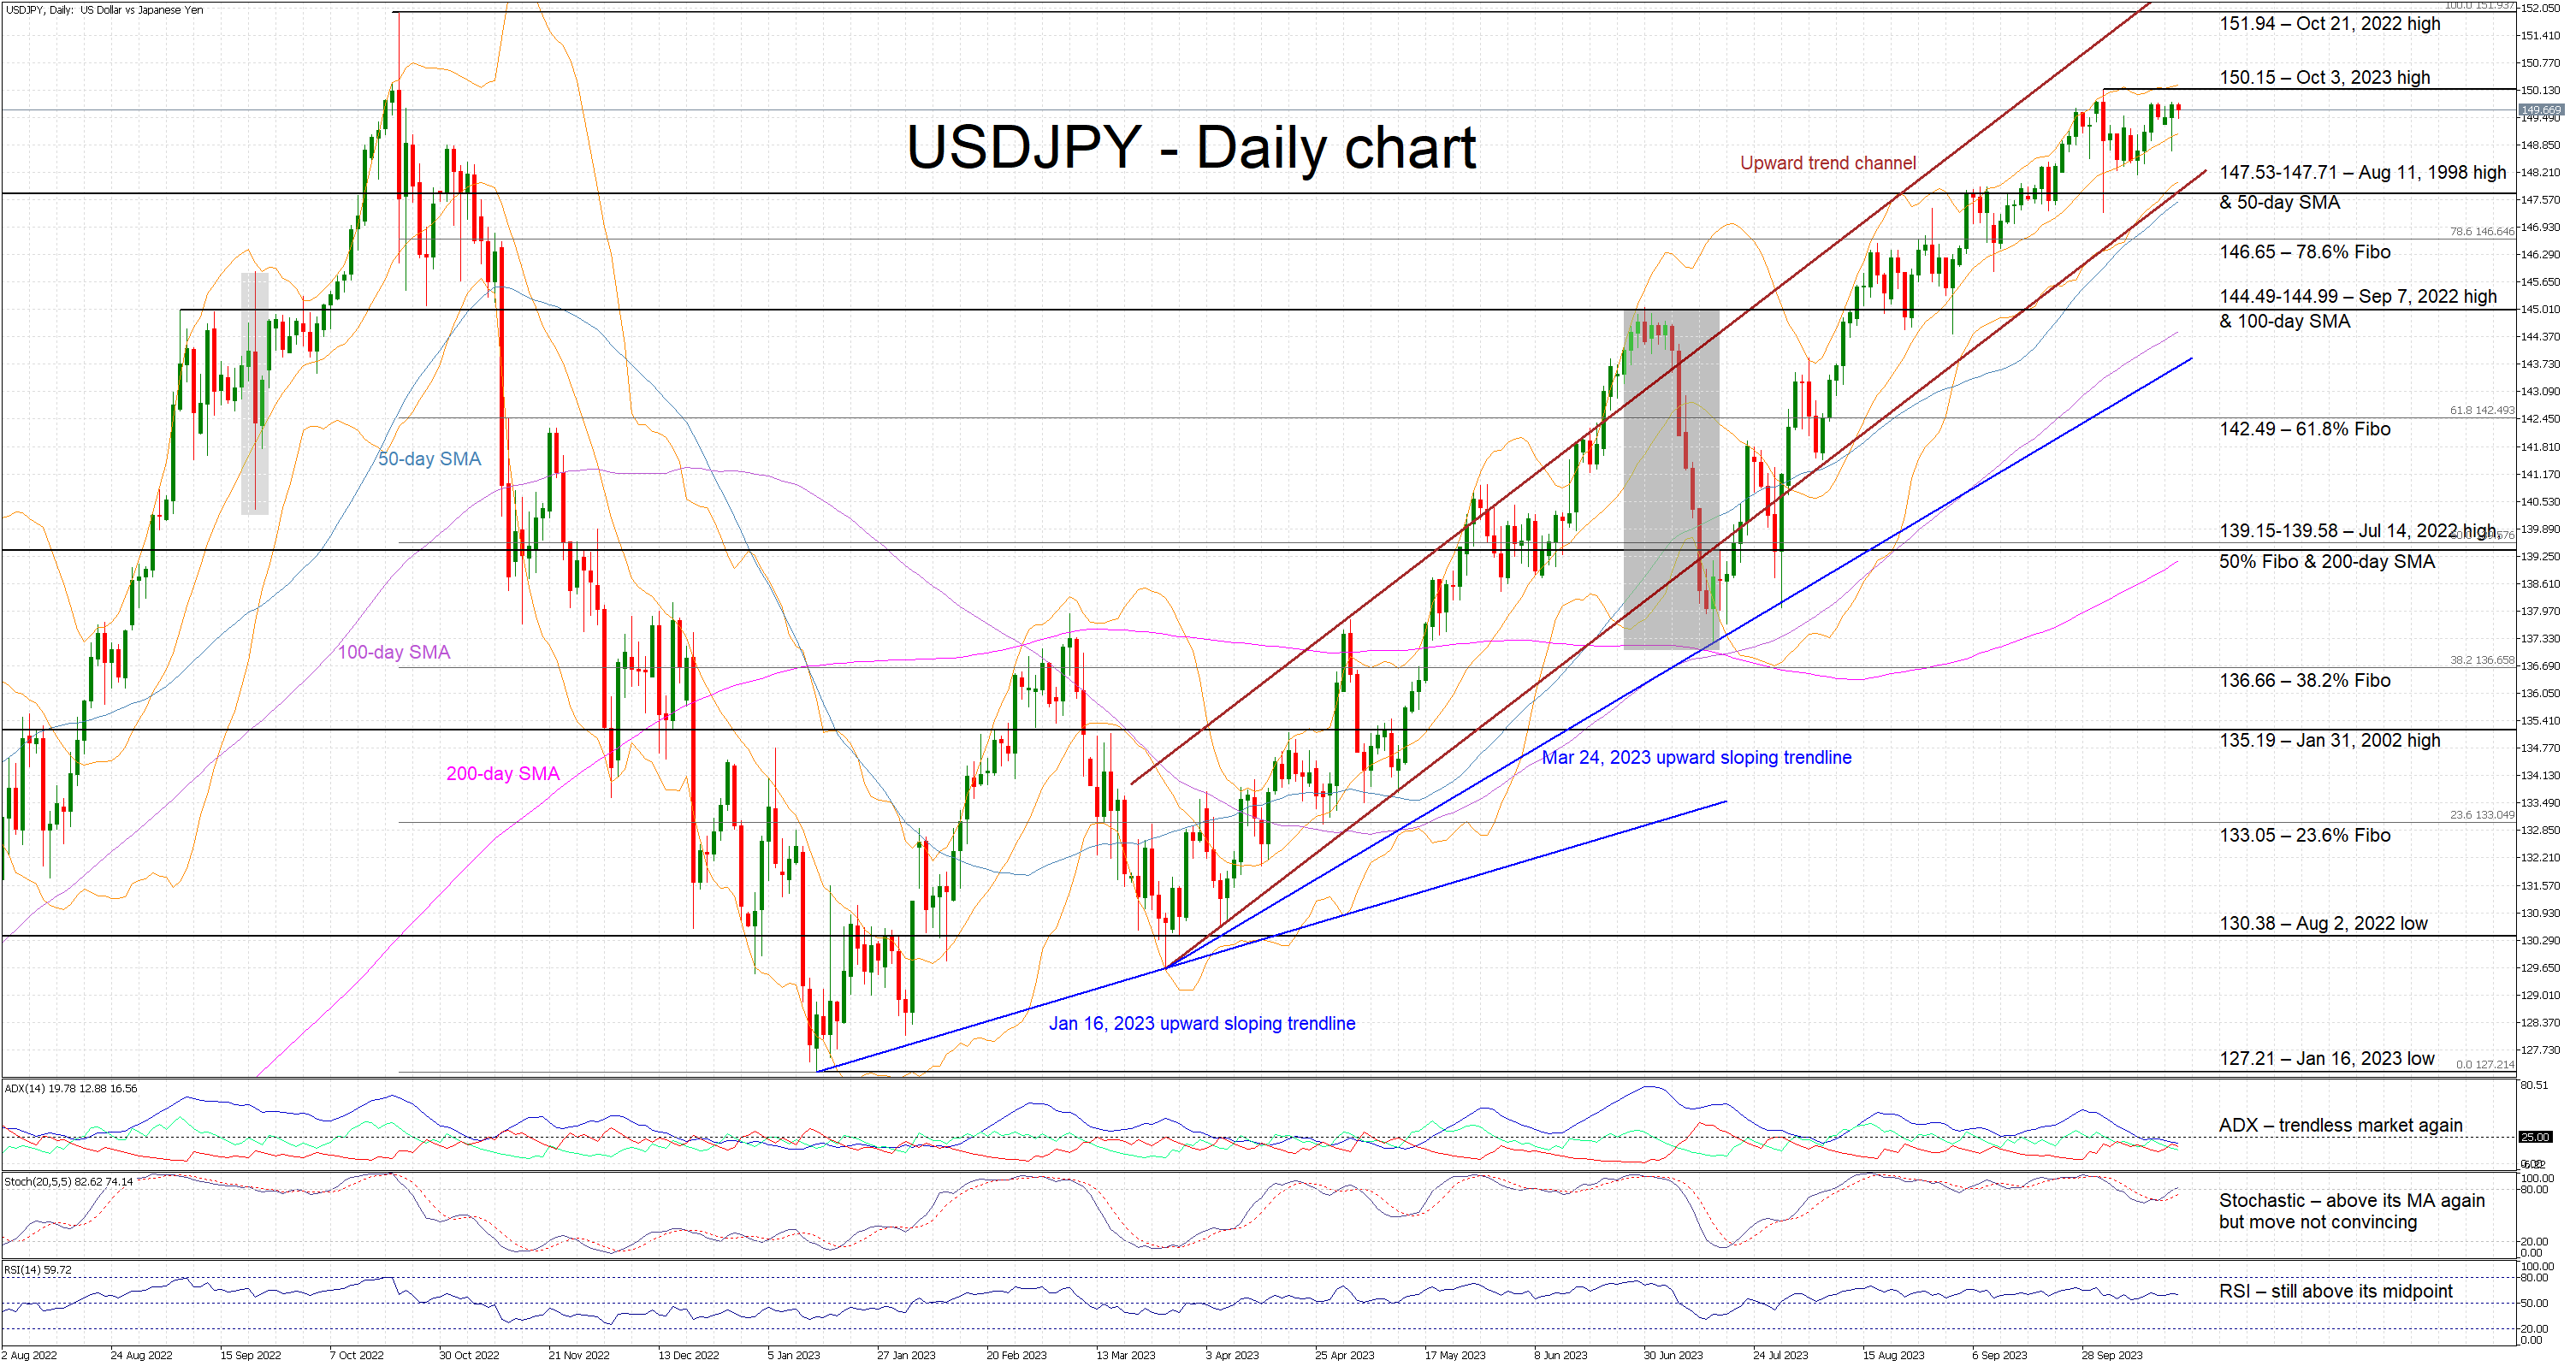
USDJPY is in the red today as market participants’ attention is monopolized by geopolitical developments and the increased risk of another oil price rally. The pair is experiencing a period of relative calm, but the intervention threat remains as USDJPY continues to trade a tad below the 150 assumed threshold.
With today’s candle nicknamed the hanging man and considered a strong bearish signal, the momentum indicators are still portraying a mixed picture. The Average Directional Movement Index (ADX) is stuck below its 25 threshold and thus pointing to a range-trading market. On the flip side, the RSI has completed 2.5 months above its 50-midpoint, confirming a strong bullish tendency in the market. More importantly, the stochastic oscillator has managed to climb again above its moving average, and it is tentatively edging towards its overbought territory. Should this move pick up pace, it would be seen as a bullish signal.
If the bears decide to take advantage of the bulls’ hesitation, they could try to push USDJPY below the 147.53-147.71 area, which is populated by the August 11, 1998 high and the 50-day simple moving average. The support set by the 78.6% Fibonacci retracement of the October 21, 2023 - January 16, 2023 downtrend at 146.65 is unlikely to trouble the bears much. The same though cannot be said for the busier 144.49-144.99 range that appears to be critical for short-term sentiment.
On the other hand, the bulls are trying to engineer a move higher without provoking the Japanese authorities. They could first have another go at the October 3, 2023 high at 150.15. If successful in overcoming this level, they could then have the chance to record a new 2023 high and potentially set a course for the October 21, 2022 high at 151.94.
To sum up, USDJPY bears are trying to take advantage of the recent calmer trading sessions and the open threat of Japanese government intervention.
GBP/USD Analysis: Inflation Stabilises, Pound Rises in Price
UK inflation data was released this morning, showing that consumer price inflation (CPI) held steady at 6.7% in September, although economists had expected 6.6%, which would mean the CPI would continue to decline from its peak of 11.1%, achieved at the end of last year.
These data provide evidence to suggest that inflation has stalled. And the Bank of England will have to make another interest rate increase. Tighter monetary policy → more expensive currency. Therefore, the pound reacted to the news that inflation had not changed with short-term growth relative to other currencies.
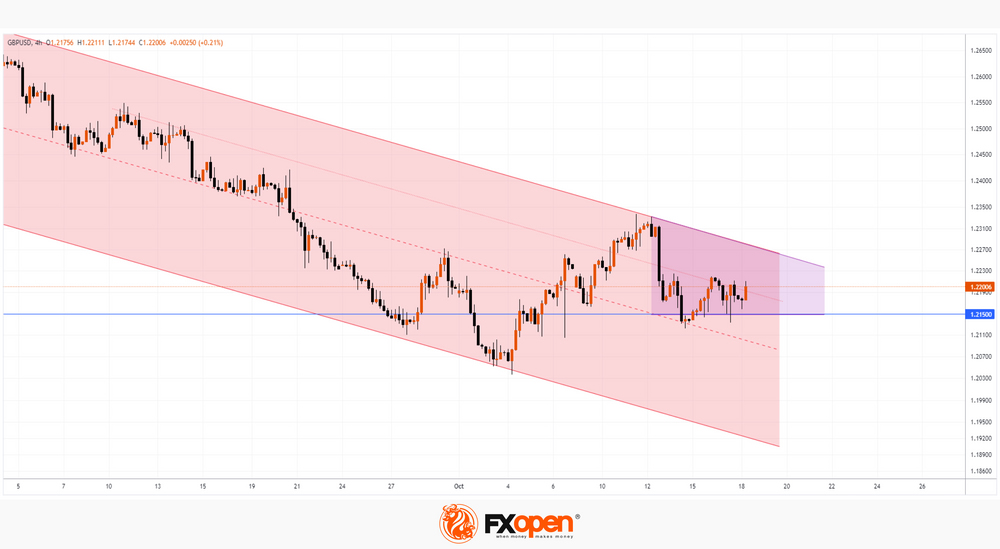
On the GBP/USD chart, a picture emerges indicating that the pound has found important support at the level of 1.215. Judge for yourself:
→ On September 27, the rate dropped lower very uncertainly, but rose very confidently the next day;
→ On October 3, the dive below the level of 1.215 was more significant, but the recovery again was not long in coming. And the bulls were able to lift the GBP/USD rate from the October 4 low by more than 2%;
→ Long lower shadows on the candles (the most noticeable on October 6) indicate demand strength around 1.215;
→ Analysis of the price movement on October 13 shows that this horizontal continues to provide support.
From the bears' point of view, the downward channel is still relevant, but note that its median line is already gaining support properties (judging by the price action at the end of Friday, October 13th).
Considering the facts presented, we can assume that the rate is clamped into a triangle (shown in purple), and if it breaks through, an important impulse can form. Moreover, the drivers for the breakdown may arrive as early as tomorrow: at 15:30 GMT+3, unemployment data in the US will be published, and at 21:00, the head of the Fed will give a speech.
This article represents the opinion of the Companies operating under the FXOpen brand only. It is not to be construed as an offer, solicitation, or recommendation with respect to products and services provided by the Companies operating under the FXOpen brand, nor is it to be considered financial advice.
EUR/USD Could Recover, USD/JPY Inches Toward 150.00
EUR/USD is slowly moving higher from the 1.0500 level. USD/JPY is rising and might soon attempt a move above the 150.00 resistance.
Important Takeaways for EUR/USD and USD/JPY Analysis Today
- The Euro started a decent increase above the 1.0570 pivot level.
- There is a key bullish trend line forming with support near 1.0570 on the hourly chart of EUR/USD at FXOpen.
- USD/JPY climbed higher above the 149.00 and 149.45 levels.
- There is a connecting bullish trend line forming with support near 149.45 on the hourly chart at FXOpen.
EUR/USD Technical Analysis
On the hourly chart of EUR/USD at FXOpen, the pair started a fresh decline from the 1.0640 zone. The Euro declined below the 1.0595 support zone against the US Dollar.
A low was formed near 1.0500 and the pair is now attempting a recovery wave. There was a break above the 50% Fib retracement level of the downward move from the 1.0639 swing high to the 1.0495 low.
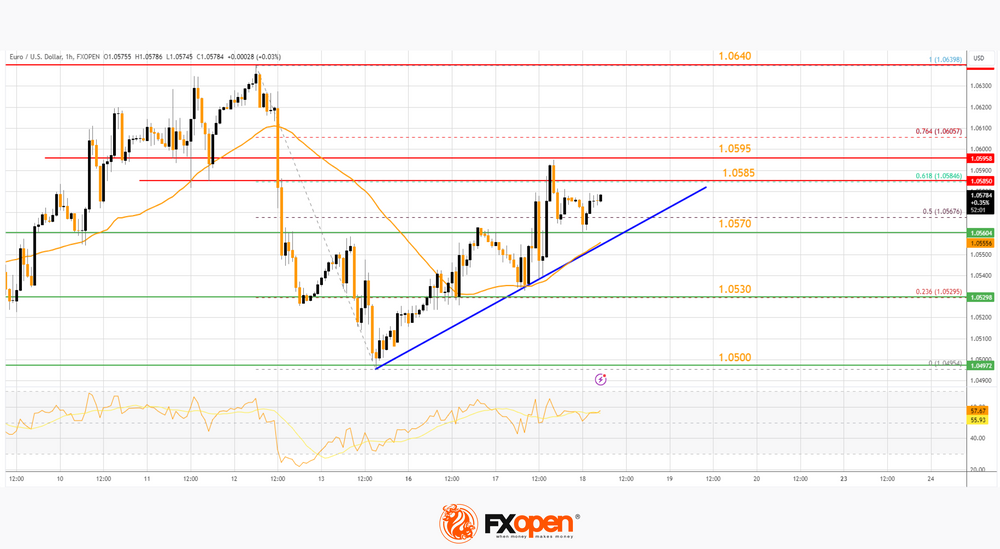
The pair even settled above the 1.0570 zone and the 50-hour simple moving average. There is also a key bullish trend line forming with support near 1.0570.
On the upside, the pair is now facing resistance near the 61.8% Fib retracement level of the downward move from the 1.0639 swing high to the 1.0495 low at 1.0585. The next major resistance is near 1.0595. An upside break above 1.0595 could set the pace for another increase. In the stated case, the pair might rise toward 1.0640.
If not, the pair might start a fresh decline. The first major support on the EUR/USD chart is near 1.0570. The next key support is at 1.0530. If there is a downside break below 1.0530, the pair could drop toward 1.0500. The next support is near 1.0480, below which the pair could start a major decline.
USD/JPY Technical Analysis
On the hourly chart of USD/JPY at FXOpen, the pair started a decent increase from the 148.15 zone. The US Dollar gained bullish momentum above 149.00 against the Japanese Yen.
It settled above the 50-hour simple moving average and 149.45. A high is formed near 149.80 and the pair is now consolidating gains. On the downside, the first major support is near the trend line at 149.45 and the 50-hour simple moving average.
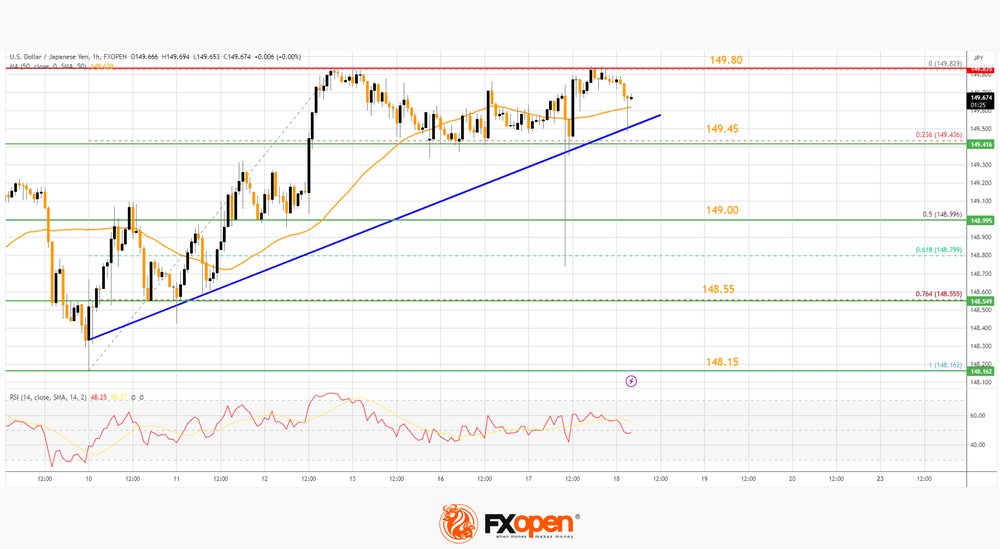
The trend line is close to the 23.6% Fib retracement level of the upward move from the 148.16 swing low to the 149.82 high. The next major support is near 149.00.
If there is a close below 149.00, the pair could decline steadily toward the 76.4% Fib retracement level of the upward move from the 148.16 swing low to the 149.82 high at 148.55. In the stated case, the pair might drop toward 148.15. The next major support sits at 147.50.
Immediate resistance on the USD/JPY chart is near 149.80. The first major resistance is near 150.00. If there is a close above the 150.00 level and the RSI moves above 60, the pair could rise toward 151.20. The next major resistance is near 152.00, above which the pair could test 155.00 in the coming days.
This article represents the opinion of the Companies operating under the FXOpen brand only. It is not to be construed as an offer, solicitation, or recommendation with respect to products and services provided by the Companies operating under the FXOpen brand, nor is it to be considered financial advice.