Sample Category Title
US Inflation Data Could Disrupt Dovish Fed Trades
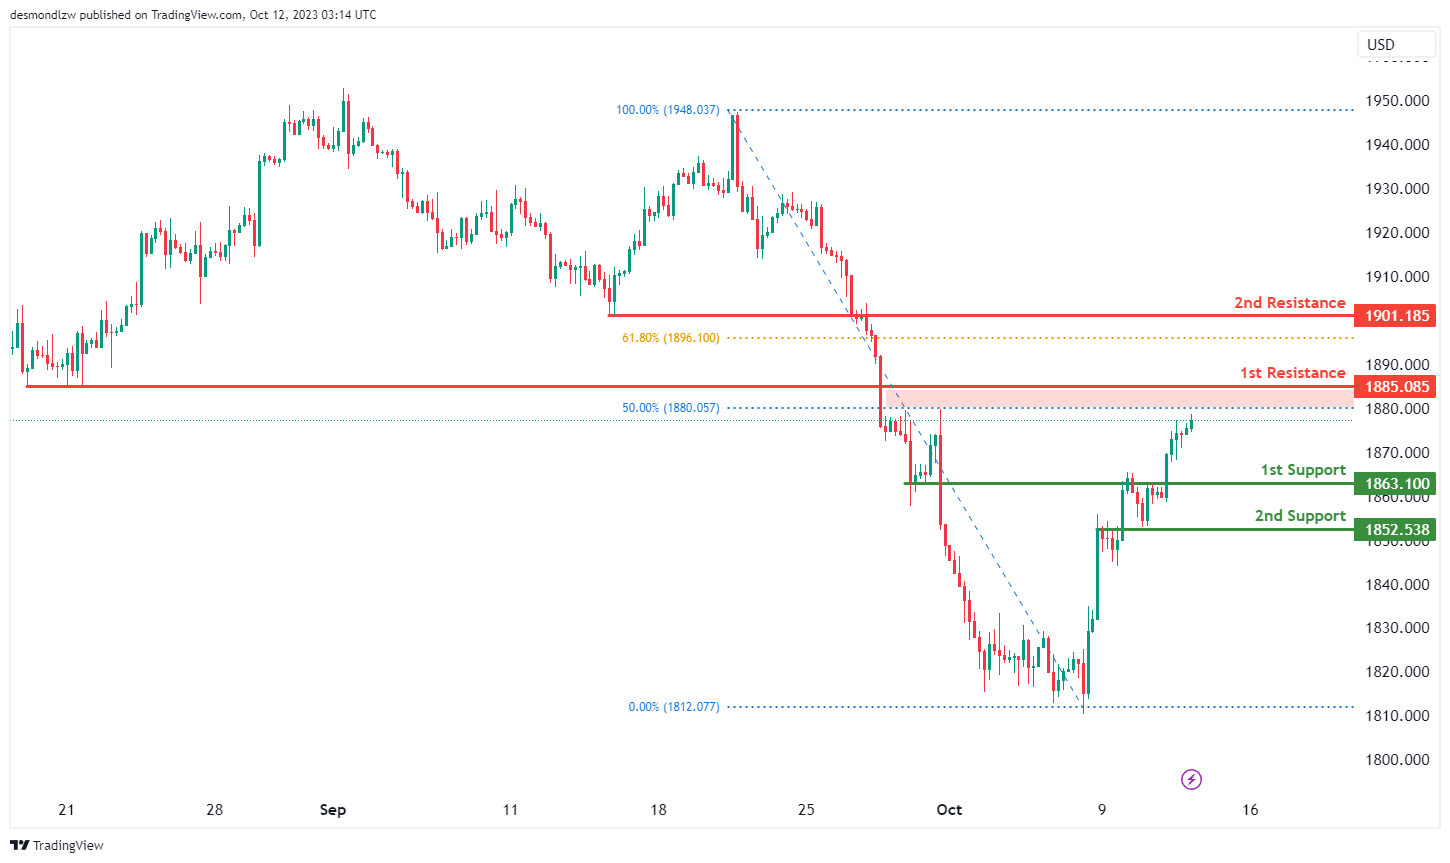
Flight to safety continued on Wednesday, as Middle East tensions rose by another notch after Iran-backed Hezbollah said it fired missiles to an Israeli military post near the Lebanese border. US Treasuries, gold and Swiss franc gained. Gold extended gains to almost $1880 this morning, as the US 10-yer yield fell to 4.55%. The dollar-franc fell below its 200-DMA and is preparing to flirt with the 90 cents mark, as the dollar index lost ground for the 6th straight session. Crude oil, however, fell more than 3% after the API reported a huge - more than 12-mio barrel build - in US crude inventories last week. The latter came as a relief to those worried about supply disruptions due to rising Middle East tensions.
The easing US yields and the dollar’s depreciation are of course due to mounting tensions in the Mid East, but they are also due to a recent softening in Federal Reserve (Fed) speakers’ policy approach. We spent the week hearing that the Fed may have done hiking the interest rates, and that the recent surge in the US long-term yields should give room to the Fed to sit down and evaluate. Released yesterday, the minutes from the latest FOMC meeting suggested a less hawkish tone from the US policymakers. The Fed members agreed last month that the rates should remain high for long, but they also noted that ‘the risks of overtightening had to be balanced’ against bringing inflation toward the 2% policy target.
Equities extend rebound
The probability of a no rate hike in November jumped above 90% after the Fed minutes, whereas this probability stood at around the 70% level at the beginning of this week. US fed funds futures price in more than 70% for a no hike in December as well, whereas this probability closer to 50/50 a few days ago.
The retreat in US Treasuries and the dollar is not purely driven by, yes, a swift move to safe haven assets. It is also driven by the Fed expectations. This is certainly why we also see the S&P500 extend gains for the 4th consecutive session. The S&P500 gained every day since tensions in the Middle East started. If the yields were down only on the Middle East war, risk assets – like equities would have been left behind. This is not the case. Investors buy stocks, they buy bonds, and they also buy some gold and Swiss franc to hedge it off.
But inflation could spoil sentiment
Revealed yesterday, the producer price inflation in the US came in higher than expected. The headline PPI jumped from 2% to 2.2%, whereas the market expectation was a fall to 1.6% in September. The uptick was clearly due to rising energy prices since summer and the strongest rise in food prices in nearly a year. Core PPI on the other hand rose from 2.5% to 2.7%, leaving the expectation of a fall to 2.3% well behind. Due today, the US CPI data could, or could not show a further fall in headline and core inflation. A higher-than-expected set of inflation data could scale back a part of the recent dovishness regarding the Fed and reverse a part of the recent gains in US Treasuries.
Focus Turns to US CPI
Market movers today
US CPI will be the main focus today. We forecast both headline and core CPI below consensus expectations at +0.2% in m/m SA terms (consensus 0.3%). The energy price contribution remains positive and used car prices have edged slightly higher lately, but the shelter component continues to put downward pressure on inflation figures. Gradually cooling wage growth points towards further easing in core services CPI excl. shelter as well, which remains the key point of focus for the Fed.
We also get US initial jobless claims and UK monthly GDP for August this morning.
In the Nordics Sweden releases Prospera Inflation Expectations Survey (the smaller monthly survey).
Overnight China CPI for September is expected at 0.2% y/y keeping inflation in positive territory for another month after dipping below zero in July.
The 60 second overview
FOMC minutes signal high for long. The FOMC minutes were much in line with expectations stating that policy should remain 'sufficiently restrictive' for some time to return inflation to 2%. Most members saw one more hike as most likely going ahead, but data dependence and a cautious approach going forward was clearly underscored as the guiding principles. Markets price only a small chance of another Fed hike, which we agree with as we believe the Fed is done. Still data on inflation and employment will be key for whether the Fed decides to add another hike or not.
US PPI inflation came in stronger-than-expected in September at 0.5% m/m and core PPI at 0.3% m/m (consensus 0.2% m/m).
China state funds buy bank shares. The Chinese state fund Central Huijin Asset Management bought shares in the big four Chinese state-owned banks and plans to buy more over the coming six months according to filings Wednesday. The news is seen as increasing efforts by Beijing to support the economy and markets and helped lift Chinese stocks, which are up 2.2% in the offshore market this morning.
Wage growth key for Bank of Japan (BoJ). Board member Noguchi of BoJ overnight reiterated the bank's view that the biggest focus now was to ensure that momentum for wage growth stayed in place, with a 3% rise in nominal pay to back efforts to meet the 2% inflation target. Wage growth in Japan has eased lately after rising earlier in the year.
Energy prices fade. Oil prices declined a bit further overnight now trading below USD86 after hitting USD89 following the Hamas attack on Israel. Concerns over a spread of the crisis to rest of the Middle East have calmed for now. Natural gas prices were broadly stable yesterday.
Equities: Global equities were higher yesterday as yields once again overshadowed all other factors driving equities. Looking at the sector performance yesterday, utilities outperformed together with tech while energy and consumer staples were the poorest performers. This odd mix of sector rotations is seldom seen when macro is the driving force but is very easy to explain as yields and oil price are coming down together. Importantly, the constraint is that underlying macro needs to be strong. Otherwise, we would have seen a classic defensive rotation. We did not see that as cyclicals outperformed defensives by more than 0.5 percentage points. Hence, yesterday was yet another good example of how investors are positioned and how fearful they still are of inflation, central bank tightening and higher yields relative to a weakening growth outlook. We expect these dynamics and investment narrative to continue to dominate the market near-term.
In US yesterday, Dow +0.2%, S&P 500 +0.4%, Nasdaq +0.7% and Russell 2000 -0.2%. Asian markets are continuing the positive trend this morning with solid gains not least in China and Japan. European and US futures are in solid green as well.
Fixed income: Global yields fell further in yesterday's session, as soft signals from FOMC dominated the effect of a higher-than-expected US PPI inflation print. The Bund curve was bull flattening throughout the day, with the 10Y yield down by 6bp and the 2Y tenor up by 2bp. The decline was very similar across core and peripheral Europe, with only minor change in spreads. 10Y UST yields ended the day 8bp lower in line with a similar decline in real yields (10Y TIPS).
FX: EUR/USD ended the day slightly above 1.06 after the FOMC minutes released last night struck a lightly dovish tone. Today, focus turns to the September CPI release, where we forecast both headline and core CPI below consensus expectations. NOK traded heavy in the afternoon session yesterday amid energy prices coming lower. EUR/GBP remains range bound ahead of a packed tier 1 data week coming up.
Credit: Credit Markets exhibited relatively calm behaviour on Wednesday following some fairly dovish commenting from key central banks. Itrax main was unchanged at 82.6bp, while Itrax Xover tightened 2.2bp to close at 438.2bp. Nordic primary markets saw activity in the SEK space with names such as Nykredit and Vestum printing new bonds.
Nordic macro
In Sweden, Prospera's monthly (i.e. the small report) inflation expectations survey is due today. The important 5y horizon has been stable just above 2% for the past year and we do not expect this to change this time around either. Notably, expectations took a small step higher on the 1-2y horizon however in the last survey, so might be something to look out for if this should continue this time around as well. But for the Riksbank, the longer time-horizon (5y) still prevails, and the quarterly (big) Prospera report has a larger weight, so we should probably not expect too much in terms of market reactions on today's survey. In Norway, we get house prices for Q3.
USD/CAD Daily Outlook
Daily Pivots: (S1) 1.3569; (P) 1.3597; (R1) 1.3621; More....
While USD/CAD is losing some downside momentum as seen in 4 H MACD, further decline is still mildly in favor as pull back from 1.3784 extends. Nevertheless, outlook will stay bullish as long as 1.3378 support holds. On the upside, above 1.3675 minor resistance will turn bias back to the upside for retesting 1.3784 next.
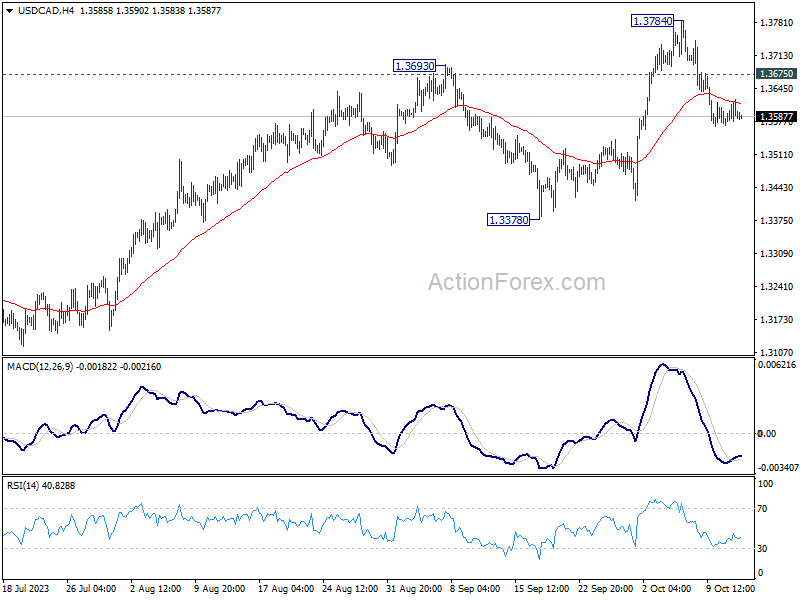
In the bigger picture, current development revives the case that corrective pattern from 1.3976 (2022 high) has completed with three waves down to 1.3091. Decisive break of 1.3976 high will confirm resumption of up trend from 1.2005 (2021 low). Next target will be 61.8% projection of 1.2401 to 1.3976 from 1.3091 at 1.4064. This will now remain the favored case as long as 1.3378 support holds.
AUD/USD Daily Report
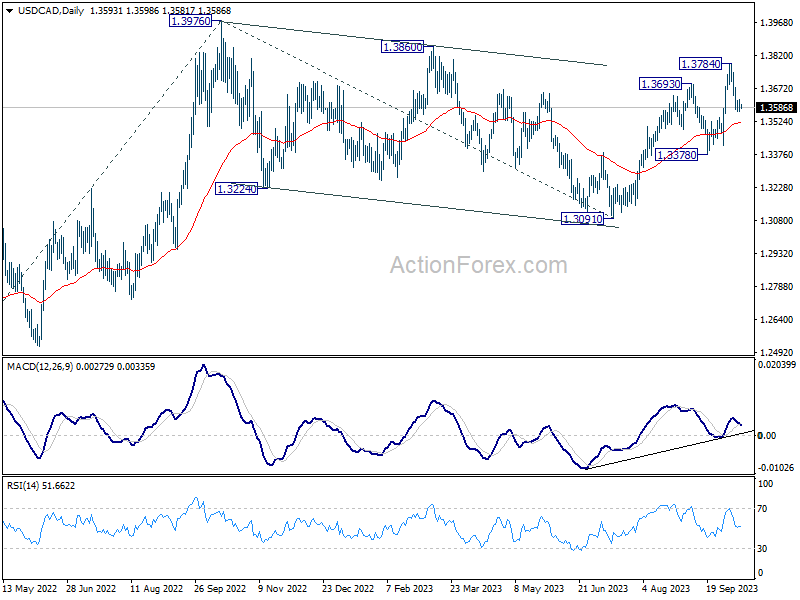
Daily Pivots: (S1) 0.6386; (P) 0.6416; (R1) 0.6443; More...
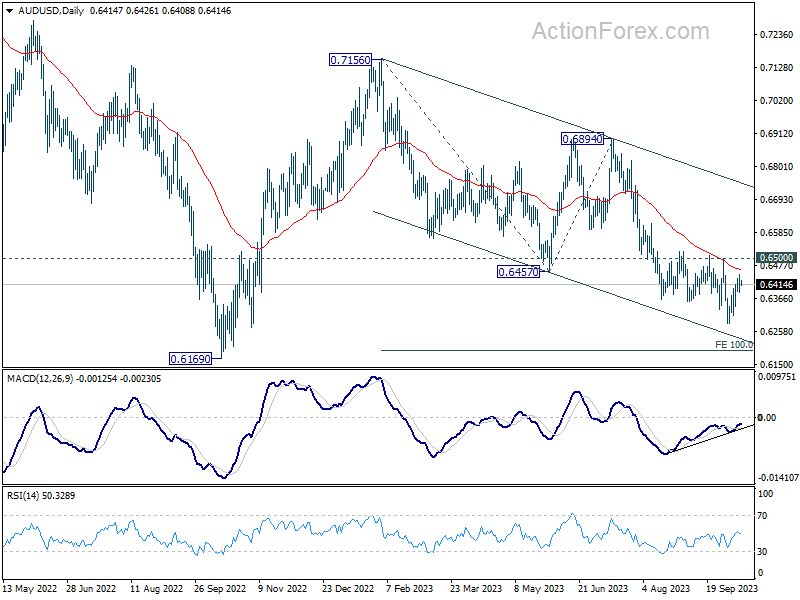
No change in AUD/USD's outlook and intraday bias remains neutral first. While recovery from 0.6284 could extend higher, outlook will stay bearish as long as 0.6500 resistance holds. Below 0.6284 will resume the fall from 0.7156. Next target is 100% projection of 0.7156 to 0.6457 from 0.6894 at 0.6195.
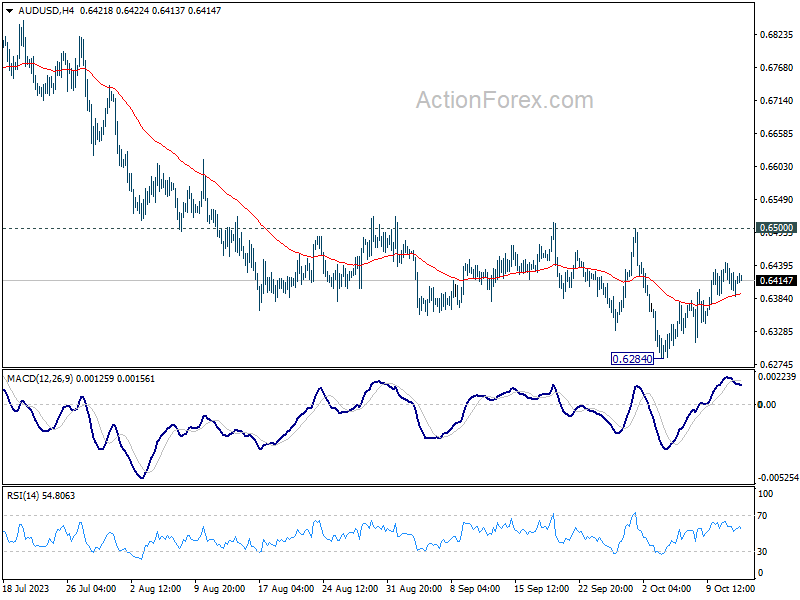
In the bigger picture, down trend from 0.8006 (2021 high) is possibly still in progress. Decisive break of 0.6169 will target 61.8% projection of 0.8006 to 0.6169 to 0.7156 at 0.6021. This will now remain the favored case as long as 0.6894, in case of strong rebound.
EUR/USD Daily Outlook
Daily Pivots: (S1) 1.0588; (P) 1.0611; (R1) 1.0643; More...
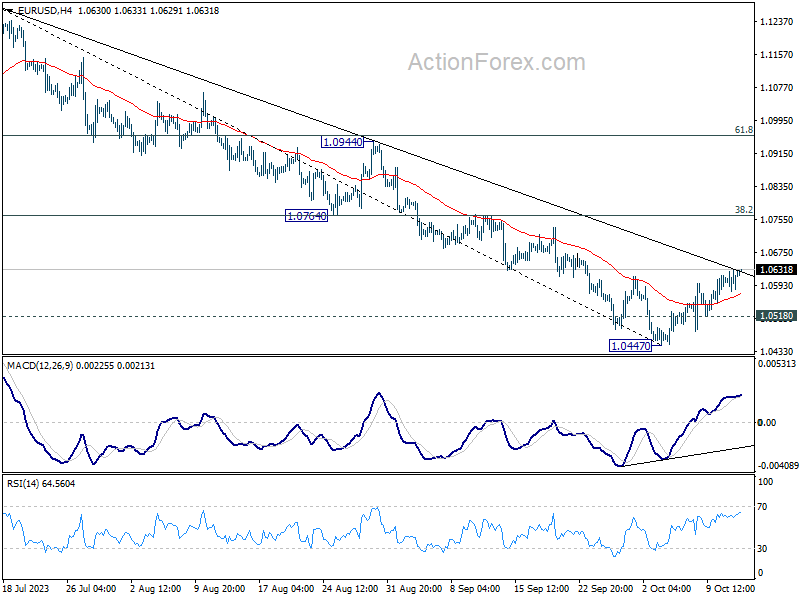
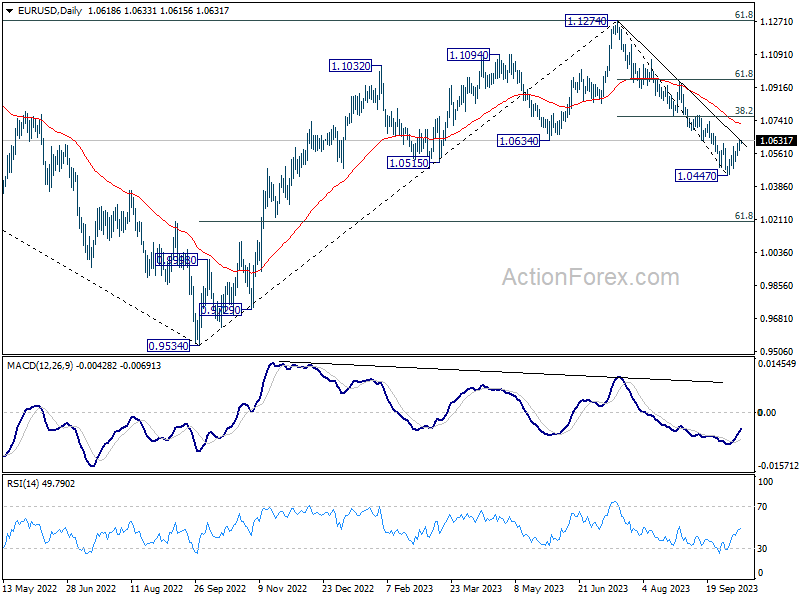
EUR/USD's rebound from 1.0447 continues and the break of 1.0616 confirms short term bottoming. intraday bias is back on the upside for 1.0764 cluster resistance (38.2% retracement of 1.1274 to 1.0447 at 1.0763). On the downside, though, break of 1.0518 will bring retest of 1.0447 low instead.
In the bigger picture, fall from 1.1274 medium term top could still be a correction to rise from 0.9534 (2022 low). But chance of a complete trend reversal is rising. In either case, current fall should target 61.8% retracement of 0.9534 to 1.1274 at 1.0199 next. For now, risk will stay on the downside as long as 55 D EMA (now at 1.0719) holds, in case of rebound.
GBP/USD Daily Outlook
Daily Pivots: (S1) 1.2276; (P) 1.2307; (R1) 1.2344; More
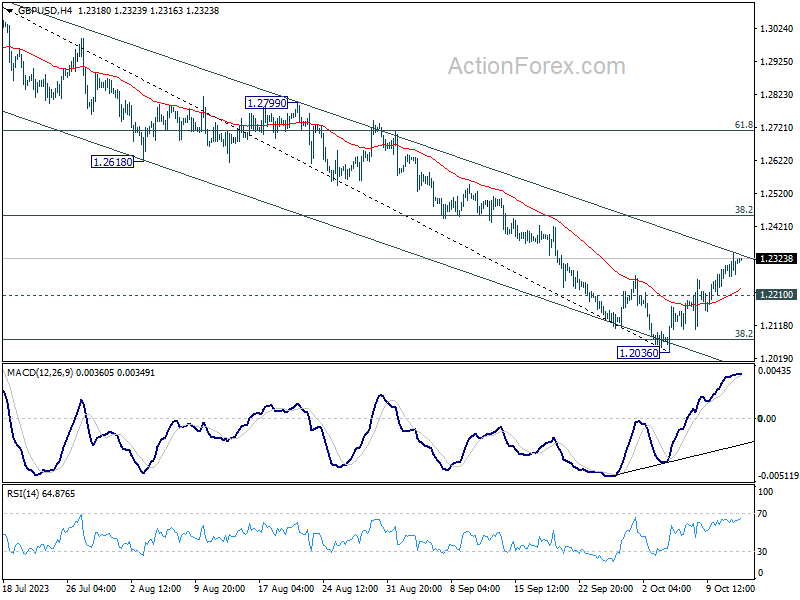
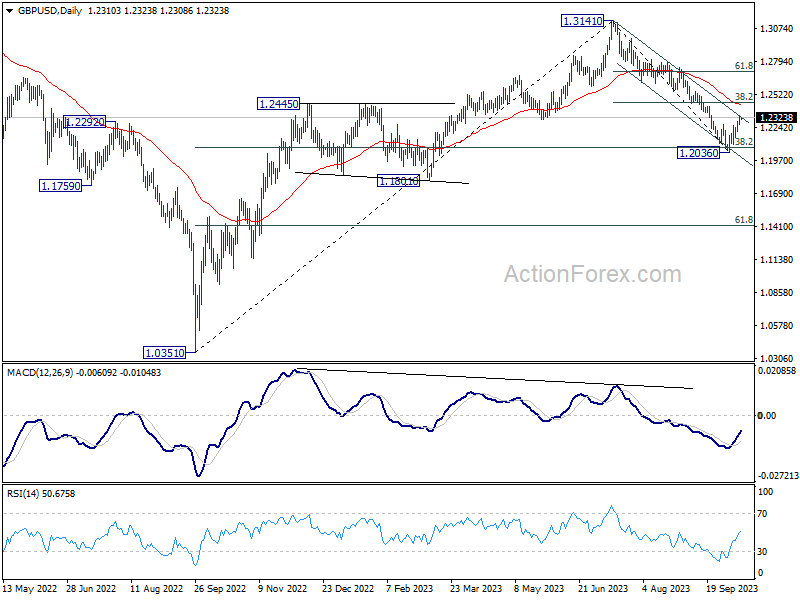
Intraday bias in GBP/US remains on the upside as rebound from 1.2306 short term bottom is in progress. Firm break of near term channel resistance (now at 1.2334) will target 38.2% retracement of 1.3141 to 1.2036 at 1.2458 next. Nevertheless, break of 1.2210 minor support will revive near term bearishness and bring retest of 1.2036 low.
In the bigger picture, fall from 1.3141 medium term top could still be a correction to up trend from 1.0351 (2022 low) only. But risk of complete trend reversal is rising. Sustained break of 38.2% retracement of 1.0351 to 1.3141 at 1.2075 will pave the way to 61.8% retracement at 1.1417. For now, risk will stay on the downside as long as 55 D EMA (now at 1.2440) holds, in case of rebound.
USD/JPY Daily Outlook
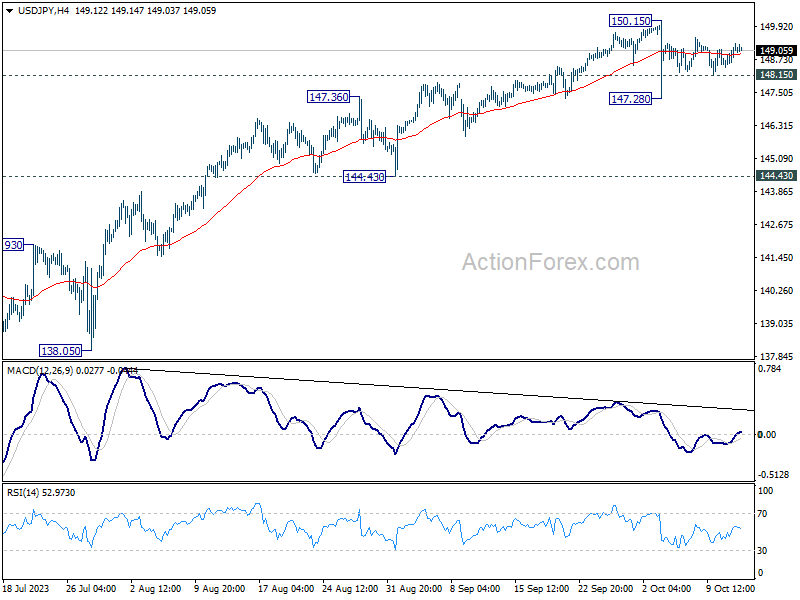
Daily Pivots: (S1) 148.63; (P) 148.97; (R1) 149.52; More...
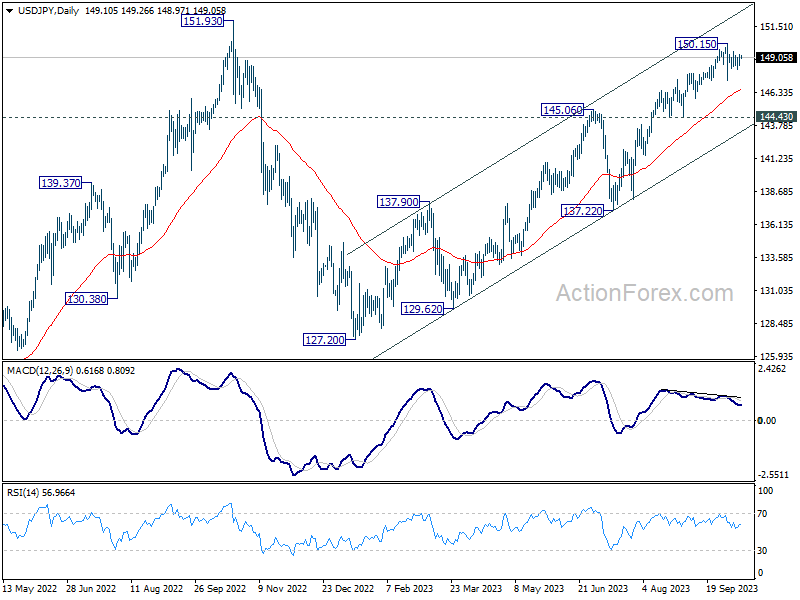
Intraday bias in USD/JPY remains neutral at this point. Consolidation from 150.15 is still in progress. On the downside, below 148.24 minor support will turn bias to the downside for another down leg through 147.28. But there is no confirmation of bearish trend reversal before firm break of 144.43 support. Another rally remains mildly in favor through 150.15 to retest 151.93 high.
In the bigger picture, while rise from 127.20 is strong, it could still be seen as the second leg of the corrective pattern from 151.93 (2022 high). Rejection by 151.93, followed by sustained break of 145.06 resistance turned support will be the first sign that the third leg of the pattern has started. However, sustained break of 151.93 will confirm resumption of long term up trend.
USD/CHF Daily Outlook
Daily Pivots: (S1) 0.8996; (P) 0.9026; (R1) 0.9049; More....
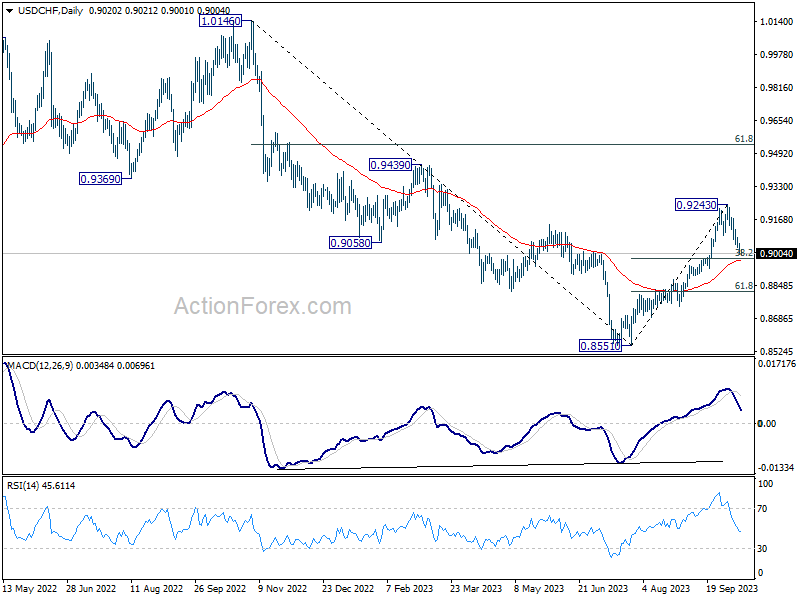
USD/CHF's fall from 0.9243 is in progress and intraday bias stays on the downside. Strong support could be see around 38.2% retracement of 0.8551 to 0.9243 at 0.8979 to contain downside on first attempt. Break of 0.9081 will turn bias back to the upside for stronger rebound. However, sustained break of 0.8979 will argue that deeper fall is under way to 61.8% retracement at 0.8815.
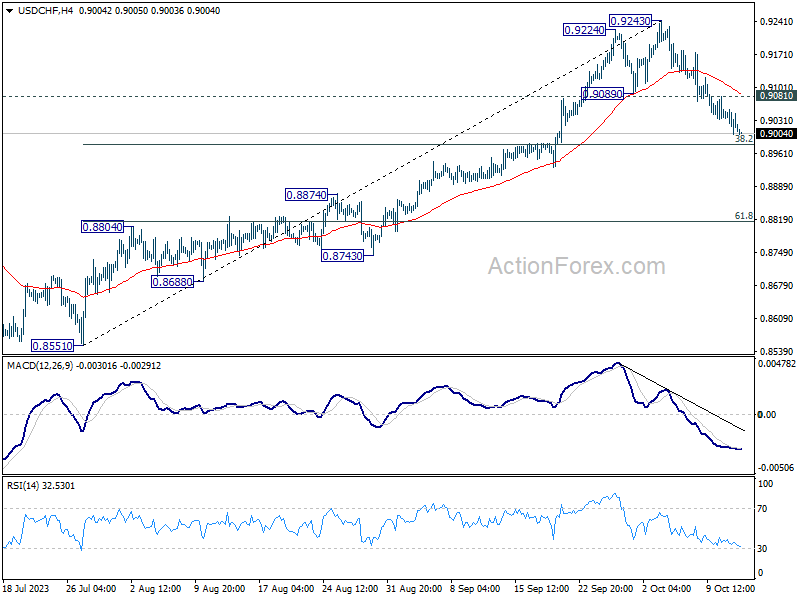
In the bigger picture, current development indicates that rise from 0.8551 is reversing whole down trend from 1.0146. Further rally would then be seen to 61.8% retracement at 0.9537 and above. For now, this will be the favored case as long as 55 D EMA (now at 0.8971) holds, even in case of deep pullback.
Dollar Remains Weak Post-FOMC Minutes; Eyes on Upcoming CPI Data
Dollar continues its slide, maintaining its position as the week's worst performer and further descending following the release of FOMC minutes. The document indicated a majority of the Committee members anticipate an additional rate hike this year, aligning with recent dot plot projections. However, the market seems to have shrugged off this hawkish message.
Attention now pivots to the imminent release of US consumer inflation data, which is expected to reveal lower annual headline and core CPI for September. However, the monthly readings, especially the core, may draw heightened attention due to their exclusion of last year's base effects. Current Fed fund futures indicate a subdued expectation of a rate hike, with less than 10% likelihood for November and approximately 28% for December.
On the global stage, Yen trails Dollar as the week's second-worst performer, with New Zealand Dollar and Euro following suit. Sterling and Swiss Franc are leading the way, with the former awaiting cues from UK's GDP data release. Canadian and Australian dollars remain ambivalent in their positions.
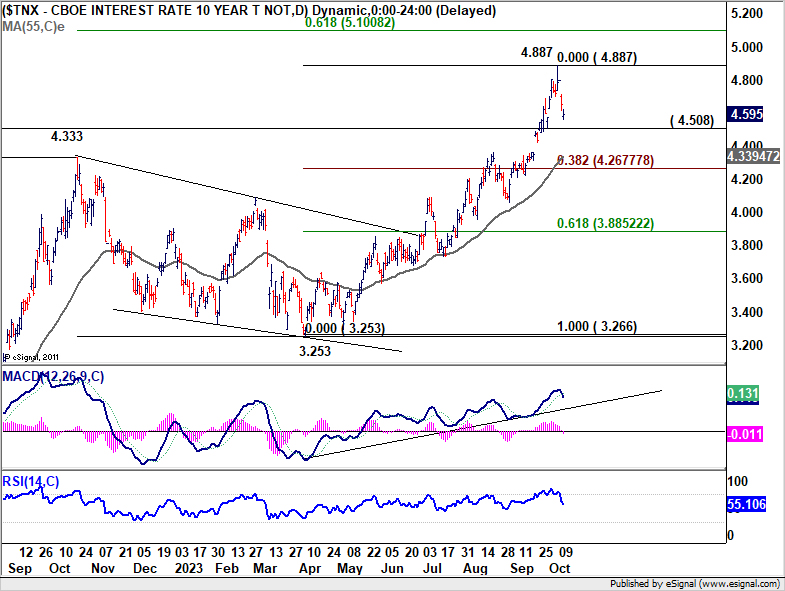
Treasuries are also in focus, particularly the reaction of yields to US CPI data. Technically, 10-year yield has seen a significant dip from last week's high of 4.887 to the current 4.595, yet early signs of steadiness are emerging.
A rebound at this juncture would argue that price actions from 4.887 are merely a sideway consolidation pattern. That would provide a buffer against the dollar's sell-off. However, a definitive break below 4.5 could suggest a deeper correction from the earlier surge to 3.253, prompting a more pronounced decline to the 55 D EMA (now at 4.339) , thereby adding to Dollar's woes.
In Asia, at the time of writing, Nikkei is up strongly by 1.63%. Hong Kong HSI is up 1.89%. China Shanghai SSE is up 0.83%. Singapore Strait Times is up 0.89%. Japan 10-year JGB yield is down -0.25 at 0.754. Overnight, DOW rose 0.19%. S&P 500 rose 0.43%. NASDAQ rose 0.71%. 10-year yield dropped further by -0.060 to 4.595.
Fed minutes show majority leaning towards further rate hike
In the minutes from Fed's September 19-20 meeting, while "a majority of participants" believed another rate increase might be in order, a contrasting view was held by "some" who deemed no further hikes necessary.
A unanimous consensus was evident among all attendees that the existing policy stance needs to "remain restrictive for some time". The chief rationale behind this unified sentiment is to ensure that inflation trends downwards in a sustained manner to Fed's target.
An interesting shift in communication strategy was proposed by "several participants". They emphasized that discussions and subsequent messaging should transition from deliberating the potential height of rate hikes to determining the duration for which rates should be maintained at these elevated, restrictive levels.
In terms of gauging risks, participants "generally judged" that challenges to fulfilling the Fed's mandates had become "more two sided". However, a lingering concern persists. Despite this balanced view of risks, "most participants" continued to see upside risks to inflation.
Fed's Collins eyes prolonged restrictive rates
Boston Fed President Susan Collins noted overnight her expectation that the central bank may need to maintain interest rates at restrictive levels "for some time" until there's tangible evidence of inflation moving back to 2% target.
While acknowledging that the policy rates might currently be near their peak, Collins did not rule out the possibility of additional rate hikes.
She stated, "And while we are likely near, and could be at, the peak for policy rates, further tightening could be warranted depending on incoming information."
Amidst the pervasive economic uncertainties and risks characterizing the current financial climate, Collins remains cautiously optimistic. She believes that the restoration of price stability is achievable, anticipating an "orderly slowdown in activity and only a modest increase in the unemployment rate."
Japan's PPI slows to 2% yoy in Sep, trailing CPI core for the first time since 2021
Japan PPI slowed from 3.3% yoy to 2.0% yoy in September, below expectations of 2.3%. That's the lowest level since March 2021. Also, PPI is now below CPI core (at 3.1% yoy) for the first time since early 2021.
Import price index was unchanged at -15.6% yoy, the sixth month of decline. Export price index rose for the first time in seven months, up 0.2% yoy, comparing to prior month's -0.7% yoy.
For the month, PPI fell -0.3% mom. Import price index rose 0.6% mom. Export price index rose 0.5% mom.
Looking ahead
UK GDP, production and trade balance will be released in European session. ECB will also publish meeting accounts. Later in the day, US CPI and jobless claims are the main releases.
USD/CHF Daily Outlook
Daily Pivots: (S1) 0.8996; (P) 0.9026; (R1) 0.9049; More....
USD/CHF's fall from 0.9243 is in progress and intraday bias stays on the downside. Strong support could be see around 38.2% retracement of 0.8551 to 0.9243 at 0.8979 to contain downside on first attempt. Break of 0.9081 will turn bias back to the upside for stronger rebound. However, sustained break of 0.8979 will argue that deeper fall is under way to 61.8% retracement at 0.8815.
In the bigger picture, current development indicates that rise from 0.8551 is reversing whole down trend from 1.0146. Further rally would then be seen to 61.8% retracement at 0.9537 and above. For now, this will be the favored case as long as 55 D EMA (now at 0.8971) holds, even in case of deep pullback.
Economic Indicators Update
| GMT | Ccy | Events | Actual | Forecast | Previous | Revised |
|---|---|---|---|---|---|---|
| 23:01 | GBP | RICS Housing Price Balance Sep | -69% | -68% | ||
| 23:50 | JPY | Bank Lending Y/Y Sep | 2.90% | 3.10% | 3.10% | |
| 23:50 | JPY | PPI Y/Y Sep | 2.00% | 2.30% | 3.20% | 3.30% |
| 23:50 | JPY | Machinery Orders M/M Aug | -0.50% | 0.70% | -1.10% | |
| 00:00 | AUD | Consumer Inflation Expectations Oct | 4.80% | 4.60% | ||
| 06:00 | GBP | GDP M/M Aug | 0.20% | -0.50% | ||
| 06:00 | GBP | Industrial Production M/M Aug | -0.20% | -0.70% | ||
| 06:00 | GBP | Industrial Production Y/Y Aug | 1.70% | 0.40% | ||
| 06:00 | GBP | Manufacturing Production M/M Aug | -0.40% | -0.80% | ||
| 06:00 | GBP | Manufacturing Production Y/Y Aug | 3.40% | 3.00% | ||
| 06:00 | GBP | Goods Trade Balance Aug | -15.2B | -14.1B | ||
| 11:00 | GBP | NIESR GDP Estimate (3M) Sep | 0.20% | |||
| 11:30 | EUR | ECB Meeting Accounts | ||||
| 12:30 | USD | Initial Jobless Claims (Oct 6) | 215K | 207K | ||
| 12:30 | USD | CPI M/M Sep | 0.30% | 0.60% | ||
| 12:30 | USD | CPI Y/Y Sep | 3.60% | 3.70% | ||
| 12:30 | USD | CPI Core M/M Sep | 0.30% | 0.30% | ||
| 12:30 | USD | CPI Core Y/Y Sep | 4.10% | 4.30% | ||
| 14:30 | USD | Natural Gas Storage | 85B | 86B | ||
| 15:00 | USD | Crude Oil Inventories | -0.4M | -2.2M |
Technical Outlook and Review
DXY:
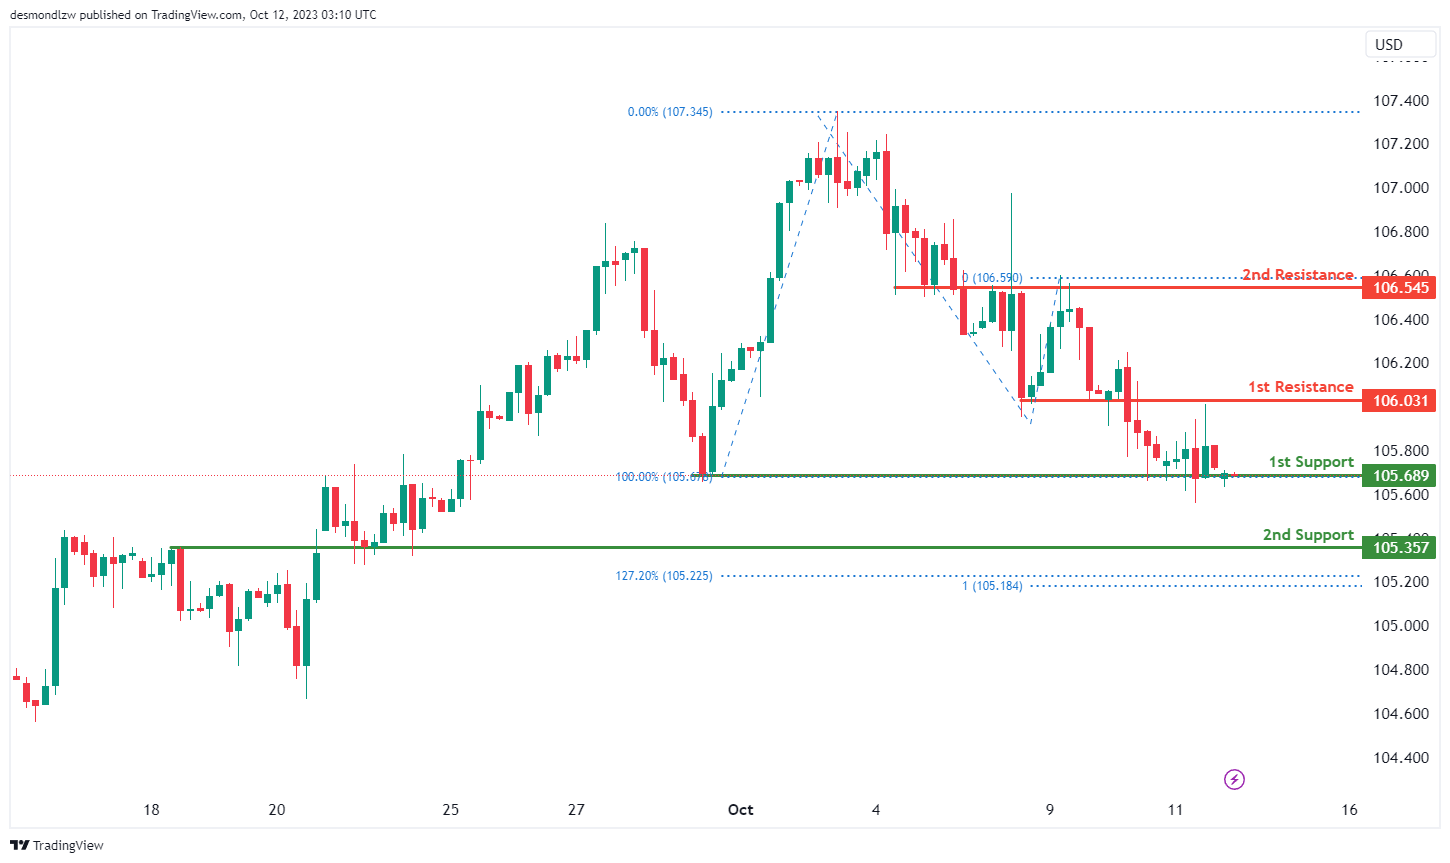
The DXY (US Dollar Index) chart currently exhibits bullish momentum, suggesting the potential scenario of a bullish bounce off the 1st support level with a subsequent move towards the 1st resistance.
The 1st support at 105.68 is considered significant as it is identified as a multi-swing low support, indicating a potential area where buying interest may emerge. Additionally, the 2nd support at 105.36 is characterized as an overlap support, further reinforcing its importance as a potential level for price rebounds.
On the resistance side, the 1st resistance level at 106.03 is identified as an overlap resistance, suggesting it could act as a strong barrier to upward price movement. Beyond this, the 2nd resistance at 106.54 is also characterized as an overlap resistance, adding to its significance as a potential area where selling pressure may emerge.
EUR/USD:
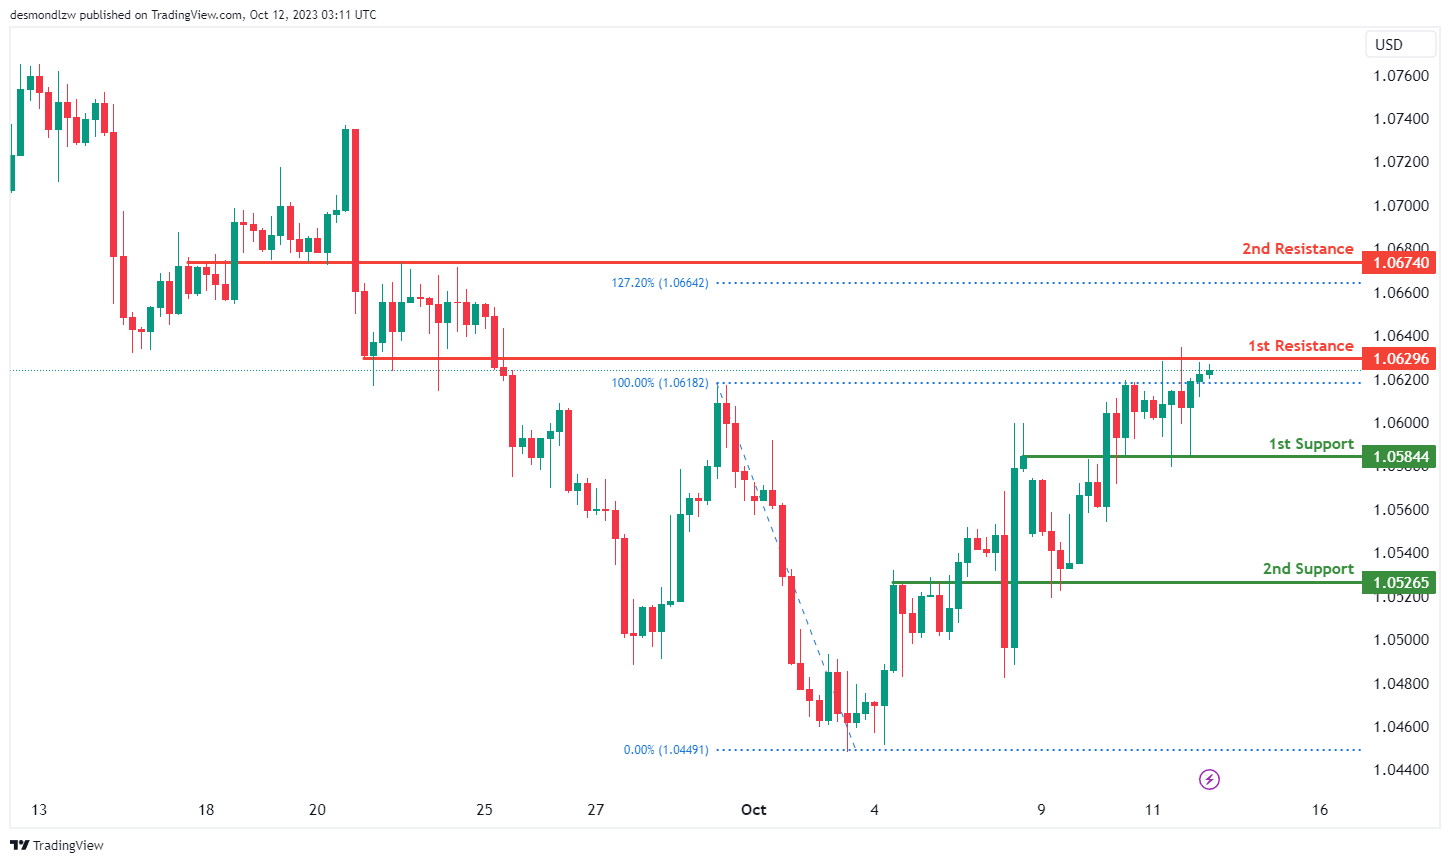
The EUR/USD chart currently shows a bearish momentum, indicating the potential scenario of a bearish reaction off the 1st resistance level, followed by a drop towards the 1st support.
The 1st support at 1.0584 is considered significant as it is identified as an overlap support, suggesting it may act as a level where buying interest could emerge. Additionally, the 2nd support at 1.0526 is also characterized as an overlap support, reinforcing its importance as a potential level for price rebounds.
On the resistance side, the 1st resistance level at 1.0629 is identified as an overlap resistance, indicating it could serve as a strong barrier to upward price movement. Beyond this, the 2nd resistance at 1.0674 is also characterized as an overlap resistance and coincides with the 127.20% Fibonacci Extension level, further adding to its significance as a potential area where selling pressure may emerge.
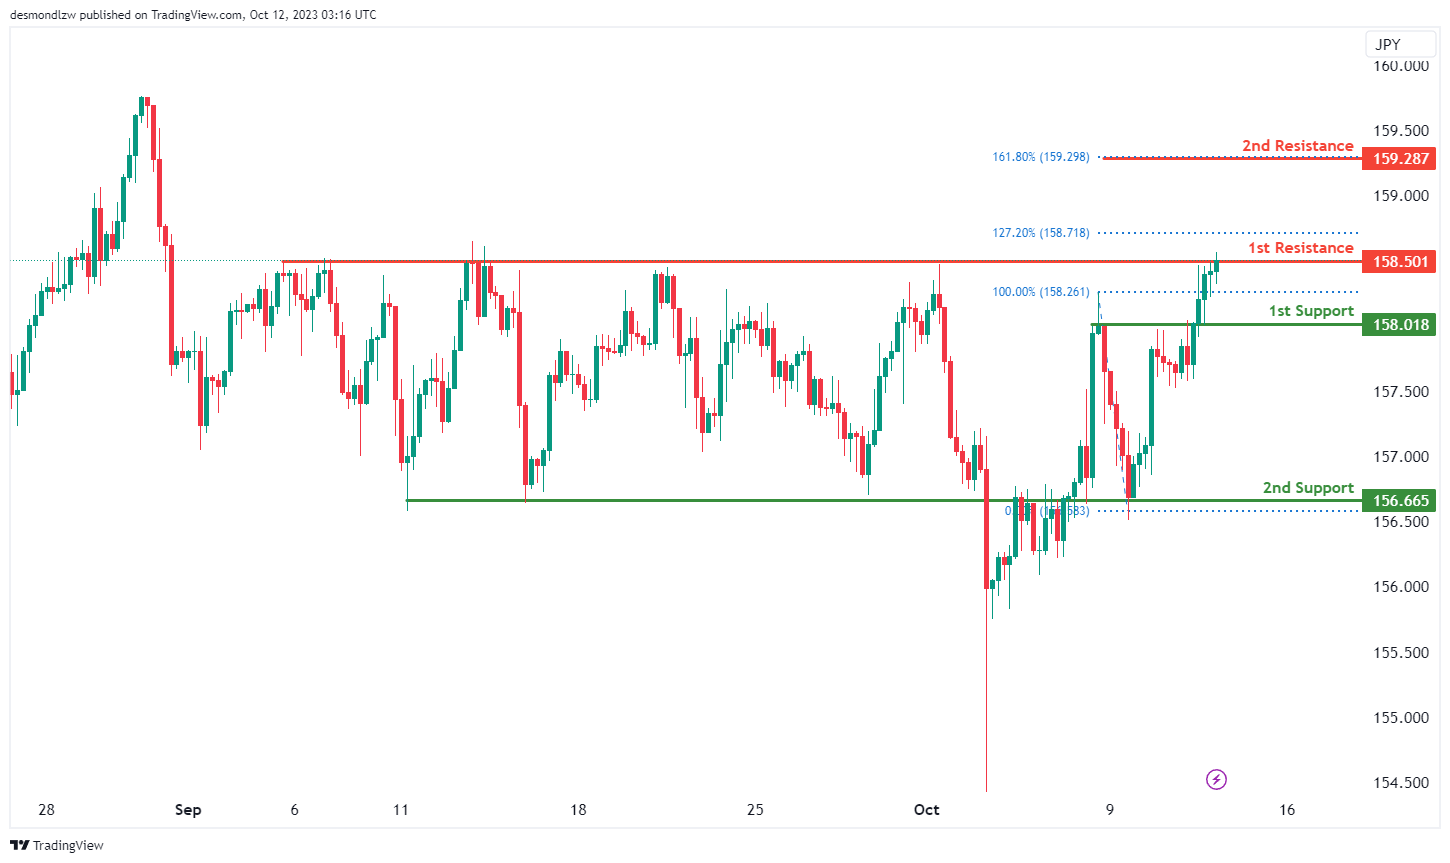
EUR/JPY:
The EUR/JPY chart currently demonstrates a bearish momentum, suggesting a potential scenario of a bearish reaction off the 1st resistance level, followed by a drop towards the 1st support.
The 1st support at 158.01 is considered significant as it’s identified as an overlap support, indicating a potential area where buying interest could materialize. Additionally, the 2nd support at 156.66 is also characterized as an overlap support, reinforcing its importance as a potential level for price rebounds.
On the resistance side, the 1st resistance level at 158.50 is identified as a multi-swing high resistance, making it a robust level where selling pressure may intensify, leading to a bearish reaction. Beyond this, the 2nd resistance at 159.28 is associated with the 161.80% Fibonacci Retracement, adding to its significance as a potential area where selling pressure may emerge.
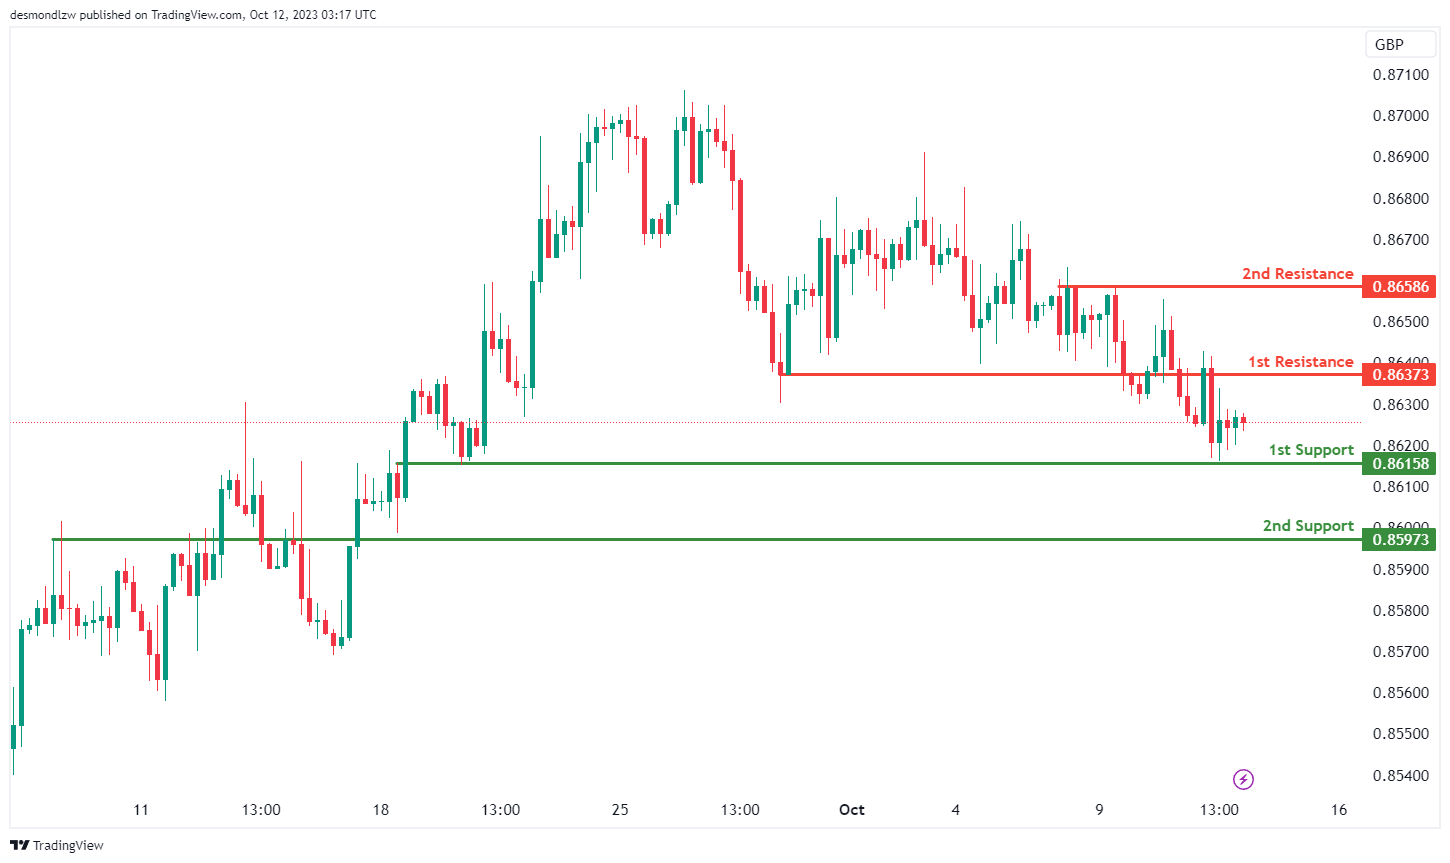
EUR/GBP:
The EUR/GBP chart is currently exhibiting a neutral momentum, indicating the potential scenario of price fluctuating between the 1st resistance and the 1st support level.
The 1st support at 0.8615 is considered significant as it’s identified as an overlap support. This level may attract buying interest and act as a potential area for price bounce. Additionally, the 2nd support at 0.8597 is also characterized as an overlap support, reinforcing its importance as a level where price could find support.
On the resistance side, the 1st resistance level at 0.8637 is identified as an overlap resistance, indicating a zone where selling pressure may increase. Beyond this, the 2nd resistance at 0.8658 is associated with multi-swing high resistance, making it another key level where sellers may become more active.
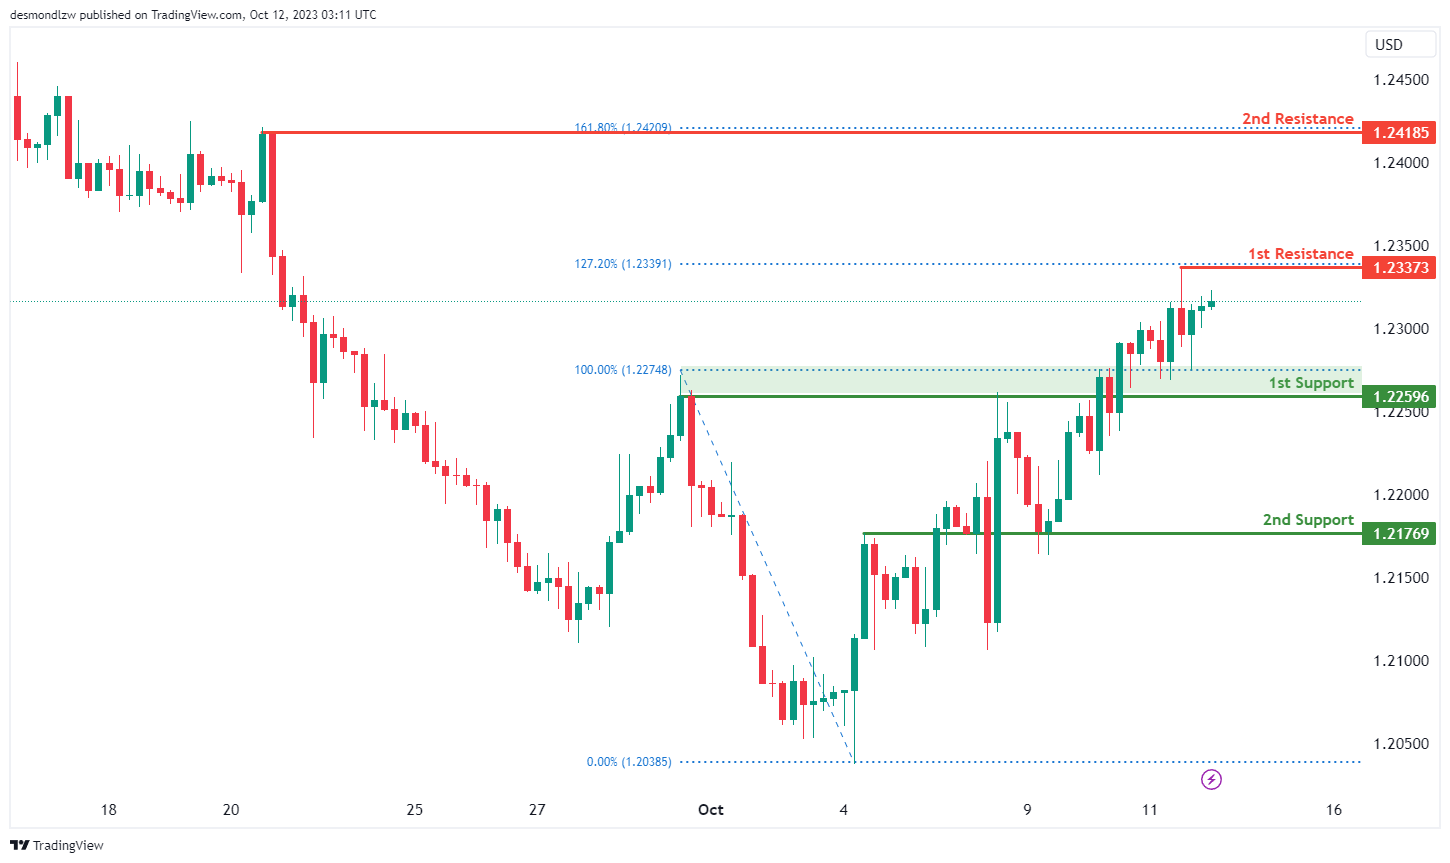
GBP/USD:
The GBP/USD chart currently exhibits bearish momentum, suggesting a potential scenario of a bearish reaction off the 1st resistance level, followed by a drop towards the 1st support.
The 1st support at 1.2259 is considered significant as it’s identified as an overlap support, indicating that it may act as a level where buying interest could emerge. Additionally, the 2nd support at 1.2176 is also characterized as an overlap support, reinforcing its importance as a potential level for price rebounds.
On the resistance side, the 1st resistance level at 1.2337 is identified as a swing high resistance, and it’s noteworthy for being located at the 127.20% Fibonacci Extension level, suggesting it could serve as a strong barrier to upward price movement. Beyond this, the 2nd resistance at 1.2418 is also characterized as a swing high resistance and is positioned at the 161.80% Fibonacci Extension level, further adding to its significance as a potential area where selling pressure may emerge.
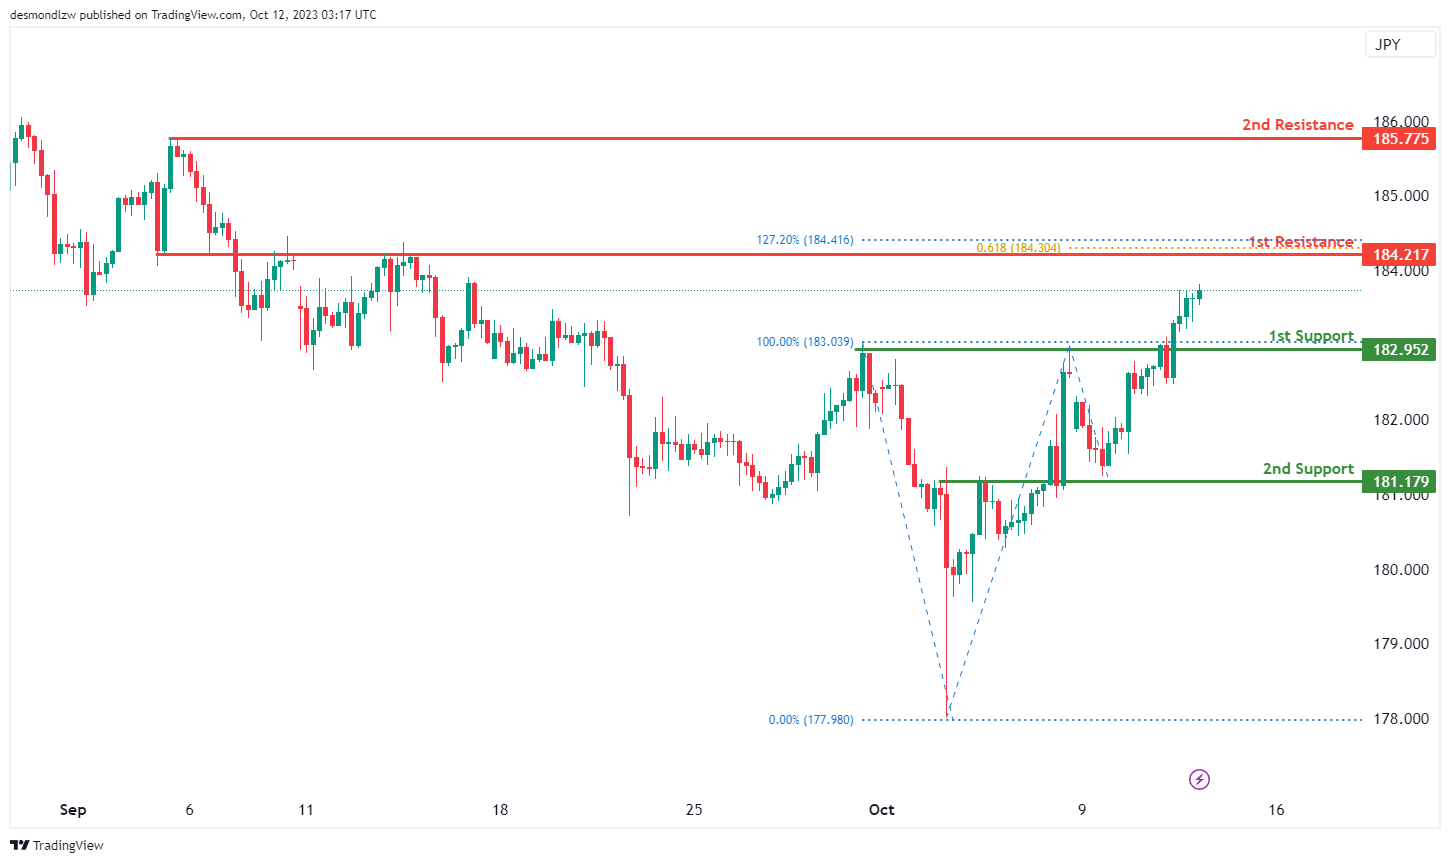
GBP/JPY:
The GBP/JPY chart currently exhibits a bullish momentum, suggesting the potential scenario of a bullish continuation towards the 1st resistance.
The 1st support at 182.95 is considered significant as it’s identified as a pullback support level. This support area may attract buying interest and provide a potential bounce for the price. Additionally, the 2nd support at 181.17 is characterized as an overlap support, reinforcing its importance as a level where price could find support.
On the resistance side, the 1st resistance level at 194.21 is identified as an overlap resistance, indicating a zone where selling pressure may increase. This level also coincides with both the 127.20% Fibonacci Extension and the 61.80% Fibonacci Projection, signifying a potential Fibonacci confluence zone, which could make it a strong resistance area. Beyond this, the 2nd resistance at 185.77 is associated with swing high resistance.
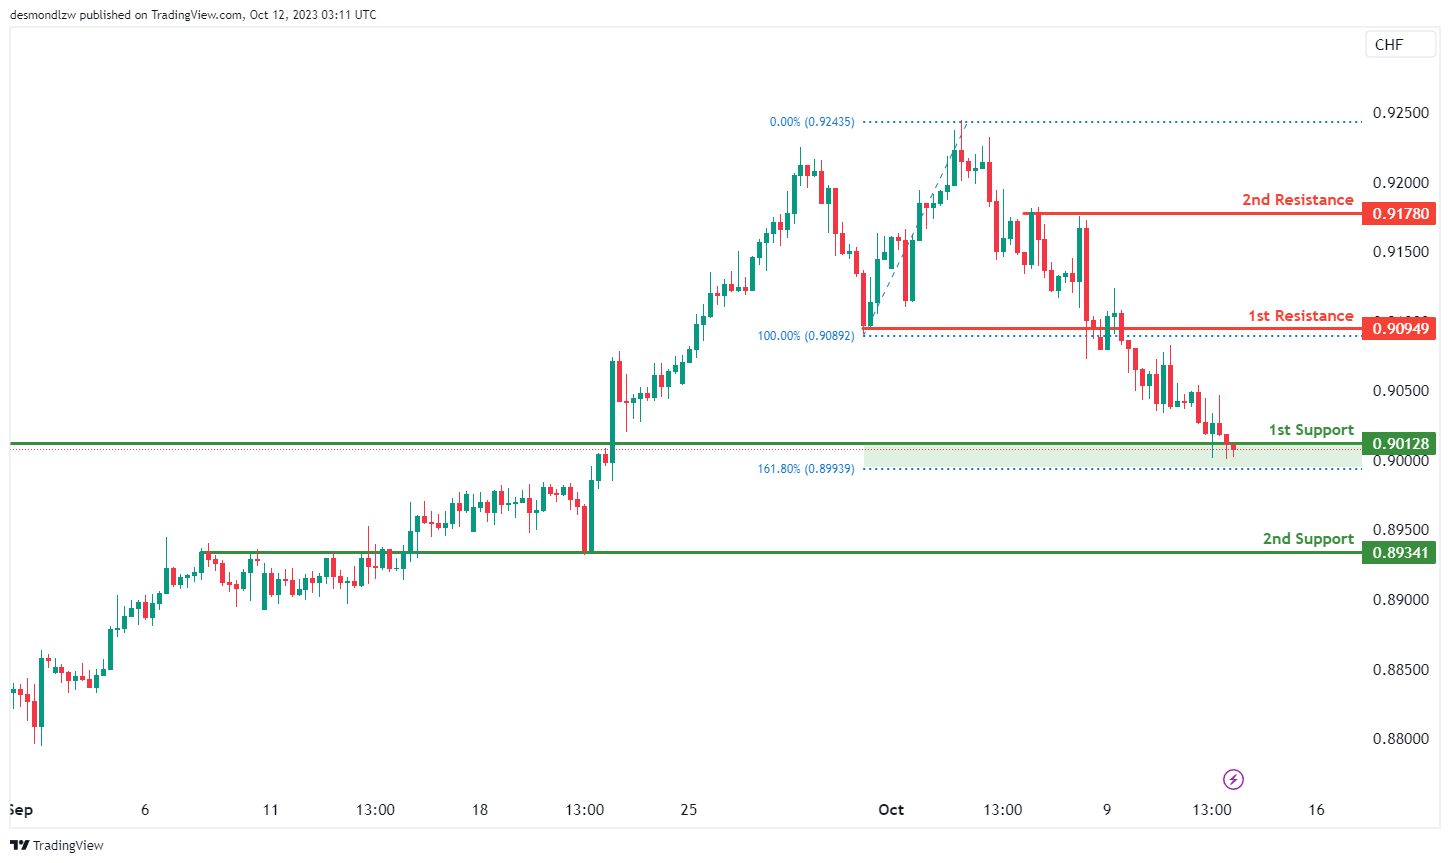
USD/CHF:
The USD/CHF chart currently exhibits bullish momentum, suggesting a potential scenario of a bullish bounce off the 1st support level, followed by a move towards the 1st resistance.
The 1st support at 0.9012 is considered significant as it’s identified as a pullback support, and it coincides with the 161.80% Fibonacci Extension level. This suggests that it may act as a strong level of support where buying interest could emerge. Additionally, the 2nd support at 0.8934 is characterized as an overlap support, reinforcing its importance as a potential level for price rebounds.
On the resistance side, the 1st resistance level at 0.9094 is identified as an overlap resistance, indicating that it may serve as a barrier to upward price movement. Beyond this, the 2nd resistance at 0.9178 is characterized as a multi-swing high resistance, further adding to its significance as a potential area where selling pressure may emerge.
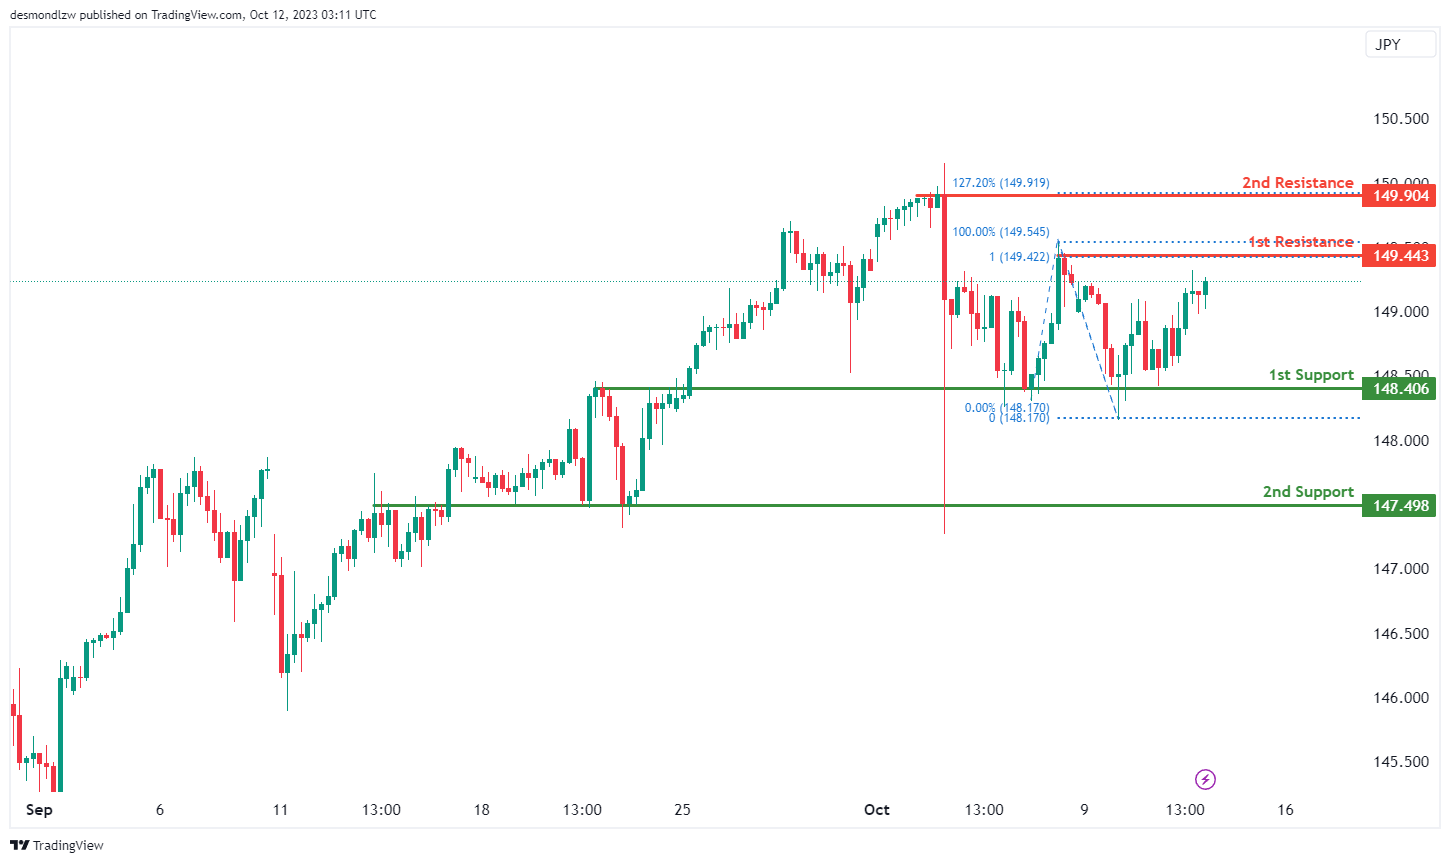
USD/JPY:
The USD/JPY chart currently exhibits bearish momentum, suggesting a potential scenario of a bearish reaction off the 1st resistance level, followed by a drop towards the 1st support.
The 1st support at 148.40 is considered significant as it’s identified as an overlap support, potentially acting as a strong level where buying interest could emerge. Additionally, the 2nd support at 147.49 is characterized as an overlap support, reinforcing its importance as a potential level for price rebounds.
On the resistance side, the 1st resistance level at 149.44 is identified as a swing high resistance, and it coincides with the 100% Fibonacci Projection, making it a robust level of resistance where selling pressure may intensify. Beyond this, the 2nd resistance at 149.90 is characterized as a multi-swing high resistance and aligns with the 127.20% Fibonacci Extension, further adding to its significance as a potential area where selling pressure may emerge.
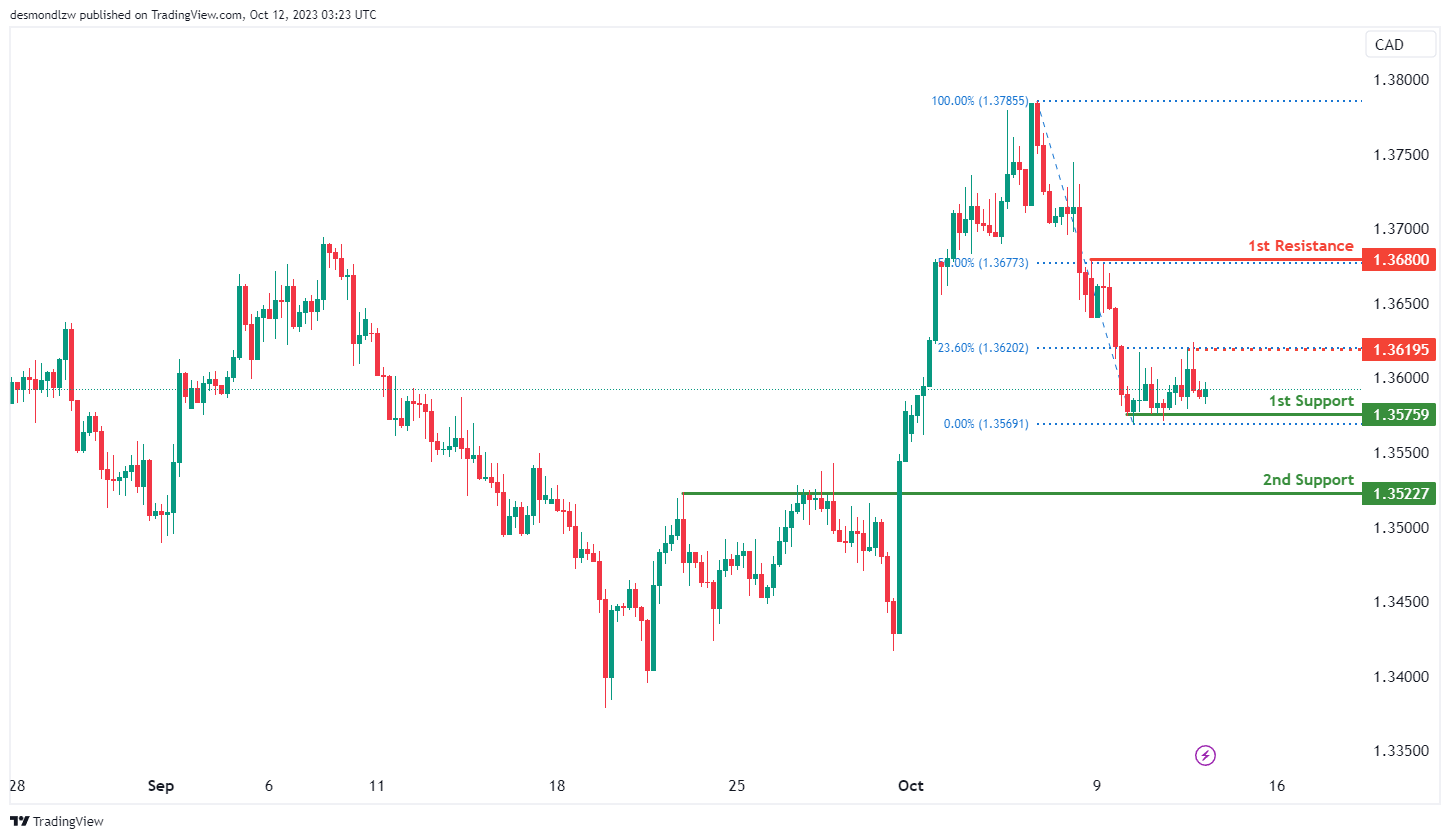
USD/CAD:
The USD/CAD chart is currently showing a neutral momentum with a potential scenario for price to fluctuate between the intermediate resistance and the 1st support levels.
The 1st support level at 1.3576 is identified as a pullback support. Additionally, the 2nd support level at 1.3523 is also noted as a pullback support, further reinforcing its significance as an area where the price may find support.
To the upside, the intermediate resistance at 1.3619 is identified as a pullback resistance that aligns with the 23.60% Fibonacci retracement level. Higher up, the 1st resistance level at 1.3680 is also marked as a pullback resistance that aligns with the 50.00% Fibonacci retracement level, further emphasizing its significance as a barrier for future price increases.
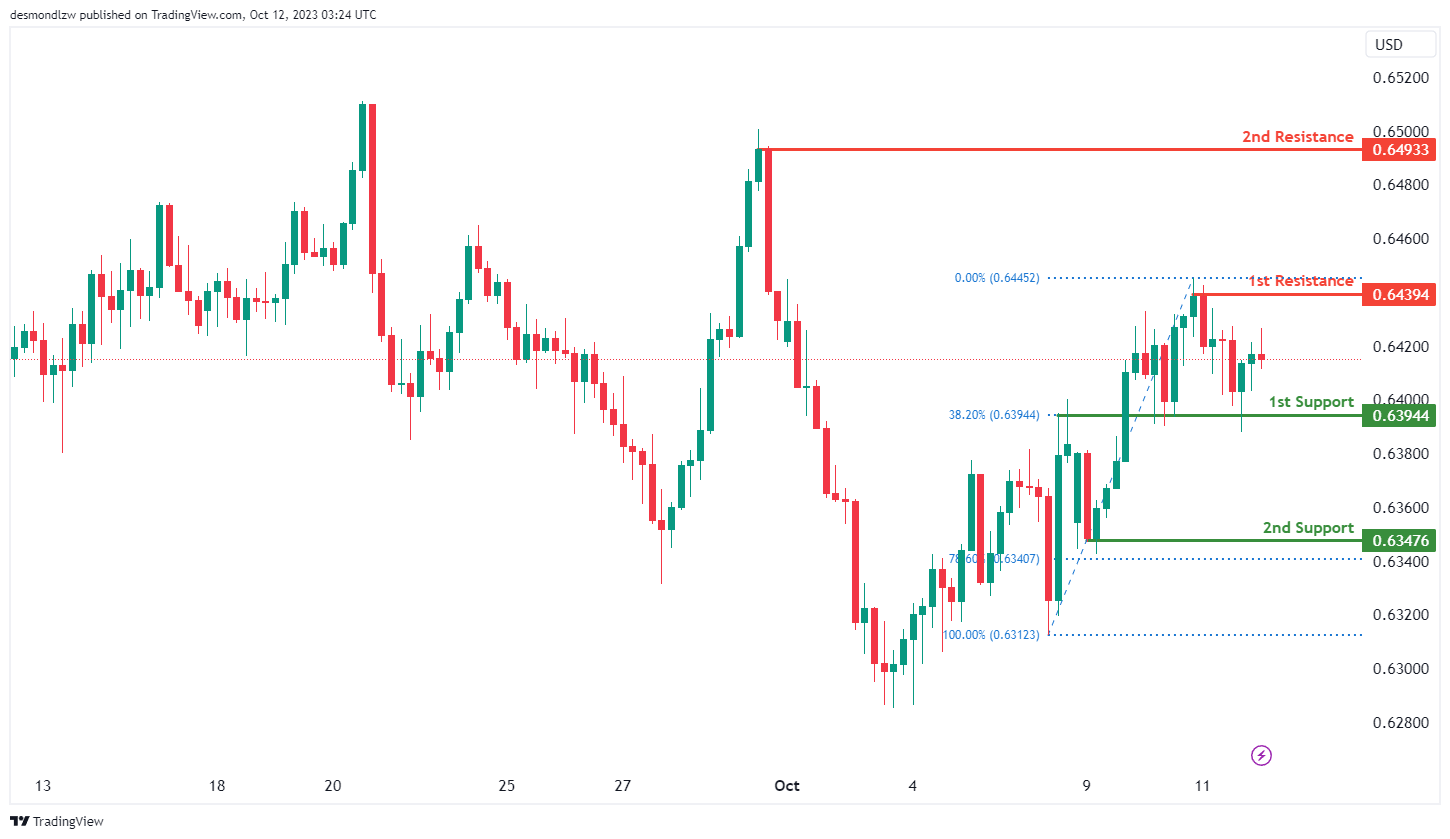
AUD/USD:
The AUD/USD chart currently exhibits a neutral momentum with a potential scenario for price to fluctuate between the 1st resistance and the 1st support levels.
The 1st support level at 0.6394 is identified as an overlap support that aligns with the 38.20% Fibonacci retracement level. Further below, the 2nd support level at 0.6348 is marked as a pullback support that aligns with the 78.60% Fibonacci retracement level, reinforcing its importance as a potential support level.
To the upside, the 1st resistance level at 0.6439 is identified as a pullback resistance. Additionally, the 2nd resistance level at 0.6493 is noted as a swing-high resistance, further emphasizing its significance as a barrier for future price increases.
NZD/USD
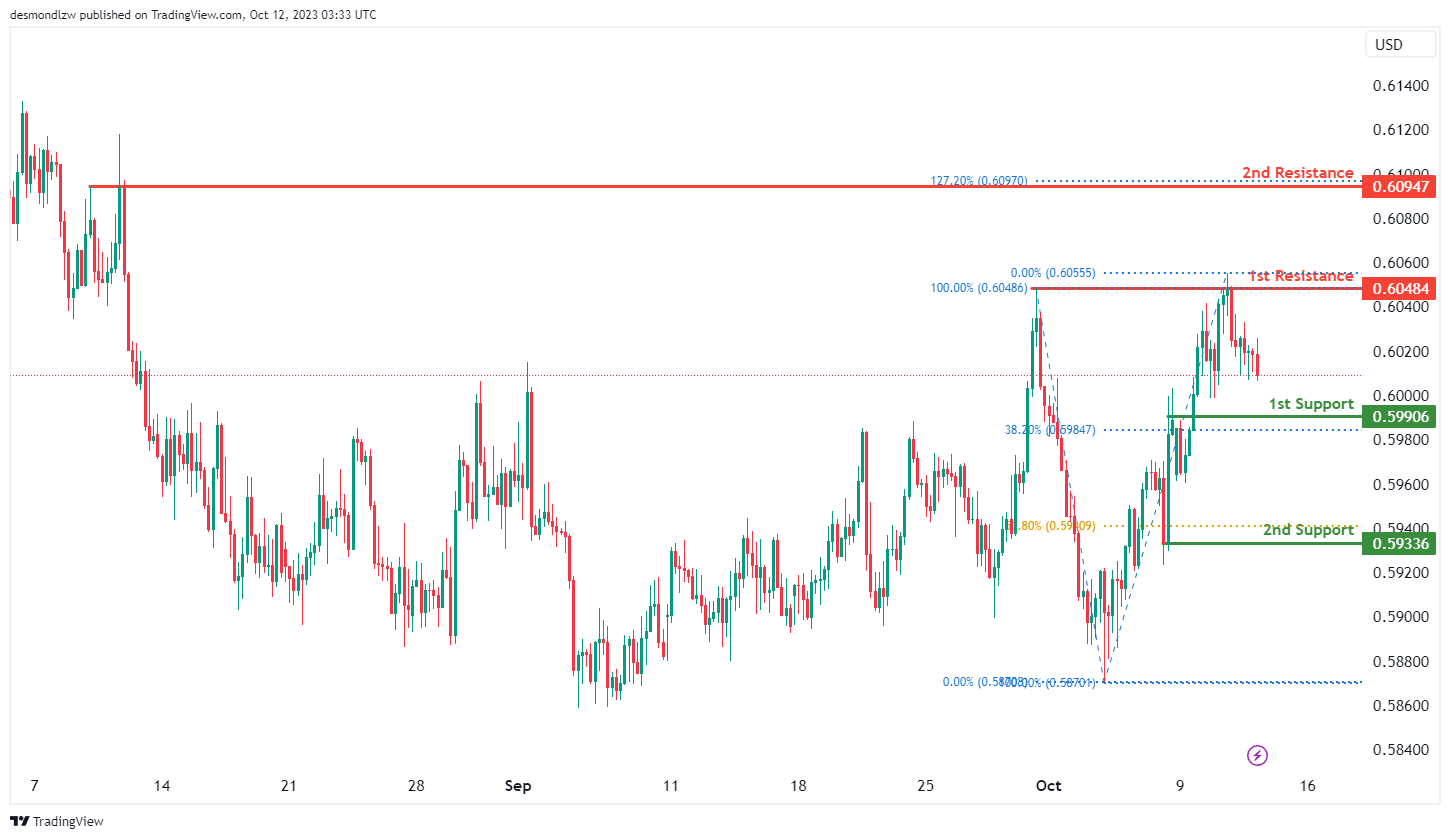
The NZD/USD chart currently exhibits an overall bearish momentum with a potential scenario for price to make a bearish continuation towards the 1st support level.
The 1st support level at 0.5991 is identified as a pullback support that aligns with the 38.20% Fibonacci retracement level. Further below, the 2nd support level at 0.5934 is also noted as a pullback support that aligns with the 61.80% Fibonacci retracement level, further reinforcing its significance as an area where price may find support.
The 1st resistance level at 0.6048 is identified as a pullback resistance. Additionally, the 2nd resistance level at 0.6095 is also marked as a pullback resistance that aligns with the 127.20% Fibonacci extension level, further emphasizing its significance as a barrier for future price increases.
DJ30:
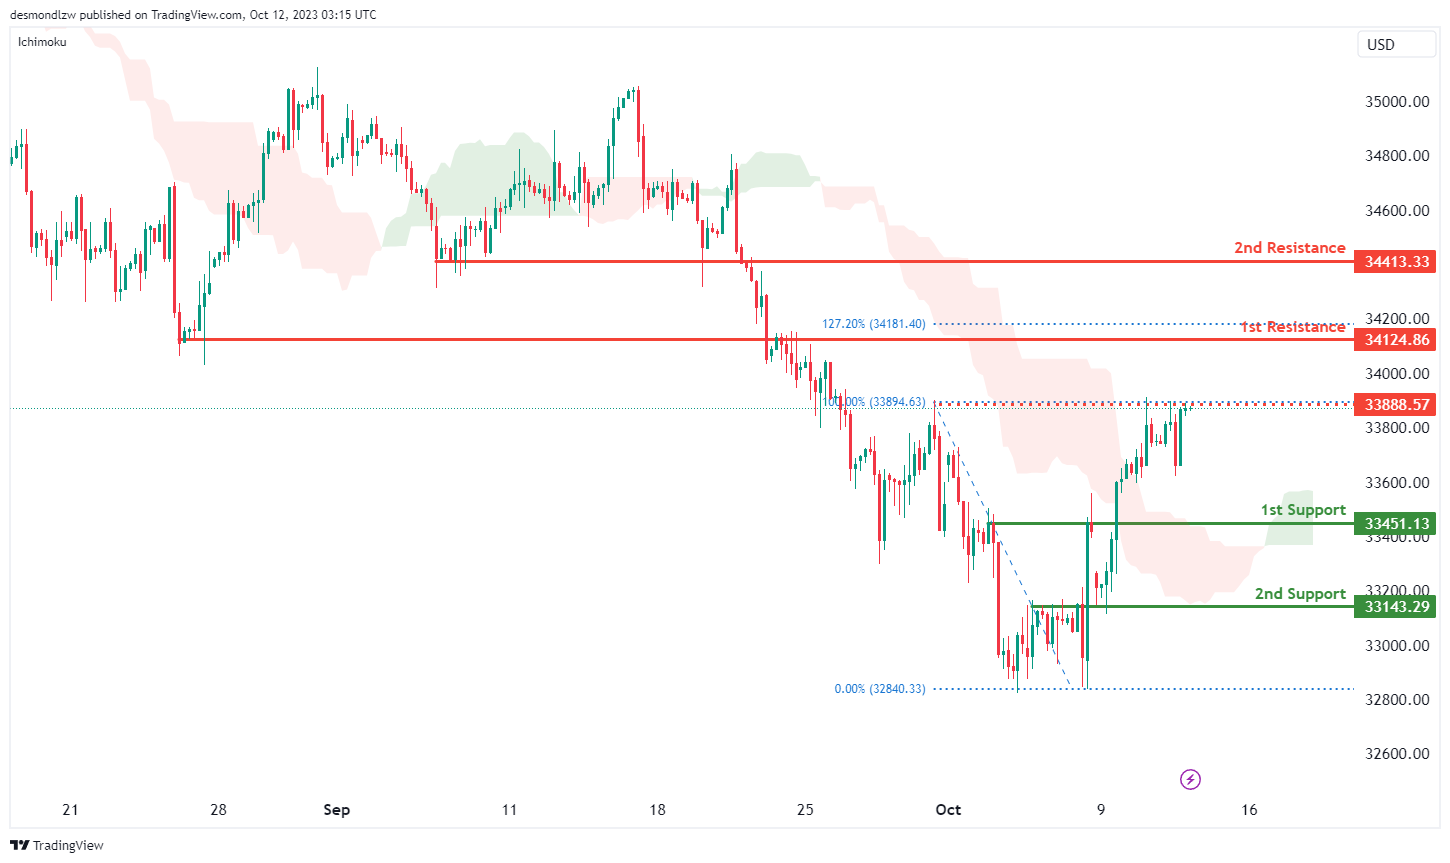
The DJ30 (Dow Jones Industrial Average) chart currently exhibits a bullish momentum, suggesting the potential scenario of a bullish continuation towards the 1st resistance.
The 1st support at 33451.13 is considered significant as it’s identified as a pullback support level. This support area may attract buying interest and provide a potential bounce for the price. Additionally, the 2nd support at 33143.29 is characterized as an overlap support, reinforcing its importance as a level where price could find support.
On the resistance side, the 1st resistance level at 34124.86 is identified as an overlap resistance, indicating a zone where selling pressure may increase. This level also coincides with the 127.20% Fibonacci Extension, signifying a potential Fibonacci confluence zone, which could make it a strong resistance area. Beyond this, the 2nd resistance at 34413.33 is associated with pullback resistance. There’s also an intermediate resistance at 33888.57, characterized as multi-swing high resistance.
GER40:
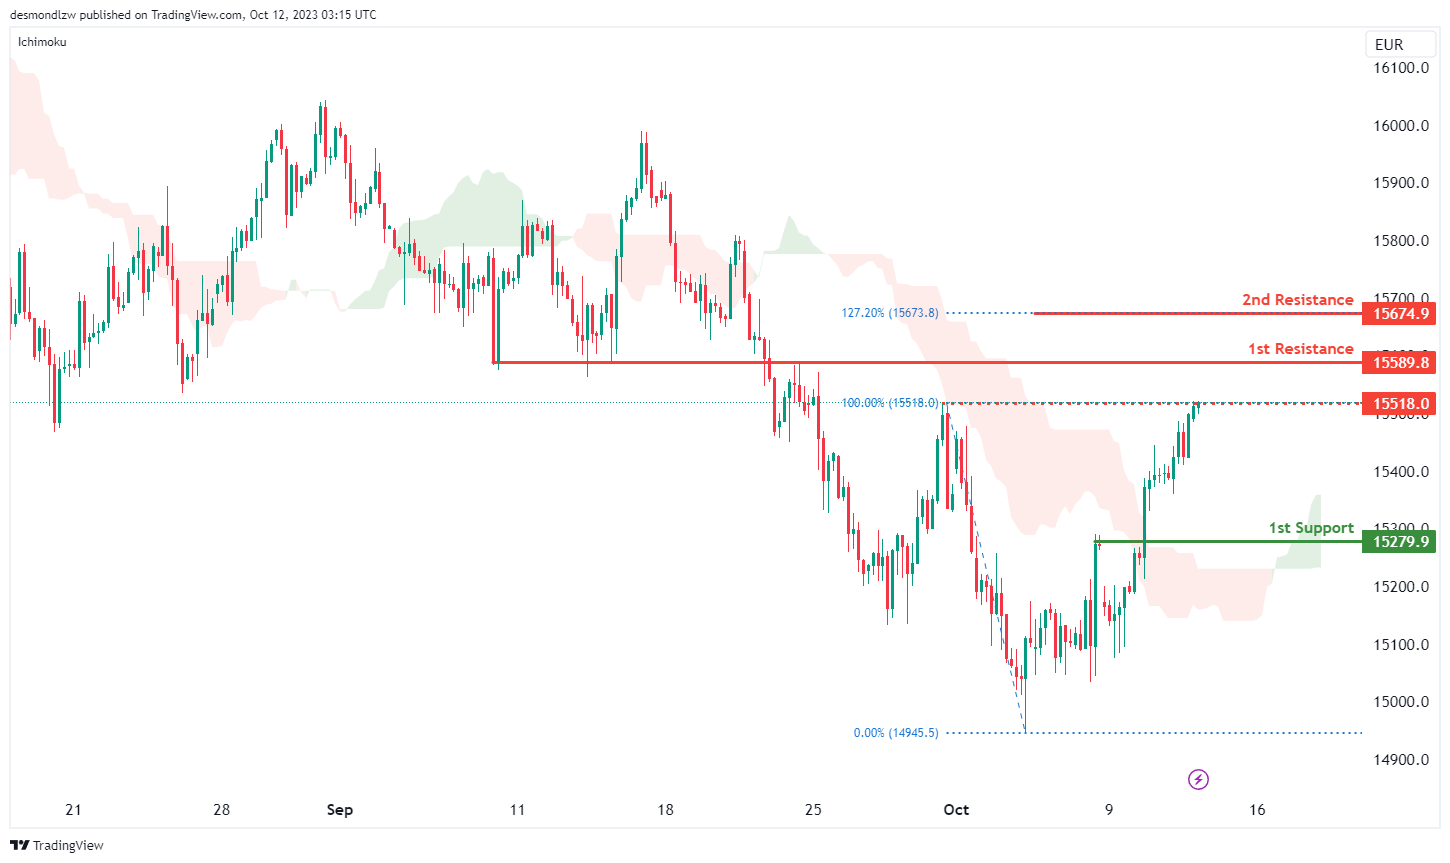
The GER40 (DAX) chart currently exhibits a bullish momentum, with price trading above the bullish Ichimoku cloud. This suggests a positive outlook for the chart.
The 1st support at 15279.90 is identified as a pullback support level, indicating that it could act as a significant area of price support, potentially preventing sharp declines.
On the resistance side, the 1st resistance level at 15589.80 is considered an overlap resistance. This level may present a zone where selling interest could emerge. Additionally, the 2nd resistance at 15674.90 is noted, and it coincides with the 127.20% Fibonacci Extension, which may act as a strong resistance area due to this Fibonacci confluence. There is also an intermediate resistance at 15518.00, characterized as a swing high resistance.
US500
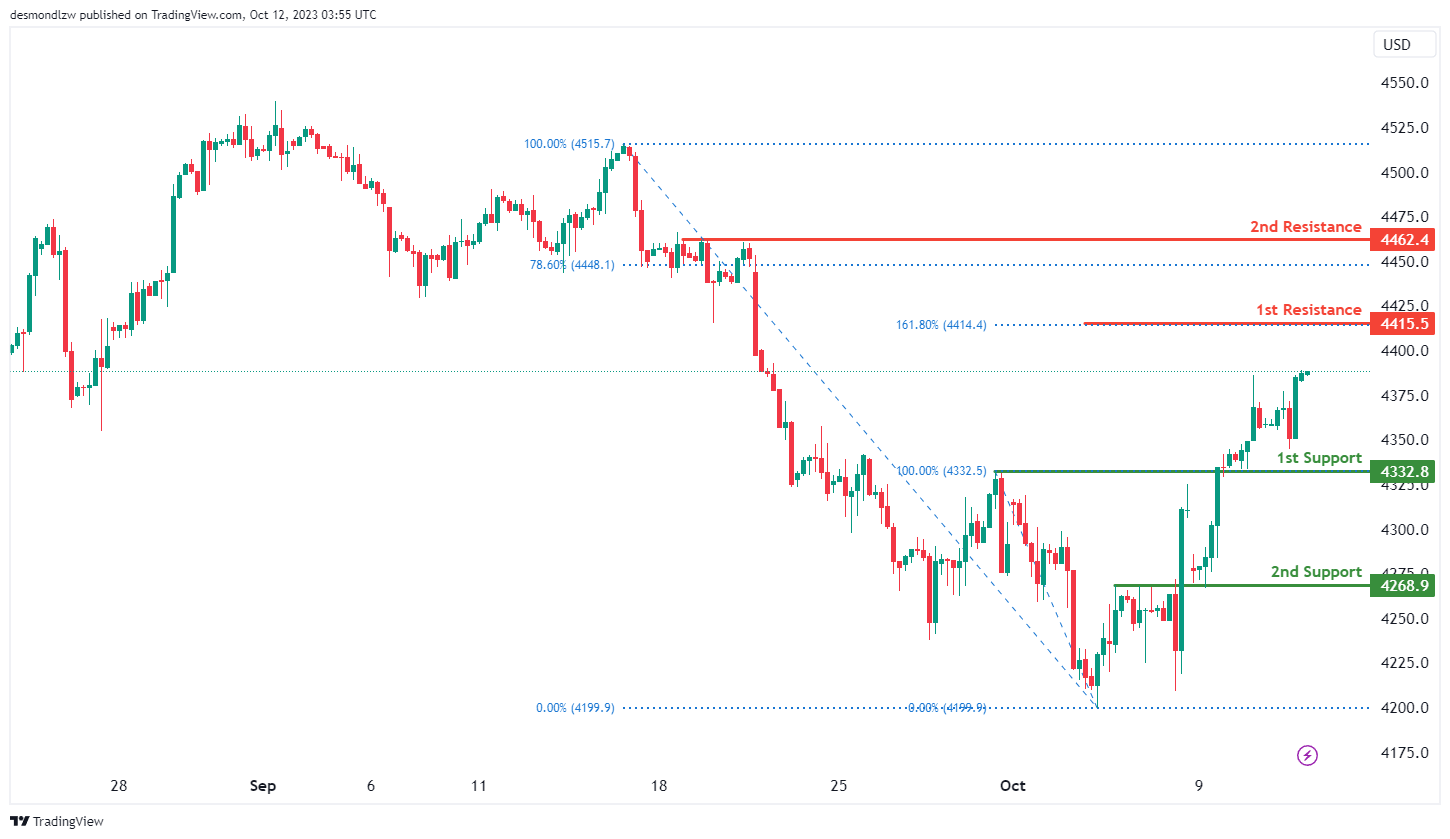
The S&P 500 (US500) chart is currently showing an overall bullish momentum with a potential for price to make a bullish continuation towards the 1st resistance level.
The 1st resistance level at 4,415.50 is identified as a resistance that aligns with the 161.80% Fibonacci extension level. Higher up, the 2nd resistance level at 4,462.40 is noted as a pullback resistance that aligns close to the 78.60% Fibonacci retracement level.
To the downside, the 1st support level at 4,332.80 is identified as an overlap support. Additionally, the 2nd support level at 4,268.90 is also marked as an overlap support.
BTC/USD:
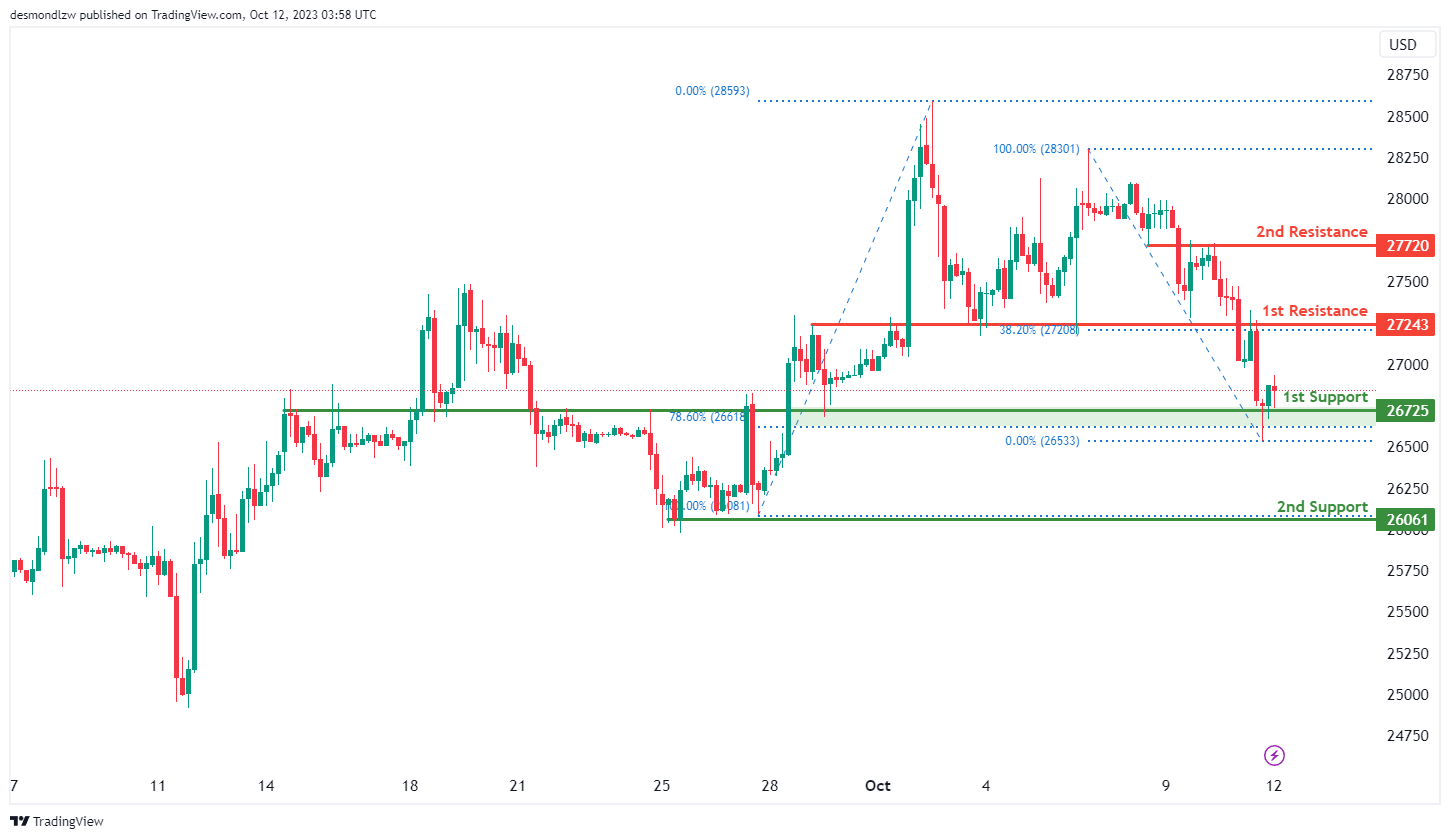
The Bitcoin (BTC/USD) chart currently exhibits an overall bearish momentum with a potential scenario for price to make a bearish continuation towards the 1st support level.
The 1st support level at 26,725.00 is identified as an overlap support that aligns with the 78.60% Fibonacci retracement level. Further below, the 2nd support level at 26,061.00 is noted as a pullback support.
To the upside, the 1st resistance level at 27,243.00 is identified as an overlap resistance that aligns with the 38.20% Fibonacci retracement level. Higher up, the 2nd resistance level at 27,720.00 is also marked as an overlap resistance.
ETH/USD:
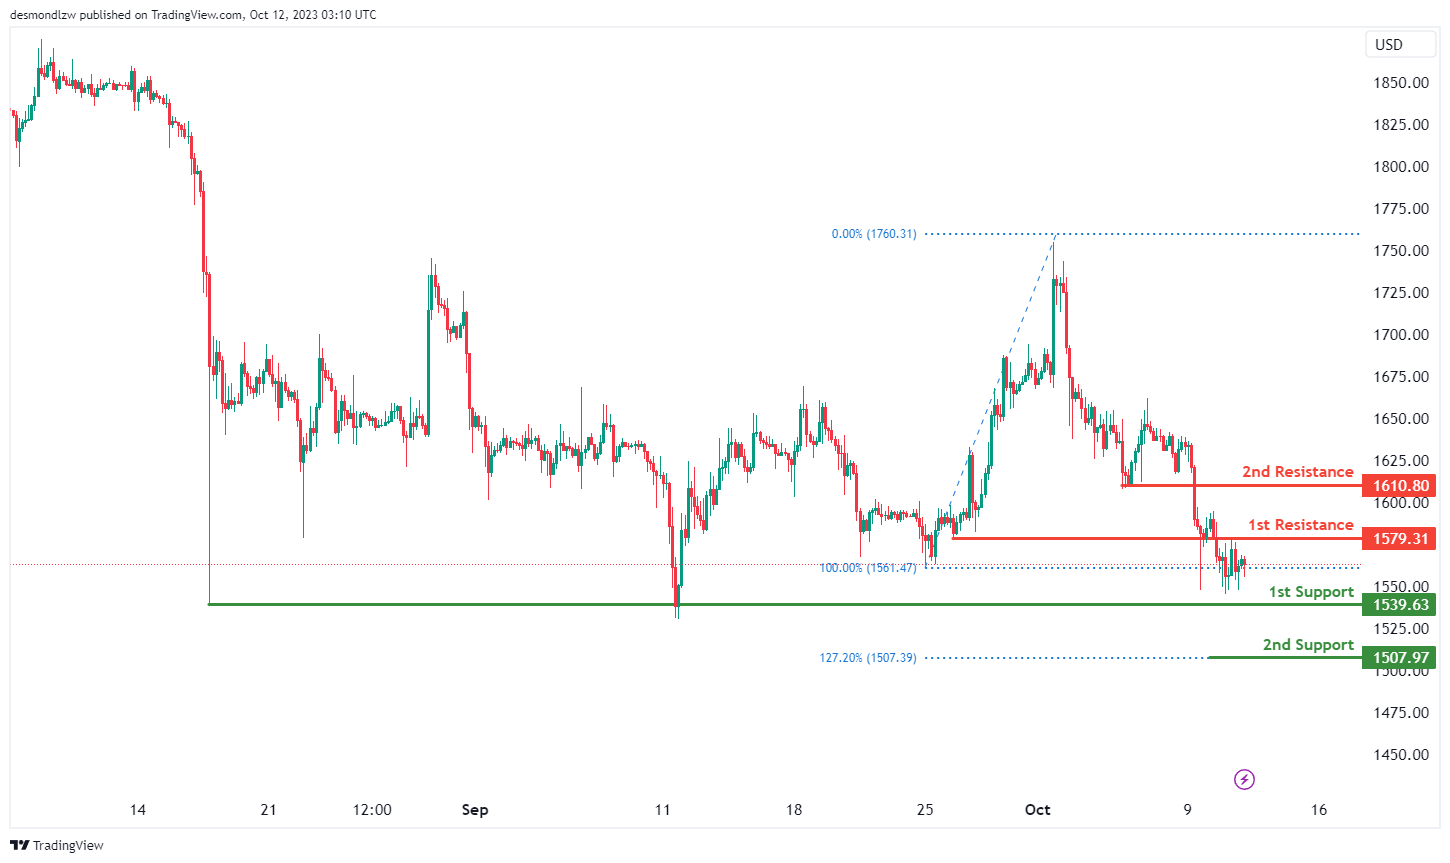
The Ethereum (ETH/USD) chart currently exhibits a neutral momentum with a potential scenario for price to fluctuate between the 1st resistance and the 1st support levels.
The 1st support level at 1,539.63 is identified as a pullback support. Further below, the 2nd support level at 1,507.97 is noted as a support level that aligns with the 127.20% Fibonacci extension level.
To the upside, the 1st resistance level at 1,579.31 is identified as an overlap resistance. Higher up, the 2nd resistance level at 1,610.80 is marked as a pullback resistance.
WTI/USD:
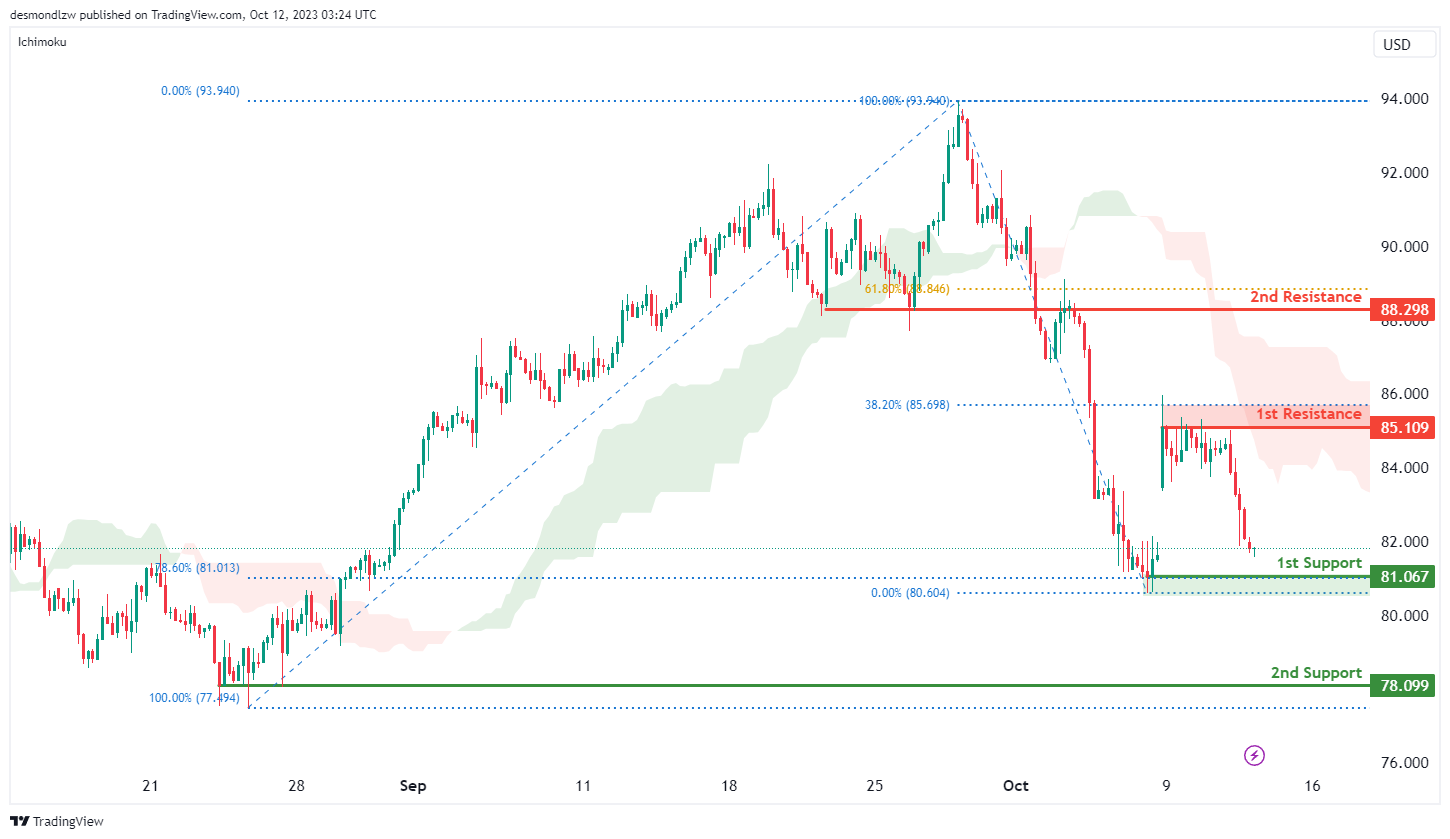
The WTI chart currently exhibits an overall bearish momentum with price trading under the bearish Ichimoku cloud. There is a potential scenario for price to make a bearish continuation towards the 1st support level.
The 1st support level at 81.07 is identified as a pullback support that aligns with the 78.60% Fibonacci retracement level. Additionally, the 2nd support level at 78.09 is also noted as pullback support, further reinforcing its significance as an area where price may find support.
The 1st resistance level at 85.11 is identified as a pullback resistance that aligns close to the 38.20% Fibonacci retracement level. Higher up, the 2nd resistance level at 88.29 is noted as an overlap resistance that aligns close to the 61.80% Fibonacci retracement level, potentially acting as a barrier to further upward movement.
XAU/USD (GOLD):
The XAU/USD chart currently exhibits a bearish momentum, indicating a potential scenario of a bearish reaction off the 1st resistance level, followed by a drop towards the 1st support.
The 1st support at 1863.10 is considered significant as it’s identified as a pullback support, potentially acting as a strong level where buying interest could emerge. Additionally, the 2nd support at 1852.53 is characterized as an overlap support, reinforcing its importance as a potential level for price rebounds.
On the resistance side, the 1st resistance level at 1885.08 is identified as a pullback resistance, and it coincides with the 50% Fibonacci Retracement level, making it a robust level of resistance where selling pressure may intensify. Beyond this, the 2nd resistance at 1901.18 is characterized as an overlap resistance, further adding to its significance as a potential area where selling pressure may emerge.