

Sample Category Title
Does Gold Bugs Capitulation Mean Reversal is Imminent?
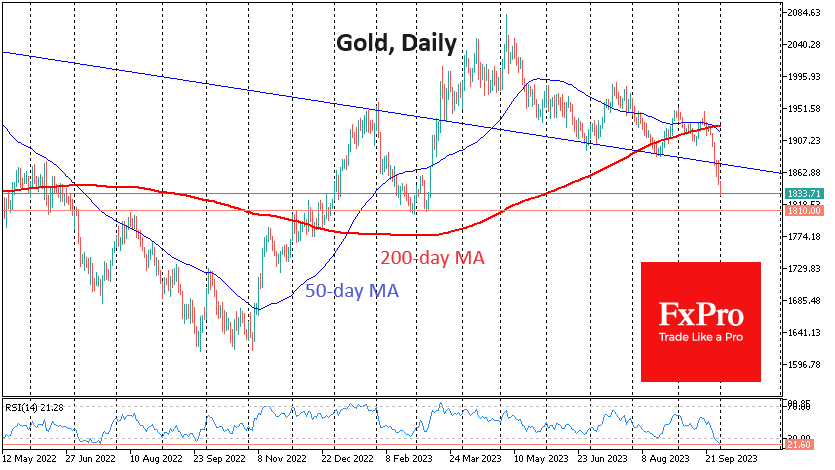
Gold lost almost 4% last week, the biggest drop in over two years. The price of a troy ounce fell below $1835, its lowest level since March. Gold’s sell-off last week looked like a capitulation of the bulls, with a break of multi-month support. This could soon be followed by increased volatility with new lows. It is often at times like this that market inflexion points are formed.
Last week, gold accelerated its decline by breaking the support of the downtrend channel of recent months. The last time gold traded at such a low was over six months ago, when the US regional banking crisis triggered an influx of buyers, pushing the price away from support around $1810.
Then, as now, the pressure on gold came from rising US government bond yields and a reassessment of expectations for higher long-term interest rates. In our view, the key difference in market sentiment is that a sell-off in gold accompanied last week’s sharp rise in cryptocurrencies.
In the short term, gold is oversold, creating the potential for a corrective bounce. On the daily chart, the RSI oscillator has dropped to 21.6. The last time the indicator recorded such low levels was in June and August 2018, when a reversal from decline to growth was forming in gold for the following years.
It may well be that this acceleration in gold’s decline is a sign that the fall is nearing its end, but it is still a case where it is better to be a little late to the rally than to buy in.
After falling below $1890, gold has been in thin air territory since March with no significant support levels. The nearest support remains at $1810. Around this level, gold found buyers with deep pockets in March.
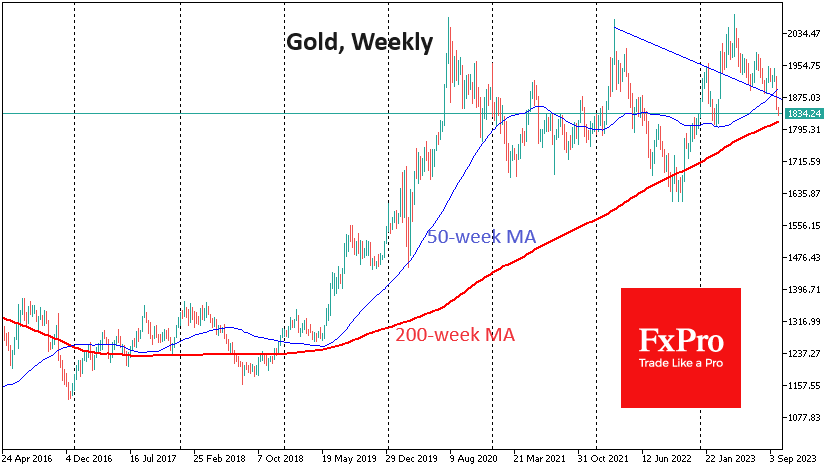
Not far from this level is the 200-week moving average. This is an essential indicator of the ultra-long-term trend. Over the past six years, gold has been bought on dips below this line, keeping it below 3.5%. This lower line of defence is not far from $1750.
If a further $80 drop from current levels is not appetising enough for long-term buyers, a new bear market in gold will have to be established.
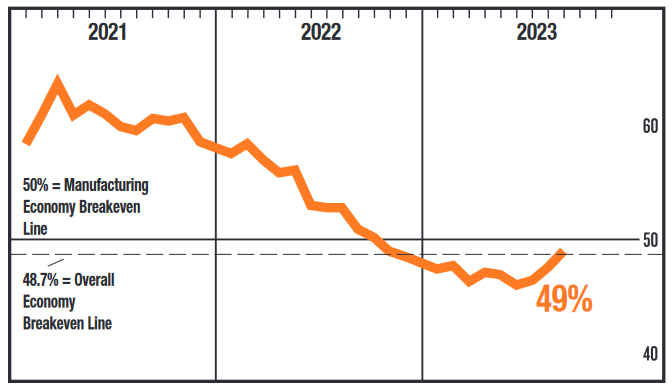
US ISM manufacturing rose to 49.0, highest since last Nov
US ISM Manufacturing PMI exhibited an encouraging uptick in September, climbing to 49.0 from 47.6, surpassing the anticipated 47.9. Although the manufacturing sector is still in the grip of contraction, the pace has slackened, marking the sector's finest performance since November 2022. September's reading marks the 11th consecutive month of contraction, but also the third month showcasing an improvement.
Diving into the particulars, several key indices within the PMI reported positive shifts. New orders swelled to 49.2 from 46.8, and production amplified its reach, moving from 50.0 to 52.5. Furthermore, the employment index turned the corner, ascending from 48.5 to 51.2, signalling an uplift in hiring within the sector. However, not all indices saw a rise. The prices index experienced a substantial dip, plummeting from 48.4 to 43.8, reflecting a significant reduction in input costs.
When examining the historical correlation between the Manufacturing PMI and the broader economy, September's 49.0 reading translates to a 0.1% increase in real gross domestic product on an annualized basis. It implies that, despite the continued contraction, the manufacturing sector's decline is moderating, potentially heralding a turning point in upcoming months.
Sunset Market Commentary
Markets:
New month/quarter, but no profound change in market trends. On the contrary. After a brief rebound of bonds on Thursday and on Friday, previous trends apparently still have some way to go, especially if this week’s US data confirm ongoing resilience in activity and/or key labour market. The US avoiding a government shutdown and a solid Japan BOJ tankan report in essence shouldn’t be major news for markets. Even so, it’s enough a pretext for yields to take the way north again. A lot of Fed and ECB speakers are scheduled to give their view this week. Recent comments suggest that a majority of the Fed governors is holding to the narrative that an additional rate might be needed to balance supply and demand in a way that is enough to bring inflation to target in a sustainable way. In this respect, Richmond Fed president Barkin made some interesting remarks on the strength of the housing market, with housing prices hardly declining despite the Fed’s aggressive hiking cycle. If the housing market turns out to have made a secular shift, becoming less sensitive to higher interest rates, it might be necessary that prices in other parts of the economy should lessen a bit more. Whatever the reason, US yields are rising between 7 bps (5-y) and 6 bps (2y & 30-y). The US manufacturing ISM, to be released after finishing this report is the first really important reference. Fed Powell also joins a roundtable discussion later today. In case of a solid ISM report and/or hawkish message from Powell, US yields at maturities >5-y have a good chance of ending the day at new cycle peak closing levels. European bonds again outperform their US counterparts with German yields adding between 1,5 bps (2-y) and 5 bps (30-y). European investors are reluctant to already place bets on an additional ECB hike. However, the global ‘higher for longer narrative’ and trend for higher real yields at longer maturities also protects the downside in European yields. The start of the new quarter, didn’t inspire equity investors. The Eurostoxx 50 is ceding 0.5%, holding well below the previous 4200 range bottom. US indices also open with small losses. After taking a breather end last week, the dollar firmly takes the upper hand. The TW DXY index jumps from 106.17 late on Friday to currently 106.55. EUR/USD at 1.053 again has the 2023 low (1.0484) on the radar. USD/JPY (149.8) is only a whisker away from the 150 barrier. Markets are pondering the chances of MoF interventions to prevent further yen losses. Question remains on the efficacity of such action if an important part of the driver of the move is USD strength, next to yen weakness. Sterling gains marginally against the euro (EUR/GBP 0.866) but is holding within its recent consolidation pattern (0.863/0.8706).
News & Views:
The Czech manufacturing PMI fell more than expected in September (41.7 from 42.9 vs 42.5 consensus). The PMI fell below the 50 boom-bust mark in June last year and hasn’t really recovered since. Another sharp monthly contraction in new orders dragged output, with foreign client demand also dissipating amid challenging economic conditions in key export markets. Jobs were cut at the sharpest pace in over three years. Efforts to cut costs and improve cash flow led to the steepest drop in stocks of purchases in over 14 years. Pre-production inventories and stocks of finished items shrank as well. Muted demand for goods and inputs sparked further cuts to input costs and output charges, as firms and suppliers alike sought to drive sales. Czech goods producers still anticipate higher output over the coming year, but the degree of optimism dropped to the lowest in 2023 so far. The Czech PMI bolsters the case for CNB rate cut. The central bank indicated last week that both November and December gatherings are “live” meetings. Our preferred scenario is a 50 bps rate cut in December. The Polish manufacturing PMI improved marginally (43.9 from 43.1 vs 43.6 consensus). Details showed similar broad-based weakness like the Czech reading with further sharp falls in new orders, output, backlogs and input purchases albeit more slowly than in August. Employment was cut at the fastest in a year. Both input and output prices fell for the sixth month running. On a small bright note, forward-looking Future Output Index signaled the strongest 12 month outlook since March. The Polish zloty stabilized in the EUR/PLN 4.6-4.7 range after being whacked by the NBP’s unexpected 75 bps rate cut early September. NBP and government officials afterwards pushed back against the idea of similar cuts in October. The NBP will announce its policy decision on Wednesday.
Euro/Dollar Exchange Rate Remains Near its Lowest Levels
The main currency pair starts the week and the month by consolidating around the 1.0569 mark.
The US Federal Reserve's intention to potentially raise interest rates once again in 2023 is strengthening the position of the USD. The 10-year treasury bonds yield in the US remains at long-term highs regardless of a minor correction.
This week, statistics will be abundant in both the US and the eurozone. Employment sector reports for September in the US are expected to show stabilisation without any notable catalysts.
The eurozone will report on retail sales in August, the PPI, and business activity in the services sector. All these reports will provide insight into the state of the economic system. It is not certain whether there will be any catalyst among the European statistics to support the EUR, although this possibility exists.
Technical analysis of EUR/USD currency pair:
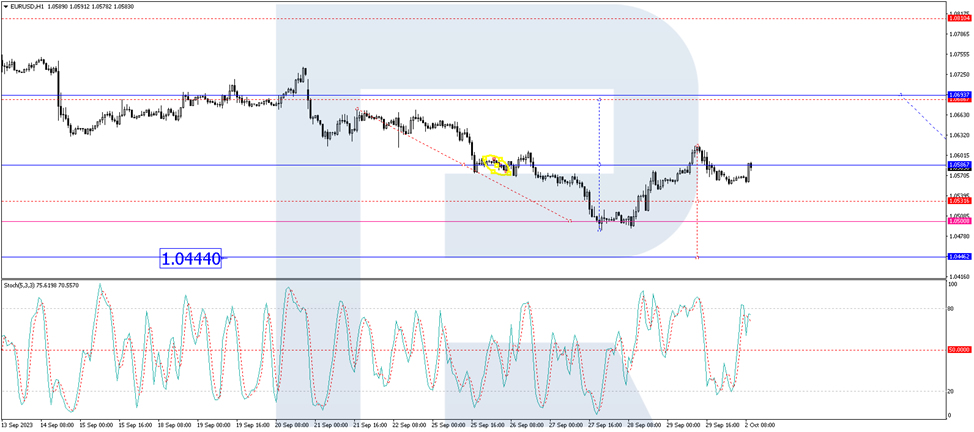
On the EURUSD H4 chart, a consolidation range has formed around 1.0700, reaching the local target of a declining wave at 1.0500 upon escaping the range downwards. Today the market has corrected to 1.0615. A new link of correction to 1.0620 is not excluded, followed by a decline to 1.0440. After reaching this level, a correction to 1.0700 could follow (with a test from below). Next, a decline to 1.0140 is expected. Technically, this scenario is confirmed by the MACD, whose signal line is below zero. The indicator is expected to set new lows.
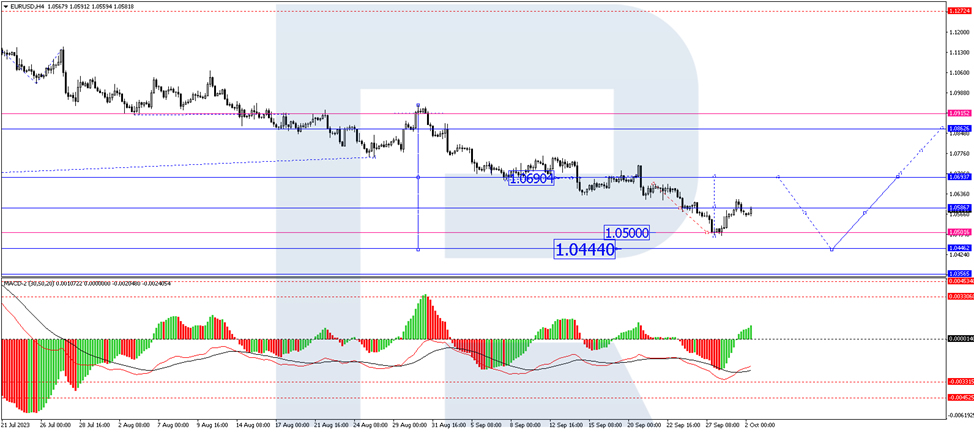
On the EURUSD H1 chart, a movement in a declining wave to 1.0440 is forming. By now, the market has completed a consolidation range of around 1.0586, reaching the local target of a declining wave at 1.0500 with an escape from the range downwards. A link of correction to 1.0615 has formed today. A new price hike to 1.0620 is not excluded. Next, a new declining movement to 1.0440 is expected, followed by a rise to 1.0700. Technically, this scenario is confirmed by the Stochastic oscillator, whose signal line has rebounded from the 80 mark and is currently pointing sharply downwards. The line might eventually fall to the 20 mark.
USD/JPY Mid-Day Outlook
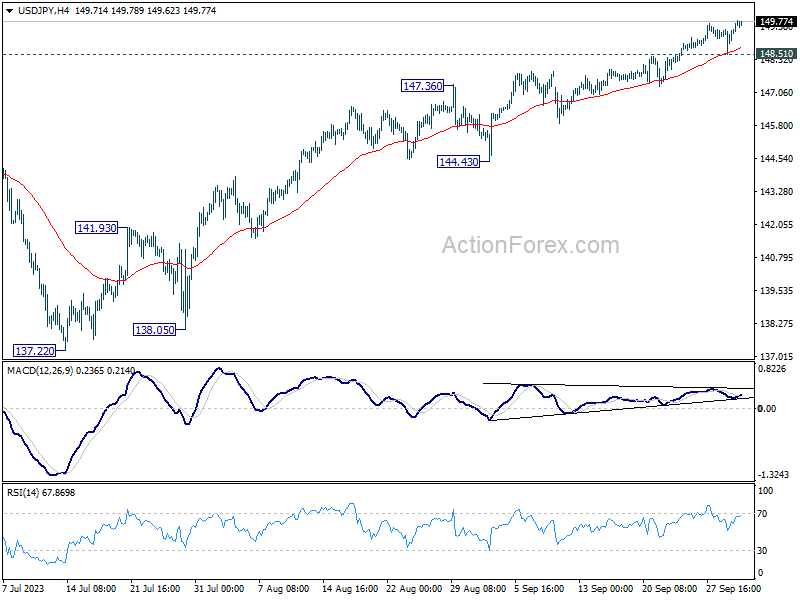
Daily Pivots: (S1) 148.76; (P) 149.13; (R1) 149.73; More...
Intraday bias in USD/JPY remains on the upside for the moment. Current rise from 127.20 should target a retest on 151.93 high next. On the downside, break of 148.51 support is needed to indicate short term topping. Otherwise, outlook will stay bullish in case of retreat.
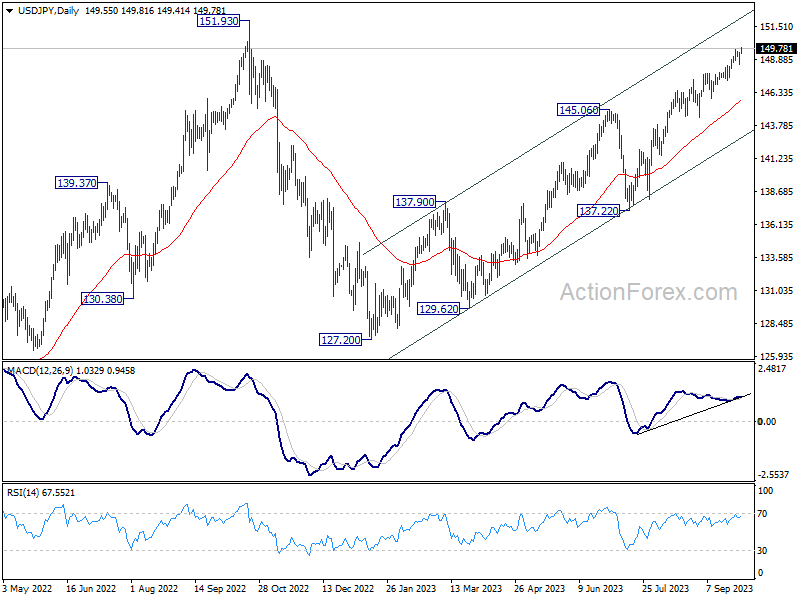
In the bigger picture, while rise from 127.20 is strong, it could still be seen as the second leg of the corrective pattern from 151.93 (2022 high). Rejection by 151.93, followed by break of 145.06 resistance turned support will be the first sign that the third leg of the pattern has started. However, sustained break of 151.93 will confirm resumption of long term up trend.
USD/CHF Mid-Day Outlook
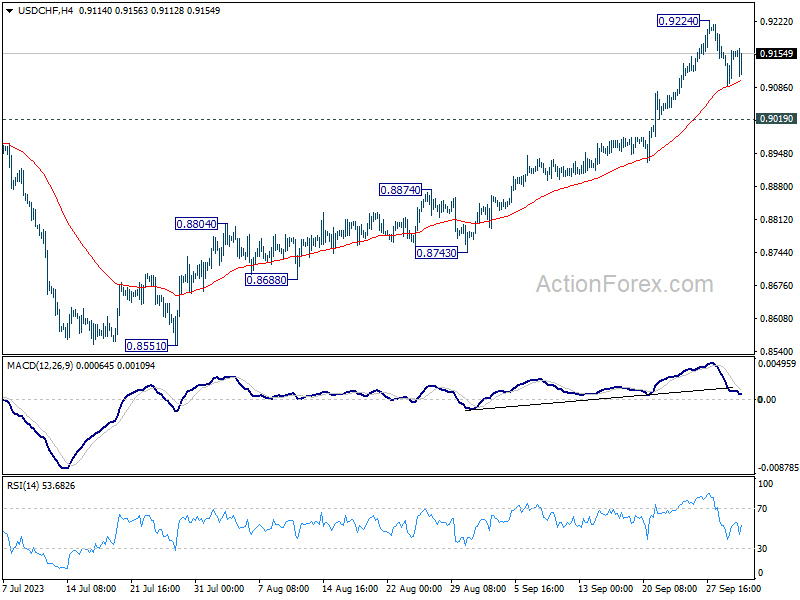
Daily Pivots: (S1) 0.9107; (P) 0.9135; (R1) 0.9180; More....
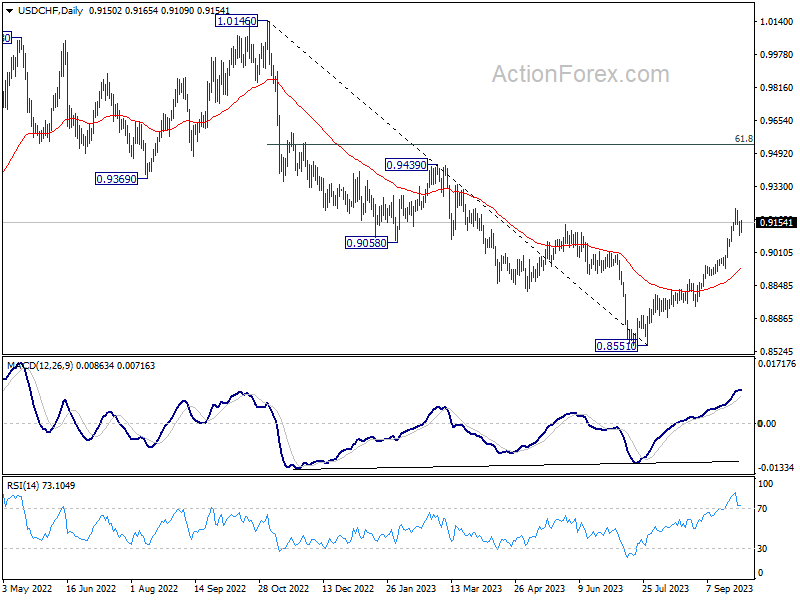
USD/CHF is staying in consolidation from 0.9224 and intraday bias remains neutral. Deeper retreat cannot be ruled out. But near term outlook will stay bullish as long as 0.9019 support holds. On the upside, break of 0.9224 will resume the rally from 0.8551 to 0.9439 resistance next.
In the bigger picture, current development indicates that rise from 0.8551 is reversing whole down trend from 1.0146. Further rally would then be seen to 61.8% retracement at 0.9537 and above. For now, this will be the favored case as long as 55 D EMA (now at 0.8923) holds, even in case of deep pullback.
GBP/USD Mid-Day Outlook
Daily Pivots: (S1) 1.2167; (P) 1.2219; (R1) 1.2258; More...
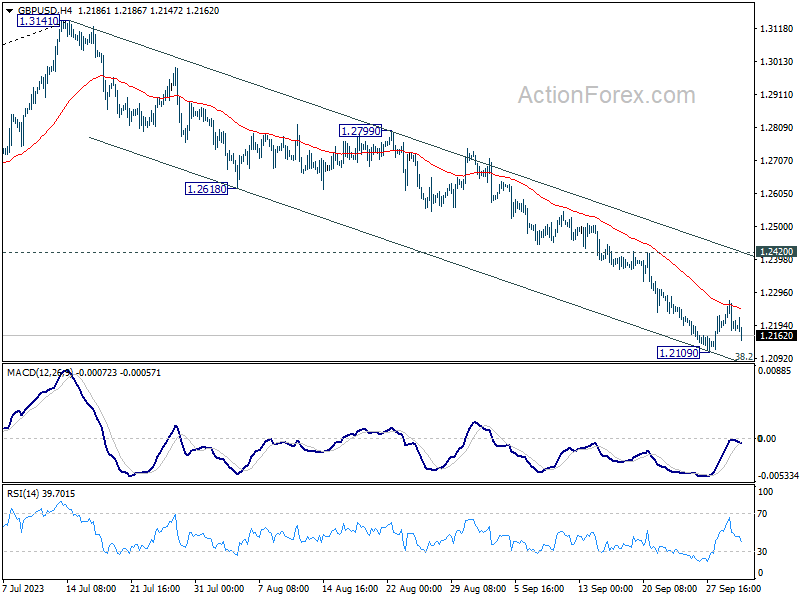
GBP/USD dips notably after rejection by 55 4H EMA, but stays above 1.2109 support. Intraday bias remains neutral for the moment. While stronger recovery cannot be ruled out, near term outlook will stay bearish as long as 1.2420 resistance holds. On the downside, decisive break of 1.2075 fibonacci level would carry larger bearish implication and target 1.1801 support next.
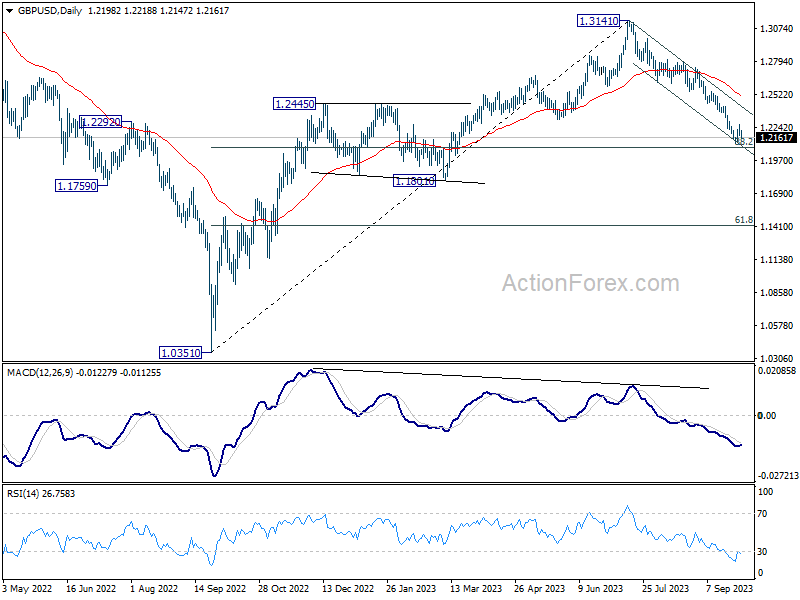
In the bigger picture, fall from 1.3141 medium term top could still be a correction to up trend from 1.0351 (2022 low) only. But risk of complete trend reversal is rising. Sustained break of 38.2% retracement of 1.0351 to 1.3141 at 1.2075 will pave the way to 61.8% retracement at 1.1417. For now, risk will stay on the downside as long as 55 D EMA (now at 1.2517) holds, in case of rebound.
EUR/USD Mid-Day Outlook
Daily Pivots: (S1) 1.0548; (P) 1.0583; (R1) 1.0607; More...
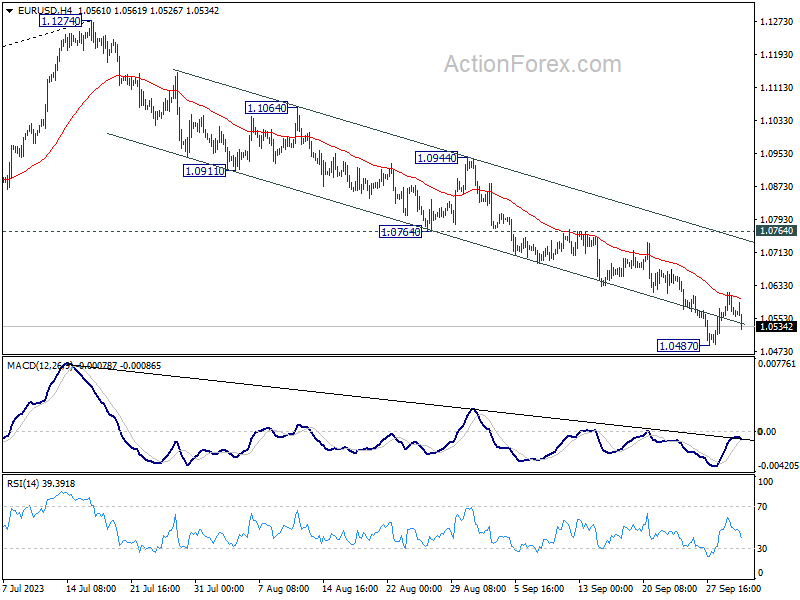
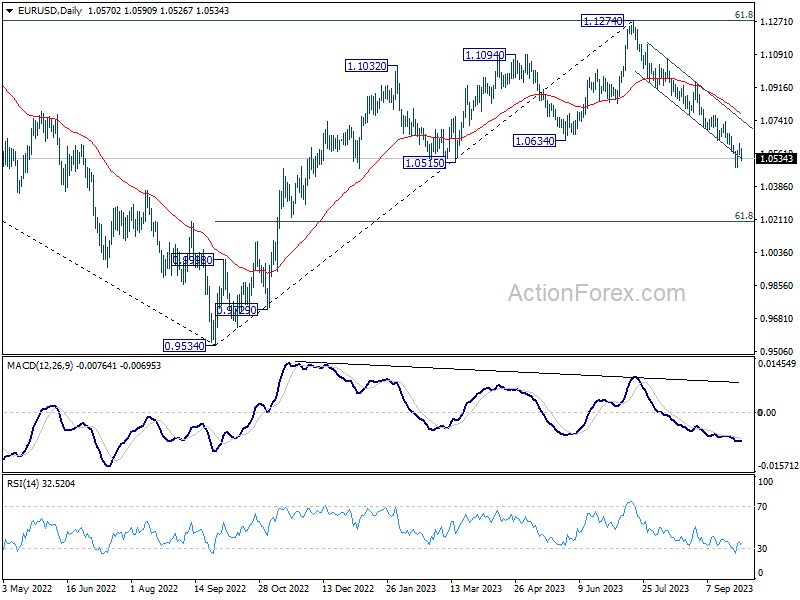
EUR/USD dips notably after rejection by 55 4H EMA, but stays above 1.0487 support. Intraday bias remains neutral for the moment. Stronger recovery cannot be ruled out. But near term outlook will stay bearish as long as 1.0764 support turned resistance holds. Break of 1.0487 will resume the fall from 1.1274 to 1.0199 fibonacci level.
In the bigger picture, fall from 1.1274 medium term top could still be a correction to rise from 0.9534 (2022 low). But chance of a complete trend reversal is rising. In either case, current fall should target 61.8% retracement of 0.9534 to 1.1274 at 1.0199 next. For now, risk will stay on the downside as long as 55 D EMA (now at 1.0786) holds, in case of rebound.
Dollar Benefits from Rising Treasury Yields; Precious Metals Stumble
Dollar is experiencing a broad rise today, buoyed by an uptick in treasury yields and risk aversion sentiments. The US Congress averted potential economic turbulence by passing a stopgap funding bill over the weekend, ensuring the federal government doesn't enter its fourth partial shutdown within a decade. However, this positive momentum in US futures was fleeting. This strengthening of Dollar is mirrored by decline in Gold and Silver, both plunging to their lowest levels since March.
In the realm of currencies, Canadian Dollar is emerging as one of the stronger performers, with Swiss Franc not far behind – the latter finding support from purchases against European majors. Conversely, Australian and New Zealand dollars are today's underperformers. Both antipodean currencies are in the spotlight as anticipating respective central bank meetings this week, with RBA kicking off the sequence in the coming Asian session.
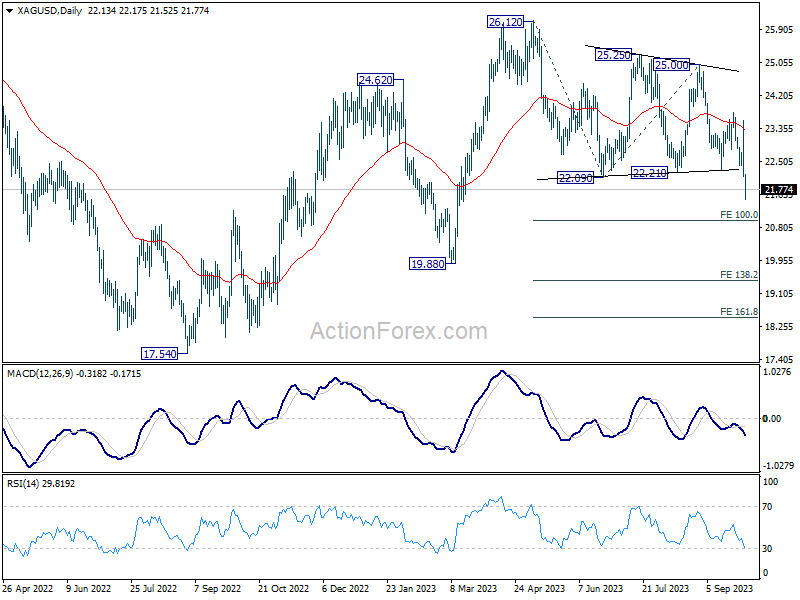
Technically, Silver resumed the decline from 26.12 and hits a low as 21.52 so far. It's unsure whether this fall is an impulsive or a corrective move for now. But risk will stay on the downside as long as 55 D EMA (now at 23.35) holds. Next target is 100% projection of 26.12 to 22.09 from 25.00 at 20.97. Decisive break there could prompt downside acceleration, and will act as a strong signal of underlying bearishness.
In Europe, at the time of writing, FTSE is down -0.49%. DAX is down -0.32%. CAC is down -0.37%. Germany 10-year yield is up 0.0253 at 2.870. Earlier in Asia, Nikkei closed down -0.31% on late selloff. Japan 10-year JGB yield rose 0.0054 to 0.776. Singapore Strait Times fell -0.27%.
Eurozone unemployment rate ticks down to 6.4%, EU down to 5.9%
Unemployment rate in Eurozone has seen a drop from 6.5% to 6.4% in August, aligning with market expectations. Similarly, the broader EU reported a decrease in its unemployment rate, ticking down from 6.0% to 5.9%.
Eurostat, provided further details on this development. As of August 2023, an estimated 12.837m individuals in EU were unemployed. Out of these, Eurozone accounted for 10.856m jobless persons. When juxtaposed with the data from July, there's a marked decrease of -112k unemployed persons in EU, with Eurozone contributing a decline of -107k to this number.
An even more pronounced positive trend emerges when the data is analyzed year-on-year. From August 2022 to August 2023, EU saw a reduction in unemployment by -335k individuals, while Eurozone alone experienced a decline of -407k unemployed persons.
Eurozone PMI manufacturing finalized at 43.4, sub-50 reading persists for 15 months
September Eurozone PMI Manufacturing shows a persistent trend of contraction, finalizing at 43.4, a marginal decline from August's 43.5. This marks a continuous 15-month spell where the headline index has been below the 50.0 threshold, indicating contraction.
Excluding Greece, which barely recorded expansion with Manufacturing PMI of 50.3, every other country monitored in the survey showed downturns. A country-wise breakdown ranks Greece at the top, followed by Ireland (49.6), Spain (47.7), Italy (46.8), France (44.2), Netherlands (43.6), Austria (39.6), and Germany (39.6).
Cyrus de la Rubia, the Chief Economist at Hamburg Commercial Bank, painted a clear picture of the current manufacturing scenario. He stated, "We are feeling pretty certain that the recession in manufacturing continued during this period." He also added that a significant pickup might only materialize with the advent of the new year. However, he expressed optimism by highlighting the possibility of reaching the lowest point in the current economic cycle.
Drawing parallels with past recessions, de la Rubia remarked, "With the exception of the great recession in 2008/2009, output prices have never decreased at a pace faster than the current three-month average." He emphasized the rarity of such sharp falls and indicated the likelihood of a rebound.
France and Germany led the downturn, while Spain and Italy showed relative resilience. However, when viewed through the lens of ongoing slowdown duration, Italy emerged as the poorest performer. Its manufacturing sector has been in recession since the latter half of 2022, with Germany joining the downturn in the second quarter of the current year.
"Given our forecast that the global manufacturing sector is bottoming out, these countries may be spared from a downturn lasting longer than two quarters," de la Rubia added, hinting at a silver lining in the looming clouds of economic contraction.
UK PMI manufacturing finalized at 44.3, still mired in contraction
UK PMI Manufacturing experienced a slight uptick, finalized 44.3 in September from the previous month's 39-month low of 43.0. However, despite this marginal improvement, an in-depth examination of the five sub-indices of the PMI - new orders, output, employment, stocks of purchases, and supplier delivery times - revealed a consistent downturn in the sector's performance.
Rob Dobson, Director at S&P Global Market Intelligence, portrayed a challenging scene for the UK's manufacturing industry. "September saw the manufacturing sector still mired in contraction territory," he noted. This is attributed to weakened conditions both domestically and internationally that have negatively impacted new order intakes, leading to reduced production volumes.
One of the significant factors exacerbating the situation is the ongoing cost-of-living crisis in the UK. A rapid increase in interest rates is further pressuring the manufacturing sector. Producers have explicitly linked these developments to the troubles they are encountering.
BoJ opinions: A blend of caution and optimism
Summary of Opinions of BoJ's September 21-22 meeting reiterated the general stance that ultra-loose monetary policy remains necessary for now. Yet, there was an undercurrent of optimism, with some members seeing achieve of price target "in sight".
The collective view reinforced that the "sustainable and stable achievement of the price stability target, accompanied by wage increases, has not yet come in sight." Given this scenario, the summary stressed the necessity to "patiently continue with monetary easing under yield curve control."
Underpinning the continued focus on wages, one member stated it is "necessary" to uphold the "momentum for wage hikes through continuation of monetary easing." Also, in order to achieve inflation target of 2 percent in a sustainable manner, it is necessary that "wage increases take root."
However, amid the cautious tones, rays of optimism emerged. One member opined that "Japan's economy is getting closer to achieving the price stability target, although there is somewhat of a distance to go." Providing a potential timeline for evaluating the price stability objective, focus is now on "the second half of fiscal 2023" especially considering the wage growth prospects for 2024.
Furthering this optimism, another viewpoint conveyed confidence, indicating that "Achievement of 2 percent inflation in a sustainable and stable manner seems to have clearly come in sight." This perspective also hinted at a clearer outcome by "January to March of next year."
Japan's Tankan survey reveals strong business sentiment
The latest Tankan survey results in Q3 showcased strengthening corporate sentiment in Japan. Key indices and outlooks, along with projections for capital expenditure, underscore a robust business environment, as inflation expectations maintain steadiness.
Large Manufacturing Index showed notable gains from 5 to 9, marking its second consecutive quarter of growth. Concurrently, Large Non-Manufacturing Index advanced from 23 to 27, recording its best level since 1991 and marking its sixth straight quarter of improvement.
Further reflecting this positive trend, Large Manufacturing Outlook Index increased from 9 to 10, while its Large Non-Manufacturing Outlook saw an ascent from 20 to 21.
In terms of capital commitments, prominent firms revealed ambitious plans, with an anticipation to bolster capital expenditure by 13.6% for the fiscal year ending March 2024.
Regarding inflation, the corporate sector's expectations remain consistent. Firms anticipate a price increase of 2.5% in the upcoming year, 2.2% over a three-year horizon, and 2.1% looking five years ahead. These figures mirror projections made in the prior quarter.
A crucial insight from a BOJ official noted that many large businesses have successfully offset higher costs by adjusting consumer prices, subsequently enhancing the overall business sentiment.
Further elevating the positive mood have been factors such as a resurgence in auto production and declining costs for raw materials. However, the official also acknowledged the challenges faced by some smaller enterprises, which have found it difficult to raise their prices.
Japan PMI manufacturing finalized at 48.5 in Sep, headwinds at home and abroad
Japanese manufacturing sector is facing challenges as evidenced by the drop in PMI Manufacturing to 48.5 in September, down from August's 49.6, the lowest level since February. Additionally, the average reading for Q3 stands at 49.3, a reduction from 50.0 in Q2.
According to key findings by S&P Global, the sector experienced faster falls in production and incoming new work. Alarmingly, backlogs declined at the strongest rate since April. A specific area of concern is the accelerated rate of input price inflation, reaching a four-month high, fueled by increasing costs of raw materials, oil, freight, and energy.
Usamah Bhatti at S&P Global Market Intelligence, conveyed a sombre view of the situation. He noted, "Depressed economic conditions domestically and globally weighed heavily on the sector, as both output and new orders were scaled back further. The decline in the latter was notably sharp, and the strongest seen for seven months." The future outlook is also tinged with apprehension, as manufacturers signaled the most significant depletion in outstanding business in five months.
The inflationary aspect further complicates the picture. Bhatti highlighted, "The rate of input price inflation accelerated for the second month running to a four-month high." Reports indicated that the sustained weakness of the yen is exacerbating the situation, elevating prices for inputs from abroad and placing an additional strain on firms.
EUR/USD Mid-Day Outlook
Daily Pivots: (S1) 1.0548; (P) 1.0583; (R1) 1.0607; More...
EUR/USD dips notably after rejection by 55 4H EMA, but stays above 1.0487 support. Intraday bias remains neutral for the moment. Stronger recovery cannot be ruled out. But near term outlook will stay bearish as long as 1.0764 support turned resistance holds. Break of 1.0487 will resume the fall from 1.1274 to 1.0199 fibonacci level.
In the bigger picture, fall from 1.1274 medium term top could still be a correction to rise from 0.9534 (2022 low). But chance of a complete trend reversal is rising. In either case, current fall should target 61.8% retracement of 0.9534 to 1.1274 at 1.0199 next. For now, risk will stay on the downside as long as 55 D EMA (now at 1.0786) holds, in case of rebound.
Economic Indicators Update
| GMT | Ccy | Events | Actual | Forecast | Previous | Revised |
|---|---|---|---|---|---|---|
| 23:50 | JPY | BoJ Summary of Opinions | ||||
| 23:50 | JPY | Tankan Large Manufacturing Index Q3 | 9 | 6 | 5 | |
| 23:50 | JPY | Tankan Large Manufacturing Outlook Q3 | 10 | 5 | 9 | |
| 23:50 | JPY | Tankan Non - Manufacturing Index Q3 | 27 | 24 | 23 | |
| 23:50 | JPY | Tankan Non - Manufacturing Outlook Q3 | 21 | 22 | 20 | |
| 23:50 | JPY | Tankan Large All Industry Capex Q3 | 13.60% | 13.40% | ||
| 00:00 | AUD | TD Securities Inflation M/M Sep | 0.00% | 0.20% | ||
| 00:30 | JPY | Manufacturing PMI Sep F | 48.5 | 48.6 | 48.6 | |
| 06:30 | CHF | Real Retail Sales Y/Y Aug | -1.80% | -1.80% | -2.20% | -2.50% |
| 07:30 | CHF | Manufacturing PMI Sep | 44.9 | 40.5 | 39.9 | |
| 07:45 | EUR | Italy Manufacturing PMI Sep | 46.8 | 45.6 | 45.4 | |
| 07:50 | EUR | France Manufacturing PMI Sep F | 44.2 | 43.6 | 43.6 | |
| 07:55 | EUR | Germany Manufacturing PMI Sep F | 39.6 | 39.8 | 39.8 | |
| 08:00 | EUR | Italy Unemployment Aug | 7.30% | 7.70% | 7.60% | |
| 08:00 | EUR | Eurozone Manufacturing PMI Sep F | 43.4 | 43.4 | 43.4 | |
| 08:30 | GBP | Manufacturing PMI Sep F | 44.3 | 44.2 | 44.2 | |
| 09:00 | EUR | Eurozone Unemployment Rate Aug | 6.40% | 6.40% | 6.40% | 6.50% |
| 13:30 | CAD | Manufacturing PMI Sep | 48 | |||
| 13:45 | USD | Manufacturing PMI Sep F | 48.9 | 48.9 | ||
| 14:00 | USD | ISM Manufacturing PMI Sep | 47.9 | 47.6 | ||
| 14:00 | USD | ISM Manufacturing Prices Paid Sep | 48.9 | 48.4 | ||
| 14:00 | USD | ISM Manufacturing Employment Index Sep | 48.5 | |||
| 14:00 | USD | Construction Spending M/M Aug | 0.60% | 0.70% |
Crypto Feels Power
Market picture
The crypto market capitalisation has risen over 2.7% in the last 24 hours to over $1.11 trillion, a level not seen since mid-August.
Bitcoin managed to hold above its 50-day moving average over the weekend, which it surpassed in a strong move on the 28th of September. BTCUSD surged over $1000 with a 4% gain, hitting a 7-week high of $28.3K. Contrary to the upward momentum at the end of last week, the intraday rally may be too stretched for now. After a long march, the price touched the technically and emotionally important 200-day moving average (currently $28K). There is a risk that we could see a repeat of the August 29 reversal to the downside. But that’s a risk, not the main scenario.
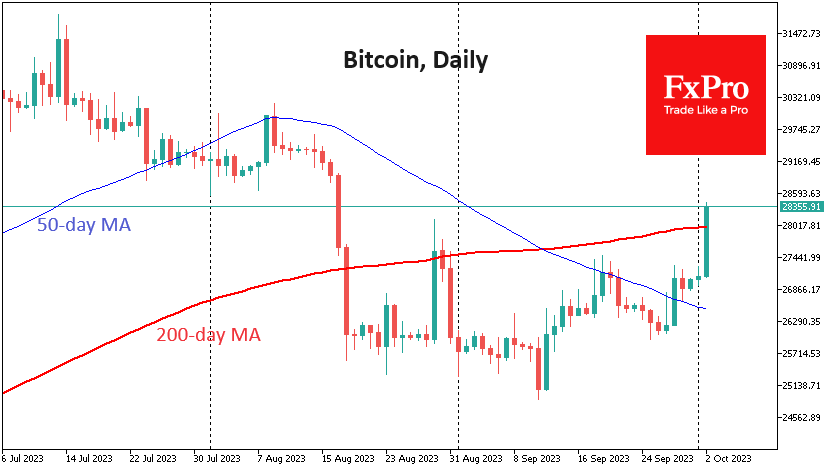
Bitcoin ended September up 4.1% at $27.1K, bucking the seasonal trend of the worst month of the year, which was hard to expect in an environment of a rising dollar and a falling S&P 500. Over the past 12 years, bitcoin has ended October higher on eight occasions. The average gain was 29.6%, and the average loss was 15.2%.
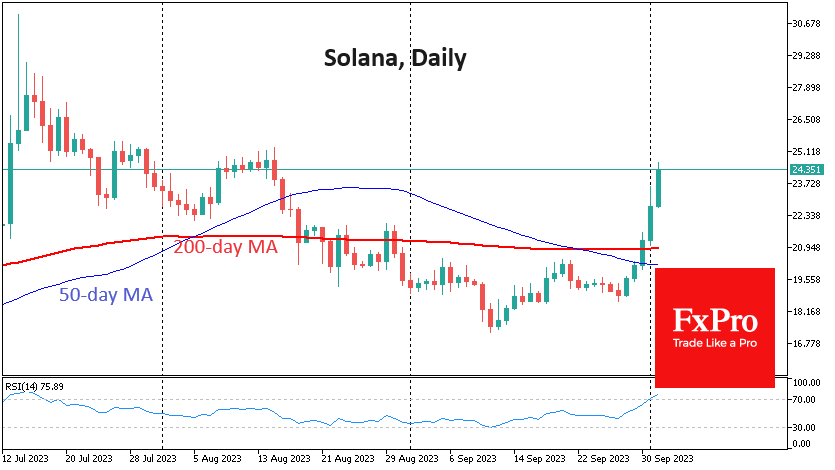
Solana rose 30%, rallying for the fifth day in a row and reaching its highest level since August 15th. On Sunday, it broke through the 50 and 200-day averages and continued to rise on Sunday and Monday. If Bitcoin has once again become an indicator of risk sentiment for global markets, has Solana become a leading indicator for Bitcoin?
News Background
Asset management company VanEck announced the launch of the Ethereum Strategy ETF. The actively managed ETF will be based on CFTC-regulated Ethereum-based settlement futures. The new instrument is similar to the firm’s other product, the Bitcoin Strategy ETF (XBTF), which will launch in November 2021.
The team behind the newly launched crypto exchange, CommEX, includes former Binance employees who helped develop the platform, the company said in an open letter. CommEX did not name the beneficiaries, saying they “prefer to remain undisclosed persons”.