Sample Category Title
Higher Yields and Stronger Dollar
Market movers today
ECB's Lane speaks on "key factors of inflation and ECB's response".
Public holiday in Germany.
We will receive inflation data from Switzerland, but after last month's surprise decision not to hike rates the release is unlikely to change the view that no more rate hikes are coming.
In Sweden, we get service PMIs, read more in the Nordic section below.
In the US, we get job openings, which is an important labour demand indicator for the Fed.
The Reserve Bank of New Zealand will announce its rate decision at 3.00 CET Wednesday.
The 60 second overview
Labour market: The euro area unemployment rate declined to a record-low 6.4% in August from 6.5% in July (revised up from 6.4%), highlighting the strength of the labour market this year. We still expect to see a slow and muted rise in unemployment going forward, though, in line with the weakening signals from the PMI employment figures in August and September.
US: The final PMI and ISM surveys painted a slightly more upbeat picture for US manufacturing in September. Leading new orders indices remain at contractionary levels (below 50), reflecting still weak consumer demand for manufactured goods. But as inventory levels are now declining faster than orders, production has slowly started to recover, which was evident in higher output and employment components driving the upticks in headline indices. That said, for inflation and the Fed, the development in the services sector matters more, and we continue to see weakening consumption growth towards the winter. The mixed outlook was reflected in yesterday's Fed commentary as well. Bowman, who is among the most hawkish FOMC participants, stuck to her earlier view that rates would have to be hiked further. Barr, on the other hand, sounded more cautious saying that rates are 'likely at or near sufficiently restrictive levels'. Powell did not touch on the monetary policy outlook in the roundtable discussion with Harker. Today's main focus will be on the JOLTs Job Openings release, which is a key labour demand indicator for the Fed, and a decent leading indicator for wage growth. In addition, Cleveland Fed's Mester (non-voter, hawk) and Atlanta Fed's Bostic (non-voter, dove) will be on the wires discussing economic outlook.
RBA: As expected, the Reserve Bank of Australia kept rates unchanged at a meeting this morning, arguing that recent data was consistent with inflation returning to its 2-3 percent target over time with output and employment still growing.
Equities: Global equities had a tough day yesterday! At headline level the moves were not so bad with MSCI world down 0.2%. However, underneath there was a very interesting rotation with cyclicals outperforming defensives by more than 1% and growth outperforming value despite the yield curve across the western world moving higher. US tech outperformed while utilities got crushed and had the worst day since the Covid downturn. Fortum and not least Ørsted were part of the utility sell-off. Long duration small caps received the same treatment. Russell 2000 is down 12% since Aug-1st and is now lower for the year. Higher and steeper curve is a large part of the explanation but still not 100% descriptive of the rotation as banks underperformed in what should all else equal be a very benign environment for the sector. In the US, Dow -0.2%, S&P 500 +0.01%, Nasdaq +0.7% and Russell 2000 1.6%.
Asian still with markets close and celebration of Golden Week in China. Hong Kong open with Chinese H-shares down 3% and rest of the open markets lower as well. European and US futures lower but not to the same extend as the sell-off in Asia could suggest.
FI: The first trading day of the quarter ended with a strong sell-off driven by a combination of the higher-for-longer narrative and strong US data. 10y German bunds tested 2.92% which was about 7bp higher than Friday's close. ECB's de Guindos repeated the ECB guidance of no imminent rate cuts. On the question of MRR, de Guindos pushed back and said that ECB is not focusing on profit/loss of the central bank but on price stability. Similar to previous yield curve dynamics, the long end staged the sell-off with the 2s30s yield curve 8bp steeper on the day. Germany is out for a public holiday today.
FX: The first session of the week was characterised by a setback to European cyclically sensitive currencies such as SEK, GBP NOK and HUF while the USD and CAD were among the top-performers. EUR/USD has moved below the 1.05-level while EUR/NOK and EUR/SEK have rebounded to the high 11.30s and 11.50s, respectively.
Credit: Credit markets were negatively affected by the weak European equity markets on Monday. The primary market was also muted with limited activity. ITraxx Main was 2bp wider at 82bp while iTraxx Xover was 4bp wider at 438bp.
Nordic macro
PMI Manufacturing released yesterday was bleak, where four out of five sub-indices contributed to the decline in the PMI total for September to 43.3 compared to a downwardly revised 45.5 in August. Furthermore, Riksbank minutes were published yesterday. The SEK continues to be in focus (mentioned 43 times vs 44 in June), and especially with respect to the impact on inflation. Overall, as indicated in the rate path, the door is open for a possible hike in November as well (or even later according to the governor of the board, Erik Thedéen).
Looking forward, Service PMI may drop today. This would be a more stable development as it is hovering around the 50-point expansion threshold. Most interesting will be how the sub-index for suppliers' input prices develop as the sticky service inflation was one of the main worries of the Riksbank's board members in yesterday's published minutes.
GBP/JPY Daily Outlook
Daily Pivots: (S1) 180.57; (P) 181.70; (R1) 182.26; More...
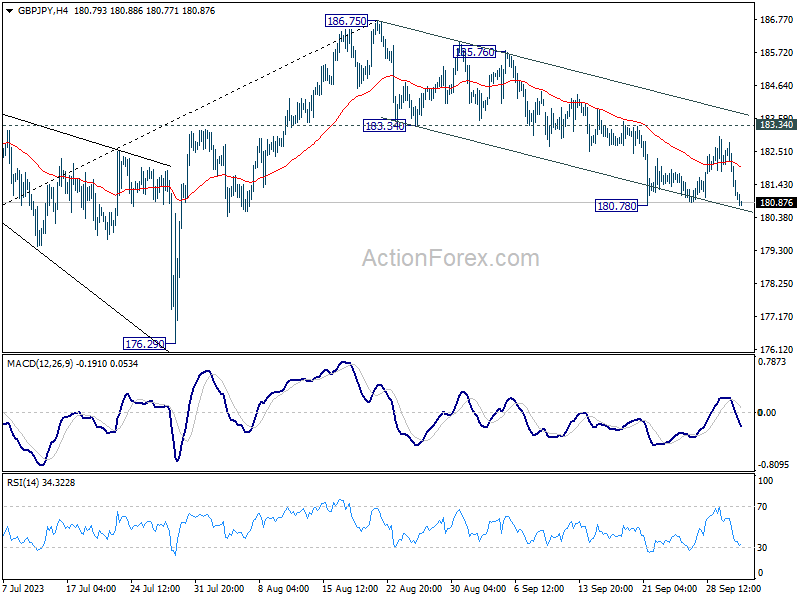
Intraday bias in GBP/JPY stays neutral and deeper decline is expected as long as 183.34 resistance holds. On the downside, break of 180.78 will resume the fall from 186.75 to 176.29 support next. Nevertheless, firm break of 183.34 will turn bias back to the upside for retesting 186.75 high.
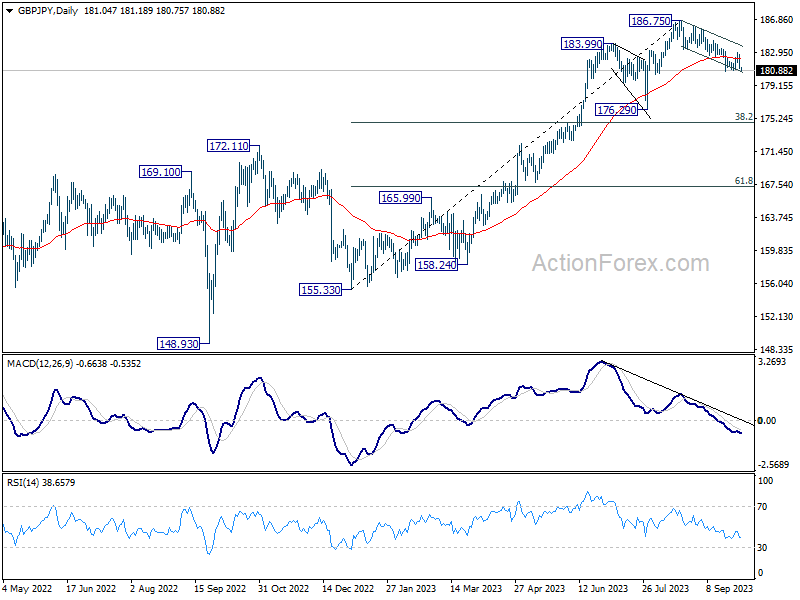
In the bigger picture, fall from 186.75 is currently seen as a corrective move only. As long as 176.29 support holds, larger up trend from 123.94 (202 low) should still be in progress. Break of 186.75 will target 195.86 (2015 high). Nevertheless, firm break of 176.29 will confirm medium term topping, and bring lengthier and deeper consolidations.
EUR/JPY Daily Outlook
Daily Pivots: (S1) 156.53; (P) 157.50; (R1) 158.01; More....
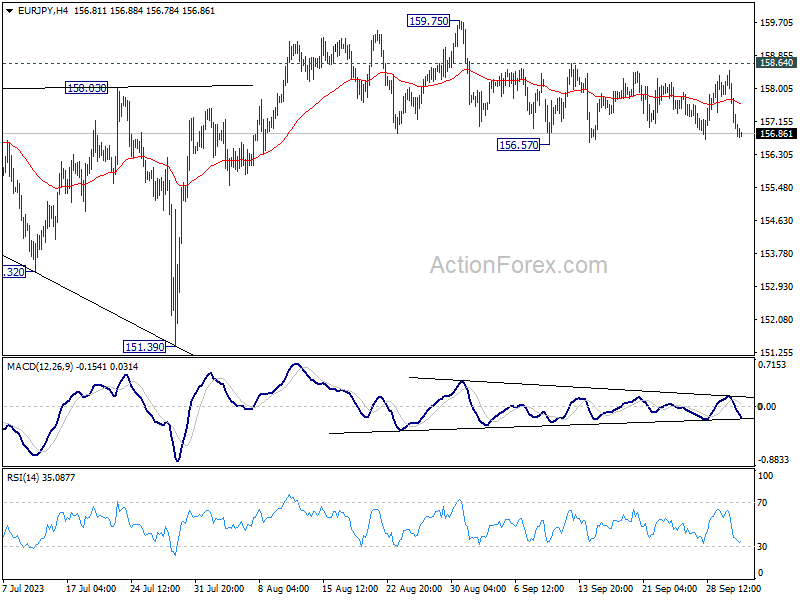
Range trading continues in EUR/JPY and intraday bias remains neutral. Deeper decline will remain in favor as long as 158.64 resistance holds. On the downside, break of 156.57 support, and sustained trading below 55 D EMA (now at 157.02) will argue that fall from 159.75 is a larger scale correction. Deeper decline would be seen back towards 151.39 support. Nevertheless, above 158.64 would bring retest of 159.75 high instead.
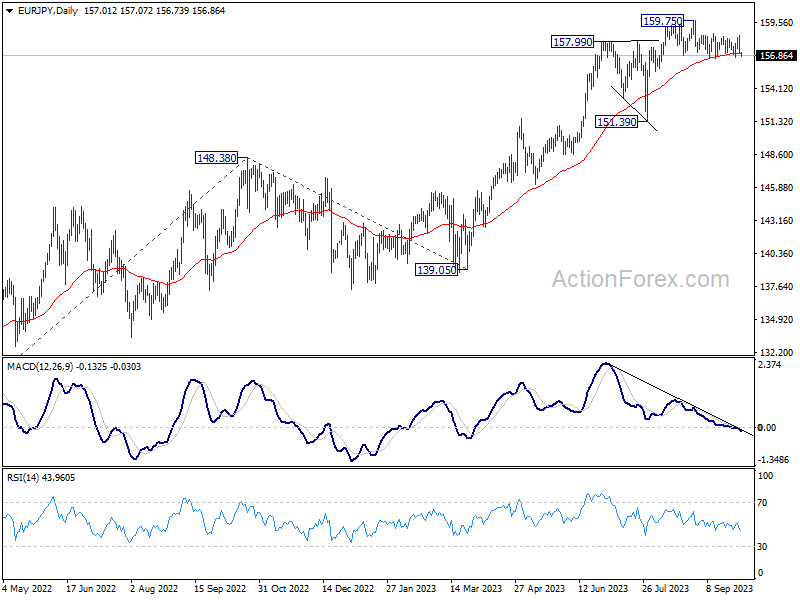
In the bigger picture, as long as 151.39 support holds, rise from 114.42 (2020 low) is still expected to continue. Next target is 100% projection of 124.37 to 148.38 from 139.05 at 163.06. Sustained break there will pave the way to retest long term resistance at 169.96.
EUR/GBP Daily Outlook
Daily Pivots: (S1) 0.8656; (P) 0.8666; (R1) 0.8678; More....
Intraday bias in EUR/GBP stays neutral and outlook is unchanged. On the upside, decisive break of 0.8700 resistance will carry larger bullish implication and bring stronger rally to 0.8874 resistance next. Nevertheless, rejection by this resistance will maintain bearish outlook that larger down trend is not over. Firm break of 0.8629 resistance turned support will turn bias back to the downside for 0.8568 support first.
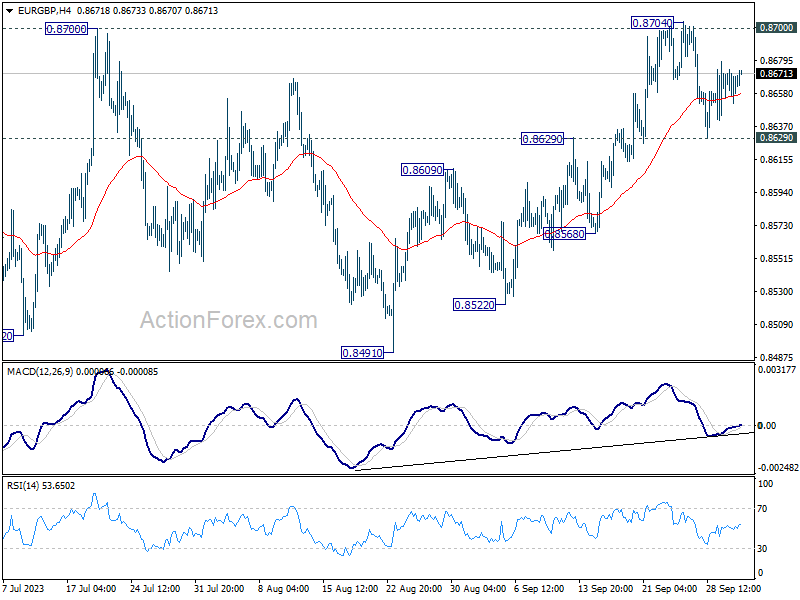
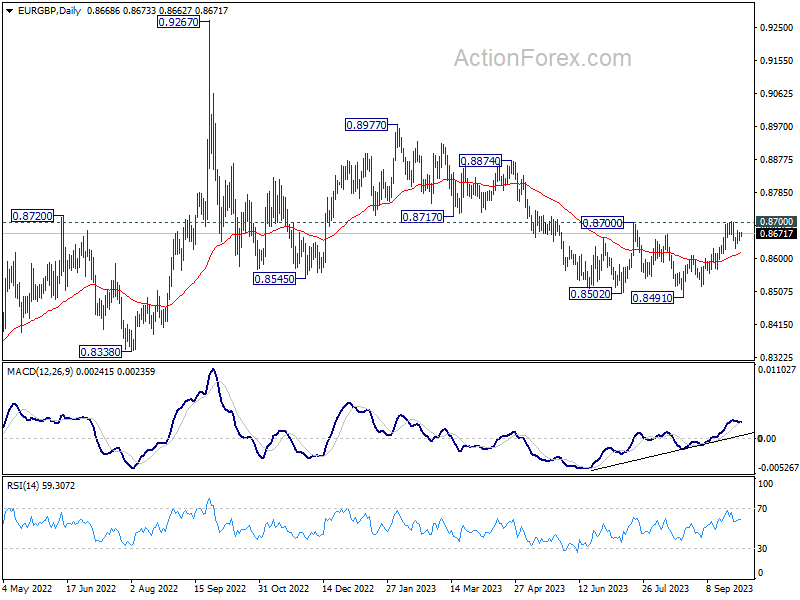
In the bigger picture, the down trend from 0.9267 (2022 high) is seen as part of the long term range pattern from 0.9499 (2020 high). Decisive break of 0.8700 resistance will argue that this decline has completed with three waves down to 0.8491. Rise from 0.8491 could then be another leg inside the pattern and targets 0.8977 and above. However, rejection by 0.8700 will keep the down trend alive for another fall through 0.8491 at a later stage.
EUR/AUD Daily Outlook
Daily Pivots: (S1) 1.6400; (P) 1.6460; (R1) 1.6525; More...
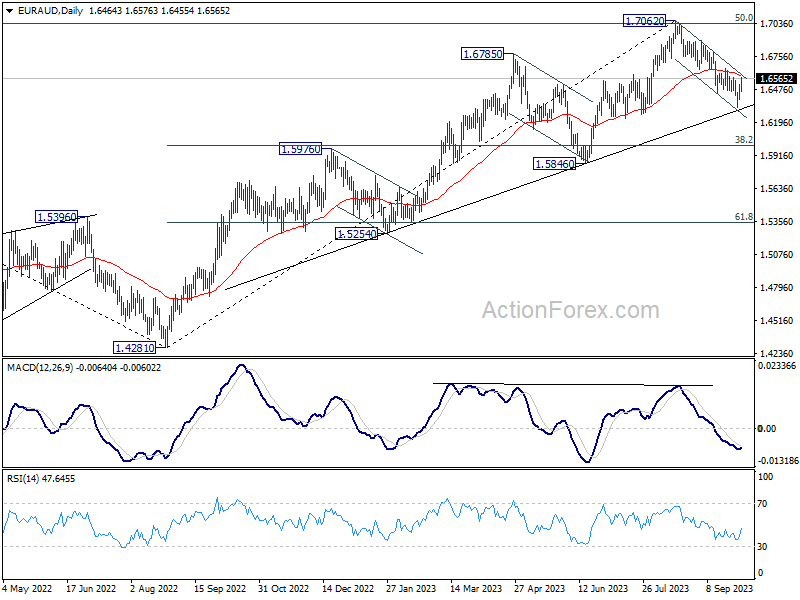
Intraday bias in EUR/AUD remains neutral for the moment. Further decline is expected with 1.6650 resistance intact. On the downside, break of 1.6319 will resume the fall from 1.7062, as a larger scale correction, to 1.6000 fibonacci level. However, firm break of 1.6650 will argue that the pull back has completed and turn bias back to the upside.
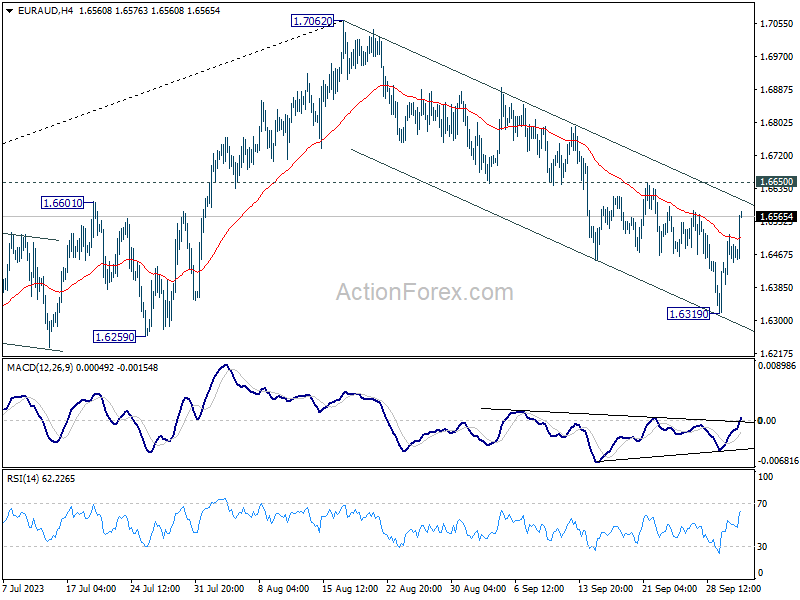
In the bigger picture, fall from 1.7062 is probably correcting whole up trend from 1.4281 (2022 low). Deeper decline would be seen to 38.2% retracement of 1.4281 to 1.7062 at 1.6000. Strong support could be seen there to bring rebound, at least on first attempt. This will remain the favored case as long as 1.6650 resistance holds.
EUR/CHF Daily Outlook
Daily Pivots: (S1) 0.9597; (P) 0.9641; (R1) 0.9665; More...
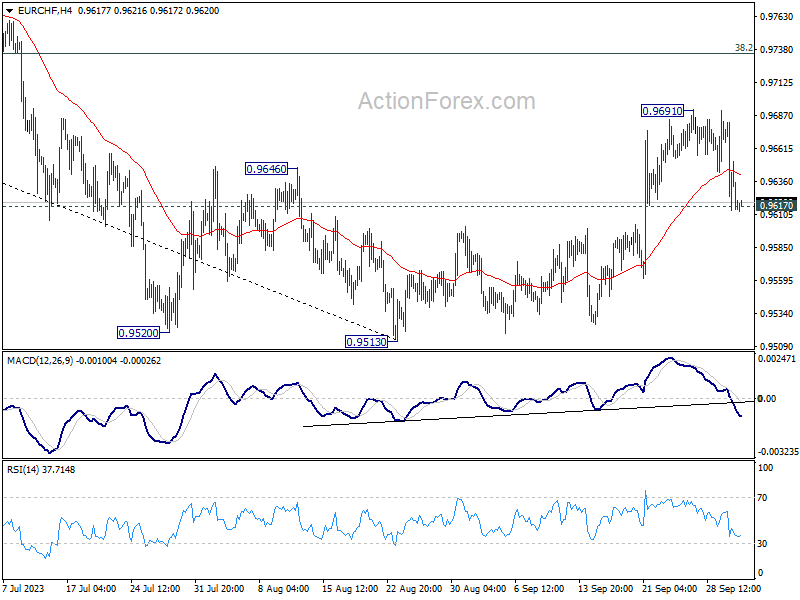
Intraday bias in EUR/CHF remains neutral for the moment. Further rally is expected as long as 0.9617 support holds. Above 0.9691 will resume the rebound form 0.9513 to 38.2% retracement of 1.0095 to 0.9513 at 0.9735. However, firm break of 0.9617 will turn bias back to the downside for retesting 0.9513 low.
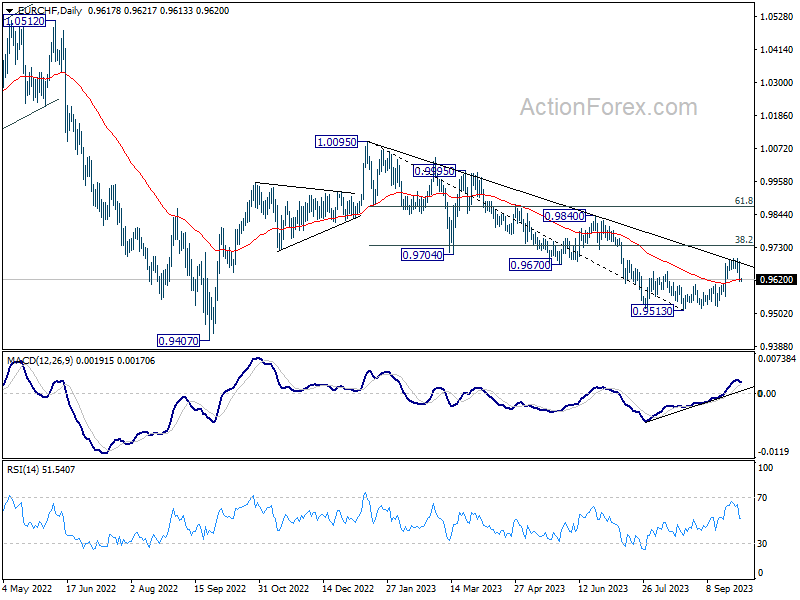
In the bigger picture, medium term outlook will stay bearish as long as the cross is capped well below falling 55 W EMA (now at 0.9804). That is, down trend from 1.2004 (2018 high) could still resume through 0.9407 (2022 low). However, sustained trading above the 55 W EMA will raise the chance that 0.9470 is already a long term bottom. Further rise would then be seen to 1.0095 resistance to indicate bullish trend reversal.
Technical Outlook and Review
DXY:
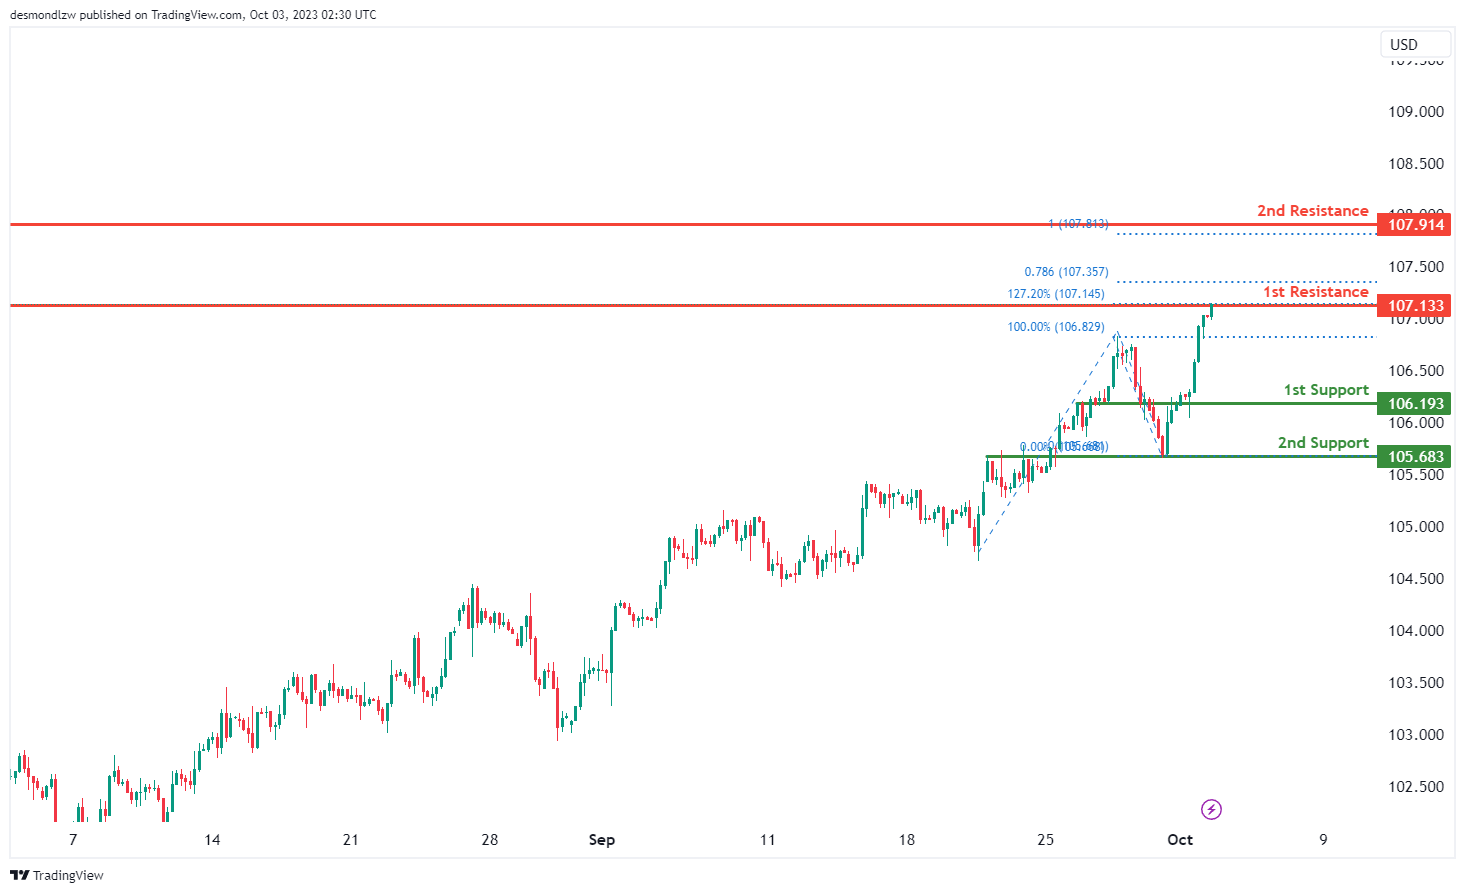
The DXY chart currently demonstrates a bullish momentum, with the possibility of a short-term drop to the 1st support level before potentially bouncing and rising towards the 1st resistance level.
The 1st support at 106.19 is identified as an overlap support, which may provide a level of price stability. The 2nd support at 105.68 is also considered an overlap support, potentially offering additional support to price declines.
On the resistance side, the 1st resistance at 107.13 is crucial, with the presence of the 127.20% Fibonacci Extension, indicating its significance as a potential barrier to price increases. Beyond this, the 2nd resistance level at 107.91 is recognized as a swing high resistance
EUR/USD:
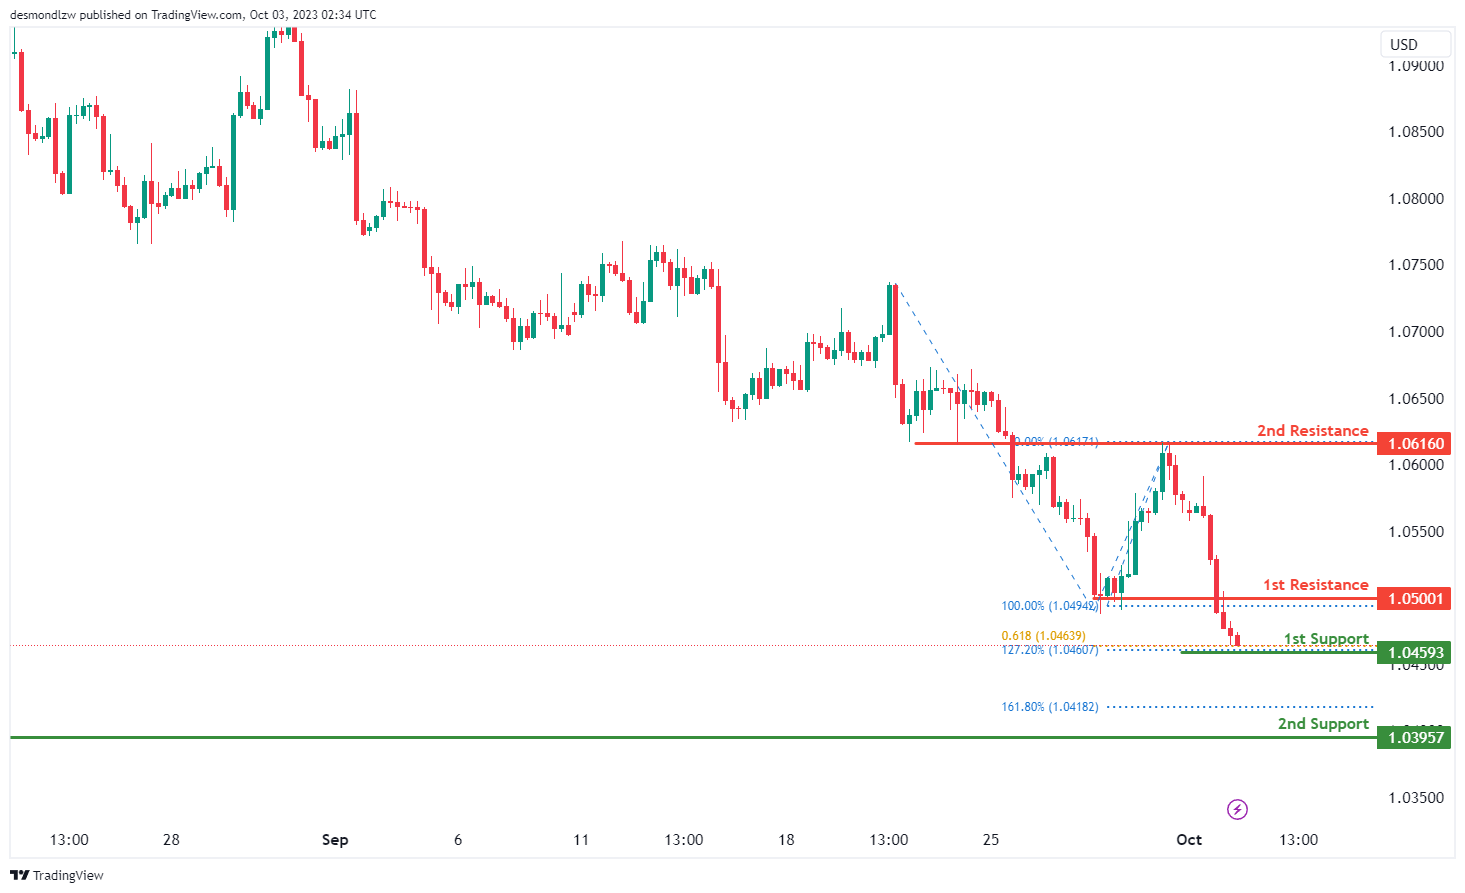
The EUR/USD chart currently exhibits bearish momentum, with the potential scenario of a short-term rise towards the 1st resistance level before reversing and moving towards the 1st support.
The 1st support at 1.0459 is considered significant due to the presence of the 61.80% Fibonacci Projection and the 127.20% Fibonacci Extension, suggesting Fibonacci confluence and making it a noteworthy level for potential price reversals. Additionally, the 2nd support at 1.0395 is identified as a swing low support, further reinforcing its importance as a potential support level.
On the resistance side, the 1st resistance at 1.0500 is characterized as an overlap resistance, indicating its potential role as a barrier to price increases. Furthermore, the 2nd resistance at 1.0395 is recognized as a swing high resistance, emphasizing its significance in potential price reversals.
EUR/JPY:
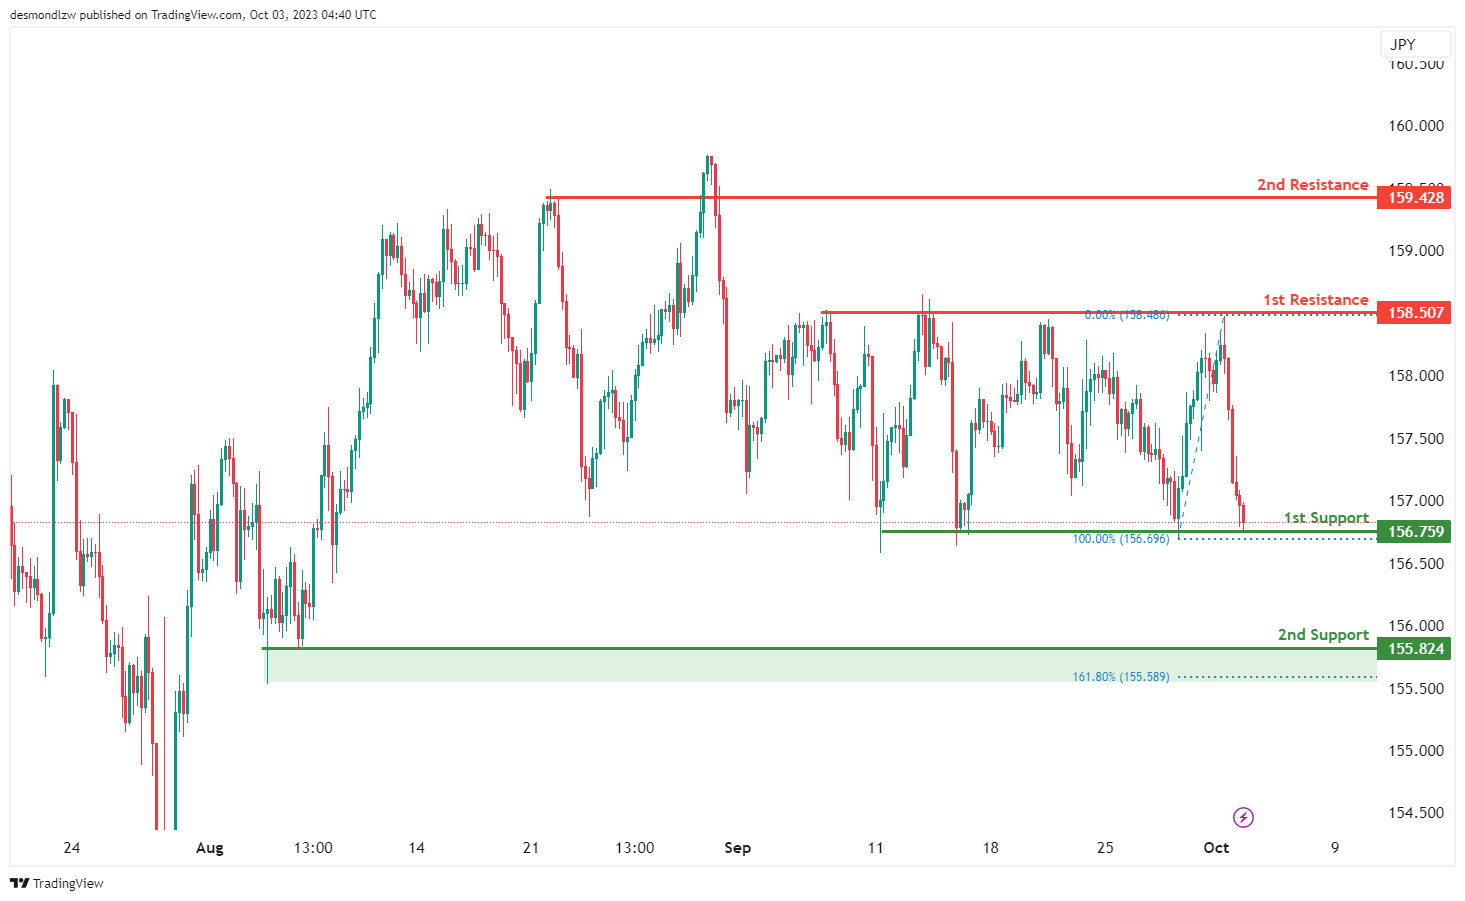
The instrument being analyzed is EUR/JPY, and the current overall momentum of its chart is bullish.
There is a potential scenario where the price could make a bullish bounce off the 1st support level, which is at 156.75, and head towards the 1st resistance level at 158.50.
The 1st support at 156.75 is considered significant because it acts as a multi-swing low support.
Additionally, there is a 2nd support level at 155.82, which is also valuable due to its status as a multi-swing low support. It aligns with a 161.80% Fibonacci Extension level, adding to its importance.
On the resistance side, the 1st resistance level at 158.50 is considered important because it represents a multi-swing high resistance.
Moreover, there is a 2nd resistance level at 159.42, which holds importance as a pullback resistance in the chart analysis.
EUR/GBP:
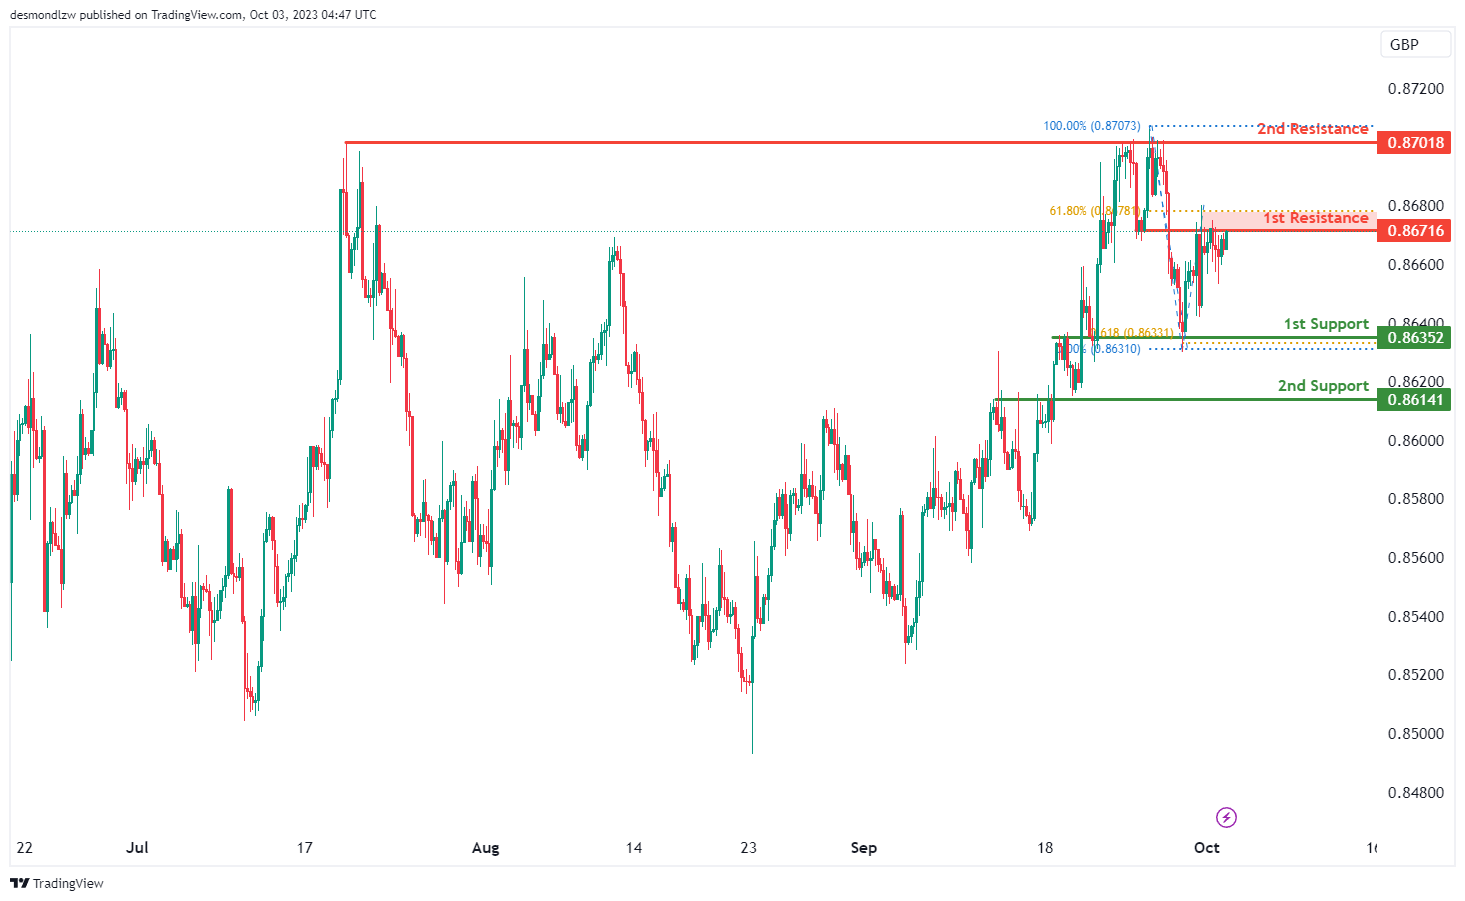
The instrument being analyzed is EUR/GBP, and the current overall momentum of its chart is bearish.
There is a potential scenario where the price could make a bearish reaction off the 1st resistance level, which is at 0.8671, and subsequently drop to the 1st support level at 0.8635.
The 1st support at 0.8635 is considered significant because it acts as an overlap support and corresponds to a 61.80% Fibonacci Projection.
Additionally, there is a 2nd support level at 0.8614, which is also valuable due to its status as an overlap support.
On the resistance side, the 1st resistance level at 0.8671 is considered important because it represents an overlap resistance. Furthermore, this level aligns with a 61.80% Fibonacci Retracement, adding to its significance.
Moreover, there is a 2nd resistance level at 0.8701, which holds importance as a multi-swing high resistance in the chart analysis.
GBP/USD:
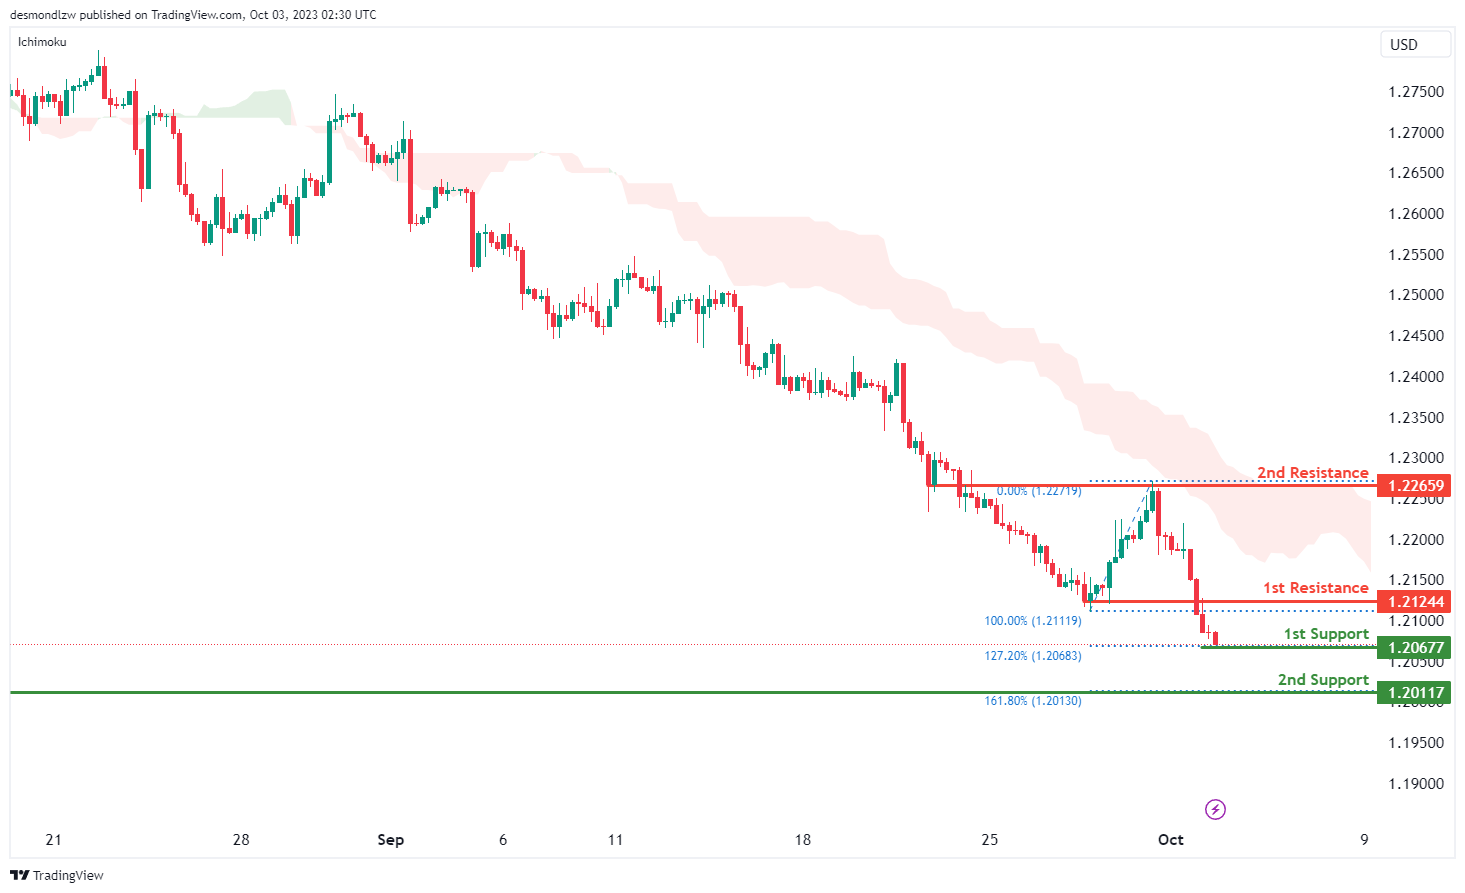
The GBP/USD chart currently maintains a bearish momentum, with factors contributing to this momentum being its position below the bearish Ichimoku cloud.
There is a potential scenario of a bullish bounce off the 1st support level at 1.2067, which is supported by the presence of the 127.20% Fibonacci Extension, indicating a possible reversal point. Additionally, the 2nd support at 1.2011 is identified as a swing low support and aligns with the 161.80% Fibonacci Extension, further emphasizing its significance.
On the resistance side, the 1st resistance level at 1.2124 is recognized as an overlap resistance, suggesting it may act as a barrier to bullish movements. Beyond this, the 2nd resistance at 1.2265 is also categorized as an overlap resistance,
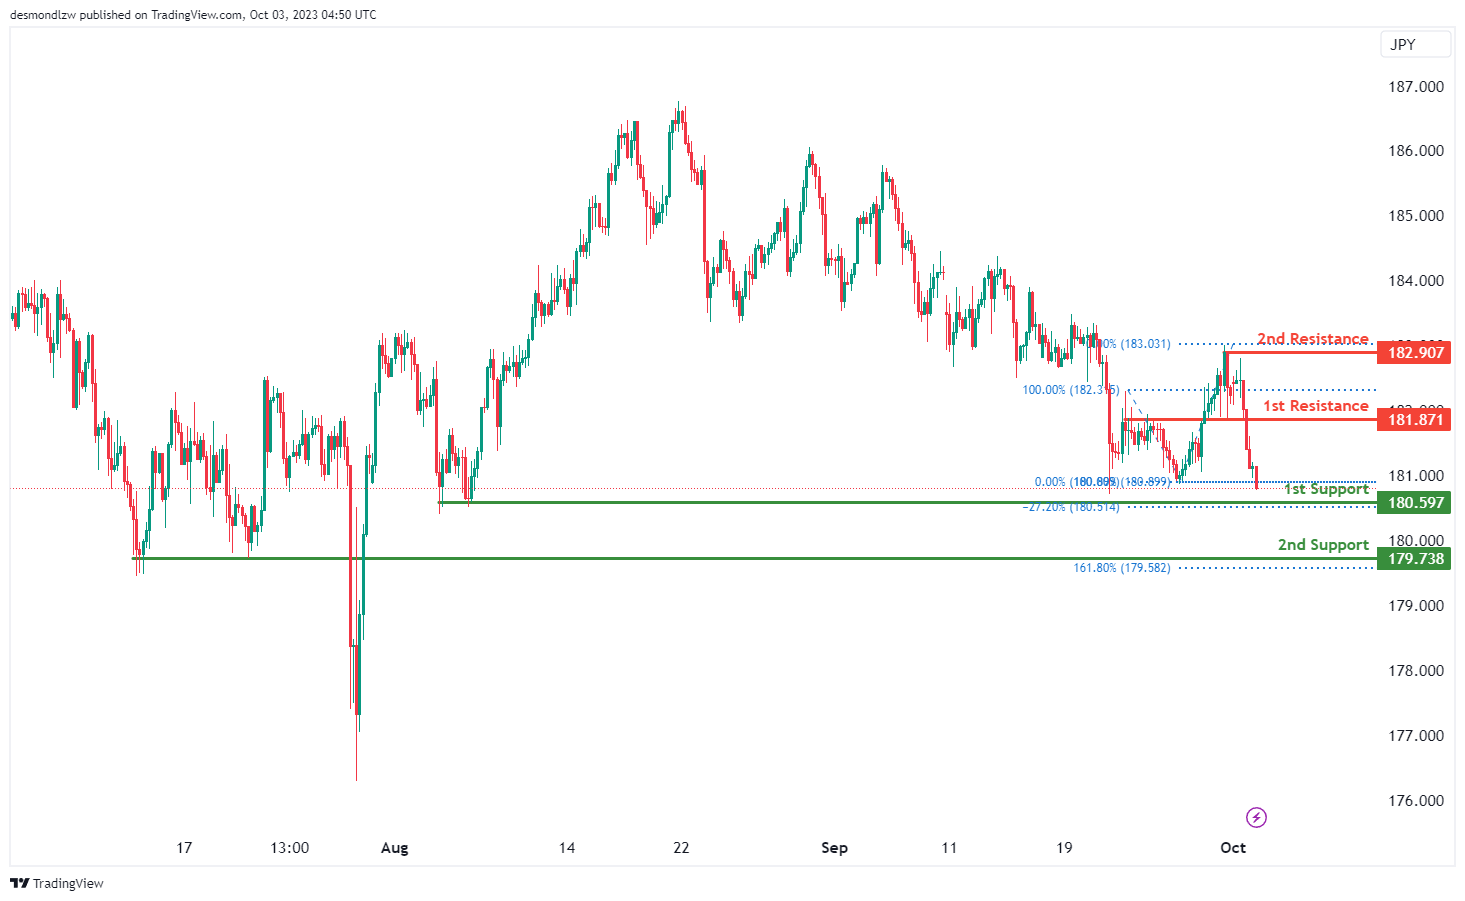
GBP/JPY:
The instrument being analyzed is GBP/JPY, and the current overall momentum of its chart is bullish.
There is a potential scenario where the price could drop further to the 1st support level, which is at 180.59, in the short term before bouncing from there and rising to the 1st resistance level at 181.87.
The 1st support at 180.59 is considered significant because it acts as a multi-swing low support and corresponds to a -27% Fibonacci Expansion.
Additionally, there is a 2nd support level at 179.73, which is also valuable as it functions as a pullback support and aligns with a 161.80% Fibonacci Extension.
On the resistance side, the 1st resistance level at 181.87 is considered important because it represents a pullback resistance.
Moreover, there is a 2nd resistance level at 182.90, which holds significance as a swing high resistance in the chart analysis.
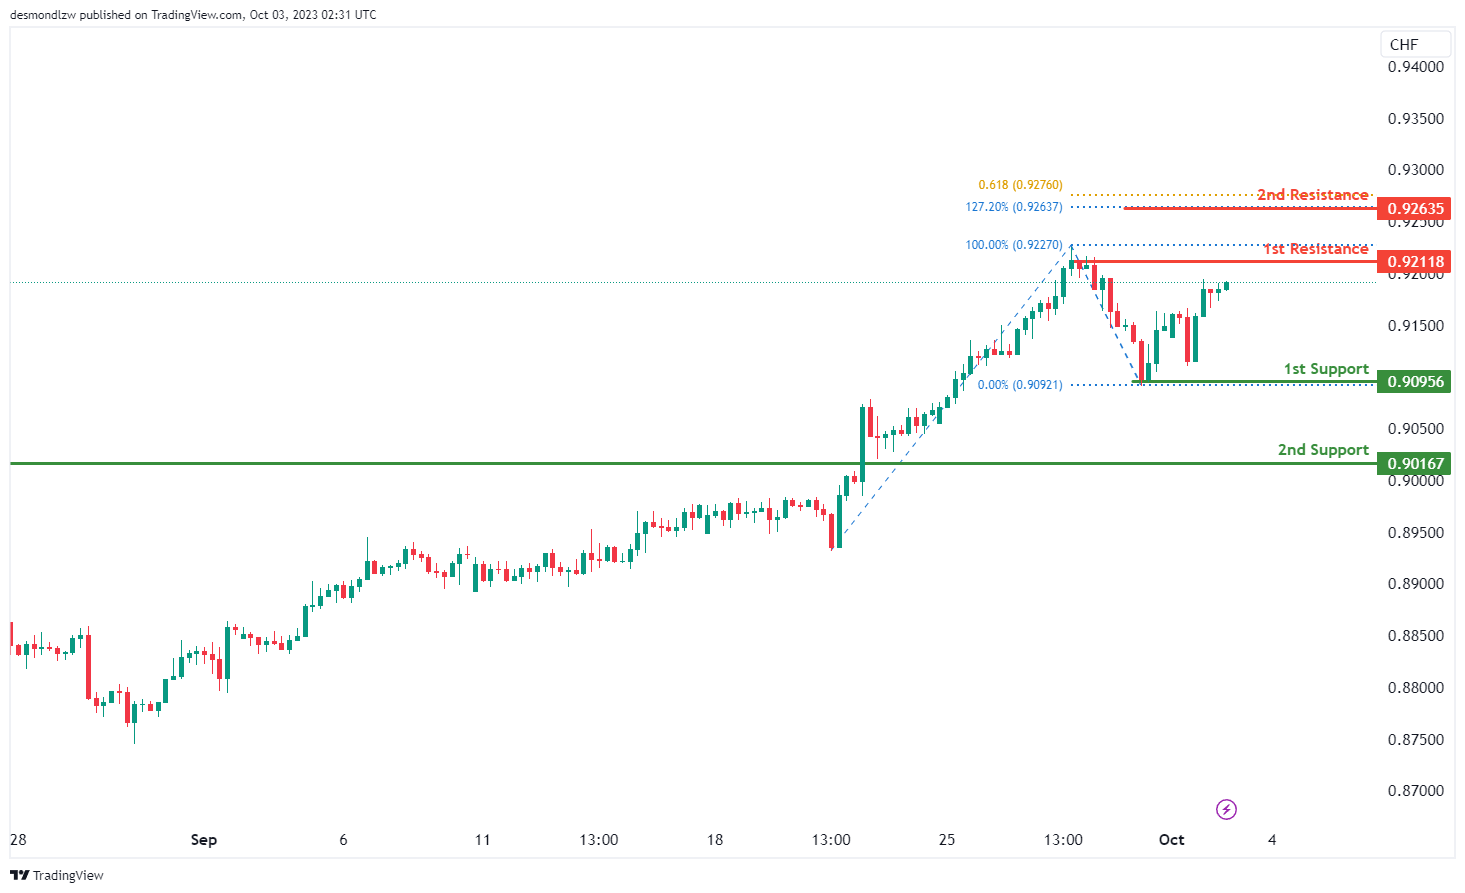
USD/CHF:
The USD/CHF chart currently exhibits a bullish momentum.
There’s a potential scenario of a bullish continuation towards the 1st resistance level at 0.9211. The 1st support at 0.9095 is identified as a swing low support, indicating a potential level where the price might find support. Additionally, the 2nd support at 0.9016 is categorized as a pullback support, further strengthening its significance.
On the resistance side, the 1st resistance level at 0.9211 is recognized as a swing high resistance and marks a potential point where the price could face resistance initially. Beyond this, the 2nd resistance at 0.9263 is notable for the convergence of the 161.80% Fibonacci Extension and the 61.80% Fibonacci Retracement, indicating a Fibonacci confluence and underscoring its importance as a potential resistance zone.
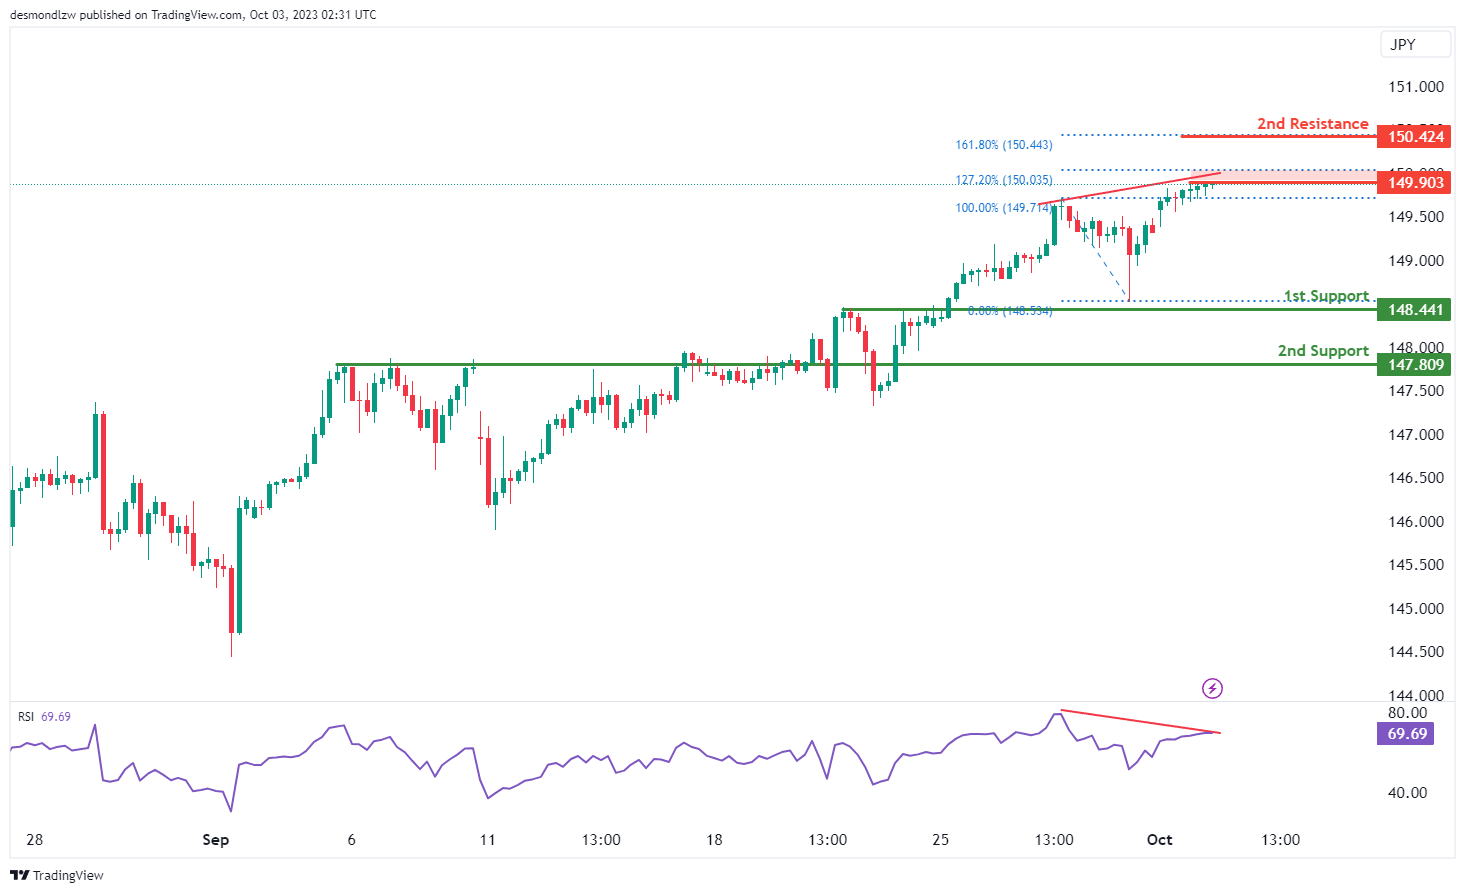
USD/JPY:
The USD/JPY chart currently has a bullish momentum, but there’s a potential scenario of a short-term drop to the 1st support level at 148.44 before bouncing and rising towards the 1st resistance.
The 1st support at 148.44 is identified as an overlap support, making it a significant level for potential price support. Additionally, the 2nd support at 147.80 is categorized as a pullback support, further reinforcing its importance as a potential level where the price might find support.
On the resistance side, the 1st resistance level at 149.90 is crucial, with the presence of the 127.20% Fibonacci Extension, indicating its significance as a potential resistance zone. Beyond this, the 2nd resistance at 150.42 is marked by the 161.80% Fibonacci Extension, further underlining its importance as a potential barrier to upward movements in the price.
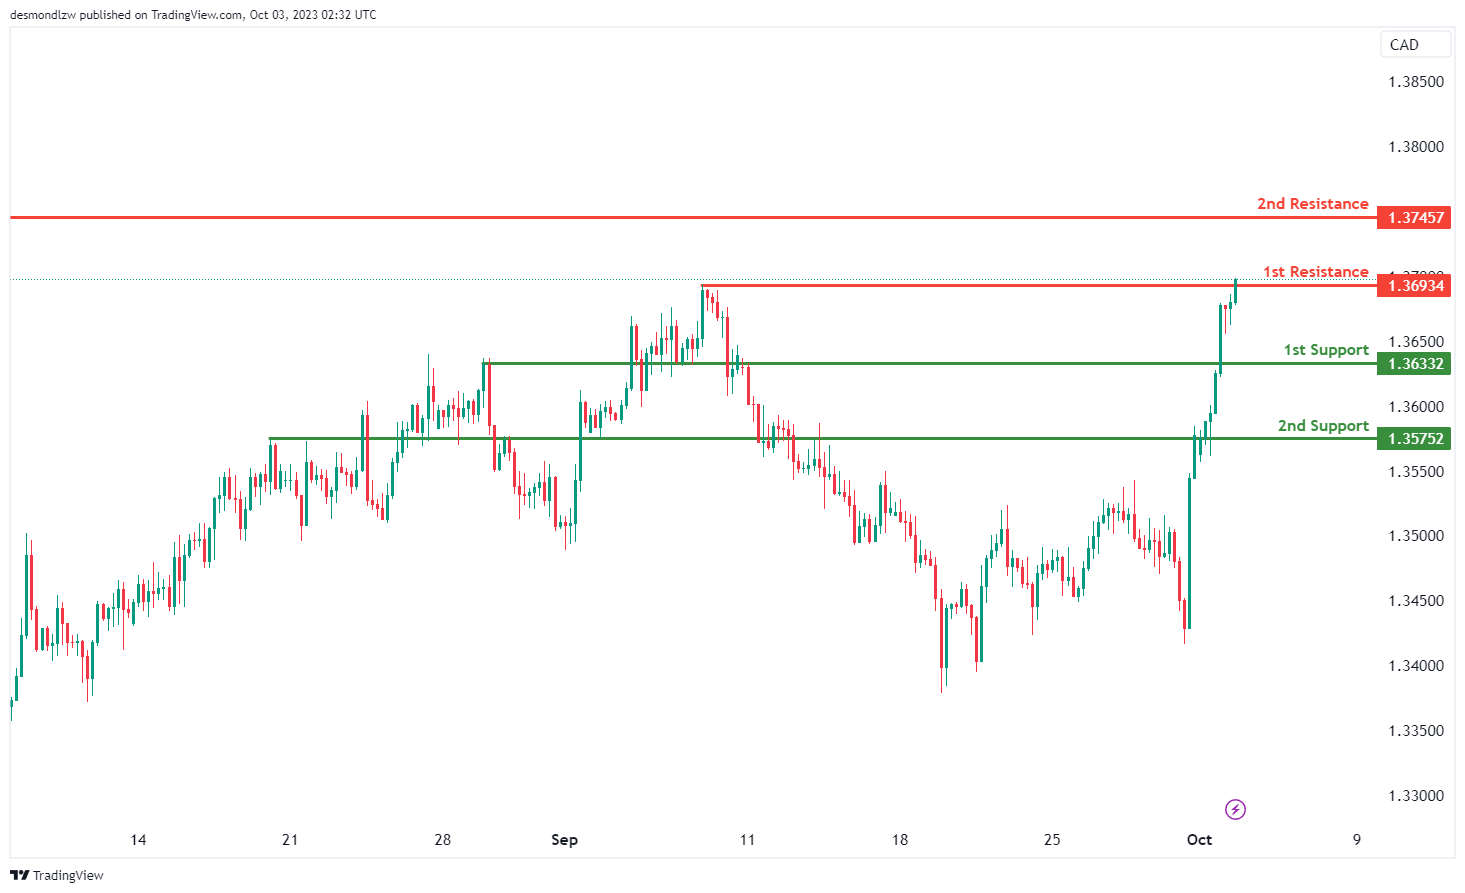
USD/CAD:
The USD/CAD chart currently has a bearish momentum, and there is a potential scenario of a bearish reaction off the 1st resistance level, leading to a drop towards the 1st support.
The 1st support at 1.3633 is considered a good support level, characterized as a pullback support. Additionally, the 2nd support at 1.3575 is identified as an overlap support, which offers another potential zone where the price might find necessary support.
On the resistance side, the 1st resistance level at 1.3693 is crucial, being a swing high resistance. Beyond this, the 2nd resistance level at 1.3745 also serves as a swing high resistance, representing a barrier for potential upward movements in the price.
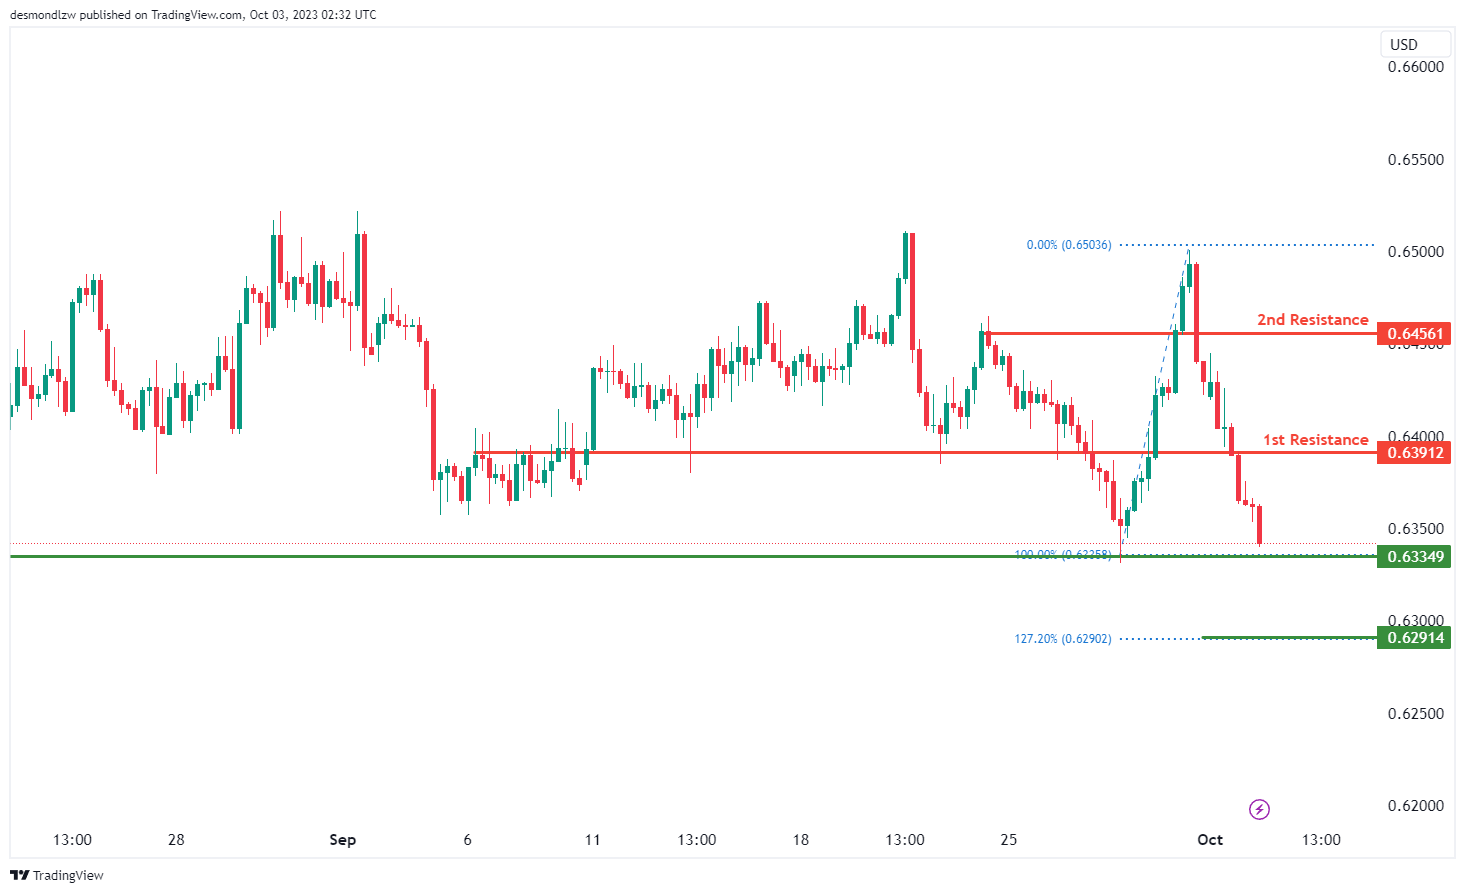
AUD/USD:
The AUD/USD chart currently has a bearish momentum, but there is a potential scenario of a bullish bounce off the 1st support level, heading towards the 1st resistance.
The 1st support at 0.6334 is considered significant as it is a swing low support level. Additionally, the 2nd support at 0.6291 is identified as a level where the price aligns with the 127.20% Fibonacci Retracement, which enhances its role as a key support level.
On the resistance side, the 1st resistance level at 0.6387 is categorized as a pullback resistance, which might initially limit upward movements. Beyond this, the 2nd resistance at 0.6456 also serves as a pullback resistance
NZD/USD
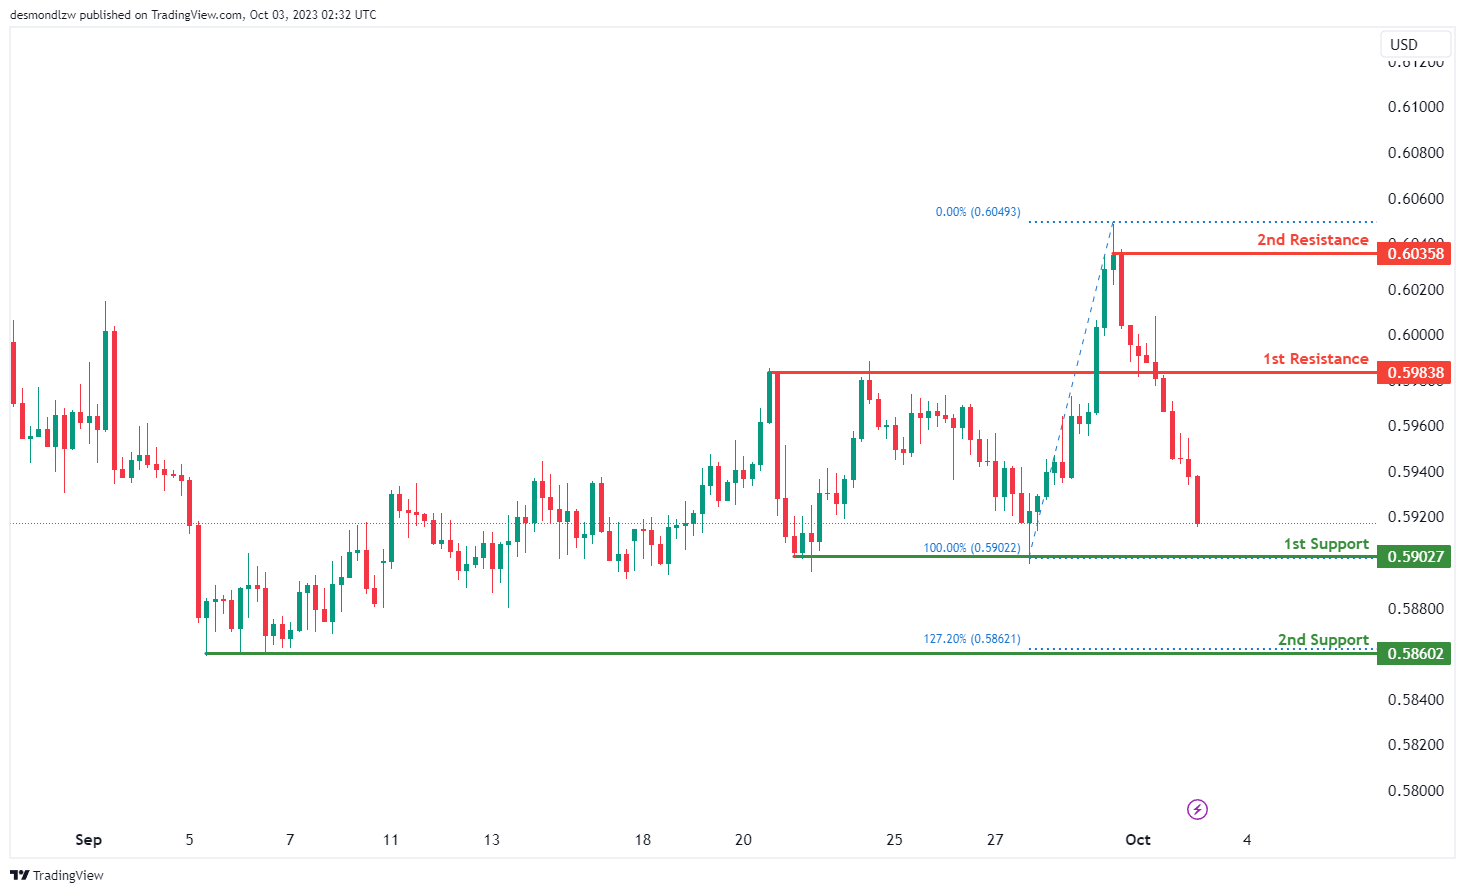
The NZD/USD chart is currently exhibiting a bearish momentum, and there’s a potential scenario of a bearish continuation towards the 1st support level.
The 1st support at 0.5902 is considered significant as it is a multi-swing low support level. Additionally, the 2nd support at 0.5860 is identified as a multi-swing low support and is further reinforced by the presence of the 127.20% Fibonacci Extension, making it an important level for potential price support.
On the resistance side, the 1st resistance level at 0.5983 is marked as a pullback resistance, which might initially limit upward movements. Beyond this, the 2nd resistance at 0.6035 is identified as a swing high resistance, representing another potential barrier to bullish advancements in the price.
DJ30:
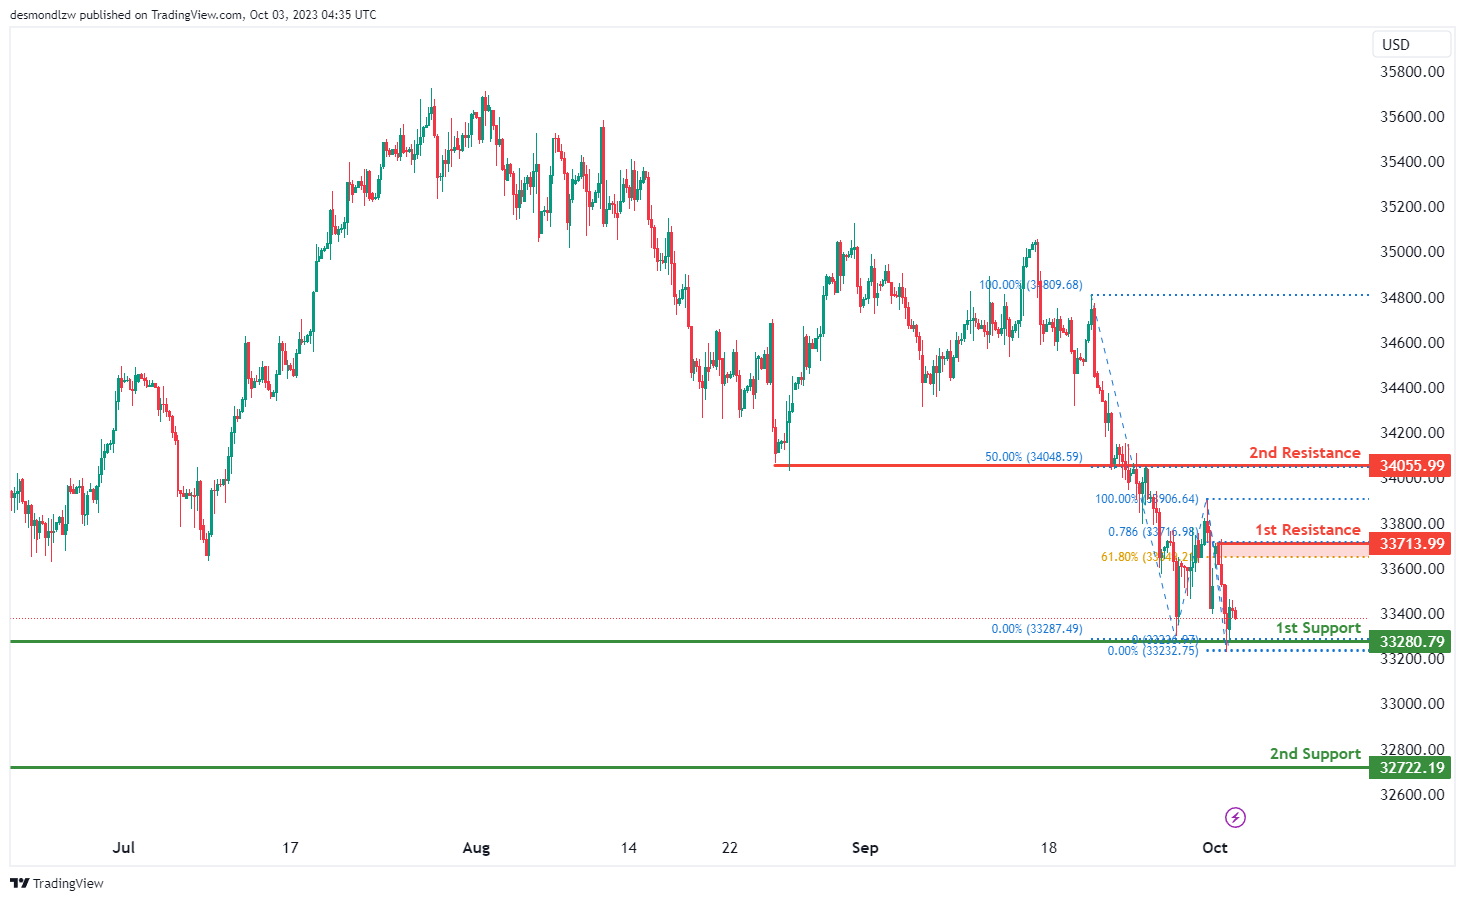
The instrument being analyzed is DJ30, and the current overall momentum of its chart is bullish.
There is a potential scenario where the price could make a bullish bounce off the 1st support level, which is at 33280.79, and head towards the 1st resistance level at 33713.99.
The 1st support at 33280.79 is considered significant because it acts as an overlap support.
Additionally, there is a 2nd support level at 32722.19, which is also valuable as it functions as a swing low support.
On the resistance side, the 1st resistance level at 33713.99 is considered important because it represents a swing high resistance. Furthermore, this level aligns with both a 61.80% Fibonacci Retracement and a 78.60% Fibonacci Projection, indicating Fibonacci confluence and adding to its significance.
Moreover, there is a 2nd resistance level at 34055.99, which is deemed important as it represents an overlap resistance and corresponds to a 50% Fibonacci Retracement, contributing to its significance in the analysis.
GER40:
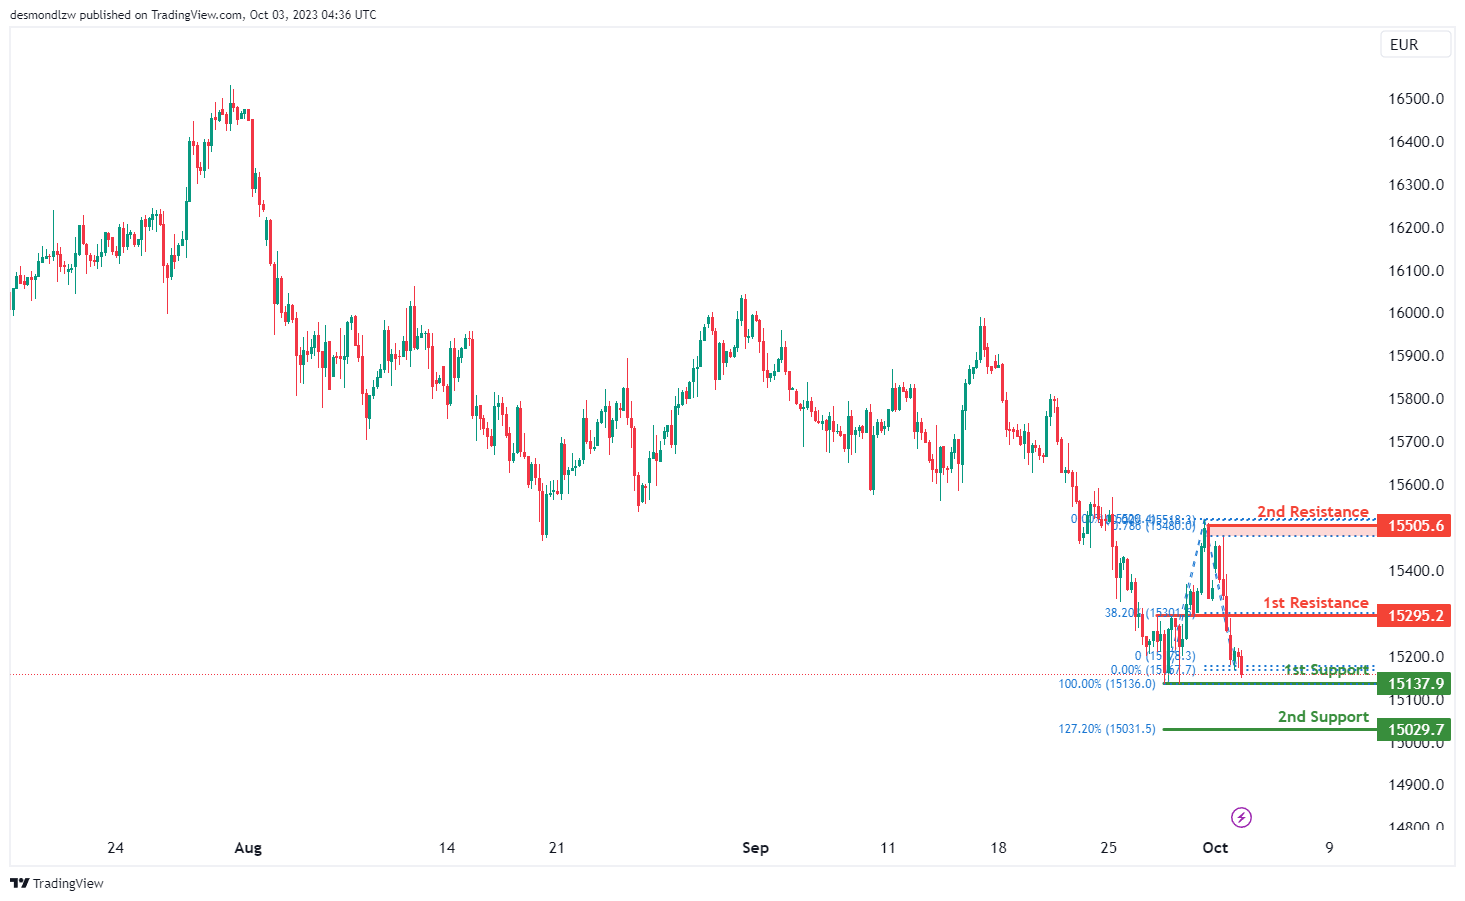
The instrument being analyzed is GER40, and the current overall momentum of its chart is bullish.
There is a potential scenario where the price could make a bullish bounce off the 1st support level, which is at 15137.90, and head towards the 1st resistance level at 15295.20.
The 1st support at 15137.90 is considered significant because it acts as a multi-swing low support.
In addition, there is a 2nd support level at 15029.70, which is also notable due to its status as a 127.20% Fibonacci Extension.
On the resistance side, the 1st resistance level at 15295.20 is considered important because it represents a pullback resistance. Furthermore, this level corresponds to a 38.20% Fibonacci Retracement, adding to its significance.
Moreover, there is a 2nd resistance level at 15505.60, which holds importance as a swing high resistance. This level aligns with a 78.60% Fibonacci Projection, contributing to its significance in the analysis.
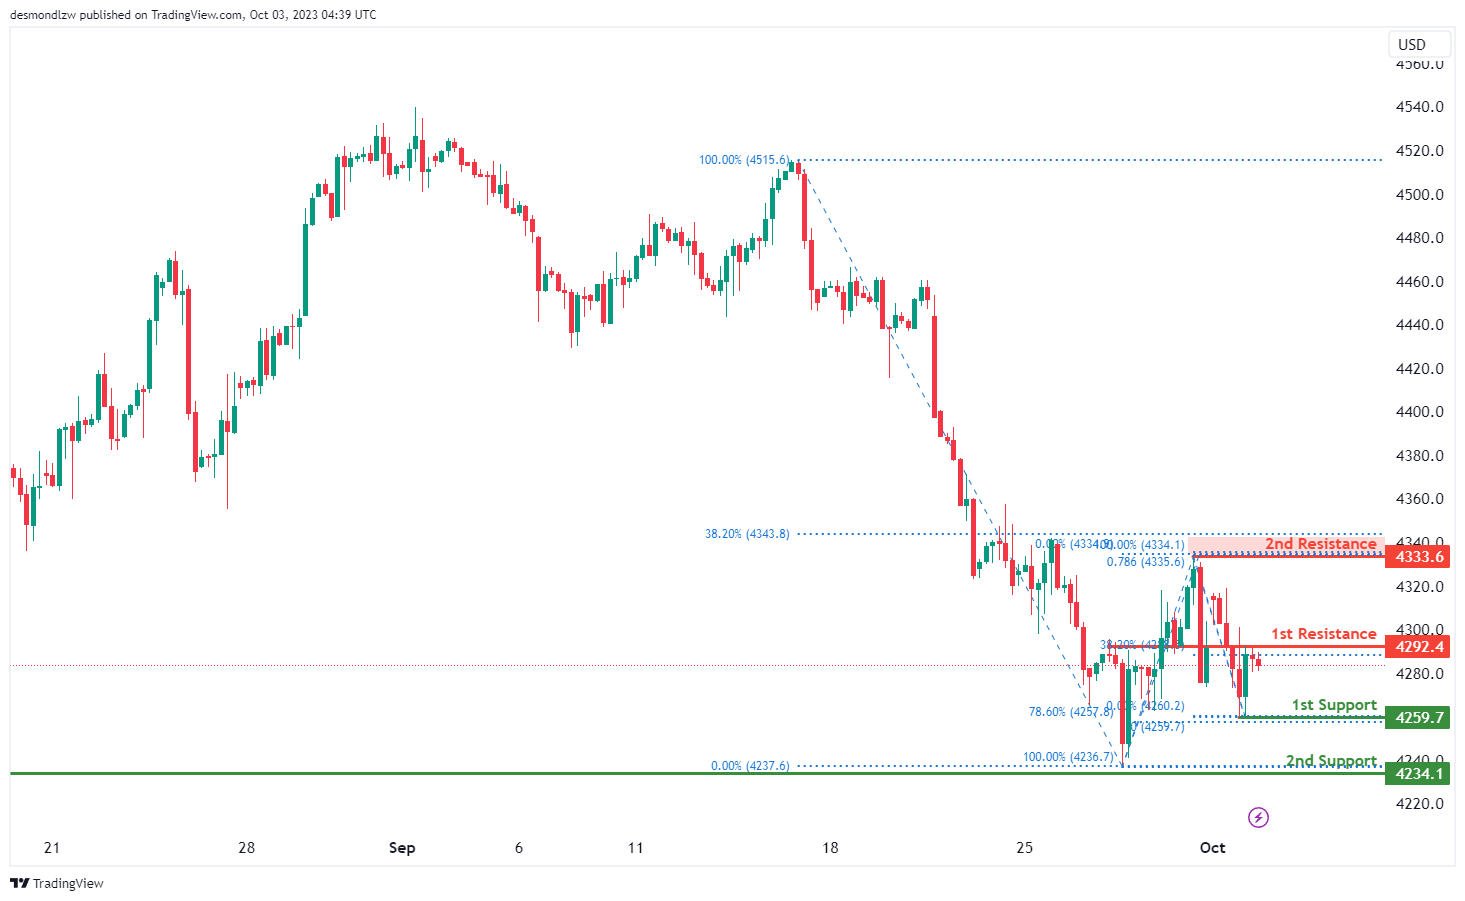
US500
The instrument being analyzed is US500, and the current overall momentum of its chart is bearish. Several factors contribute to this bearish momentum.
There is a potential scenario where the price could make a bearish reaction off the 1st resistance level, which is at 4292.4, and subsequently drop to the 1st support level at 4259.7.
The 1st support at 4259.7 is considered significant because it acts as a swing low support and corresponds to a 78.60% Fibonacci Retracement level.
Additionally, there is a 2nd support level at 4234.1, which is also notable because it functions as an overlap support.
On the resistance side, the 1st resistance level at 4292.4 is considered important because it represents an overlap resistance. Furthermore, this level aligns with a 38.20% Fibonacci Retracement, adding to its significance.
Moreover, there is a 2nd resistance level at 4333.6, which holds importance as a swing high resistance. This level coincides with both a 78.60% Fibonacci Projection and a 38.20% Fibonacci Retracement, indicating Fibonacci confluence and further enhancing its significance in the analysis.
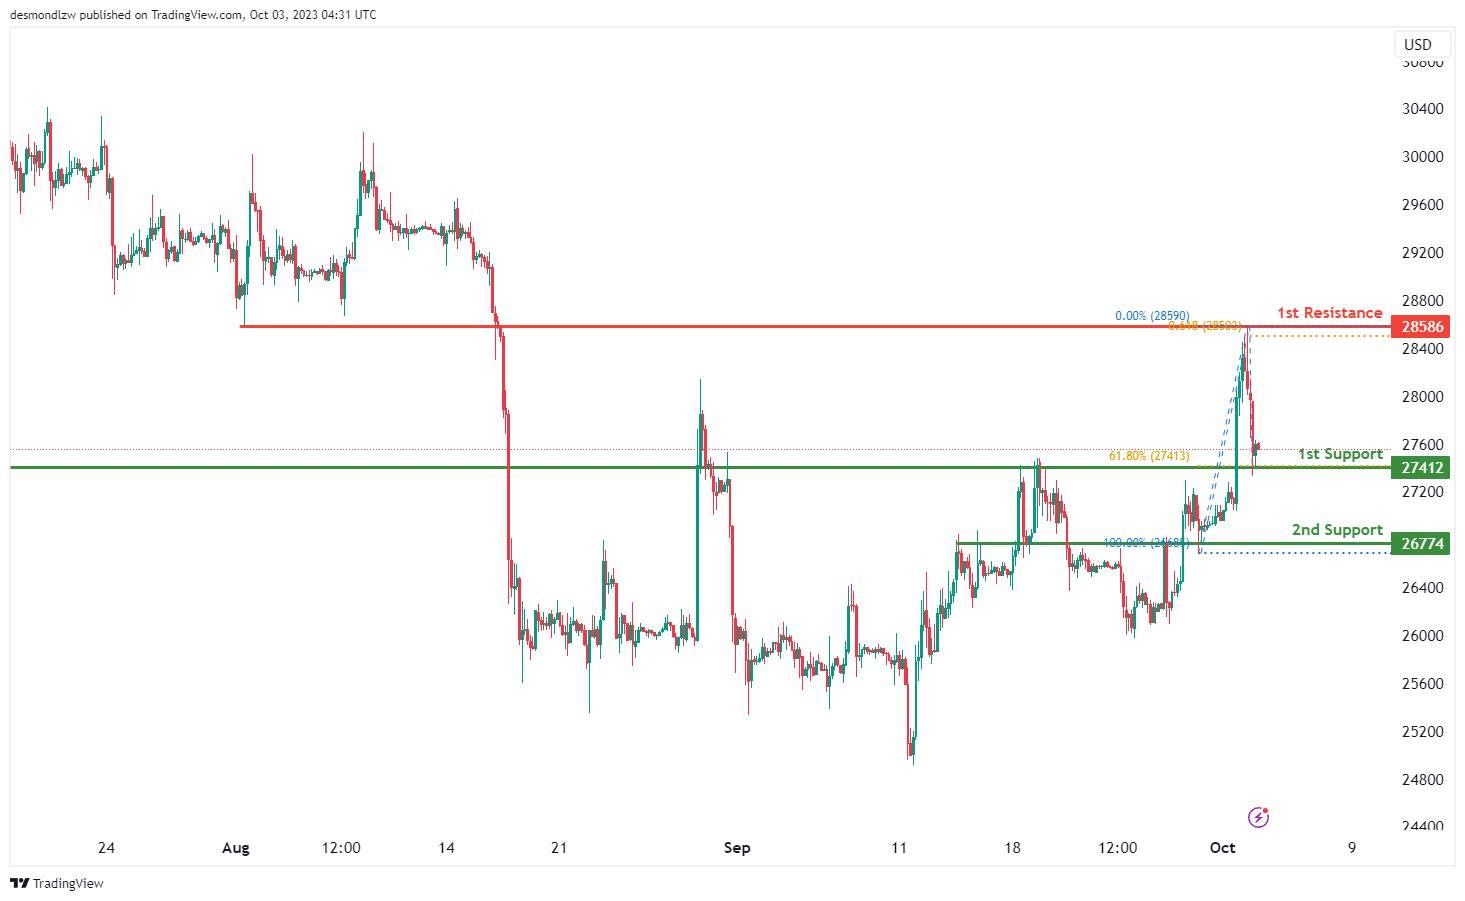
BTC/USD:
The instrument being analyzed is BTC/USD, and the current overall momentum of its chart is bullish. Several factors contribute to this bullish momentum.
There is a potential scenario where the price could make a bullish bounce off the 1st support level, which is at 27412, and head towards the 1st resistance level at 28586.
The 1st support at 27412 is considered significant because it acts as an overlap support and coincides with a 61.80% Fibonacci Retracement level, adding to its importance in the analysis.
Additionally, there is a 2nd support level at 26774, which is also valuable as it functions as an overlap support.
On the resistance side, the 1st resistance level at 28586 is considered important because it represents an overlap resistance. Furthermore, this level aligns with a 61.80% Fibonacci Projection, contributing to its significance in the analysis.
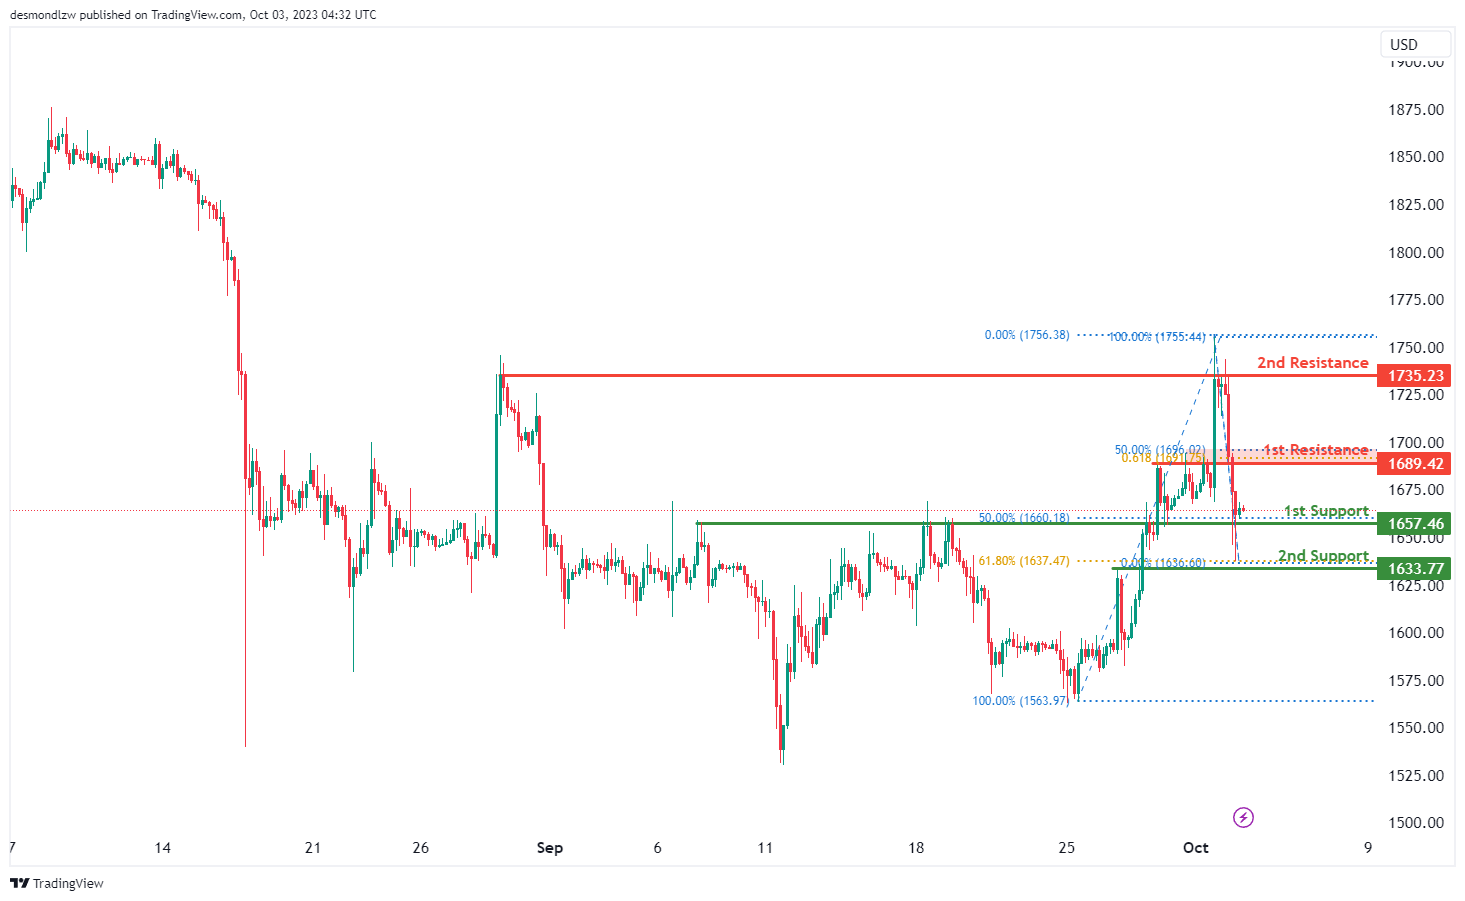
ETH/USD:
The instrument being analyzed is ETH/USD, and the current overall momentum of its chart is bullish.
There is a potential scenario where the price could make a bullish bounce off the 1st support level, which is at 1649.76, and head towards the 1st resistance level at 1689.42.
The 1st support at 1649.76 is considered significant because it acts as an overlap support and corresponds to a 50% Fibonacci Retracement level.
Additionally, there is a 2nd support level at 1633.77, which is also valuable as it functions as a pullback support and aligns with a 61.80% Fibonacci Retracement level.
On the resistance side, the 1st resistance level at 1689.42 is considered important because it represents a pullback resistance. Furthermore, this level coincides with both a 50% Fibonacci Retracement and a 61.80% Fibonacci Projection, indicating Fibonacci confluence and adding to its significance.
Moreover, there is a 2nd resistance level at 1735.23, which holds importance as a multi-swing high resistance in the chart analysis.
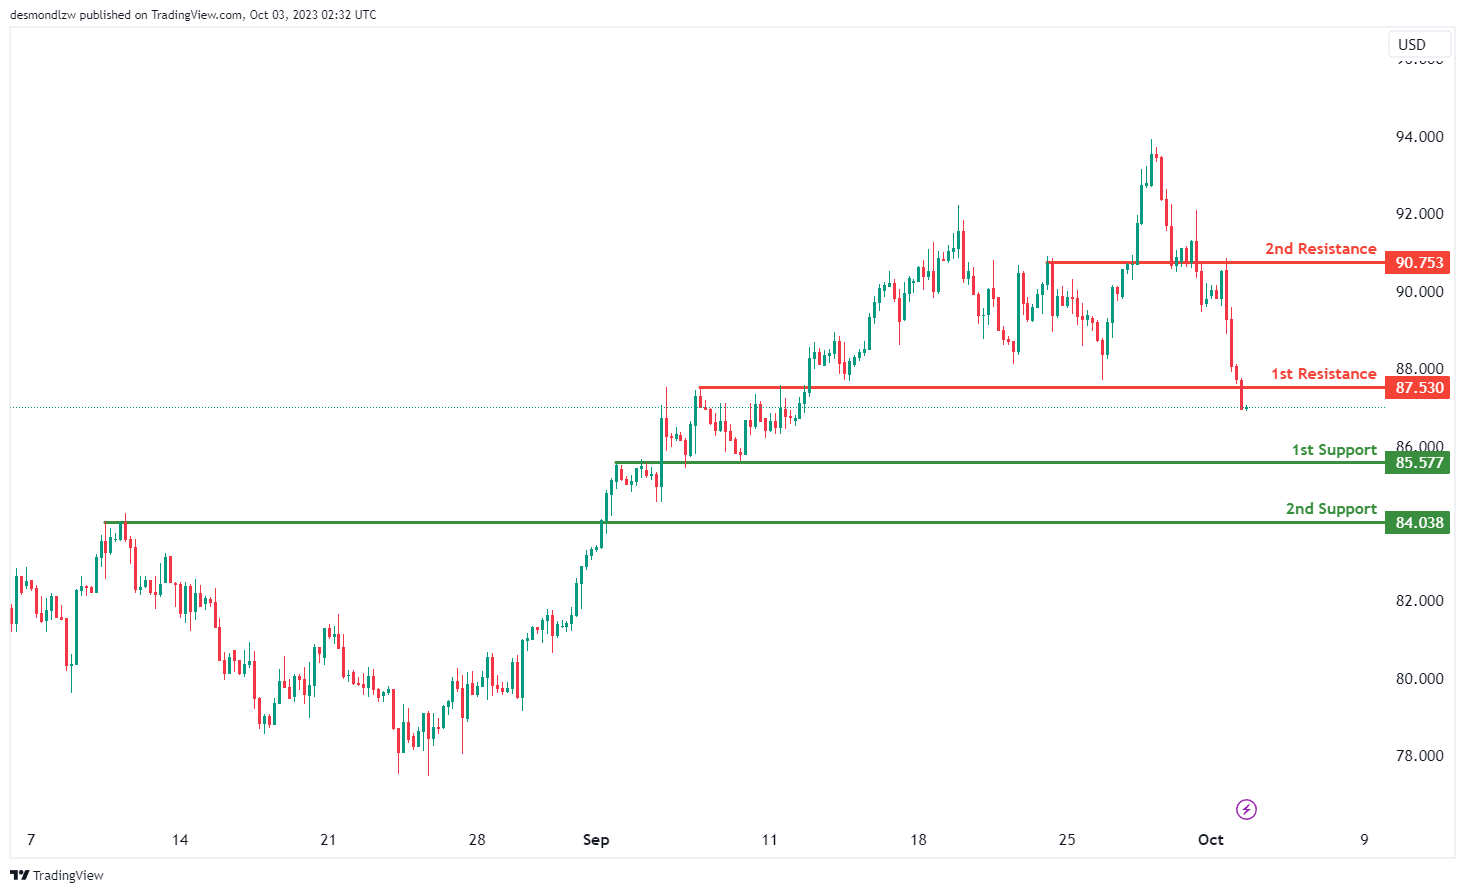
WTI/USD:
The WTI chart currently has a bearish momentum, and there’s a potential scenario of a bearish continuation towards the 1st support level.
The 1st support at 85.57 is considered significant as it’s identified as an overlap support, making it an important level where the price might find some support. Additionally, the 2nd support at 84.03 is categorized as a pullback support, further underpinning its role as a key level for potential price support.
On the resistance side, the 1st resistance level at 87.53 is marked as a pullback resistance, potentially limiting upward movements. Beyond this, the 2nd resistance at 90.75 is identified as an overlap resistance, representing another potential barrier to bullish advancements in the price.
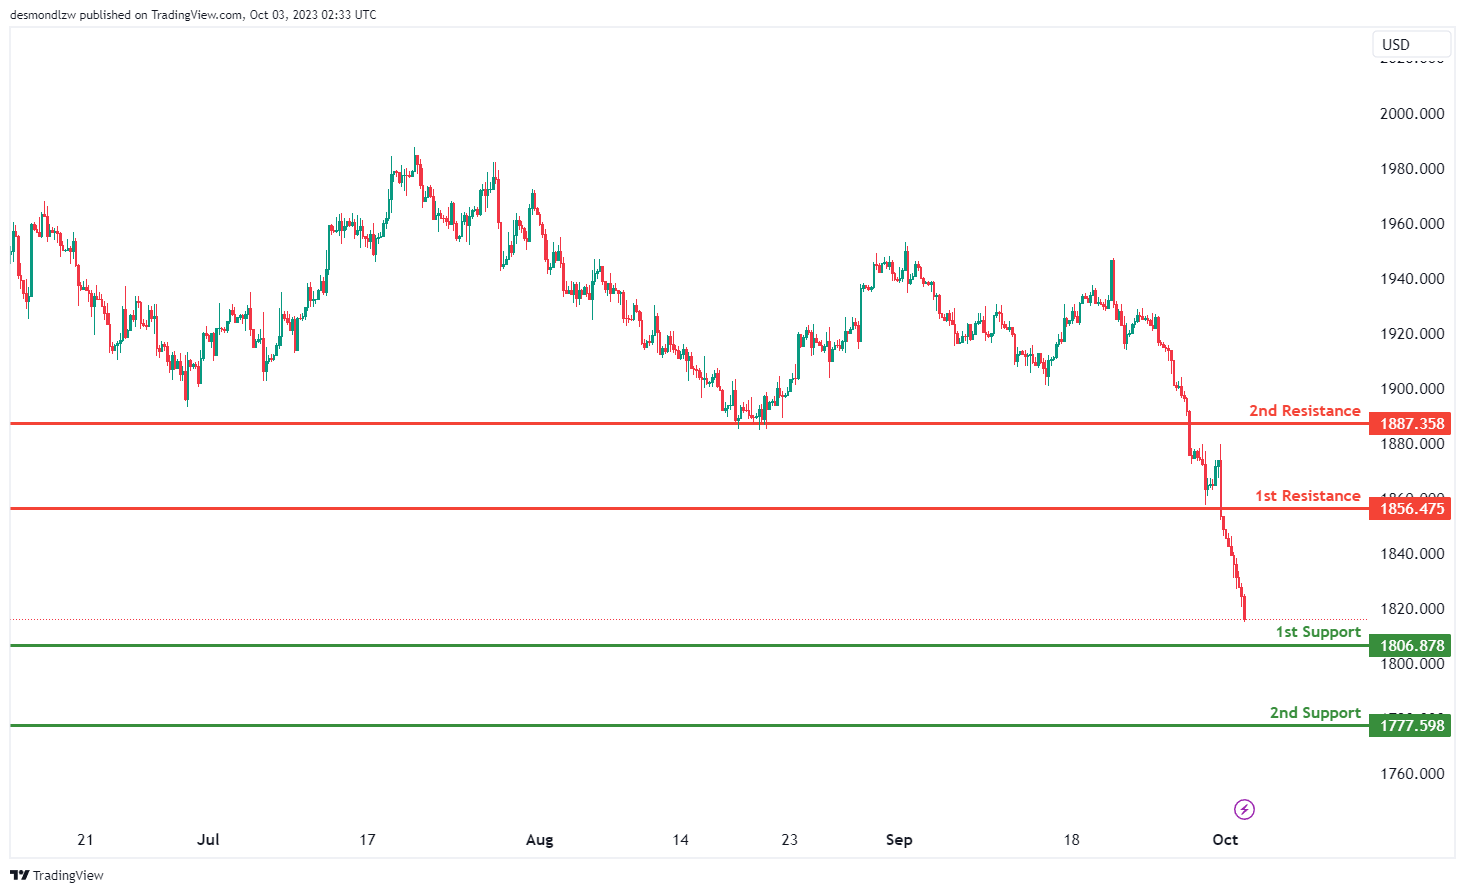
XAU/USD (GOLD):
The XAUUSD chart currently exhibits a bearish momentum, with a potential scenario of a bearish continuation towards the 1st support level.
The 1st support at 1806.00 is considered significant as it’s identified as an overlap support, making it a crucial level for potential price support. Furthermore, the 2nd support at 1777.59 is also categorized as an overlap support, reinforcing its importance as a potential zone where the price may find support.
On the resistance side, the 1st resistance level at 1856.47 is marked as a pullback resistance, potentially limiting upward movements. Beyond this, the 2nd resistance at 1887.35 is identified as a swing high resistance
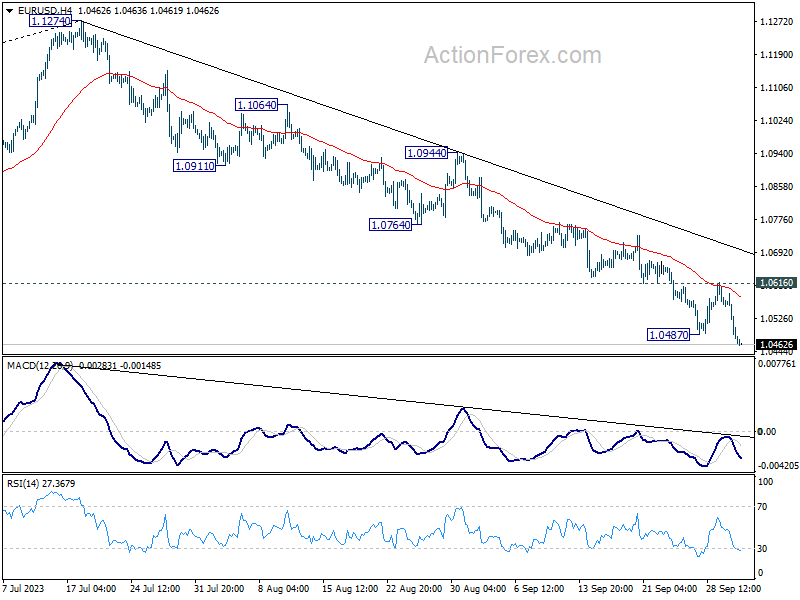
EUR/USD Daily Outlook
Daily Pivots: (S1) 1.0440; (P) 1.0516; (R1) 1.0554; More...
Intraday bias in EUR/USD is back on the downside with break of 1.0487. Fall from 1.1274 is resuming and should target 1.0199 fibonacci level next. On the upside, break of 1.0616 resistance is needed to indicate short term bottoming. Otherwise, outlook will stay bearish in case of recovery.
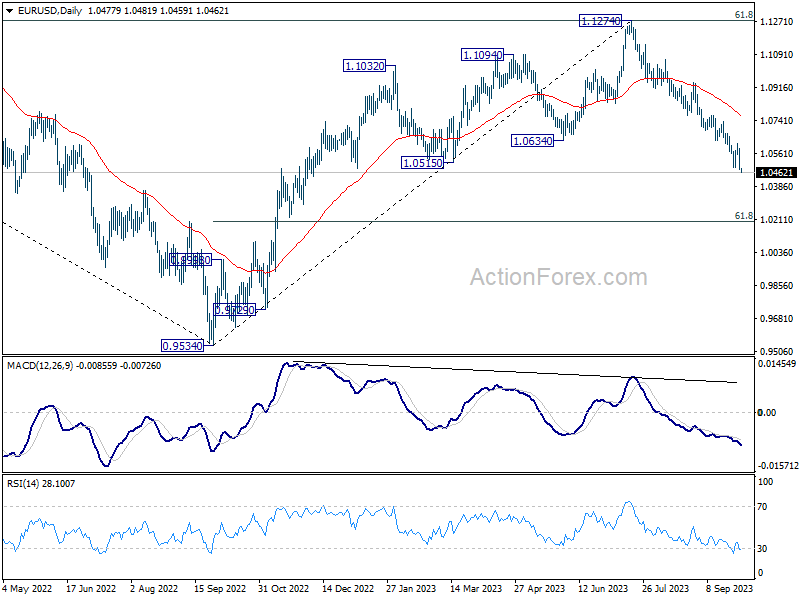
In the bigger picture, fall from 1.1274 medium term top could still be a correction to rise from 0.9534 (2022 low). But chance of a complete trend reversal is rising. In either case, current fall should target 61.8% retracement of 0.9534 to 1.1274 at 1.0199 next. For now, risk will stay on the downside as long as 55 D EMA (now at 1.0759) holds, in case of rebound.
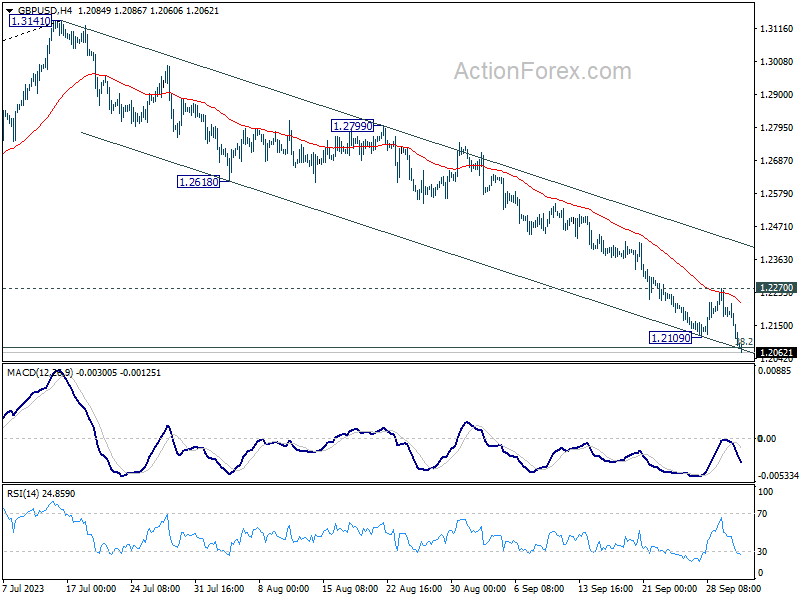
GBP/USD Daily Outlook
Daily Pivots: (S1) 1.2042; (P) 1.2131; (R1) 1.2176; More...
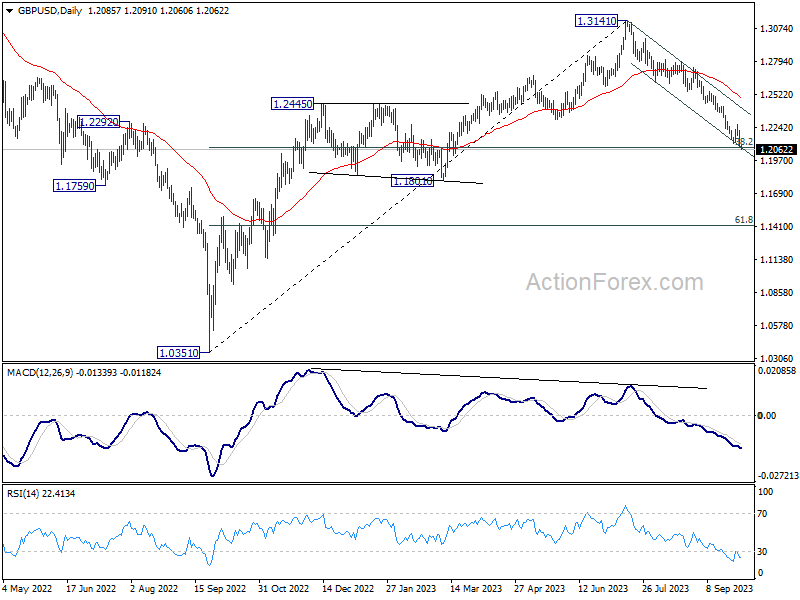
Intraday bias in GBP/USD is back on the downside with break of 1.2109 support. Sustained trading below 1.2075 fibonacci level would carry larger bearish implication. Fall from 1.3141 should then target 1.1801 support next. On the upside, break of 1.2270 resistance is needed to indicate short term bottoming. Otherwise, outlook will stay bearish in case of recovery.
In the bigger picture, fall from 1.3141 medium term top could still be a correction to up trend from 1.0351 (2022 low) only. But risk of complete trend reversal is rising. Sustained break of 38.2% retracement of 1.0351 to 1.3141 at 1.2075 will pave the way to 61.8% retracement at 1.1417. For now, risk will stay on the downside as long as 55 D EMA (now at 1.2486) holds, in case of rebound.
USD/JPY Daily Outlook
Daily Pivots: (S1) 149.58; (P) 149.73; (R1) 150.02; More...
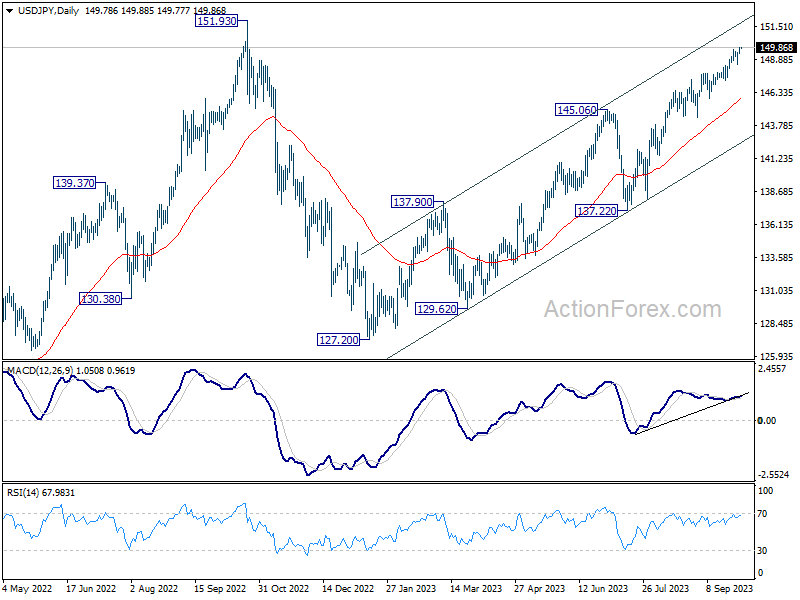
USD/JPY's rally is in progress and intraday bias stays on the upside. Current rise from 127.20 should target a retest on 151.93 high next. On the downside, break of 148.51 support is needed to indicate short term topping. Otherwise, outlook will stay bullish in case of retreat.
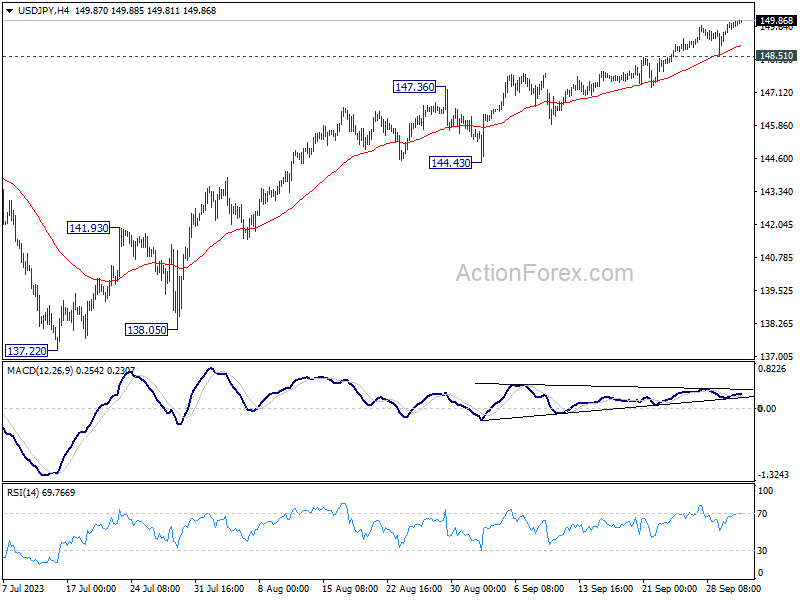
In the bigger picture, while rise from 127.20 is strong, it could still be seen as the second leg of the corrective pattern from 151.93 (2022 high). Rejection by 151.93, followed by break of 145.06 resistance turned support will be the first sign that the third leg of the pattern has started. However, sustained break of 151.93 will confirm resumption of long term up trend.