

Sample Category Title
Sunset Market Commentary
Markets
Sub-par US JOLTS job openings and consumer confidence yesterday triggered a sharp rally in US Treasuries, with markets only discounting a limited chance of a Fed September rate hike. However, the spill-over the EMU markets was modest after all. Today’s first national EMU CPI series at least illustrated that there was good reason for European bond investors to take a more guarded approach. German August HICP inflation slowed less than hoped for to 0.4% M/M and 6.4% (from 6.5%). Spanish HICP inflation reaccelerated after a very low July reading to 0.5% M/M and 2.4% (from -0.1% M/M and 2.1% Y/Y). The release was as expected, but core inflation also slowed less than expected from 6.2% to 6.1%. Inflation in Belgium in August printed in line with July at 0.76% M/M and 4.09 Y/Y. In line with the PMI’s, economic confidence from the European Commission declined further to 93.3 from 94.5, further complicating the ECB’s decision making process. Short-term European yields opened up to 7 bps higher after the first German regional CPI, but momentum ebbed later, especially after the US date releases. German yields currently only maintain limited gains between 1.5. bps (2-y) and 3.0 bps (10-y). Money markets still see an near 50/50 chance for a new 25 bps rate hike at the ECB at the 14 September meeting. In the US, ADP private job growth slowed lightly more than expected to 177k. Last month’s impressive 324k growth was revised even higher to 371k, suggesting a still healthy US job market this summer. US Q2 GDP growth (QoQa) was slightly downwardly revised to 2.1% from 2.4% as was the core PCE deflator (3.7% from 3.8%). While old news, US Treasuries a bit strangely gained traction after the report. In a continuation of yesterday’s steepening the US 2-y yield eases 5 bps. The 30-y trades little changed. Stubbornly high EMU inflation annex the risk of (EMU) interest rates to stay high for even longer than currently expected, probably was one of the reasons for this week’s rebound of EMU equities to run into resistance (Eurostoxx 50 -0.1%). US equities open with limited gains after a three-day rebound (S&P +0.2%).
In FX markets, the euro initially hardly gained on the EMU inflation data. A bit strangely, finally it was the dollar that succumbed after the US Q2 GDP revision. EUR/USD regained the 1.09 big figure (1.092) and is breaking out of the downtrend channel since mid-July. DXY extends its correction (103.1 from 103.53 open). The yen still only profits from the correction especially in US yields trading at USD/JPY 145.65 after touching a YTD top of 147.37 yesterday. In the, UK money supply and lending data were on the softer side of expectations. UK Gilts slightly outperform Bunds. However, for now this is causing no further harm for sterling. EUR/GBP yesterday and this morning tested the 0.861 area, but move stalled (currently 0.859).
News & Views
Belgian inflation rose by 0.76% M/M in August with the annual figure virtually stabilizing at 4.09% Y/Y (from 4.14%). Core inflation stood at 7.7% Y/Y from 7.88% in July. Inflation for services was almost flat at 7.26%. Inflation for rents has increased to 6.14% from 6.07%. Food inflation (including alcoholic beverages) now stands at 12.73%. The most significant price increases in August were registered for motor fuels (6.8% M/M), liquid fuels (12.5% Y/Y), hotel rooms (9.4% M/M), confectionery (6.1% M/M), bread and cereals (1.6% M/M), alcoholic beverages (3.1% M/M), non-alcoholic beverages (2.3% M/M), organized vacations in Belgium (10.9% M/M) and personal care (1.5%M/M). However, electricity (-2.5% M/M), fruit (-4.2% M/M) and plane tickets (-7.1% M/M) have had a decreasing effect on the index.
The Swiss KOF Economic Barometer decreased in August from 92.1 to 91.1 and that way remains at a below-average level. Details showed a general deterioration except for construction and domestic consumption. By contrast, sentiment has particularly worsened in services, followed by export-oriented business and hotels and restaurants. In the producing sector (manufacturing and construction), in particular the indicators on the employment situation developed negatively. The Swiss franc loses out against an overall stronger euro today with EUR/CHF rising to 0.9575 from 0.9550.
How Will China’s Regulation Affect Oil?
China has issued new oil product export quotas to allow oil companies to send surplus barrels overseas, particularly Sinopec, which has the highest volume among quota holders. While the exact quota volume remains undisclosed, oil companies are forecasted to export approximately 3.5 million metric tons of clean oil products in September, a 10% increase from August. This move is seen as a strategy to support industrial activities, boost the country's economy, and sustain crude oil imports. The government controls China's clean oil product exports through quota allocations, focusing on meeting domestic demands. China exported 23.99 million metric tons of gasoline, jet fuel, and gasoil in the first seven months of the year, up 76.1% compared to the same period in 2022.
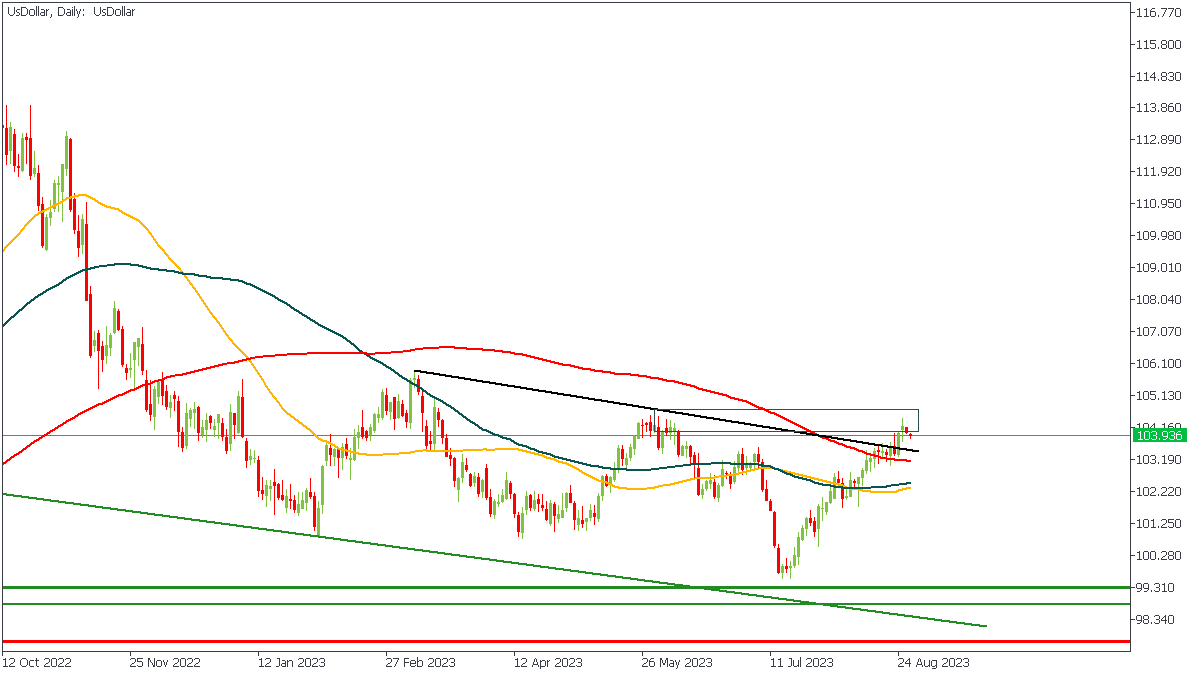
US Dollar - D1 Timeframe
The US Dollar has been prepping for a bearish move for a couple of weeks now, and it seems fully ready to make the move. The resistance trendline, 200-day moving average, and the rally-base-drop supply appear to cause the bearish momentum. In this case, I expect that the bears remain in charge for at least a short while since the price may create a new, lower low.
Analyst’s Expectations:
- Direction: Bearish
- Target: 102.630
- Invalidation: 103.771
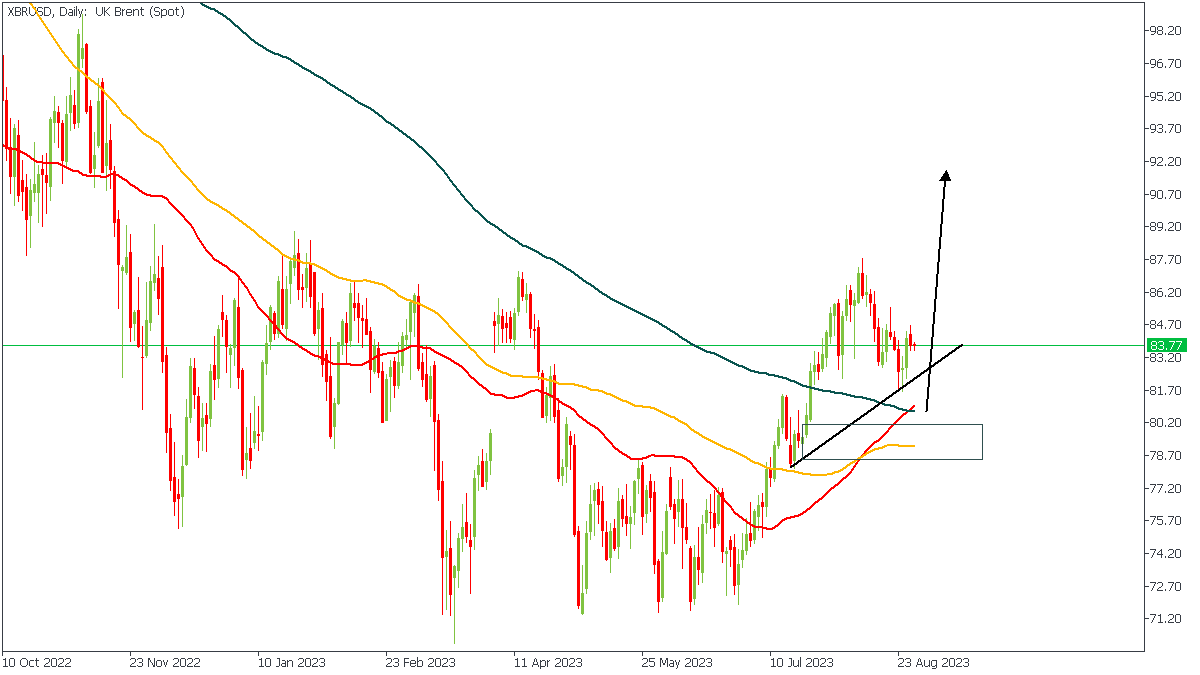
XBRUSD - D1 Timeframe
XBRUSD, as seen in the chart above, has made an initial reaction from the trendline support. However, the price may slip lower toward the 200-day Moving average to find a much stronger confluence based on the demand zone, 88% Fibonacci retracement level, and the moving average support.
Analyst’s Expectations:
- Direction: Bullish
- Target: 88.55
- Invalidation: 78.45
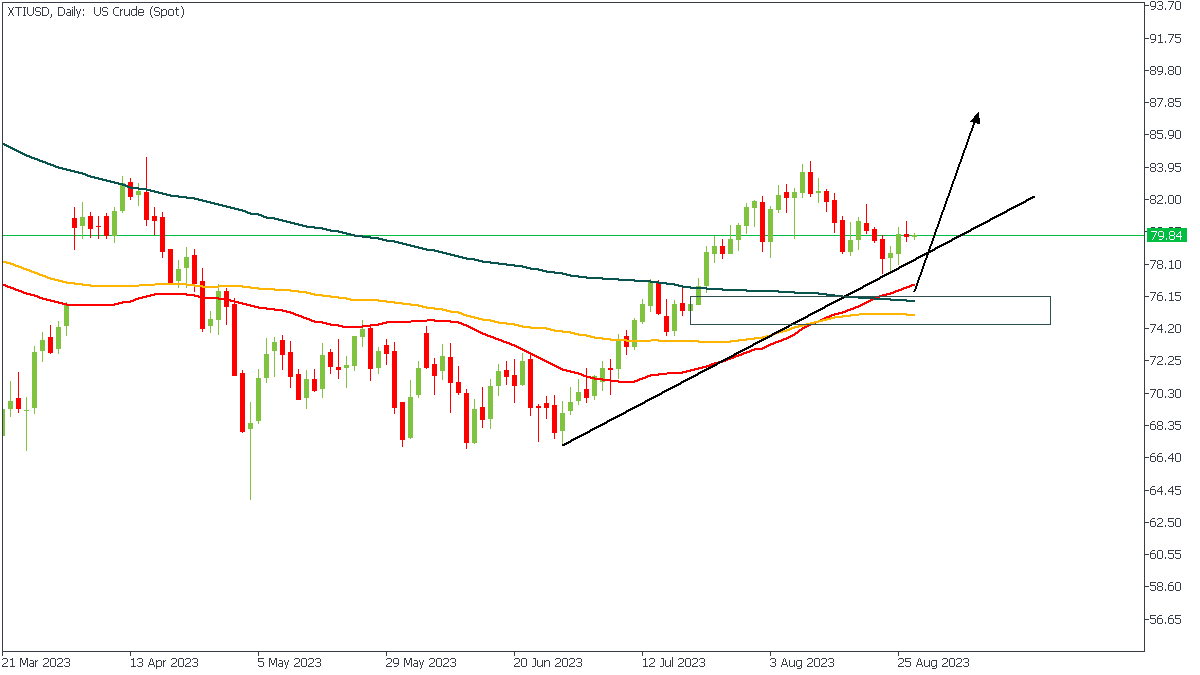
XTIUSD - D1 Timeframe
Like XBRUSD, as we saw earlier, the price action on XTIUSD has also made its initial pull away from the trendline support. However, I find it hard to rely on this move because the current market reaction doesn't take place from an actively interesting confluence area. In that sense, I hope to see the price slink into the highlighted demand zone close to the 200-day moving average for my entry consideration.
Analyst’s Expectations:
- Direction: Bullish
- Target: 84.59
- Invalidation: 74.12
CONCLUSION
The trading of CFDs comes at a risk. Thus, to succeed, you have to manage risks properly. To avoid costly mistakes while you look to trade these opportunities, be sure to do your due diligence and manage your risk appropriately.
US: Q2 Real GDP Expanded by a Healthy 2.1%, While GDI Sees Modest Gain
The Bureau of Economic Analysis' second estimate of Q2-2023 real GDP was revised 0.3%-pts lower to 2.1% quarter-over-quarter (q/q, annualized).
Consumer spending advanced by 1.7% – largely unchanged from the previously reported gain of 1.6%. Spending on services was a tick higher at 2.2% but was partially offset by slightly weaker spending on goods (+0.6%).
Non-residential fixed business investment grew by 6.6% (1.5%-pts weaker than the previously reported gain of 7.7%). Structures investment was revised higher (to 11.3% from 9.7%), while both equipment (7.7% from 10.8%) and intellectual property products (2.2% from 3.9%) were softer.
Residential investment declined for the ninth consecutive quarter, falling by 3.6%.
Both imports (-7.0%) and exports (-10.6%) were relatively unchanged from the advance estimate. Overall, net trade's impact on Q2 growth was small, shaving just 0.2%-pts from GDP.
Inventories investment was revised lower and is now estimated to have shaved 0.1%-pts from GDP (previously +0.1%-pts).
Government spending was revised higher to 3.3% (from 2.6%).
Real Gross Domestic Income rose by 0.5% in the second quarter, in contrast to a decline of 1.8% in Q1. Corporate profits were modestly lower, falling by 1.5% (annualized) or $10.6 billion after accounting for inventory valuation and capital consumption adjustments. However, this was more than offset by a solid gain in personal income (+4.2%).
- In terms of the breakdown, corporate profits were lower across the financial sector (-$47.9 billion billion), but modestly higher across the non-financial (+$17.1 billion) sector. The pullback in the former can largely be attributed to the Federal Reserve incurring further losses on its QE bond holdings as interest rates have moved higher.
- Measured as a share of nominal GDP, corporate profits currently sit at 10.5%, or 1.3%-pts below its 2019 average of 11.2%.
Key Implications
Despite the modest downward revisions, the second estimate of Q2 GDP continued to show that economic growth expanded at an above-trend pace last quarter, with all the strength concentrated within domestic demand (i.e., consumption, fixed investment, and government). The acceleration in Q2 business investment is perhaps most notable, reflecting direct and indirect forces related to federal subsidies for green technology, and the delayed post-pandemic recovery trends in the transportation sector (see Quarterly Q&A).
After having contracted in each of the two previous quarters, GDI recorded a modest gain in Q2, helping to narrow what been a historically wide gap between the two measures. The uptick was largely driven by continued gains in personal income, which are helping sustain a healthy pace of consumer spending. That momentum is expected to carry into the third quarter, where GDP growth is currently tracking 3.3%, with consumer spending also looking to advance by over 3%.
USD/JPY Mid-Day Outlook
Daily Pivots: (S1) 145.24; (P) 146.31; (R1) 146.94; More...
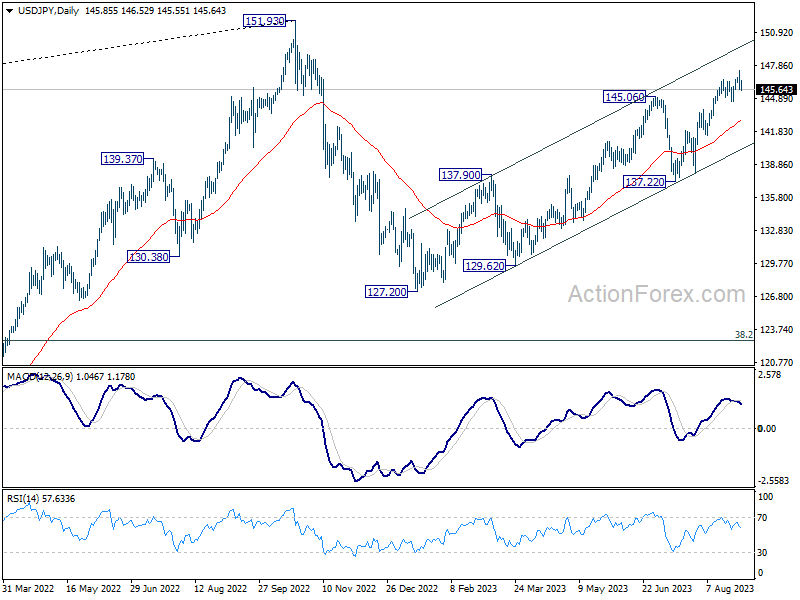
Intraday bias in USD/JPY remains neutral for the moment. Further rally is in favor as long as 144.52 support holds. Above 147.36 will resume the rise from 127.20 to retest 151.93 high. On the downside, however, firm break of 144.52 should confirm short term topping, and turn bias back to the downside for 55 D EMA (now at 142.86).
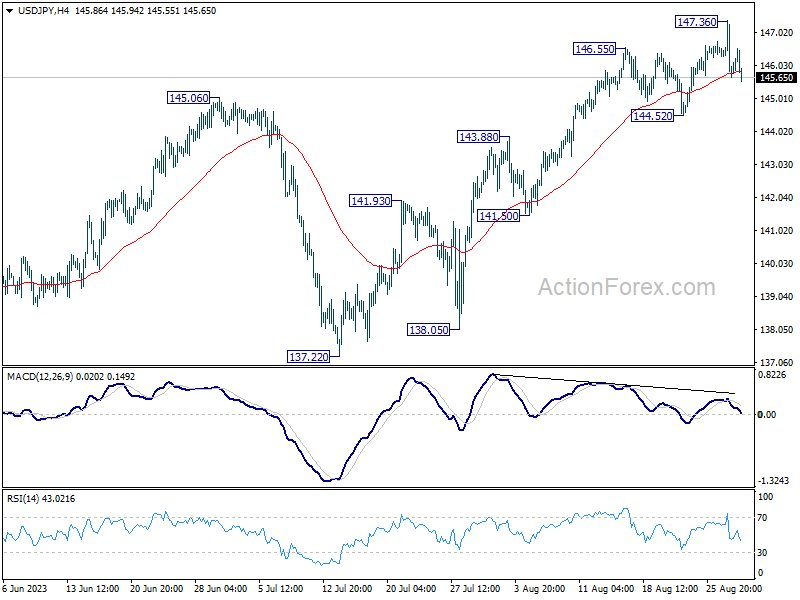
In the bigger picture, overall price actions from 151.93 (2022 high) are views as a corrective pattern. Rise from 127.20 is seen as the second leg of the pattern and could still be in progress. But even in case of extended rise, strong resistance should be seen from 151.93 to limit upside. Meanwhile, break of 137.22 support should confirm the start of the third leg to 127.20 (2023 low) and below.
USD/CHF Mid-Day Outlook
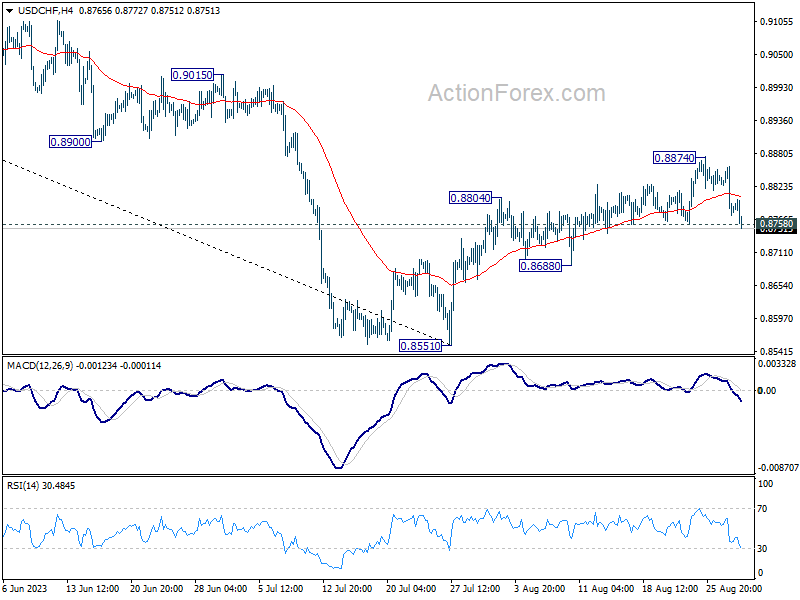
Daily Pivots: (S1) 0.8753; (P) 0.8806; (R1) 0.8837; More....
Immediate focus is now on 0.8758 support in USD/CHF with today's fall. Firm break there will argue that corrective rebound from 0.8551 has completed at 0.8874. Intraday bias will be turn back to the downside for 0.8688 support, and then 0.8551 low. Strong rebound from current level will retain near term bullishness though. Break of 0.8874 will resume the rise from 0.8551 to 0.9146 cluster resistance next.
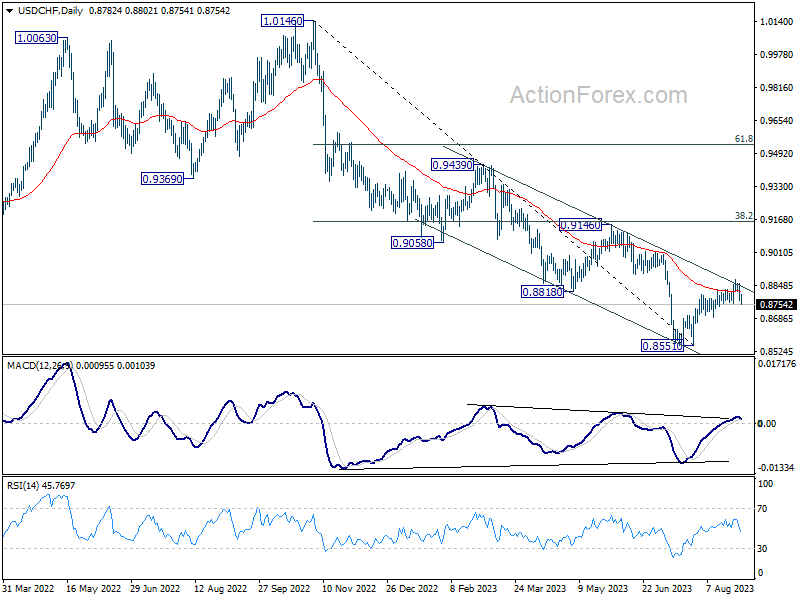
In the bigger picture, rebound from 0.8551 medium term bottom is currently seen as a correction to the downtrend from 1.0146 (2022 high). Further rally would be seen to 0.9146 cluster resistance (38.2% retracement of 1.0146 to 0.8551 at 0.9160). Strong resistance could be seen there to limit upside, at least on first attempt. Nevertheless, medium term outlook is neutral at best as long as 0.8551 holds, until further developments.
GBP/USD Mid-Day Outlook
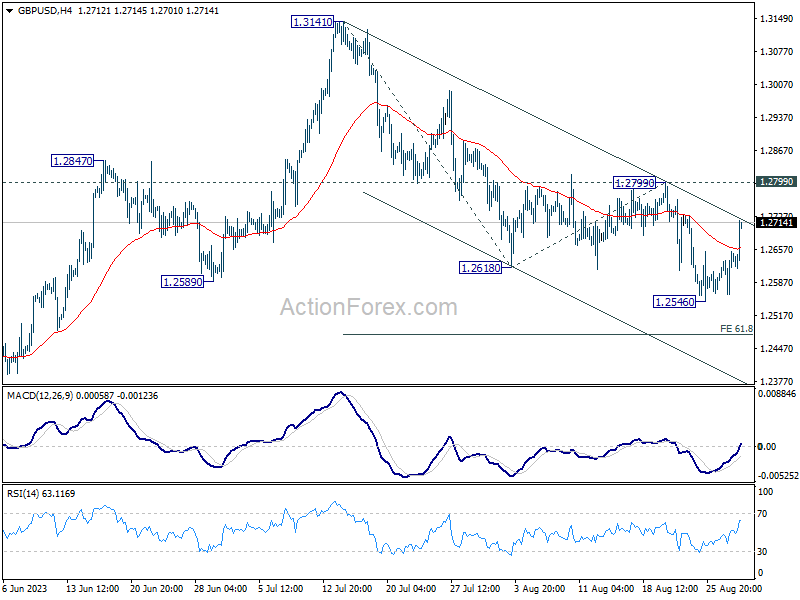
Daily Pivots: (S1) 1.2586; (P) 1.2621; (R1) 1.2678; More...
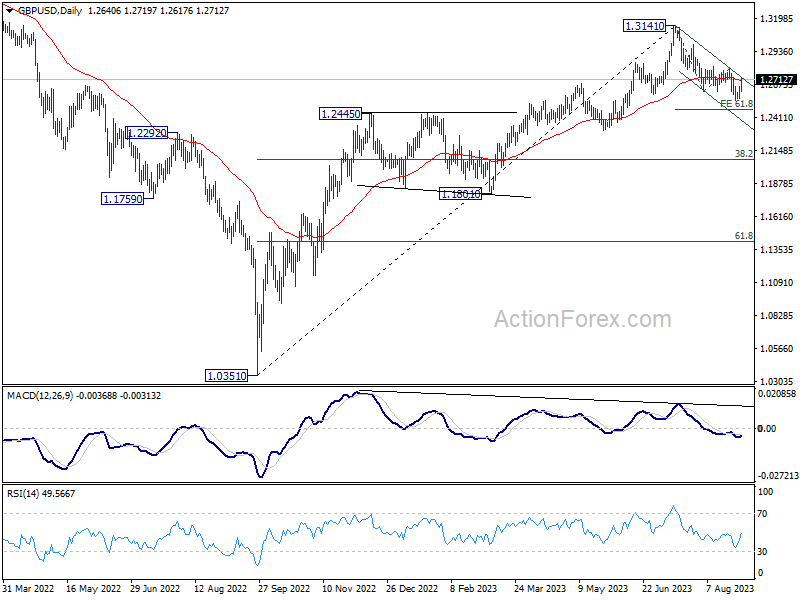
GBP/USD's rebound from 1.2546 extends higher today but it's still capped below 1.2799 resistance. Intraday bias stays neutral first. On the downside, break of 1.2546 will resume whole fall from 1.3141 to 61.8% projection of 1.3141 to 1.2618 from 1.2799 at 1.2476. However, on the upside, firm break of 1.2799 will indicate that the correction from 1.3141 has completed with three waves down to 1.2546. Intraday bias will be turned back to the upside for retesting 1.3141.
In the bigger picture, for now, fall from 1.3141 medium term top is seen as a correction to up trend from 1.0351 (2022 low). Deeper decline would be seen to 38.2% retracement of 1.0351 to 1.3141 at 1.2075. Strong support would be seen there to bring rebound on first attempt. But outlook will be neutral at best as long as 1.3141 resistance holds, and consolidation from there is set to extend, until further development.
EUR/USD Mid-Day Outlook
Daily Pivots: (S1) 1.0810; (P) 1.0851; (R1) 1.0920; More...
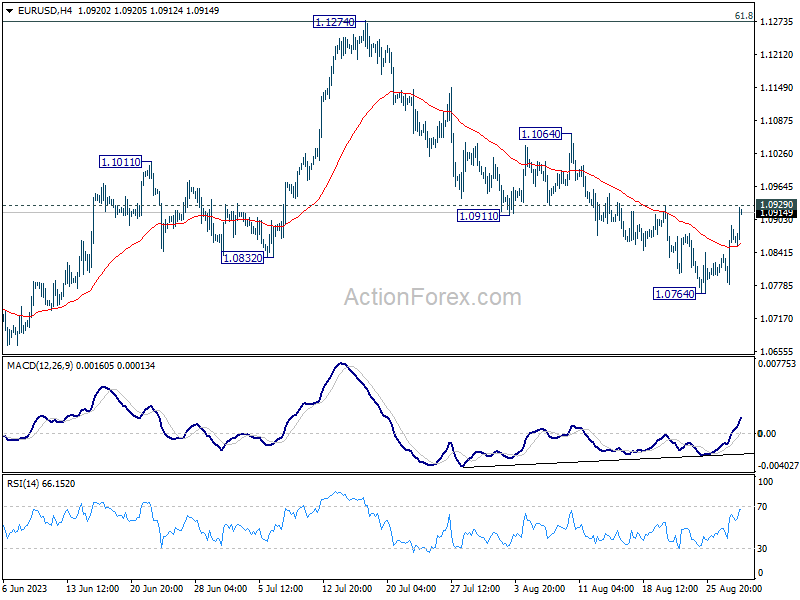
Immediate focus is now on 1.0929 resistance in EUR/USD. Firm break there will argue that the corrective fall from 1.1274 has completed with three waves down to 1.0764. Further rally would then be seen to 1.1064 resistance for confirmation. Meanwhile, rejection by 1.0929 will retain near term bearishness. Break of 1.0764 will resume the decline to 1.0609/34 cluster support next.
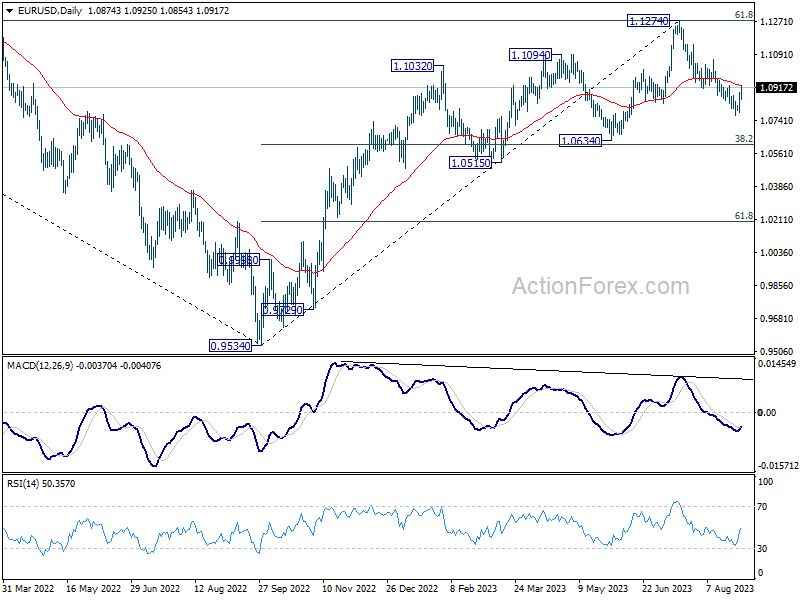
In the bigger picture, fall from 1.1274 medium term top is seen as a correction to up trend from 0.9534 (2022 low). Deeper decline would be seen to 1.0634 cluster support (38.2% retracement of 0.9534 to 1.1274 at 1.0609). Strong support could be seen there, at least on first attempt, to bring rebound. Yet, medium term outlook will be neutral for now, as long as 1.1274 resistance holds.
Dollar Slumps on ADP Miss, Gold Extending Rally
Dollar is facing accelerated selloff following the release of disappointing ADP private employment data, which showed deceleration in both job and pay growth. Although the employment numbers were by no means dismal, the cooling job market is being perceived as a positive development by Fed and market participants. This perception stems from the notion that slower job market could potentially ease the need for further monetary tightening. Subsequently, benchmark US Treasury yields tumble, indicating reduced expectations for more interest rate hikes.
As Dollar weakens, a fierce competition is shaping up among other major currencies, notably Euro, Sterling, Aussie, and Kiwi. Currently, Australian dollar has an edge, but Euro could mount a challenge, especially as the market anticipates Eurozone CPI flash report due tomorrow. The data will likely serve as a critical test for the common currency's resilience.
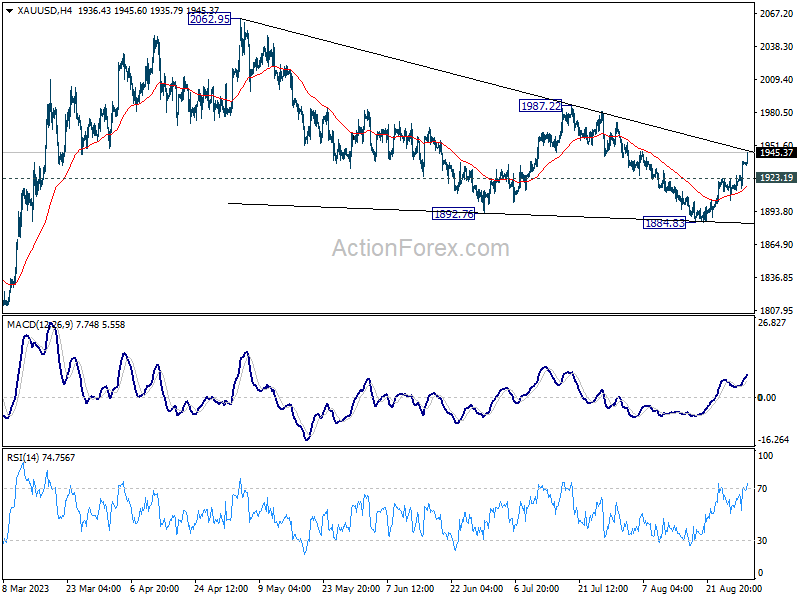
From a technical standpoint, Gold is capitalizing on Dollar's weakness. The precious metal's rally from 1884.84 extends further today. Immediate attention is now on the trend line resistance, currently situated at 1948.07. Sustained break above this level would bolster the argument that entire correction from 2062.95 has concluded with a three-wave drop down to 1884.83. Further rally would then be seen to 1987.22 resistance for confirmation. For now, further rise will remain in favor as long as 1923.19 minor support holds, in case of retreat.
In Europe, at the time of writing, FTSE is up 0.35%. DAX is down -0.06%. CAC is up 0.14%. Germany 10-year yield is up 0.029 at 2.541. Earlier in Asia, Nikkei rose 0.33%. Hong Kong HSI dropped -0.01%. China Shanghai SSE rose 0.04%. Singapore Strait Times dropped -0.09%. Japan 10-year JGB yield rose 0.0093 to 0.656.
US ADP jobs grew only 177k, wages growth slowed further
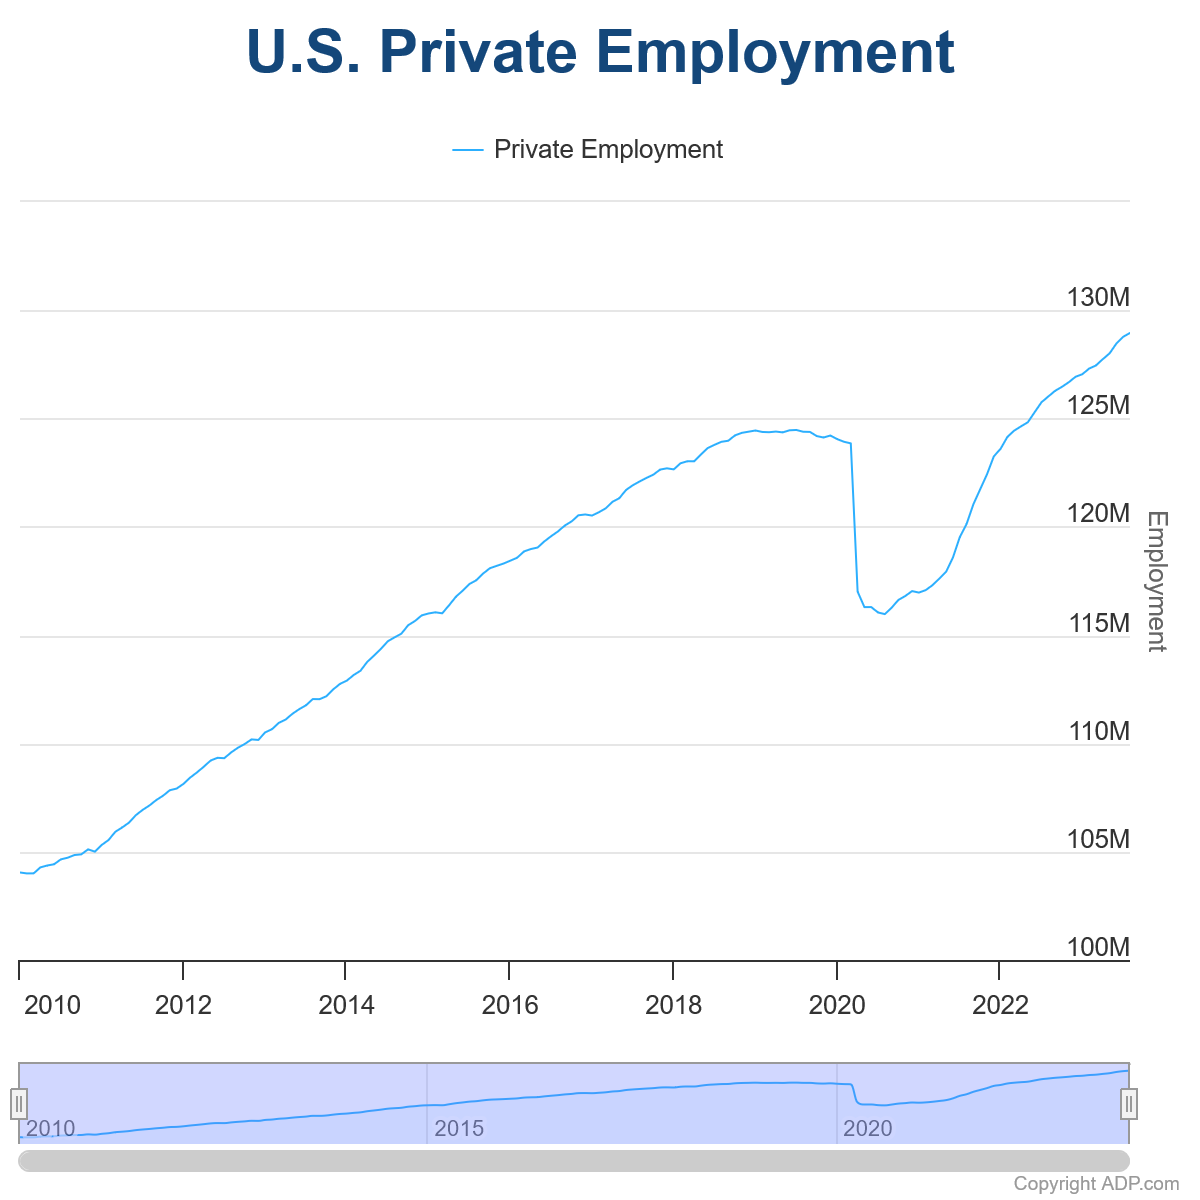
August's US ADP Private Employment report showed a lower-than-expected gain of 177k jobs, falling short of the consensus forecast of 205k. The data, which is often viewed as a precursor to the official non-farm payrolls report, painted a nuanced picture of the American labor market.
By sector, goods-producing sectors added 23k jobs, while service-providing sectors accounted for 154k new positions. By establishment size, small companies added 18k jobs, medium-sized companies contributed 79k, and large companies rounded out the additions with 83k.
Compounding the modest employment gains was a noticeable slowdown in wage growth. For those staying in their current roles, the year-over-year pay increase was 5.9%, marking the weakest growth since October 2021. Meanwhile, job changers experienced a deceleration in pay growth to 9.5%.
Nela Richardson, chief economist at ADP, provided context for these numbers. "This month's figures are consistent with the pace of job creation before the pandemic," she said. "After two years of exceptional gains tied to the recovery, we're moving toward more sustainable growth in pay and employment as the economic effects of the pandemic recede."
Also released, goods trade deficit widened to USD -91.2B in July, versus expectation of USD -90.0B. Q2 GDP growth was revised down to 2.1%.
Eurozone economic sentiment deteriorates across the board
Eurozone Economic Sentiment Indicator (ESI) witnessed a drop from 194.5 to 93.3 in August, casting a dark shadow over the economic outlook of the bloc. Nearly all sectoral confidence indicators fell, with industry confidence sliding from -9.3 to -10.3, services from 5.4 to 3.9, retail trade from -4.5 to -5.0, and construction from -3.6 to -5.2. Employment Expectations Indicator (EEI) also showed a decline from 103.4 to 102.1, while the Economic Uncertainty Indicator (EUI) dipped from 21.3 to 20.0.
Similarly, EU-wide ESI fell modestly from 93.5 to 92.9, and its EEI from 102.7 to 101.7. EUI also registered a decline from 20.7 to 19.7. Breaking down the ESI numbers by individual countries, sentiment deteriorated in France -by 2.5 points, in Germany by -2.4 points, and in Italy by -1.1 points. Conversely, sentiment improved in Spain by 1.5 points and in Poland by 1.2 points, while the sentiment in the Netherlands remained almost unchanged, up by just 0.2 points.
Swiss KOF falls to 91.1, signals sluggish economy ahead
Swiss KOF Economic Barometer, a leading indicator for the Swiss economy, declined from 92.1 to 91.1 in August, missing market expectation of 91.3. The barometer continues to hover below the average mark, signaling that Swiss economy is likely to face challenging conditions in the near term.
According to KOF, almost all sectoral indicators contributed to the lower reading except for construction and domestic consumption, which exhibited slight positive developments.
The most notable downturn in sentiment was observed in the services sector, affecting both real and financial services. This was closely followed by export-oriented businesses, as well as the hotel and restaurant industries.
Australian CPI eases more than expected to 4.9% in July
Australia's monthly CPI for July registered a deeper than expected slowdown, easing from 5.4% yoy to 4.9% yoy. Analysts had forecasted a milder decline to 5.2% yoy. The underlying inflation measures also indicated a deceleration. CPI excluding volatile items such as holiday travel came in at 5.8% yoy, down from 6.1% yoy. The trimmed mean CPI, which is often regarded as a more accurate reflection of inflationary pressures, slowed from 6.0% yoy to 5.6% yoy.
A closer look at the inflation contributors reveals a mixed picture. Housing costs remained a significant upward pressure, climbing 7.3% on an annual basis. Food and non-alcoholic beverages followed closely, rising by 5.6% yoy. However, this was offset by substantial price falls in other areas. Automotive fuel costs dropped by -7.6%, while fruit and vegetable prices declined by -5.4%, thus tempering the overall July increase.
The latest CPI data comes on the heels of yesterday's hawkish comments from incoming RBA Governor Michele Bullock, who emphasized that her first priority is still to maintain a focus on bringing inflation back down to target. Today's lower-than-expected inflation figures might lend some flexibility to RBA's policy approach, but with sectors like housing and food still exhibiting strong price pressures, the central bank's task appears far from straightforward.
BoJ's Tamura eyes next Q1 for decisive inflation data for policy shifts
BoJ board member Naoki Tamura offered insights into the timeline for potentially phasing out the central bank's ultra-accommodative stance. he signaled that by the first quarter of 2024, BoJ could gather sufficient data to evaluate whether the 2% inflation target could be sustainably achieved.
"It's appropriate at this stage to sustain monetary easing, and earnestly scrutinize wage and price developments," Tamura said, adding that he is hopeful for "further clarity" on the inflation target "around January through March next year" through wage and price data available by that time.
Tamura anticipates that Japan's inflation could slow down for the time being, only to moderately accelerate later. This coincides with his expectation of high wage growth in the next year's spring wage negotiations.
Tamura emphasized that the "biggest key to monetary policy outlook is whether Japan achieves a positive cycle of rising wages and inflation."
EUR/USD Mid-Day Outlook
Daily Pivots: (S1) 1.0810; (P) 1.0851; (R1) 1.0920; More...
Immediate focus is now on 1.0929 resistance in EUR/USD. Firm break there will argue that the corrective fall from 1.1274 has completed with three waves down to 1.0764. Further rally would then be seen to 1.1064 resistance for confirmation. Meanwhile, rejection by 1.0929 will retain near term bearishness. Break of 1.0764 will resume the decline to 1.0609/34 cluster support next.
In the bigger picture, fall from 1.1274 medium term top is seen as a correction to up trend from 0.9534 (2022 low). Deeper decline would be seen to 1.0634 cluster support (38.2% retracement of 0.9534 to 1.1274 at 1.0609). Strong support could be seen there, at least on first attempt, to bring rebound. Yet, medium term outlook will be neutral for now, as long as 1.1274 resistance holds.
Economic Indicators Update
| GMT | Ccy | Events | Actual | Forecast | Previous | Revised |
|---|---|---|---|---|---|---|
| 22:45 | NZD | Building Permits M/M Jul | -5.20% | 3.50% | 3.40% | |
| 01:30 | AUD | Monthly CPI Y/Y Jul | 4.90% | 5.20% | 5.40% | |
| 01:30 | AUD | Building Permits M/M Jul | -8.10% | -0.50% | -7.70% | -7.90% |
| 05:00 | JPY | Consumer Confidence Index Aug | 36.2 | 37.5 | 37.1 | |
| 06:00 | EUR | Germany Import Price Index M/M Jul | -0.60% | -0.20% | -1.60% | |
| 07:00 | CHF | KOF Economic Barometer Aug | 91.1 | 91.3 | 92.2 | 92.1 |
| 08:00 | CHF | Credit Suisse Economic Expectations Aug | -38.6 | -32.6 | ||
| 08:00 | EUR | Eurozone Economic Sentiment Indicator Aug | 93.3 | 93.9 | 94.5 | |
| 08:00 | EUR | Eurozone Industrial Confidence Aug | -10.3 | -9.8 | -9.4 | -9.3 |
| 08:00 | EUR | Eurozone Services Sentiment Aug | 3.9 | 4.2 | 5.7 | 5.4 |
| 08:00 | EUR | Eurozone Consumer Confidence Aug F | -16 | -16 | -16 | |
| 08:30 | GBP | Mortgage Approvals Jul | 49K | 52K | 55K | |
| 08:30 | GBP | M4 Money Supply M/M Jul | -0.50% | 0.10% | -0.10% | |
| 12:00 | EUR | Germany CPI M/M Aug P | 0.30% | 0.30% | 0.30% | |
| 12:00 | EUR | Germany CPI Y/Y Aug P | 6.10% | 6.00% | 6.20% | |
| 12:15 | USD | ADP Employment Change Aug | 177K | 205K | 324K | 371K |
| 12:30 | USD | GDP Annualized Q2 P | 2.10% | 2.40% | 2.40% | |
| 12:30 | USD | GDP Price Index Q2 P | 2.00% | 2.20% | 2.20% | |
| 12:30 | USD | Goods Trade Balance (USD) Jul P | -91.2B | -90.0B | -87.8B | |
| 12:30 | USD | Wholesale Inventories Jul P | -0.10% | 0.20% | -0.50% | |
| 14:00 | USD | Pending Home Sales M/M Jul | -0.40% | 0.30% | ||
| 14:30 | USD | Crude Oil Inventories | -2.2M | -6.1M |
US ADP jobs grew only 177k, wages growth slowed further
August's US ADP Private Employment report showed a lower-than-expected gain of 177k jobs, falling short of the consensus forecast of 205k. The data, which is often viewed as a precursor to the official non-farm payrolls report, painted a nuanced picture of the American labor market.
By sector, goods-producing sectors added 23k jobs, while service-providing sectors accounted for 154k new positions. By establishment size, small companies added 18k jobs, medium-sized companies contributed 79k, and large companies rounded out the additions with 83k.
Compounding the modest employment gains was a noticeable slowdown in wage growth. For those staying in their current roles, the year-over-year pay increase was 5.9%, marking the weakest growth since October 2021. Meanwhile, job changers experienced a deceleration in pay growth to 9.5%.
Nela Richardson, chief economist at ADP, provided context for these numbers. "This month's figures are consistent with the pace of job creation before the pandemic," she said. "After two years of exceptional gains tied to the recovery, we're moving toward more sustainable growth in pay and employment as the economic effects of the pandemic recede."
EUR/USD Starts Recovery, USD/CHF Dips Below Support
EUR/USD started a recovery wave above the 1.0830 resistance. USD/CHF is showing bearish signs below the 0.8830 resistance zone.
Important Takeaways for EUR/USD and USD/CHF Analysis Today
- The Euro gained pace after it broke the 1.0830 resistance against the US Dollar.
- There was a break above a key bearish trend line with resistance near 1.0800 on the hourly chart of EUR/USD at FXOpen.
- USD/CHF is consolidating losses below the 0.8810 resistance.
- There was a break below a contracting triangle with support near 0.8830 on the hourly chart at FXOpen.
EUR/USD Technical Analysis
On the hourly chart of EUR/USD at FXOpen, the pair started a recovery wave from the 1.0770 level. The Euro even cleared the 1.0800 barrier to move into a bullish zone against the US Dollar.
Besides, there was a break above a key bearish trend line with resistance near 1.0800. It opened the doors for a move above the 50-hour simple moving average and 1.0830. Finally, the pair tested the 1.0880 resistance.
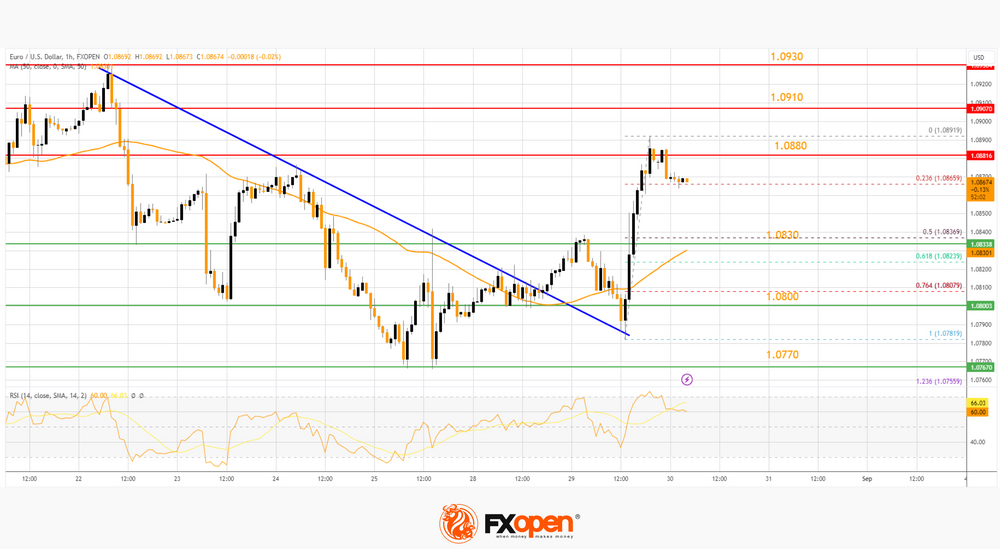
It is now consolidating gains near the 23.6% Fib retracement level of the upward wave from the 1.0781 swing low to the 1.0891 high.
Immediate support on the downside is near the 50% Fib retracement level of the upward wave from the 1.0781 swing low to the 1.0891 high at 1.0830 and the 50-hour simple moving average. The next major support is near 1.0800.
A downside break below the 1.0800 support could send the pair toward the 1.0770 level. Immediate resistance on the EUR/USD chart is near the 1.0880 zone. The first major resistance is near the 1.0910 level.
An upside break above the 1.0910 level might send the pair toward the 1.0950 resistance. The next major resistance is near the 1.1000 level. Any more gains might open the doors for a move toward the 1.1050 level.
USD/CHF Technical Analysis
On the hourly chart of USD/CHF at FXOpen, the pair started a fresh decline from the 0.8870 zone. The US Dollar gained bearish momentum from the 0.8858 level against the Swiss Franc.
During the decline, there was a break below a contracting triangle with support near 0.8830. The pair even declined below the 50-hour simple moving average and 0.8795. A low is formed near 0.8774 and the pair is now consolidating losses.
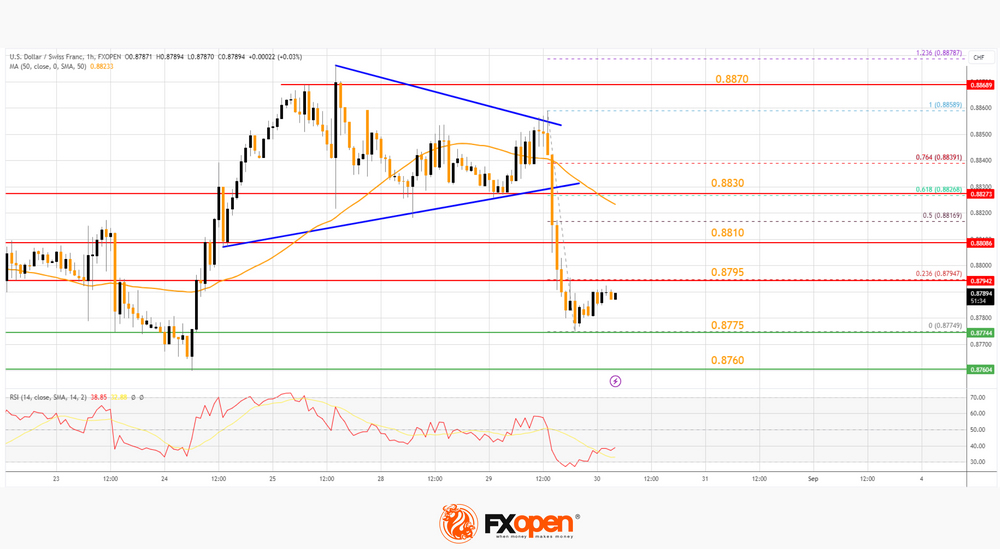
On the upside, the pair is now facing resistance near the 23.6% Fib retracement level of the downward move from the 0.8858 swing high to the 0.8774 low at 0.8795.
The next major resistance is near the 0.8810 level. The main resistance is forming near the 50-hour simple moving average and the 61.8% Fib retracement level of the downward move from the 0.8858 swing high to the 0.8774 low at 0.8830.
If there is a clear break above the 0.8830 resistance zone, the pair could start another increase. In the stated case, it could even surpass 0.8870.
On the downside, immediate support on the USD/CHF chart is near 0.8775. The first major support is near the 0.8760 level. The next major support is near the 0.8720 level. Any more losses may possibly open the doors for a move toward the 0.8650 level in the coming days.
This article represents the opinion of the Companies operating under the FXOpen brand only. It is not to be construed as an offer, solicitation, or recommendation with respect to products and services provided by the Companies operating under the FXOpen brand, nor is it to be considered financial advice.